Attached files
| file | filename |
|---|---|
| 8-K - FORM 8-K - AVNET INC | d660547d8k.htm |
| EX-99.1 - EX-99.1 - AVNET INC | d660547dex991.htm |
Exhibit 99.2
Avnet, Inc. Q2 Fiscal Year 2014
$ in millions - except per share data
January 23, 2014
CFO Review of Fiscal 2014 Second Quarter Results
| Q2’ FY13 | Q1’ FY14 | Q2’ FY14 | Y/Y Chg | Seq. Chg | ||||||||||||||||
| Sales |
$ | 6,699.5 | $ | 6,345.5 | $ | 7,421.9 | $ | 722.4 | $ | 1,076.4 | ||||||||||
| Gross Profit |
$ | 768.5 | $ | 735.2 | $ | 848.6 | $ | 80.2 | $ | 113.5 | ||||||||||
| GP Margin |
11.5 | % | 11.6 | % | 11.4 | % | (4 | ) bps | (16 | ) bps | ||||||||||
| SG&A Expenses |
$ | 548.0 | $ | 544.1 | $ | 598.6 | $ | 50.6 | $ | 54.5 | ||||||||||
| SG&A as % of Sales |
8.2 | % | 8.6 | % | 8.1 | % | (11 | ) bps | (50 | ) bps | ||||||||||
| SG&A as % of GP |
71.3 | % | 74.0 | % | 70.5 | % | (77 | ) bps | (347 | ) bps | ||||||||||
| GAAP Operating Income |
$ | 195.6 | $ | 179.0 | $ | 221.6 | $ | 26.0 | $ | 42.6 | ||||||||||
| Adjusted Operating Income (1) |
$ | 228.5 | $ | 199.5 | $ | 263.2 | $ | 34.7 | $ | 63.7 | ||||||||||
| Adjusted Operating Income Margin (1) |
3.4 | % | 3.1 | % | 3.6 | % | 14 | bps | 41 | bps | ||||||||||
| GAAP Net Income |
$ | 137.5 | $ | 120.6 | $ | 124.9 | $ | (12.6 | ) | $ | 4.2 | |||||||||
| Adjusted Net Income (1) |
$ | 145.6 | $ | 126.0 | $ | 163.9 | $ | 18.3 | $ | 37.9 | ||||||||||
| GAAP Diluted EPS |
$ | 0.99 | $ | 0.86 | $ | 0.89 | (10.1 | )% | 3.5 | % | ||||||||||
| Adjusted Diluted EPS (1) |
$ | 1.05 | $ | 0.90 | $ | 1.17 | 11.4 | % | 30.0 | % | ||||||||||
| Return on Working Capital (ROWC) (1) |
22.9 | % | 19.8 | % | 24.0 | % | 112 | bps | 420 | bps | ||||||||||
| Return on Capital Employed (ROCE) (1) |
12.3 | % | 10.4 | % | 12.8 | % | 53 | bps | 243 | bps | ||||||||||
| Working Capital Velocity (1) |
6.72 | 6.31 | 6.78 | 0.06 | 0.47 | |||||||||||||||
| (1) | A reconciliation of non-GAAP financial measures is presented in the Non-GAAP Financial Information section of the press release attached as Exhibit 99.1 included in this Current Report on Form 8-K. |
K e y H i g h l i g h t s
| • | Sales exceeded expectations at both operating groups in the second quarter of fiscal 2014, increasing 10.8% year over year to a record $7.4 billion; organic sales (defined later in this document) grew 8.2% year over year and 8.1% excluding the translation impact of changes in foreign currency exchange rates (also referred to as “constant dollars” or “constant currency” and referenced to as “CC” in the graphs that follow). |
| • | Sequentially, sales exceeded expectations and were above normal seasonality as reported sales increased 17.0% and organic sales increased 13.9% in constant dollars. |
| • | Adjusted operating income increased 15.2% year over year primarily due to a combination of higher sales and cost reduction initiatives implemented in fiscal 2013. Both operating groups contributed to this improvement. |
| • | Sequentially, Technology Solutions (TS) was the primary driver as operating income grew 92.1% and operating margin increased 108 basis points. |
| • | Adjusted diluted earnings per share of $1.17 increased 11.4% year over year, primarily due to the improvement in operating income, partially offset by a decrease in other income. |
| • | Avnet ROWC improved 112 basis points and ROCE was up 53 basis points year over year, primarily due to the improvement in operating income at both operating groups. |
| • | Cash used for operations was $28.0 million in the quarter as working capital increased approximately 9.8% sequentially primarily due to an increase in accounts receivables related to stronger than expected sales at the end of December at TS. Cash flow from operations for the trailing twelve months was $134.6 million and working capital velocity improved year over year and sequentially. |
| • | During the quarter, the Company paid a quarterly cash dividend of $0.15 per share or $20.6 million and has paid $41.3 million for the fiscal year to date. |
| Avnet, Inc. Q2 Fiscal Year 2014 | ||
| $ in millions - except per share data January 23, 2014 |
S a l e s
| Year-over-Year Growth Rates | ||||||||||||||||||||||||||||
| Q2’ FY13 | Q3’ FY13 | Q4’ FY13 | Q1’ FY14 | Q2’ FY14 | Reported | Organic (2) | ||||||||||||||||||||||
| Avnet, Inc. |
$ | 6,699.5 | $ | 6,298.7 | $ | 6,590.7 | $ | 6,345.5 | $ | 7,421.9 | 10.78 | % | 8.16 | % | ||||||||||||||
| Excluding FX (1) |
10.68 | % | 8.06 | % | ||||||||||||||||||||||||
| Electronics Marketing (EM) Total |
$ | 3,673.5 | $ | 3,797.2 | $ | 3,970.6 | $ | 3,938.1 | $ | 4,154.8 | 13.10 | % | 11.86 | % | ||||||||||||||
| Excluding FX (1) |
12.67 | % | 11.44 | % | ||||||||||||||||||||||||
| Americas |
$ | 1,264.9 | $ | 1,320.1 | $ | 1,391.0 | $ | 1,199.7 | $ | 1,204.4 | (4.78 | )% | 3.16 | % | ||||||||||||||
| EMEA |
$ | 914.3 | $ | 1,100.1 | $ | 1,123.2 | $ | 1,097.9 | $ | 1,217.0 | 33.10 | % | 18.04 | % | ||||||||||||||
| Excluding FX (1) |
27.37 | % | 12.96 | % | ||||||||||||||||||||||||
| Asia |
$ | 1,494.3 | $ | 1,377.0 | $ | 1,456.4 | $ | 1,640.5 | $ | 1,733.4 | 16.00 | % | 14.36 | % | ||||||||||||||
| Technology Solutions (TS) Total |
$ | 3,026.0 | $ | 2,501.5 | $ | 2,620.1 | $ | 2,407.4 | $ | 3,267.1 | 7.97 | % | 3.79 | % | ||||||||||||||
| Excluding FX (1) |
8.27 | % | 4.08 | % | ||||||||||||||||||||||||
| Americas |
$ | 1,598.3 | $ | 1,300.1 | $ | 1,389.8 | $ | 1,288.9 | $ | 1,859.2 | 16.32 | % | 8.01 | % | ||||||||||||||
| EMEA |
$ | 963.8 | $ | 783.0 | $ | 799.6 | $ | 694.3 | $ | 936.0 | (2.89 | )% | (2.89 | )% | ||||||||||||||
| Excluding FX (1) |
(5.84 | )% | (5.84 | )% | ||||||||||||||||||||||||
| Asia |
$ | 463.9 | $ | 418.4 | $ | 430.7 | $ | 424.2 | $ | 471.9 | 1.74 | % | 2.04 | % | ||||||||||||||
| (1) | Year-over-year sales growth rate excluding the impact of changes in foreign currency exchange rates. |
| (2) | Organic sales as defined in this document. |
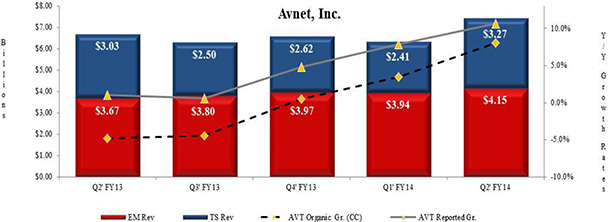
| • | Avnet, Inc. quarterly reported sales of $7.4 billion increased 10.8% year over year (10.7% in constant dollars) with both operating groups contributing towards this growth. |
| • | Year-over-year organic sales increased 8.2% (8.1% in constant dollars), which represents the third consecutive quarter of improving organic growth. |
| • | On a sequential basis, organic sales increased 13.9% in constant dollars, as both operating groups delivered results above expectations and normal seasonality. The normal seasonal range for the December quarter is +8% to +12%. |
| Avnet, Inc. Q2 Fiscal Year 2014 | ||
| $ in millions - except per share data January 23, 2014 |
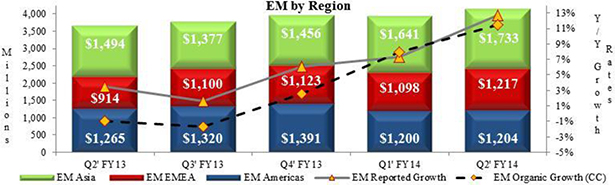
| • | EM’s quarterly reported sales of $4.2 billion exceeded the high end of expectations driven by better than expected sales in the high volume fulfillment business in Asia. Reported sales increased 13.1% year over year (12.7% in constant dollars) and organic sales grew 11.9% (11.4% in constant dollars) with both the EMEA and Asia regions reporting double digit growth. |
| • | EM’s organic sales grew 1.6% sequentially in constant dollars, above the normal seasonal range of -3% to 0%. |
| • | Americas’ organic sales increased 3.2% year over year and 0.4% sequentially. |
| • | EMEA’s organic sales increased 13.0% year over year and decreased 2.7% sequentially in constant dollars. |
| • | Asia’s organic sales increased 14.4% year over year and 5.7% sequentially. This represents the sixth consecutive quarter of year-over-year organic growth. |
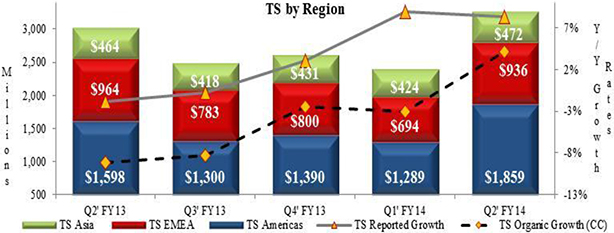
| • | TS’ reported sales increased 8.0% year over year (8.3% in constant dollars) to $3.3 billion, primarily due to the strength in the Americas region; organic sales increased 3.8% and 4.1% in constant dollars; the first positive organic growth in eight quarters. |
| • | TS’ organic sales increased 34.6% sequentially in constant dollars, which exceeded the high end of expectations and normal seasonality of +20% to +26%. |
| • | Americas’ organic sales increased 8.0% year over year and 44.2% sequentially. |
| • | EMEA’s organic sales decreased 5.8% year over year in constant dollars and increased 30.6% sequentially. |
| • | Asia’s organic sales increased 2.0% year over year and 11.3% sequentially. |
| • | At a product level, software, storage and services grew over 30% sequentially while software and storage drove the year over year growth. |
| Avnet, Inc. Q2 Fiscal Year 2014 | ||
| $ in millions - except per share data January 23, 2014 |
G r o s s P r o f i t
| Q2’ FY13 | Q3’ FY13 | Q4’ FY13 | Q1’ FY14 | Q2’ FY14 | Y/Y Change | |||||||||||||||||||
| Gross Profit |
$ | 768.5 | $ | 756.0 | $ | 770.9 | $ | 735.2 | $ | 848.6 | $ | 80.2 | ||||||||||||
| Gross Profit Margin |
11.47 | % | 12.00 | % | 11.70 | % | 11.59 | % | 11.43 | % | (4 | ) bps | ||||||||||||
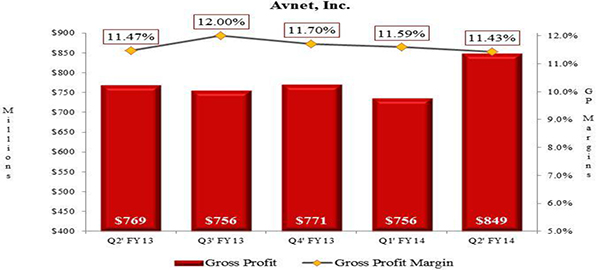
| • | Gross profit was $848.6 million, up 10.4% year over year and 15.4% sequentially. |
| • | Gross profit margin of 11.4% was essentially flat with the year ago quarter and declined 16 basis points sequentially due to the business mix shift as the lower gross profit margin TS business grew to represent 44% of the enterprise as compared to 38% in the first fiscal quarter. |
| • | EM gross profit margin was essentially flat with the year ago quarter and improved 26 basis points sequentially. The sequential improvement was primarily driven by the acquisition of MSC, which has higher gross profit margins, partially offset by a higher percent of lower gross profit margin fulfillment business in the Asia region. |
| • | TS gross profit margin declined 18 basis points year over year and 34 basis points sequentially. The sequential decline was primarily driven by the Americas and Asia regions. |
| Avnet, Inc. Q2 Fiscal Year 2014 | ||
| $ in millions - except per share data January 23, 2014 |
O p e r a t i n g E x p e n s e s
| Q2’ FY13 | Q3’ FY13 | Q4’ FY13 | Q1’ FY14 | Q2’ FY14 | Y/Y Change | |||||||||||||||||||
| Selling, General and Administrative Expenses |
$ | 548.0 | $ | 561.1 | $ | 548.3 | $ | 544.1 | $ | 598.6 | $ | 50.6 | ||||||||||||
| SG&A Expenses as a % of Gross Profit |
71.3 | % | 74.2 | % | 71.1 | % | 74.0 | % | 70.5 | % | (77 | ) bps | ||||||||||||
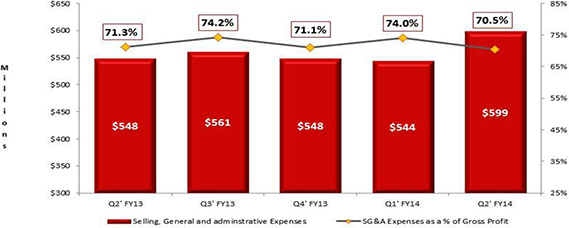
| • | Selling, general and administrative expenses (“SG&A expenses”) increased approximately 9.2% year over year to $598.6 million. |
| • | The year-over-year increase consisted primarily of a net increase of approximately $41 million related to operating expenses from acquired businesses, and an increase of approximately $3 million related to the translation impact of changes in foreign currency exchange rates between the periods. |
| • | SG&A expenses, excluding amortization of acquired intangibles, as a percentage of gross profit decreased 129 basis points to 69.0% from the year ago quarter. |
| • | EM SG&A expenses, excluding amortization of acquired intangibles, as a percent of gross profit decreased 192 basis points from the year ago quarter reflecting improved operating leverage from recent restructuring actions and increased gross profit. |
| • | TS SG&A expenses, excluding amortization of acquired intangibles, as a percent of gross profit decreased 10 basis points from the year ago quarter and decreased 1,220 basis points sequentially due to strong growth in sales and the corresponding gross profits dollars. |
| Avnet, Inc. Q2 Fiscal Year 2014 | ||
| $ in millions - except per share data January 23, 2014 |
O p e r a t i n g I n c o m e
| Q2’ FY13 | Q3’ FY13 | Q4’ FY13 | Q1’ FY14 | Q2’ FY14 | Y/Y Chg | |||||||||||||||||||
| Avnet, Inc. GAAP Operating Income |
$ | 195.6 | $ | 167.6 | $ | 162.8 | $ | 179.0 | $ | 221.6 | $ | 26.0 | ||||||||||||
| Adjusted Operating Income (1) |
$ | 228.5 | $ | 203.7 | $ | 231.2 | $ | 199.5 | $ | 263.2 | $ | 34.7 | ||||||||||||
| Adjusted Operating Income Margin (1) |
3.41 | % | 3.23 | % | 3.51 | % | 3.14 | % | 3.55 | % | 14 | bps | ||||||||||||
| Electronics Marketing (EM) Total |
||||||||||||||||||||||||
| Operating Income |
$ | 143.0 | $ | 165.0 | $ | 178.5 | $ | 175.8 | $ | 171.7 | $ | 28.7 | ||||||||||||
| Operating Income Margin |
3.89 | % | 4.35 | % | 4.49 | % | 4.46 | % | 4.13 | % | 24 | bps | ||||||||||||
| Technology Solutions (TS) Total |
||||||||||||||||||||||||
| Operating Income |
$ | 113.1 | $ | 68.6 | $ | 78.7 | $ | 62.6 | $ | 120.2 | $ | 7.1 | ||||||||||||
| Operating Income Margin |
3.74 | % | 2.74 | % | 3.01 | % | 2.60 | % | 3.68 | % | (6 | ) bps | ||||||||||||
| (1) | A reconciliation of non-GAAP financial measures is presented in the Non-GAAP Financial Information section of the press release attached as Exhibit 99.1 included in this Current Report on Form 8-K. |
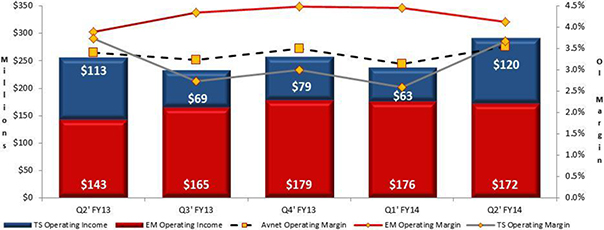
| • | Avnet adjusted operating income of $263.2 million increased 15.2% year over year with both operating groups contributing to the improvement; sequentially adjusted operating income increased 31.9% primarily due to the strong sales growth at TS. |
| • | Adjusted operating income margin of 3.6% at the Avnet level increased 14 basis points year over year and 41 basis points sequentially. |
| • | EM operating income margin increased 24 basis points from the year ago quarter to 4.1% primarily due to the increase in gross profit and from recent cost reduction initiatives, which were partially offset by increases in operating expenses related to the acquisition of MSC. Operating income margin declined 33 basis points sequentially, primarily due to a higher percent of lower margin fulfillment business in the Asia region and the impact of the MSC acquisition in EMEA where the Company has yet to fully realize the expected synergies. |
| • | TS operating income margin was essentially flat from the year ago quarter and increased 108 basis points sequentially primarily due to the improved profitability related to the strong sales growth in the western regions. |
| Avnet, Inc. Q2 Fiscal Year 2014 | ||
| $ in millions - except per share data January 23, 2014 |
I n t e r e s t E x p e n s e , O t h e r I n c o m e a n d I n c o m e T a x e s
| Q2’ FY13 | Q3’ FY13 | Q4’ FY13 | Q1’ FY14 | Q2’ FY14 | Y/Y Change | |||||||||||||||||||
| Interest Expense |
$ | (27.8 | ) | $ | (27.3 | ) | $ | (28.6 | ) | $ | (27.0 | ) | $ | (28.2 | ) | $ | (0.4 | ) | ||||||
| Other Income (Expense) |
$ | 1.1 | $ | 4.1 | $ | (6.7 | ) | $ | 0.8 | $ | (4.8 | ) | $ | (5.9 | ) | |||||||||
| GAAP Income Taxes |
$ | 31.4 | $ | 58.2 | $ | 1.0 | $ | 51.3 | $ | 63.7 | $ | 32.3 | ||||||||||||
| Adjusted Income Taxes (1) |
$ | 56.2 | $ | 49.0 | $ | 54.0 | $ | 47.3 | $ | 66.3 | $ | 10.1 | ||||||||||||
| GAAP Effective Tax Rate |
18.60 | % | 40.30 | % | 0.82 | % | 29.85 | % | 33.78 | % | 1518 | bps | ||||||||||||
| Adjusted Effective Tax Rate (1) |
27.84 | % | 27.15 | % | 27.59 | % | 27.30 | % | 28.80 | % | 96 | bps | ||||||||||||
| (1) | A reconciliation of non-GAAP financial measures is presented in the Non-GAAP Financial Information section of the press release attached as Exhibit 99.1 included in this Current Report on Form 8-K. |
| • | Interest expense was $28.2 million, up $0.4 million from the year ago period. The increase in interest expense was primarily due to the issuance in November 2012 of $350 million of 4.875% Senior Notes due December 1, 2022, partially offset by lower average borrowings under the 2012 Credit Facility and the accounts receivable securitization program between the periods. |
| • | The Company reported $4.8 million of other expense during the second fiscal quarter, which was primarily related to foreign exchange losses. |
| • | The GAAP effective tax rate was 33.8% in the second quarter of fiscal 2014 as compared with 18.6% in the second quarter of fiscal 2013. During the second quarter of fiscal 2014, the Company’s effective tax rate was negatively impacted primarily by increases to valuation allowances, reserves, an investment in a foreign subsidiary, and to a lesser extent, by the mix of income earned in the higher tax rate jurisdictions. During the second quarter of fiscal 2013, the Company’s effective tax rate was favorably impacted primarily by the settlement of an audit by the U.S. Internal Revenue Services for an acquired company and the recognition of a U.S. tax benefit on the closure of a foreign operation. |
| Avnet, Inc. Q2 Fiscal Year 2014 | ||
| $ in millions - except per share data January 23, 2014 |
N e t I n c o m e a n d E P S
| Q2’ FY13 | Q3’ FY13 | Q4’ FY13 | Q1’ FY14 | Q2’ FY14 | Y/Y Change | |||||||||||||||||||
| GAAP Net Income |
$ | 137.5 | $ | 86.2 | $ | 126.1 | $ | 120.6 | $ | 124.9 | $ | (12.6 | ) | |||||||||||
| Adjusted Net Income (1) |
$ | 145.6 | $ | 131.5 | $ | 141.8 | $ | 126.0 | $ | 163.9 | $ | 18.3 | ||||||||||||
| GAAP Diluted EPS |
$ | 0.99 | $ | 0.62 | $ | 0.91 | $ | 0.86 | $ | 0.89 | (10.1 | )% | ||||||||||||
| Adjusted Diluted EPS (1) |
$ | 1.05 | $ | 0.95 | $ | 1.02 | $ | 0.90 | $ | 1.17 | 11.4 | % | ||||||||||||
| (1) | A reconciliation of non-GAAP financial measures is presented in the Non-GAAP Financial Information section of the press release attached as Exhibit 99.1 included in this Current Report on Form 8-K. |
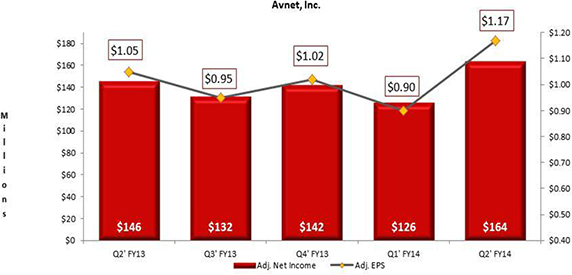
| • | GAAP net income decreased by $12.6 million year over year to $124.9 million or $0.89 per share on a diluted basis, and increased 3.5% sequentially primarily due to the improvement in profitability discussed above offset somewhat by the impact of restructuring, integration and other charges and intangibles amortization expense. |
| • | Adjusted net income for the second quarter of fiscal 2014 was $163.9 million, or $1.17 per share on a diluted basis. |
| • | On an adjusted basis, net income and diluted earnings per share increased from the year ago quarter by 12.6% and 11.4%, respectively, primarily due to higher profitability at both operating groups. |
| • | Adjusted diluted earnings per share of $1.17 increased $0.27 or 30.0% sequentially primarily due to the improvement in profitability at TS. |
| Avnet, Inc. Q2 Fiscal Year 2014 | ||
| $ in millions - except per share data January 23, 2014 |
W o r k i n g C a p i t a l
| Q2’ FY13 | Q3’ FY13 | Q4’ FY13 | Q1’ FY14 | Q2’ FY14 | Y/Y Change | |||||||||||||||||||
| Accounts Receivable |
$ | 5,161.5 | $ | 4,778.1 | $ | 4,869.0 | $ | 4,820.1 | $ | 5,708.3 | $ | 546.9 | ||||||||||||
| Inventory |
$ | 2,223.8 | $ | 2,284.7 | $ | 2,264.3 | $ | 2,510.8 | $ | 2,549.3 | $ | 325.5 | ||||||||||||
| Accounts Payable |
$ | (3,565.4 | ) | $ | (3,175.5 | ) | $ | (3,278.1 | ) | $ | (3,184.1 | ) | $ | (3,704.5 | ) | $ | (139.2 | ) | ||||||
|
|
|
|
|
|
|
|
|
|
|
|
|
|||||||||||||
| Working Capital |
$ | 3,819.9 | $ | 3,887.3 | $ | 3,855.2 | $ | 4,146.8 | $ | 4,553.1 | $ | 733.2 | ||||||||||||
|
|
|
|
|
|
|
|
|
|
|
|
|
|||||||||||||
| Working Capital Velocity |
6.72 | 6.46 | 6.80 | 6.31 | 6.78 | 0.06 | ||||||||||||||||||
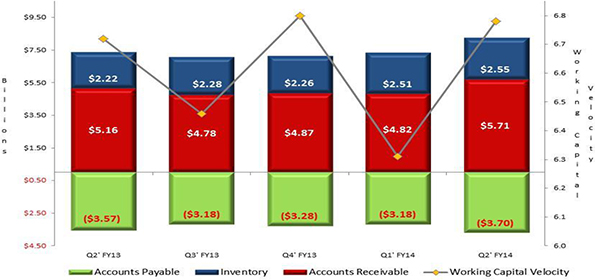
| • | Working capital velocity increased 0.47 turns sequentially, primarily due to above seasonal sales growth at both operating groups and was essentially flat with the year ago quarter. |
| • | Working capital (accounts receivable plus inventory less accounts payable) increased $733.2 million, or 19.2%, year over year and 16.6% when adjusted for acquisitions and the translation impact of changes in foreign currency exchange rates. The increase is related to the year over year growth in sales at both operating groups as well as the stronger than anticipated growth in receivables at TS at the end of December and a decrease in payables at EM related to a decline in inventory. |
| • | On a sequential basis, working capital increased $406.3 million or 9.8% and 7.8% when adjusted for acquisitions and currency, primarily due to the $888.3 million increase in accounts receivable. TS represented over 90% of the growth in accounts receivable including approximately half of the growth being driven by the TS Americas region, primarily due to the stronger than anticipated close at the end of the December quarter. |
| • | Inventory increased $325.5 million or 14.6% year over year and 8.9% when adjusted for acquisitions and the translation impact of changes in foreign currency exchange rates and is in-line with the organic year over year growth in sales of 8.1% in constant dollars. |
| • | On a sequential basis, inventory increased $38.5 million or 1.5% and decreased 2.4% after adjusting for acquisitions and the translation impact of changes in foreign currency exchange rates. The sequential organic decrease in inventory was primarily due to a 4.9% decrease at EM where all three regions reduced inventory sequentially. |
| Avnet, Inc. Q2 Fiscal Year 2014 | ||
| $ in millions - except per share data January 23, 2014 |
R e t u r n s
| Q2’ FY13 | Q3’ FY13 | Q4’ FY13 | Q1’ FY14 | Q2’ FY14 | Y/Y Change | |||||||||||||||||||
| Return on Working Capital (ROWC) (1) |
22.92 | % | 20.88 | % | 23.85 | % | 19.84 | % | 24.04 | % | 112 | bps | ||||||||||||
| Return on Capital Employed (ROCE) (1) |
12.26 | % | 10.99 | % | 12.52 | % | 10.36 | % | 12.79 | % | 53 | bps | ||||||||||||
| (1) | A reconciliation of non-GAAP financial measures is presented in the Non-GAAP Financial Information section of the press release attached as Exhibit 99.1 included in this Current Report on Form 8-K. |
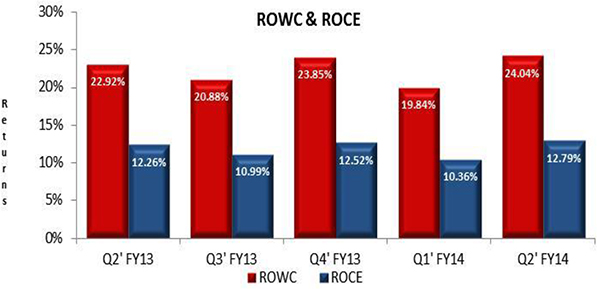
| • | ROWC for the second quarter of fiscal 2014 was 24.0%, an increase of 112 basis points year over year and an increase of 420 basis points sequentially. |
| • | The year-over-year and sequential increase were primarily due to the increase in operating income noted above. |
| • | ROCE of 12.8% was up 53 basis points from the year ago quarter and 243 basis points sequentially. |
| Avnet, Inc. Q2 Fiscal Year 2014 | ||
| $ in millions - except per share data January 23, 2014 |
C a s h F l o w
| Q2’ FY13 | Q3’ FY13 | Q4’ FY13 | Q1’ FY14 | Q2’ FY14 | Y/Y Change | |||||||||||||||||||
| Net Income |
$ | 137.5 | $ | 86.2 | $ | 126.1 | $ | 120.6 | $ | 124.9 | $ | (12.6 | ) | |||||||||||
| Non-Cash Items |
$ | 57.6 | $ | 75.0 | $ | 38.1 | $ | 81.4 | $ | 76.7 | $ | 19.1 | ||||||||||||
| Working Capital and Other |
$ | 131.3 | $ | (139.2 | ) | $ | 102.6 | $ | (328.2 | ) | $ | (229.6 | ) | $ | (360.9 | ) | ||||||||
|
|
|
|
|
|
|
|
|
|
|
|
|
|||||||||||||
| Cash Flow from Operations |
$ | 326.4 | $ | 22.0 | $ | 266.8 | $ | (126.2 | ) | $ | (28.0 | ) | $ | (354.4 | ) | |||||||||
|
|
|
|
|
|
|
|
|
|
|
|
|
|||||||||||||
| TTM CF from Operations |
$ | 690.3 | $ | 688.7 | $ | 696.2 | $ | 489.0 | $ | 134.6 | $ | (555.7 | ) | |||||||||||
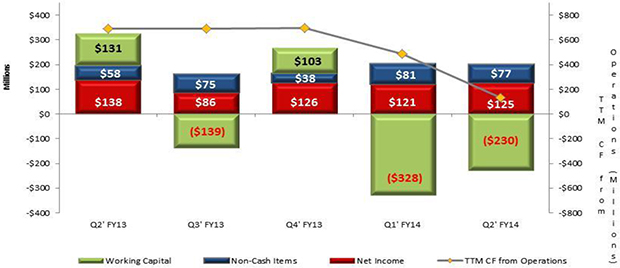
| • | During the second quarter of fiscal 2014, cash flow used for operations was $28.0 million and over the trailing twelve months cash flow generated from operations was $134.6 million. The use of cash was primarily driven by an increase in working capital as the stronger than expected close at the end of the December quarter at TS drove a significant increase in accounts receivables. |
| • | The Company did not purchase any shares under the $750 million share repurchase program during the quarter. As of the end of the quarter, the Company had approximately $225 million remaining in the program. |
| • | During the quarter, the Company paid a dividend of $0.15 per share or $20.6 million in total and $41.3 million fiscal year to date. |
| • | Cash and cash equivalents at the end of the quarter were $779.3 million, of which $677.9 million was held outside the United States; net debt (total debt less cash and cash equivalents) was approximately $1.4 billion. |
| Avnet, Inc. Q2 Fiscal Year 2014 | ||
| $ in millions - except per share data January 23, 2014 |
Forward-Looking Statements
This document contains certain “forward-looking statements” within the meaning of Section 27A of the Securities Act of 1933, as amended, and Section 21E of the Securities Exchange Act of 1934, as amended. These statements are based on management’s current expectations and are subject to uncertainty and changes in facts and circumstances. The forward-looking statements herein include statements addressing future financial and operating results of Avnet and may include words such as “will,” “anticipate,” “estimate,” “forecast,” “expect,” “believe,” and “should,” and other words and terms of similar meaning in connection with any discussions of future operating or financial performance, business prospects or market conditions. Actual results may vary materially from the expectations contained in the forward-looking statements.
The following factors, among others, could cause actual results to differ materially from those described in the forward-looking statements: the Company’s ability to retain and grow market share and to generate additional cash flow, risks associated with any acquisition activities and the successful integration of acquired companies, declines in sales, changes in business conditions and the economy in general, changes in market demand and pricing pressures, any material changes in the allocation of product or product rebates by suppliers, and other competitive and/or regulatory factors affecting the businesses of Avnet generally.
More detailed information about these and other factors is set forth in Avnet’s filings with the Securities and Exchange Commission, including the Company’s reports on Form 10-K, Form 10-Q and Form 8-K. Except as required by law, Avnet is under no obligation to update any forward-looking statements, whether as a result of new information, future events or otherwise.
Organic Sales
Organic sales is defined as reported sales adjusted for (i) the impact of acquisitions and divestitures by adjusting Avnet’s prior periods to include the sales of acquired businesses and exclude the sales of divested businesses as if the acquisitions and divestitures had occurred at the beginning of the earliest period presented and (ii) the impact of the transfer of a portion of certain operations between the EM and TS operating groups, which did not have an impact to Avnet on a consolidated basis but did impact the organic sales for the TS and EM operating groups. Sales taking into account the combination of these adjustments are referred to as “organic sales.”
Non-GAAP Financial Information
In addition to disclosing financial results that are determined in accordance with generally accepted accounting principles in the United States (“GAAP”), the Company also discloses in this document certain non-GAAP financial information including adjusted operating income, adjusted net income and adjusted diluted earnings per share, as well as sales adjusted for the impact of acquisitions and other items (as defined in the Organic Sales section of this document). Management believes organic sales is a useful measure for evaluating current period performance as compared with prior periods and for understanding underlying trends.
Management believes that operating income adjusted for (i) restructuring, integration and other expenses, and (ii) amortization of acquired intangible assets and other, is a useful measure to help investors better assess and understand the Company’s operating performance, especially when comparing results with previous periods or forecasting performance for future periods, primarily because management views the excluded items to be outside of Avnet’s normal operating results or non-cash in nature. Management analyzes operating income without the impact of these items as an indicator of ongoing margin performance and underlying trends in the business. Management also uses these non-GAAP measures to establish operational goals and, in some cases, for measuring performance for compensation purposes.
Management believes net income and diluted EPS adjusted for (i) the impact of the items described above, (ii) certain items impacting income tax expense and (iii) the gain on legal settlement, bargain purchase and other is useful to investors because it provides a measure of the Company’s net profitability on a more comparable basis to historical periods and provides a more meaningful basis for forecasting future performance. Additionally, because of management’s focus on generating shareholder value, of which net profitability is a primary driver, management believes net income and diluted EPS excluding the impact of these items provides an important measure of the Company’s net results of operations for the investing public.
Other metrics management monitors in its assessment of business performance include return on working capital (ROWC), return on capital employed (ROCE) and working capital velocity (WC velocity).
| • | ROWC is defined as annualized adjusted operating income (as defined above) divided by the sum of the monthly average balances of receivables and inventory less accounts payable. |
| • | ROCE is defined as annualized, tax effected adjusted operating income (as defined above) divided by the monthly average balances of interest-bearing debt and equity (including the impact of adjustments to operating income discussed above) less cash and cash equivalents. |
| Avnet, Inc. Q2 Fiscal Year 2014 | ||
| $ in millions - except per share data January 23, 2014 |
| • | WC velocity is defined as annualized sales divided by the sum of the monthly average balances of receivable and inventory less accounts payable. |
Any analysis of results and outlook on a non-GAAP basis should be used as a complement to, and in conjunction with, results presented in accordance with GAAP. A reconciliation of the non-GAAP financial measures to the GAAP financial measures is included in the Company’s press release dated January 23, 2014.