Attached files
| file | filename |
|---|---|
| EX-21.1 - EX-21.1 - Prestige Cruises International, Inc. | d619102dex211.htm |
| EX-23.1 - EX-23.1 - Prestige Cruises International, Inc. | d619102dex231.htm |
Table of Contents
As filed with the Securities and Exchange Commission on January 22, 2014
Registration Statement No. 333-
UNITED STATES
SECURITIES AND EXCHANGE COMMISSION
Washington, D.C. 20549
FORM S-1
REGISTRATION STATEMENT
UNDER
THE SECURITIES ACT OF 1933
Prestige Cruises International, Inc.
(Exact name of registrant as specified in its charter)
| Republic of Panama | 4400 | 98-0622952 | ||
| (State or other jurisdiction of incorporation or organization) |
(Primary Standard Industrial Classification Code Number) |
(I.R.S. Employer Identification Number) |
8300 NW 33rd Street, Suite 100
Miami, Florida 33122
(305) 514-2300
(Address, including zip code, and telephone number, including area code, of registrant’s principal executive offices)
Jill Guidicy
General Counsel
Prestige Cruises International, Inc.
8300 NW 33rd Street, Suite 100 Miami, Florida 33122
Phone: (305) 514-2300
(Name, address, including zip code, and telephone number, including area code, of agent for service)
Copy to:
David S. Huntington, Esq.
Tracey A. Zaccone, Esq.
Paul, Weiss, Rifkind, Wharton & Garrison LLP
1285 Avenue of the Americas
New York, New York 10019-6064
(212) 373-3000
Approximate date of commencement of proposed sale to the public: As soon as practicable after the effective date of this Registration Statement.
If any of the securities being registered on this Form are to be offered on a delayed or continuous basis pursuant to Rule 415 under the Securities Act of 1933 check the following box: ¨
If this Form is filed to register additional securities for an offering pursuant to Rule 462(b) under the Securities Act, please check the following box and list the Securities Act registration statement number of the earlier effective registration statement for the same offering. ¨
If this Form is a post-effective amendment filed pursuant to Rule 462(c) under the Securities Act, check the following box and list the Securities Act registration statement number of the earlier effective registration statement for the same offering. ¨
If this Form is a post-effective amendment filed pursuant to Rule 462(d) under the Securities Act, check the following box and list the Securities Act registration statement number of the earlier effective registration statement for the same offering. ¨
Indicate by check mark whether the registrant is a large accelerated filer, an accelerated filer, a non-accelerated filer, or a smaller reporting company. See the definitions of “large accelerated filer,” “accelerated filer” and “smaller reporting company” in Rule 12b2 of the Exchange Act.
| Large accelerated filer | ¨ | Accelerated filer | ¨ | |||
| Non-accelerated filer | x (Do not check if a smaller reporting company) | Smaller reporting company | ¨ | |||
CALCULATION OF REGISTRATION FEE
|
| ||||
| Title of Each Class of Securities to be Registered |
Proposed Offering Price (1)(2) |
Amount of Registration Fee | ||
| Ordinary shares, par value $.01 per share |
$250,000,000 | $32,200 | ||
|
| ||||
|
| ||||
| (1) | Includes shares that the underwriters have the option to purchase to cover over-allotments, if any. |
| (2) | Estimated solely for the purposes of computing the registration fee in accordance with Rule 457 under the Securities Act of 1933, as amended. |
The registrant hereby amends this registration statement on such date or dates as may be necessary to delay its effective date until the registrant shall file a further amendment which specifically states that this registration statement shall thereafter become effective in accordance with Section 8(a) of the Securities Act of 1933, as amended, or until this registration statement shall become effective on such date as the Securities and Exchange Commission, acting pursuant to said Section 8(a), may determine.
Table of Contents
The information in this preliminary prospectus is not complete and may be changed. We may not sell these securities until the registration statement filed with the Securities and Exchange Commission is effective. This preliminary prospectus is not an offer to sell these securities, and we are not soliciting an offer to buy these securities in any jurisdiction where the offer or sale is not permitted.
Subject to Completion, dated January 22, 2014

Prestige Cruises International, Inc.
Ordinary Shares
This is the initial public offering of ordinary shares, par value $0.01 per share, of Prestige Cruises International, Inc. We are offering ordinary shares.
Prior to this offering, there has been no public market for our ordinary shares. We expect the initial public offering price will be between $ and $ per share. We expect to apply for listing of our ordinary shares on the under the symbol “ .”
We have granted the underwriters an option for a period of 30 days to purchase from us an aggregate of up to additional ordinary shares to cover over-allotments, if any.
Investing in our ordinary shares involves a high degree of risk. See “Risk Factors” beginning on page 19 to read about certain factors you should consider before buying our ordinary shares.
Neither the Securities and Exchange Commission nor any state securities commission has approved or disapproved of these securities or passed on the adequacy or accuracy of this prospectus. Any representation to the contrary is a criminal offense.
| Per Share | Total | |||||||
| Initial public offering price |
$ | $ | ||||||
| Underwriting discounts and commissions |
$ | $ | ||||||
| Proceeds to us before expenses |
$ | $ | ||||||
The underwriters expect to deliver the shares on or about , 2014.
Prospectus dated , 2014.
Table of Contents
| Page | ||||
| 1 | ||||
| 19 | ||||
| 35 | ||||
| 36 | ||||
| 37 | ||||
| 38 | ||||
| 40 | ||||
| 42 | ||||
| Management’s Discussion and Analysis of Financial Condition and Results of Operations |
46 | |||
| 65 | ||||
| 86 | ||||
| 91 | ||||
| 108 | ||||
| 110 | ||||
| 112 | ||||
| 114 | ||||
| 120 | ||||
| 125 | ||||
| 126 | ||||
| 129 | ||||
| 130 | ||||
| 135 | ||||
| 135 | ||||
| 135 | ||||
| F-1 | ||||
Neither we nor the underwriters have authorized anyone to provide you with different or additional information other than that contained in this prospectus, any amendment or supplement to this prospectus or any free writing prospectus prepared by us or on our behalf. Neither we nor the underwriters take any responsibility for, nor can provide any assurance as to the reliability of, any information other than the information in this prospectus, any amendment or supplement to this prospectus or any free writing prospectus prepared by us or on our behalf. We and the underwriters are offering to sell, and seeking offers to buy, our ordinary shares only in jurisdictions where offers and sales are permitted. The information in this prospectus is accurate only as of the date of this prospectus or such other date stated in this prospectus, regardless of the time of delivery of this prospectus or any sale of our ordinary shares, and our business, financial condition, results of operations and/or prospects may have changed since those dates.
Until , 2014 (the 25th day after the date of this prospectus), all dealers that effect transactions in these securities, whether or not participating in this offering, may be required to deliver a prospectus. This is in addition to a dealer’s obligations to deliver a prospectus when acting as an underwriter and with respect to an unsold allotment or subscription.
i
Table of Contents
TERMS USED IN THIS PROSPECTUS
Unless otherwise indicated by the context, references in this prospectus to (i) the “Company,” “we,” “our,” “us,” “PCI” and “Prestige” refer to Prestige Cruises International, Inc., a Panamanian corporation, together with its consolidated subsidiaries. Prestige Cruises International, Inc. is the parent of Prestige Cruise Holdings, Inc. (“PCH”), which in turn is the parent of Oceania Cruises, Inc. (“Oceania”) and the parent of Seven Seas Cruises S. DE R.L. (“Regent”).
Unless otherwise indicated, the following terms have the meanings set forth below:
| • | Adjusted EBITDA refers to EBITDA as adjusted and described in footnote 10 in “Prospectus Summary—Summary Consolidated Financial Information” and “Management’s Discussion and Analysis of Financial Condition and Results of Operations—Key Operational and Financial Metrics, including Non-GAAP Measures;” |
| • | Adjusted EBITDA Margin refers to Adjusted EBITDA as a percentage of total revenue; |
| • | APCD or Available Passenger Cruise Days refers to a measurement of capacity and represents double occupancy per cabin multiplied by the number of cruise days for the period. See footnote 9 in “Prospectus Summary—Summary Consolidated Financial Information” and “Management’s Discussion and Analysis of Financial Condition and Results of Operations—Key Operational and Financial Metrics, including Non-GAAP Measures;” |
| • | Apollo or our sponsor refers collectively to Apollo Global Management, LLC and its affiliates and/or affiliated funds; |
| • | Berths refers to double occupancy capacity per suite, in accordance with cruise industry practice, even though many suites can accommodate three or more passengers; |
| • | CAGR refers to compound annual growth rate; |
| • | Charter refers to the hire of a ship for a specified period of time; |
| • | CLIA refers to Cruise Lines International Association, Inc. a marketing and training organization formed in 1975 to promote cruising. CLIA North America is composed of 26 cruise lines. CLIA’s website can be found at www.cruising.org; |
| • | Drydock refers to a dock that can be kept dry for use during the inspection or repairing of ships, and also refers to the scheduled or unscheduled removal of a vessel from regular service for maintenance or inspection in a drydock; |
| • | EBITDA refers to net income (loss) excluding depreciation and amortization, net interest expense and income tax benefit (expense). See footnote 10 in “Prospectus Summary—Summary Consolidated Financial Information” and “Management’s Discussion and Analysis of Financial Condition and Results of Operations—Key Operational and Financial Metrics, including Non-GAAP Measures;” |
| • | EPS refers to earnings (loss) per share; |
| • | GAAP refers to generally accepted accounting principles in the United States of America set forth in the opinions and pronouncements of the Accounting Principles Board of the Public Company Accounting Oversight Board and statements and pronouncements of the Financial Accounting Standards Board or in such other statements by such other entities as have been approved by a significant segment of the accounting profession; |
| • | Gross Cruise Cost refers to the sum of cruise operating expenses and selling and administrative expenses; |
| • | Gross Tons refers to a unit of enclosed passenger space on a cruise ship, such that one gross ton equals 100 cubic feet or 2.831 cubic meters; |
ii
Table of Contents
| • | Gross Yield refers to total revenues, excluding charter per APCD. See footnote 9 in “Prospectus Summary—Summary Consolidated Financial Information” and “Management’s Discussion and Analysis of Financial Condition and Results of Operations—Key Operational and Financial Metrics, including Non-GAAP Measures;” |
| • | IMO refers to the International Maritime Organization, a United Nations agency that sets international standards for shipping; |
| • | MARPOL refers to the International Convention for the Prevention of Pollution from Ships, an international environmental regulation; |
| • | Major North American Cruise Brands refers to Carnival Cruise Lines, Celebrity Cruises, Holland America, Norwegian Cruise Line, Oceania Cruises, Princess Cruises, Regent Seven Seas and Royal Caribbean International; |
| • | Net Cruise Cost refers to Gross Cruise Cost excluding commissions, transportation and other expenses and onboard and other expenses. See “Management’s Discussion and Analysis of Financial Condition and Results of Operations—Key Operational and Financial Metrics, including Non-GAAP Measures;” |
| • | Net Debt refers to our outstanding senior secured indebtedness less cash and cash equivalents; |
| • | Net Per Diem refers to Net Revenue divided by Passenger Days Sold. We utilize Net Per Diems to manage our business on a day-to-day basis. We believe that it is the most relevant measure of our performance as it reflects the revenues earned by us, net of our most significant variable costs. See footnote 9 in “Prospectus Summary—Summary Consolidated Financial Information” and “Management’s Discussion and Analysis of Financial Condition and Results of Operations—Key Operational and Financial Metrics, including Non-GAAP Measures;” |
| • | Net Revenue refers to total revenues, less charter revenue less commissions, transportation and other expenses and onboard and other expenses; |
| • | Net Revenue Adjusted EBITDA Margin refers to Adjusted EBITDA divided by net revenue; |
| • | Net Yield refers to Net Revenue divided by APCD. See footnote 9 in “Prospectus Summary—Summary Consolidated Financial Information” and “Management’s Discussion and Analysis of Financial Condition and Results of Operations—Key Operational and Financial Metrics, including Non-GAAP Measures;” |
| • | Occupancy Percentage refers to the ratio of Passenger Days Sold to APCD; |
| • | Oceania, Oceania Cruises or OCI refers to Oceania Cruises, Inc., a Panamanian corporation and a subsidiary of Prestige Cruise Holdings, Inc.; |
| • | PCH refers to Prestige Cruise Holdings, Inc., a Panamanian corporation and a subsidiary of Prestige Cruises International, Inc.; |
| • | PCI, Prestige, the Company, we, our or us refers to Prestige Cruises International, Inc., together with its consolidated subsidiaries; |
| • | PCS refers to Prestige Cruise Services, LLC, a subsidiary of Oceania Cruises, Inc.; |
| • | PDS or Passenger Days Sold refers to the number of revenue passengers carried for the period multiplied by the number of days within the period in their respective cruises. See footnote 9 in “Prospectus Summary—Summary Consolidated Financial Information” and “Management’s Discussion and Analysis of Financial Condition and Results of Operations—Key Operational and Financial Metrics, including Non-GAAP Measures;” |
| • | Public Cruise Companies refers to Carnival Corp., Norwegian Cruise Line Holdings Ltd. and Royal Caribbean Cruises Ltd.; |
| • | Regent, Regent Seven Seas or SSC refers to Seven Seas Cruises S. DE R.L. and its subsidiaries; |
iii
Table of Contents
| • | Regent Seven Seas Transaction refers to the transaction that closed on January 31, 2008, pursuant to which Seven Seas Cruises S. DE R.L. purchased substantially all of the assets of Regent Seven Seas Cruises, Inc. and the equity of certain of its affiliated companies and joint ventures from Carlson Cruises Worldwide, Inc. and Vlasov Shipping Corporation; |
| • | SOLAS refers to the International Convention for the Safety of Life at Sea, a body of international regulations dealing with ship and operational safety standards; and |
| • | STCW refers to the Standard of Training Certification and Watchkeeping for mariners. |
CAUTIONARY STATEMENT CONCERNING FORWARD-LOOKING STATEMENTS
This prospectus contains forward-looking statements within the meaning of the U.S. federal securities laws. Forward-looking statements include statements other than those that directly or exclusively relate to historical facts, including, without limitation, those regarding our business strategy, financial position, results of operations, plans, prospects and objectives of management for future operations (including development plans and objectives relating to our activities). Many, but not all, of these statements can be found by looking for terms like “expect,” “anticipate,” “goal,” “project,” “plan,” “believe,” “seek,” “could,” “will,” “may,” “might,” “forecast,” “estimate,” “intend,” and “future” and for similar words. Forward-looking statements reflect management’s current expectations and do not guarantee future performance and may involve risks, uncertainties and other factors that are difficult to predict and many of which are beyond our control. These factors could cause our actual results, performance, or achievements to differ materially from the future results, performance, or achievements expressed or implied in those forward-looking statements. Examples of these risks, uncertainties and other factors include, but are not limited to:
| • | adverse economic conditions that may affect consumer demand for cruises, such as declines in the securities and real estate markets, declines in disposable income and consumer confidence; |
| • | changes in cruise capacity, as well as capacity changes in the overall vacation industry; |
| • | intense competition from other cruise companies, as well as non-cruise vacation alternatives, which may affect our ability to compete effectively; |
| • | the delivery schedules and estimated costs of newbuilds, in particular the Seven Seas Explorer, on terms that are favorable or consistent with our expectations; |
| • | our substantial leverage, our potential inability to generate the necessary amount of cash to service our existing debt and the potential incurrence of substantial indebtedness in the future; |
| • | continued borrowing availability under our Secured Credit Facilities (as defined herein) and compliance with our covenants; |
| • | changes in interest rates, foreign currency rates, fuel costs or other cruise operating costs; |
| • | the risks associated with operating internationally; |
| • | changes in general economic, business and geopolitical conditions; |
| • | the impact of changes in the global credit markets on our ability to borrow and our counterparty credit risks, including with respect to our Secured Credit Facilities, derivative instruments, contingent obligations and insurance contracts; |
| • | the impact of problems encountered at shipyards, as well as any potential claim, impairment, loss, cancellation or breach of contract in connection with any contracts we have with shipyards; |
| • | the impact of any future changes relating to how travel agents sell and market our cruises; |
| • | the impact of any future increases in the price of, or major changes or reduction in, commercial airline services; |
| • | the impact of seasonal variations in passenger fare rates and occupancy levels at different times of the year; |
iv
Table of Contents
| • | adverse events impacting the security of travel that may affect consumer demand for cruises, such as terrorist acts, acts of piracy, armed conflict and other international events, including political hostilities or war; |
| • | the impact of the spread of contagious diseases; |
| • | the impact of mechanical failures or accidents involving our ships and the impact of delays, costs and other factors resulting from emergency ship repairs, as well as scheduled maintenance, repairs and refurbishment of our ships; |
| • | accidents, criminal behavior and other incidents affecting the health, safety, security and vacation satisfaction of passengers and causing damage to ships, which could, in each case, cause reputation harm, the modification of itineraries or cancellation of a cruise or series of cruises; |
| • | the continued availability of attractive port destinations; |
| • | our ability to attract and retain qualified shipboard crew members and key personnel; and |
| • | changes involving the corporate, tax, environmental, health, safety and other regulatory regimes in which we operate. |
The above examples are not exhaustive and speak only as of the date of this prospectus. These and other factors are more fully discussed in the “Risk Factors” section and elsewhere in this prospectus. These risks could cause actual results to differ materially from those implied by forward-looking statements in this prospectus.
From time to time, new risks emerge and existing risks increase in relative importance to our operations. We expressly disclaim any obligation or undertaking to release publicly any updates or revisions to any forward-looking statement contained herein to reflect any change in our expectations with regard thereto or any change of events, conditions or circumstances on which any such statement was based. Such forward-looking statements are based on our current beliefs, assumptions, expectations, estimates and projections regarding our present and future business strategies and the environment in which we will operate in the future. All subsequent written and oral forward-looking statements attributable to us or any person acting on our behalf are expressly qualified in their entirety by the cautionary statements contained or referred to in this section and in this prospectus, particularly in “Risk Factors.”
MARKET AND INDUSTRY DATA AND FORECASTS
This prospectus includes market share and industry data and forecasts that we obtained from industry publications, third-party surveys and internal company surveys. Industry publications, including those from the Cruise Lines International Association, Inc. (“CLIA”) and surveys and forecasts generally state that the information contained therein has been obtained from sources believed to be reliable. All CLIA information, obtained from the CLIA website “www.cruising.org,” relates to CLIA member lines, which currently include 26 of the major North American cruise lines, including both Regent and Oceania. CLIA member lines cumulatively represented 97% of the North American cruise capacity as of September 30, 2013. All other references to third-party information are to information that is publicly available at nominal or no cost. We use the most currently available industry and market data to support statements as to our market position.
Although we believe that the industry publications and third-party sources are reliable, we have not independently verified any of the data from industry publications or third-party sources. Similarly, while we believe our internal estimates with respect to our industry are reliable, our estimates have not been verified by any independent sources. While we are not aware of any misstatements regarding any industry data presented herein, our estimates, in particular as they relate to market share and our general expectations, involve risks and uncertainties and are subject to change based on various factors, including those discussed under “Risk Factors,” “Cautionary Statement Concerning Forward-Looking Statements” and “Management’s Discussion and Analysis of Financial Condition and Results of Operations” in this prospectus.
v
Table of Contents
This summary highlights information about us and the offering contained elsewhere in this prospectus. It is not complete and may not contain all the information that may be important to you. You should read this entire prospectus carefully before making an investment decision, including the sections entitled “Risk Factors” and “Cautionary Statement Concerning Forward-Looking Statements” and our consolidated financial statements and related notes included elsewhere in this prospectus.
Our Company
We are the market leader in the Upscale segment, which is comprised of the Upper Premium and Luxury segments, of the $29 billion cruise industry, and we are focused on providing our guests with extraordinary experiences. These experiences are characterized by gourmet cuisine, high quality service, luxurious accommodations and distinctive itineraries to “must see” destinations worldwide. Our cruise vacations are tailored to the preferences of affluent individuals globally, who are generally 55 years of age and older. This target market, referred to as the baby-boomers in the United States, is both the largest and fastest growing U.S. demographic. Our focus on this demographic allows us to deliver a vacation lifestyle that our guests can expect, enjoy and are willing to pay a premium price to experience. Our cruise vacations are exclusive and upscale and are designed to encourage our guests to form an emotional attachment to our ships and staff, creating a long-lasting affinity for our brands.
Our brands, Oceania and Regent, are comprised of eight cruise ships, with a ninth under construction for Regent. Oceania operates in the Upper Premium segment and Regent operates in the Luxury segment. We believe we have successfully positioned our two brands as the cruise lines of choice with the fast growing baby-boomer demographic. Our brands occupy a leading position in the Upscale segment, representing approximately 46% of the combined berth capacity of the Upscale segment as of September 30, 2013. We believe our two-brand strategy is key to maintaining our market leading position, as it allows us to offer products in the Upscale segment with distinct brand promises to a growing global demographic.
We focus on providing destination-oriented vacations combined with distinctive onboard experiences, such as gourmet cuisine, spacious and comfortable public areas, high levels of service and luxurious in-suite amenities. Our ships have limited guest capacity per ship, ranging from 490 to 1,250 guests, and are significantly smaller than the typical 2,000 to 5,000 passenger ships operated by the Contemporary and Premium segment brands. Our stateroom accommodations are large and luxurious, consistent with an upscale and exclusive cruise experience, with over 87% of the suites and staterooms on our ships featuring private balconies. Our onboard dining is a central highlight of our cruise experience and features multiple open seating gourmet dining venues where guests may dine when, where and with whom they wish. Our ships are staffed with a crew-to-guest ratio of approximately 1 to 1.7, further promoting a high level of service. This luxury-focused product offering drives our industry leading Net Yields.
We focus on deploying our ships to high demand and in-season locations worldwide. Our smaller ship size allows us to travel to more remote ports around the world, thereby meeting our guests’ demand for experiencing the most sought after destinations. The duration of our cruises varies from seven to 180 days, featuring worldwide itineraries that visit approximately 350 ports each year, including destinations such as Scandinavia, Russia, the Mediterranean, the Greek Isles, Alaska, Canada and New England, Asia, Tahiti and the South Pacific, Australia and New Zealand, Africa, India, South America, the Panama Canal and the Caribbean. We also have the only cruise line (Oceania) to offer a port-intensive 180 day “Around the World” cruise that circumnavigates the globe. Our ships are designed to be classic and refined, providing a comfortable cruise experience featuring the gourmet cuisine, highly attentive service and elegant surroundings that our target market is seeking, rather than the extravagant and flashy onboard features found on many larger ships catering to the mass market. We
1
Table of Contents
believe this key advantage will allow us to continue to grow our Net Yields across our entire fleet, and not just from new ship introductions, and to experience a more consistent and predictable return on invested capital over the useful life of our ships.
Our affluent and mostly retired or semi-retired guests plan their cruise vacations well ahead of sail date, which gives us high visibility into our future revenues. On average, our guests book seven to nine months in advance of sail date, which provides us ample lead time to effectively plan our sales and marketing initiatives and optimize our industry leading Net Yields. Because of the more all-inclusive nature of our product offerings, we generate a larger share of our overall revenue at time of booking compared to the rest of the industry, which provides us with even greater visibility into our total revenues. Another key differentiating factor is our disciplined and transparent go-to-market strategy. Unlike most cruise lines that discount inventory regularly to fill capacity (“price to fill”), our strategy to maximize revenue is to increase marketing efforts (“market to fill”) as the cruise date approaches. In order to accelerate sales, we clearly articulate to customers and travel agents that our prices are subject to increase as the cruise date approaches, as well as the specific dates on which those increases may occur. This strategy allows us to maintain and improve our high price point, which is fundamental in the Upscale segment.
Our senior management team has delivered consistent revenue, EBITDA and net income growth, producing measurable improvements in all three growth phases of the cruise industry. Frank J. Del Rio launched a new brand with the introduction of Oceania in 2003 and leads the company as our Chairman and CEO. We acquired Regent in 2008 and improved our results following the acquisition, including generating $18.0 million in cost synergies and increasing occupancy and yields. We also completed a newbuild program with the successful launch of Oceania’s Marina in January 2011 and Oceania’s Riviera in April 2012. We are committed to maintaining a disciplined growth strategy to maximize shareholder value by profitably growing our business while continuing to reduce our debt and increase our return on invested capital.
Our operating structure is integrated, with both of our brands sharing a single headquarter location and back office functions. This approach creates a culture of institutionalizing best practices, driving efficiencies and taking advantage of scale. Our brands maintain separate sales and marketing teams as well as dedicated reservation centers, which allows each brand to maintain and effectively communicate its unique identity and brand promise. This balanced approach leverages best-in-class operations to deliver consistently outstanding experiences to our guests while keeping our overhead expenditures low and our competitive position strong. This strategy also allows us to leverage our scale in order to develop international source markets effectively and permits other efficiencies such as implementing a common reservation system, shared data center and a common pool of well trained and experienced onboard crew and officers.
For the twelve months ended September 30, 2013, we generated total revenue of $1.2 billion, Net Revenue of $787.2 million, Adjusted EBITDA of $253.4 million and Adjusted EBITDA Margin of 21.6%. In comparing our Adjusted EBITDA Margin to other cruise lines, it is important to note that our more inclusive product offering results in higher Commissions, transportation and other expense. Accordingly, we believe a more appropriate margin analysis is Net Revenue Adjusted EBITDA Margin, which is Adjusted EBITDA divided by Net Revenue, which was 32.2% for the twelve months ended September 30, 2013. See “Prospectus Summary—Summary Consolidated Financial Information” for a reconciliation of Adjusted EBITDA to net income.
Our Brands
Oceania
Oceania was formed in 2003 by Frank J. Del Rio, now Chairman and CEO of our company, to focus on the under-penetrated midsize ship cruise market. Oceania specializes in offering destination-oriented cruise vacations,
2
Table of Contents
gourmet culinary experiences, elegant accommodations and personalized service at a compelling value. Oceania owns and operates a five ship fleet, comprised of three 684 guest R-Class ships: Regatta, Insignia and Nautica, and two new 1,250 guest O-Class ships: Marina and Riviera, which joined the fleet in 2011 and 2012, respectively.
Oceania provides an Upper Premium midsize ship cruise experience designed primarily for affluent baby-boomers. The line positions itself as the affordable cruising alternative between the Luxury ($500 plus per person per diems) and Premium ($150 to $250 per person per diems) segments of the cruise industry. Affluent guests, who historically have been loyal cruise customers on small and midsize ships, have seen the number of these type of ships diminish in recent years as the major cruise operators have focused on building ever larger ships (2500+ passengers) in the Premium cruise category.
In 2011 and 2012, Oceania took delivery of the first two O-Class vessels, Marina and Riviera, with a capacity of 1,250 guests each. We believe the O-Class ships are the world’s finest vessels designed and purpose-built for the Upper Premium market, expanding upon the popular elements featured on Oceania’s original fleet of vessels, with an emphasis on large suites and staterooms and an exceptional epicurean experience. The overall mix of suite and balcony stateroom accommodations on the O-Class ships of 95% positions these vessels to generate higher Net Yields than the R-Class ships, with 68% balcony staterooms.
Oceania is ranked as one of the world’s best cruise lines by Condé Nast Traveler, Travel + Leisure, Departures, Travel Age West and Cruise Critic. Oceania ships received Best Dining, Best Public Rooms and Best Cabins from Cruise Critic Cruisers’ Choice Awards in 2013. Oceania also is the only cruise line to have had one of its ships receive a perfect “100” score for “Dining” in the Condé Nast Traveler Reader’s Choice Awards.
Regent
Regent is recognized as one of the world’s top luxury lines, featuring six-star service, oversized balcony suite staterooms and the cruise industry’s most inclusive product offering. Regent is a leading luxury cruise company and traces its origins to 1992, when Seven Seas Cruise Line merged with Diamond Cruise to become Radisson Seven Seas Cruises. In 2006, the cruise line was re-branded by its then-owner Carlson Company as Regent Seven Seas Cruises. Regent currently operates three award-winning, all-suite ships, comprised of Seven Seas Navigator, the all-balcony Seven Seas Mariner and the all-balcony Seven Seas Voyager, totaling 1,890 aggregate berths. Regent offers the industry’s most all-inclusive cruise vacation experience, including free air transportation, a pre-cruise hotel night stay, premium wines and top shelf liquors, gratuities, internet access and unlimited shore excursions.
Regent is currently building a 750 passenger ship, Seven Seas Explorer, for delivery in the summer of 2016, which we believe will further elevate the position of the Regent brand. The all-suite, all-balcony ship will feature sophisticated designer suites ranging from 300 to 3,500 square feet with an industry leading space ratio of 89.3 and a crew-to-guest ratio of 1 to 1.4. The ship will include six open-seating gourmet restaurants, Regent’s signature nine-deck open atrium, a two-story theater, three boutiques and an expansive Canyon Ranch SpaClub®. Operationally, the vessel will be a green ship, employing the most advanced environmental systems and state-of-the-art technology.
Regent focuses on providing guests with a high level of personal service, imaginative world-wide itineraries, unique shore excursions and land tours, world-class accommodations and top-rated cuisine. Regent is consistently ranked among the top luxury cruise lines by various travel publications. In 2011, 2012 and 2013, Regent was named the Best Luxury Cruise Line by Virtuoso, one of America’s largest travel agency networks, which caters to the highly affluent traveler. In 2012, Condé Nast Traveler awarded the brand “Best Cabins” and it received the “Best for Luxury” award from the Cruise Critic Editor’s Pick Awards. Regent also was honored with “World’s Best Service” from Travel + Leisure’s World’s Best Awards in 2013.
3
Table of Contents
Our Industry
We believe that the cruise industry demonstrates the following positive fundamentals:
Strong Growth with Low Penetration and Significant Upside
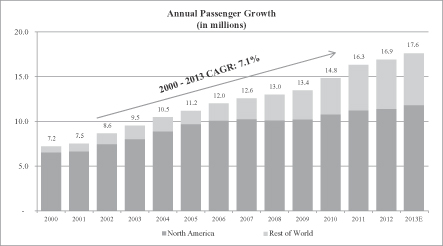
Cruising represents a small but fast growing sector of the overall global vacation market. Cruising is a vacation alternative with broad appeal, as it offers a wide range of products, destinations and experiences from offerings in the Contemporary (large ships / low ticket prices) to Luxury (small ships / high ticket prices) segments to suit the various preferences of vacationing consumers of all ages, wealth levels and nationalities. According to CLIA, only 24% of the U.S. population has taken a cruise. However, CLIA estimates that during 2012, approximately 17 million global passengers went on a cruise, an increase of 5.4% over the preceding year. According to CLIA, the number of cruise passengers originating from North America has increased each year since 1995 as cruising has evolved from a niche vacation experience to a leisure holiday with broad appeal across all demographic and psychographic groups. Despite this consistent growth, the cruise industry still has low penetration levels compared to similar land-based vacations. Based on industry research, in 2012, 57.2 million people visited Orlando, Florida and 39.7 million people visited Las Vegas, Nevada. We believe this data highlights the continued growth potential for ocean going cruising. The future growth of the Contemporary and Premium segments, along with the normal aspirational life cycle of consumer preferences, is especially important for our company, because the vast majority of our first time guests are not first time cruisers. Accordingly, increases in the number of guests in the Contemporary and Premium segments will increase the pool of potential first time guests for our two brands.
Attractive Demographics of Target Market
Long-term demographics are favorable for the cruise industry, in particular for the Upscale segment. Historically, people 55 years of age and older have had the highest disposable income levels and the most leisure time, making them prime candidates for Upscale cruising given the longer itineraries and higher per diems of cruises in that category. According to U.S. Census Bureau data, in 2010, the 55 years and older age group was comprised of 77 million individuals, representing approximately 25% of the U.S. population. This group is expected to increase to 87 million by 2015 and 106 million by 2025. These individuals control $12.7 trillion of wealth and represent approximately 31% of the global high net worth individual population. The demographics in Europe are expected to follow a similar growth trend.
4
Table of Contents
International Growth in Emerging Markets
Significant growth opportunities exist for sourcing guests from Europe and other international markets, as the percentage of guests from outside North America who have taken cruises is far lower than the percentage of North Americans. Emerging markets in Asia and the Pacific Rim also hold strong potential for us to source future cruise passengers. As recently as seven years ago, no international cruise lines serviced these regions. However, a number of cruise lines in the Contemporary and Premium segments, which typically includes cruises of seven days or less, have a more casual ambiance, and offer the lowest prices, have recently deployed ships in Asia for seasonal or year-round operations. The increase in personal wealth in these and other emerging markets is particularly beneficial to the cruise industry, as historically, when the living standards improve in a country, the population first focuses on buying physical assets (e.g., houses, cars, etc.) and then focuses on buying aspirational experiences, such as travel. Overall, the growth in cruising outside of North America has been increasing at a considerably faster pace than within North America.
Multiple Segments
The cruise industry’s brands have been historically segmented into the Contemporary, Premium, Upper Premium and Luxury categories. Collectively, we refer to the Upper Premium and Luxury categories as the Upscale segment. The Premium segment typically includes cruises that range from seven to fourteen days. Premium cruises emphasize higher quality offerings, more personal comfort and greater worldwide itineraries, with higher average pricing than the Contemporary cruises. Upper Premium is a niche market segment created by Oceania in 2003 and defined by an experience that straddles the Premium and Luxury segments but with smaller ships than those operated by the Premium lines, higher space and higher crew-to-guest ratios, more refined culinary programs, higher service standards and a greater destination-oriented focus than the Premium segment. The Luxury segment is characterized by the smallest vessel size, unique itineraries, the largest stateroom accommodations, gourmet culinary programs, highly personalized service and a more inclusive offering. These exclusive attributes, combined with limited supply growth and a growing worldwide target population, provide Upscale operators with significant pricing leverage as compared to the other segments of the cruise industry.
High Barriers to Entry
The cruise industry is characterized by high barriers to entry, including the existence of well-known and established consumer brands, the cost, time and personal relationships required to develop strong travel agent network partnerships necessary for success, the large capital expenditures required to build new and sophisticated ships, the limited number of ship builders with experience in constructing passenger ships and the long lead time necessary to construct new ships. Based on recently announced newbuilds and depending on the intended industry segment, the cost to build a new cruise ship can range from $340 million to $1.3 billion, or $195,000 to $741,000 per berth. The ultimate cost depends on the ship’s size and product offering, with the Upper Premium and Luxury segments having the highest cost per berth in the industry, ranging from $443,000 to $741,000 per berth. The Luxury segment in particular has demonstrated high barriers to entry with our competitors having participated in the market for an average of approximately 24 years. We believe that the newbuild pipeline in the Upscale segment is relatively favorable compared to the broader industry, with few deliveries scheduled through 2016 other than Regent’s newbuild.
Our Competitive Strengths
We believe that the following business model attributes enable us to successfully execute our strategy:
Lifestyle Brand
Prestige’s two brands, Regent and Oceania, both have long and venerable histories. We believe the two brands are well known within the affluent 55 and older age group in North America as offering a sophisticated
5
Table of Contents
experience. We partner with several fine luxury brands, including Lalique, Hermes, Bulgari, Canyon Ranch and Bon Appetit, to further add caché to the lifestyle experiences we deliver onboard our cruises. Consistent with our upscale image, we believe our two brands will continue to enjoy resiliency in economic downturns and achieve above-market Net Yields during normal economic conditions.
High Quality Fleet
Our two-brand fleet, which currently consists of eight ships, is designed to provide guests with the highest quality cruise experience. Our accommodations are large and luxurious with over 87% of our staterooms and suites featuring private balconies. Capacity per ship is limited and ranges from 490 to 1,250 guests, providing each guest a unique and highly personalized experience, with space ratios of 44.26 to 68.68, which are among the highest in the industry. Our cruises are staffed at a crew-to-guest ratio of approximately 1 to 1.7, further promoting a high level of personalized service. Seven Seas Mariner and Seven Seas Voyager feature all suite, all balcony accommodations, and Marina and Riviera, 95% of whose accommodations feature balconies, are the only ships at sea to feature suites designed and furnished by Ralph Lauren Home and noted interior designer Dakota Jackson. We expect delivery of our newbuild Seven Seas Explorer in the summer of 2016, which we believe will be the most luxurious ocean-going ship ever built.
Differentiated Product Offering
We believe that our destination-focused worldwide itineraries of varying lengths, augmented by exciting shore excursions and other land based programs and a diverse set of onboard enrichment programs, further differentiate our two brands from our competitors. We also focus on deploying our ships to high demand and in-season locations worldwide. We cruise to more remote ports around the world to meet passengers’ demands to experience new, exotic and out-of-the-way destinations. We feature itineraries that call on “must see” destinations, many of which include overnight stays in port, allowing guests to enjoy greater local immersion. A competitive advantage of our smaller ship size is that we can access smaller ports that are off-limits to larger ships. Our onboard dining is a central highlight of our cruise experience, with multiple open seating dining venues where guests may dine when, where and with whom they wish. We continue to receive awards for our onboard dining and, in 2013 received “Best Dining” from both Condé Nast Traveler Reader’s Choice Awards and Cruise Critic Cruisers Choice Awards. We also feature the only hands-on instructional culinary centers at sea onboard Oceania’s Marina and Riviera. Our state-of-the-art spa facilities on each vessel feature the highly renowned Canyon Ranch SpaClub®. We believe that these high quality product offerings positions us well compared to other cruise operators and provides us with the opportunity to continue growing our capacity and Net Yields.
Loyal and Repeat Customer Base
Our target customer is 55 years of age or older, has a net worth of over $1.0 million, is well educated and is a seasoned world traveler. This target audience has reached an age and wealth status where the convenience, comfort and luxury amenities of an upscale cruise product are extremely appealing.
Our award-winning service, innovative itineraries, gourmet cuisine and luxurious onboard amenities have resulted in nearly perfect passenger satisfaction ratings. In 2013, approximately 98% of guests that responded to our survey reported that their cruise experience met or exceeded their expectations, and that they will “definitely” or “probably” return. Furthermore, for the nine months ended September 30, 2013, repeat guests accounted for approximately 41% of total guests on a Passenger Days Sold basis. Our ability to consistently deliver a high quality, high value product, resulting in high guest satisfaction, continues to be a competitive advantage.
6
Table of Contents
Experienced Management Team and Shareholder
We are led by a management team with extensive cruise and leisure industry experience. The team includes Frank J. Del Rio as Chairman and CEO with 20 years of industry experience, Robert J. Binder as Vice Chairman and President with 23 years of industry experience, Kunal S. Kamlani as President of PCH, Regent and Oceania with 19 years of experience in the financial services and leisure industries, T. Robin Lindsay as Executive Vice President of Vessel Operations with 34 years of industry experience and Jason M. Montague as Executive Vice President and Chief Financial Officer with 13 years of industry experience.
Our principal shareholder and sponsor Apollo has experience investing in the cruise, leisure and travel related industries. Apollo is a leading global alternative asset manager. In addition to holding a controlling interest in us, Apollo is a significant shareholder and controls the board of Norwegian Cruise Line Holdings Ltd., one of the leading global cruise line operators. Apollo also has current investments in other travel and leisure companies, including Caesars Entertainment and Great Wolf Resorts, and has in the past invested in Vail Resorts, Wyndham International and other hotel properties.
Cash Flow Generation
Our business model allows us to generate a significant amount of free cash flow with high revenue visibility. We encourage our target customers to book their cruise vacations as early as possible in the sales cycle and to prepay for certain optional services. We begin to sell our inventory up to 20 months prior to sail date, with deposits generally due within seven days of booking and final payment collected 90 to 150 days before sailing. This payment model results in passenger deposits being a source of cash, provides strong visibility into our future revenues and corresponding cash flows and gives us ample time to adjust selling price and sales and marketing initiatives to minimize acquisition costs and maximize Net Yields. Moreover, we benefit from favorable U.S. tax status, as our income is primarily derived from the operation of cruise ships in international waters and is therefore generally exempt from U.S. federal income taxes. As a result of these factors, we generate significant free cash flow, a portion of which can be used for debt reduction and capacity expansion.
Superior Value Proposition
A substantial number of cruise customers purchase large balcony staterooms measuring over 200 square feet in size on cruise lines in the Contemporary and Premium segments. We believe that after factoring in additional onboard spending for items that would be included in our ticket price, these passengers are currently paying per diems similar to what we charge, but in our opinion, receive a lower quality product, with inferior cuisine, standard itinerary offerings, diminished personalized service due to significantly lower crew-to-guest ratios and markedly lower space ratios. According to our research, there are approximately 22,297 large balcony staterooms measuring over 200 square feet in the North American cruise industry. Our market share of this type of stateroom was only 10% in 2012. We believe our brands are well positioned for future capacity growth given each brand’s market positioning and strong value proposition.
Our Business Strategy
The following are the key components of our business strategy:
Disciplined Growth
Our goal is to grow with discipline, and we are constantly evaluating various strategies for further increasing our passenger capacity and, accordingly, our total revenues and net income with a specific focus on increasing our return on invested capital. These strategies include further penetration into emerging international markets and potential acquisitions of niche cruise operators, similar to the successful acquisition of Regent in 2008. Other possibilities include additional newbuild programs, similar to the additions of Marina and Riviera to
7
Table of Contents
the Oceania fleet in 2011 and 2012, respectively, as well as the scheduled delivery of the Seven Seas Explorer to the Regent fleet in the summer of 2016. Each ship that has joined our fleet has had a significant positive impact on our financial results with limited incremental overhead.
High Visibility and Differentiated Revenue Management Strategy
We have implemented a differentiated price enhancing revenue management strategy that encourages our target market to book early to obtain the most attractive value offering, with bookings made up to 20 months in advance of sail date. This timeline provides us with greater visibility into our future revenues and gives us ample time to adjust sales, marketing and pricing initiatives as necessary. Due to the more inclusive nature of our product offerings, a greater percentage of our Net Revenue is comprised of net ticket revenue as compared to Contemporary and Premium segment cruise lines, which must wait until the actual sailing to gain visibility into much of their revenues, as their onboard revenue represents a greater portion of their total revenue. On average, our guests book seven to nine months in advance of sail date. Based on our research, we believe the industry average booking curve is five months or less.
When we launch new itineraries, we clearly articulate to potential customers and travel agents that prices are subject to increase as the cruise date approaches, as well as the specific dates on which those price increases may occur. We believe the travel agent community favors our pricing strategy as it allows them to provide value to their customers in a completely transparent manner, resulting in early bookings. This early booking cycle allows us to make more informed decisions about pricing, inventory management and marketing efforts.
Focus on Occupancy and Maximize Net Yields
We concentrate on improving our early booking occupancy rates to drive higher Net Yields. We execute targeted and high frequency marketing campaigns that communicate a distinct message of our differentiated value-packed cruise offerings in both North American and select international markets. To increase the effectiveness of our targeted marketing programs, we recently transformed our Miami call center from an inbound-only reservation center to one that also makes outbound calls to high potential targeted customers. This dual prong strategy allows us to maximize the revenue potential from each customer contact (“leads”) generated by our various marketing campaigns. We expect that this strategic change and other initiatives in our sales organization and distribution channels will help drive sustainable growth in the number of guests carried and in Net Yields achieved.
Due to our brands’ clear positioning and our target market focus on an older and more affluent clientele, we do not carry many families with children or groups of individuals that travel three or four to a stateroom. Conversely, we have a small but increased number of elderly guests who prefer to travel as “singles,” or one to a stateroom. Because 100% occupancy is based on two persons in a stateroom, we tend to report occupancies that are somewhat lower than those of the Premium and Contemporary cruise lines, while still sailing close to full in terms of cabin occupancy.
Improve Operating Efficiency and Lower Costs
We focus on driving continued financial performance through a variety of business improvement initiatives. These initiatives focus on reducing costs while also improving the overall product quality we deliver to our customers. For example, when we acquired Regent in 2008, we were able to achieve $18 million in annual cost savings through rationalizing overhead and institutionalizing best practices across the two brands.
Our business improvement initiatives focus on various cost containment programs such as contract negotiations, global purchasing and logistics, fuel consumption efficiencies and optimal itinerary deployments. We hedge our fuel purchases in order to provide greater visibility and certainty of our fuel expenses. As of September 30, 2013, we had
8
Table of Contents
hedged approximately 75% of estimated fuel consumption for the remainder of 2013, and approximately 40% and 10% of our estimated fuel consumption for 2014 and 2015, respectively. In addition, we expect benefits derived from economies of scale from additional newbuilds will further drive operating efficiencies over the medium and long term.
Expand and Strengthen Our Product Distribution Channels
We have three primary sales channels that we constantly strive to optimize: “Retail/Travel Agent,” “International” and “Meetings, Incentives and Charters.” As part of this optimization, we continue to invest in our brands by enhancing our technology platforms across these channels, including through websites and other global distribution systems, as well as our inbound and outbound reservations department that travel agents and customers use to book cruise vacations. We strive to continually deliver efficient and timely marketing information across multiple technological and legacy type platforms.
| • | Retail/Travel Agent. We make substantial investments to facilitate our travel agent partners’ success with improvements in booking technologies, transparent pricing strategies, effective marketing tools, improved communication and cooperative marketing initiatives. We have also implemented automated communication, training and booking tools specifically designed to improve our efficiency with the travel agency community and our guests including aggressive call center quality monitoring. We have sales force teams dedicated to each of our two brands who work closely with our travel agency partners on maximizing their marketing and sales effectiveness through product training, education and the sharing of “best-practices.” |
| • | International. We have an international sales office in Southampton, United Kingdom that services Europe and various general sales agents covering Latin America, Australia and Asia. Since the expansion of our fleet in 2011, we have made a concerted effort to diversify the sourcing of our passengers worldwide. In 2010, 20.2% of our passengers were sourced from outside the United States. In 2012, we grew that amount to 25.3%. For the twelve months ended September 30, 2013, 26.6% of our passengers were sourced from outside the United States. We believe there remains significant opportunity to grow passenger sourcing in many major markets such as Europe and Australia as well as in emerging markets in the Asia Pacific region. |
| • | Meetings, Incentives and Charters. This channel focuses on full ship charters as well as partial ship groups for corporate meeting and incentive travel. These sales often have very long lead times and can fill a significant portion of a ship’s capacity, or even an entire sailing, in one transaction. In addition, full ship charters and/or large groups strengthens base-loading, which allows us to fill a particular sailing earlier than usual which in turn allows us to reduce sales and marketing spend on both the sailing with the large group as well as surrounding sailings. |
Our Fleet
Collectively, our two brands operate eight ships with 6,442 berths in aggregate. We also have one newbuild, Seven Seas Explorer, with 750 berths on order for delivery in the summer of 2016. Our current fleet has a maximum of 2,351,330 capacity days that will grow 11.6% to 2,625,080 after delivery of the Seven Seas Explorer in the summer of 2016.
Oceania operates five ships. The R-Class ships, Regatta, Insignia and Nautica are identical highly-rated 5-star ships featuring country club style accommodations and amenities. Capacity on each ship is limited to 684 guests and our cruises are staffed at a crew-to-guest ratio of approximately 1 to 1.7. These ships provide 68% of suites and staterooms with private balconies. Recently, Oceania successfully executed a fleet expansion program with the additions of two O-Class ships, Marina and Riviera, in 2011 and 2012, respectively. The O-Class vessels are staffed at a crew-to-guest ratio of approximately 1 to 1.6 and 95% of the staterooms are suites and have private balconies. Oceania’s fleet has grown 122% since 2010 to 4,552 berths in aggregate and operating a maximum annual capacity of 1,661,480 capacity days. Oceania is the world’s largest Upper Premium cruise line.
9
Table of Contents
Regent currently operates three six-star luxury cruise ships, Seven Seas Navigator, Seven Seas Mariner and Seven Seas Voyager, with 1,890 berths in aggregate, featuring world-class accommodations and amenities. Regent operates at a maximum capacity of 689,850 capacity days. Capacity on each ship is limited and ranges from 490 to 700 guests and cruises are staffed at a crew-to-guest ratio of approximately 1 to 1.6. All ships offer all-suite accommodations with 90-100% of the suites featuring private balconies. Delivery of the 750 guest newbuild, Seven Seas Explorer, is expected in the summer of 2016. The all-suite, all-balcony Seven Seas Explorer will feature sophisticated designer suites ranging from 300 square feet to 3,500 square feet with an industry leading space ratio of 89.3 gross tons per guest and a crew-to-guest ratio of 1 to 1.4. The ship will include six open-seating gourmet restaurants, Regent’s signature nine-deck open atrium, a two-story theater, three boutiques and an expansive Canyon Ranch SpaClub®. Operationally, it will be a green ship, employing the most advanced environmental systems and state-of-the-art technology. Upon delivery of the Seven Seas Explorer, Regent will be the world’s largest luxury cruise line.
The following table describes the features of our ships:
| Marina, |
Regatta, |
Seven Seas |
Seven Seas |
Seven Seas |
Seven Seas | |||||||
| Berths |
1,250 | 684 | 750 | 700 | 700 | 490 | ||||||
| Balconies |
95% | 68% | 100% | 100% | 100% | 90% | ||||||
| Gross tonnage |
66,084 |
30,277 |
67,000 | 42,363 | 48,075 | 28,803 | ||||||
| Space ratio (1) |
52.86 | 44.26 | 89.33 |
60.52 | 68.68 | 58.78 | ||||||
| Accommodations (sq ft) |
174-2,000 | 160-982 | 300-3,500 | 350-1,403 | 301-2,002 | 301-1,173 | ||||||
| Crew-to-guest ratio |
1:1.6 | 1:1.7 | 1:1.4 | 1:1.6 | 1:1.6 | 1:1.4 | ||||||
| Country of registry |
Marshall Islands | Marshall Islands | Marshall Islands | Bahamas | Bahamas | Bahamas | ||||||
| Restaurants |
6 | 4 | 6 | 4 | 4 | 3 | ||||||
| Year built |
2011, 2012 | 1998, 1998, 2000 | (2) | 2003 | 2001 | 1999 |
| (1) | Space ratio refers to a unit of enclosed space per passenger on the ship measured in cubic feet, and represents gross tonnage divided by the number of double occupancy berths. |
| (2) | The Seven Seas Explorer is currently under construction, with delivery expected in the summer of 2016. |
10
Table of Contents
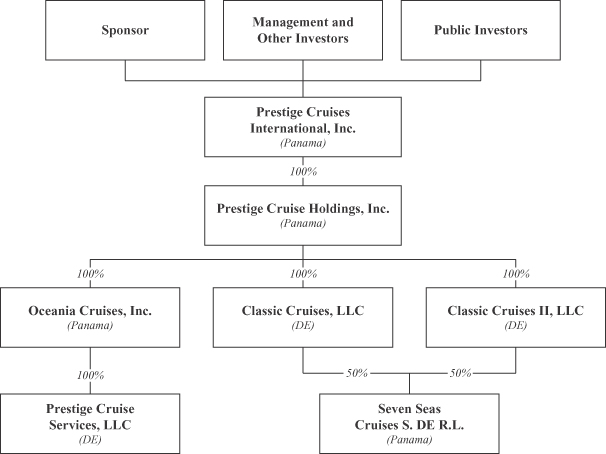
Our Corporate Structure
The following chart shows our corporate structure immediately following the consummation of this offering:
11
Table of Contents
Our Sponsor
Our principal shareholder and sponsor, Apollo Global Management, LLC, is a leading global alternative asset manager with offices in New York, Los Angeles, London, Frankfurt, Luxembourg, Singapore, Hong Kong and Mumbai. As of September 30, 2013, Apollo had assets under management of $113.0 billion invested in its private equity, credit markets and real estate businesses. In addition to holding a controlling interest in us, Apollo is a significant shareholder and controls the board of Norwegian Cruise Line Holdings Ltd., one of the leading global cruise line operators. Apollo also has current investments in other travel and leisure companies, including Caesars Entertainment and Great Wolf Resorts, and has in the past invested in Vail Resorts, Wyndham International and other hotel properties.
Additional Information
Prestige is a company incorporated under the laws of Panama. Our registered offices are located at Plaza 2000 Building, 16th Floor, 50th Street, Panama, Republic of Panama. Our principal executive offices are located at 8300 NW 33rd Street, Suite 100, Miami, FL 33122. Our telephone number is (305) 514-2300. Our websites are www.rssc.com and www.oceaniacruises.com. The information that appears on our website is not part of, and is not incorporated by reference into, this prospectus.
12
Table of Contents
THE OFFERING
| Issuer |
Prestige Cruises International, Inc. |
| Ordinary shares offered by us |
shares, or shares if the underwriters exercise in full their option to purchase additional shares. |
| Ordinary shares to be outstanding after this offering |
shares, or shares if the underwriters exercise in full their option to purchase additional shares. |
| Over-allotment option |
We have granted the underwriters an option for a period of 30 days to purchase from us of up to additional ordinary shares to cover any over-allotments. |
| Use of proceeds |
We estimate that we will receive net proceeds from the sale of our ordinary shares in this offering of approximately $ million, after deducting the underwriting discount and estimated offering expenses, assuming the ordinary shares are offered at $ per share, which is the midpoint of the estimated offering price range set forth on the cover page of this prospectus, and assuming that the underwriters do not exercise their option to purchase additional shares. We intend to use the net proceeds that we receive (i) to redeem $ million of Regent’s outstanding Senior Secured Notes, (ii) to repay $ million of the Oceania Term Loan and $ million of the Regent Term Loan, and (iii) for future capital expenditures and general corporate purposes. See “Use of Proceeds.” |
| Listing |
We have applied to list the common shares on under the symbol “ .” |
| Dividend policy |
We currently do not intend to pay dividends following this offering. The agreements governing our debt instruments limit our ability to pay cash dividends to our shareholders above specified levels. In addition, any determination to pay dividends in the future will be at the discretion of our Board of Directors and will depend upon our results of operations, financial condition, contractual restrictions, restrictions imposed by applicable law and other factors that our Board of Directors deems relevant. See “Dividend Policy.” |
| Risk factors |
You should carefully read and consider the information set forth under “Risk Factors” beginning on page 19 of this prospectus and all other information set forth in this prospectus before investing in our ordinary shares. |
The number of ordinary shares to be outstanding after this offering is based on ordinary shares outstanding as of the date of this prospectus and the ordinary shares we are offering. This number of shares excludes ordinary shares issuable upon the exercise of outstanding options at a weighted-average exercise price of $ per share as of the date of this prospectus, of which were exercisable, and up to ordinary shares reserved for future issuance under our equity incentive plans following this
13
Table of Contents
offering. The number of ordinary shares reserved for future issuance will be reduced by options to purchase ordinary shares that we granted effective immediately following the pricing of this offering with an exercise price equal to the initial public offering price. Of these grants, our directors and named executive officers received options to purchase ordinary shares.
Except as otherwise indicated herein, all information in this prospectus, including the number of ordinary shares that will be outstanding after this offering, reflects or assumes:
| • | an initial public offering price of $ per ordinary share; |
| • | the underwriters do not exercise their option to purchase up to additional ordinary shares from us; |
| • | the stock split that we intend to effectuate prior to this offering, whereby each issued and outstanding ordinary share will be converted into shares; and |
| • | no exercise of the outstanding options described above. |
14
Table of Contents
SUMMARY CONSOLIDATED FINANCIAL INFORMATION
In the tables below, the summary consolidated financial information as of December 31, 2012 and 2011 and for each of the three years ended December 31, 2012, 2011 and 2010 have been derived from our audited consolidated financial statements included elsewhere in this prospectus. The summary consolidated financial information as of December 31, 2010 has been derived from our audited consolidated financial statements not included in this prospectus. The summary consolidated financial information as of September 30, 2013 and for the nine months ended September 30, 2013 and 2012 has been derived from our unaudited consolidated financial statements included elsewhere in this prospectus. The summary consolidated balance sheet data as of September 30, 2012 has been derived from our unaudited consolidated financial statements not included in this prospectus. We have prepared our unaudited consolidated financial statements on the same basis as our audited consolidated financial statements and, in our opinion, have included all adjustments, which include only normal recurring adjustments, necessary to present fairly in all material respects our financial position and results of operations. The results for any interim period are not necessarily indicative of the results that may be expected for the full year.
Solely for the convenience of the reader, the tables below also provide certain of our financial data for the twelve months ended September 30, 2013, which have been calculated by adding the results for the year ended December 31, 2012 and the nine months ended September 30, 2013, and subtracting the results for the nine months ended September 30, 2012.
We utilize a variety of operational and financial metrics, which are defined below, to evaluate our performance and financial condition. We use certain non-GAAP financial measures, such as EBITDA, Adjusted EBITDA, Net Per Diems and Net Yields, to enable us to analyze our performance and financial condition. We utilize these financial measures to manage our business on a day-to-day basis and believe that they are the most relevant measures of our performance. Some of these measures are commonly used in the cruise industry to measure performance. We believe these non-GAAP measures provide expanded insight to measure revenue and cost performance, in addition to the standard GAAP-based financial measures. There are no specific rules or regulations for determining non-GAAP measures, and as such, they may not be comparable to measures used by other companies within our industry. The presentation of non-GAAP financial information should not be considered in isolation or as a substitute for, or superior to, the financial information prepared and presented in accordance with GAAP.
The historical results set forth below do not necessarily indicate results expected for any future period, and should be read in conjunction with “Risk Factors,” “Selected Consolidated Financial Information,” “Management’s Discussion and Analysis of Financial Condition and Results of Operations,” “Description of Certain Indebtedness” and our consolidated financial statements and related notes thereto included elsewhere in this prospectus.
15
Table of Contents
| (in thousands, except per share data) | Twelve Months Ended September 30, 2013 |
Nine Months Ended September 30, |
Year Ended December 31, | |||||||||||||||||||||
| 2013 | 2012 | 2012 | 2011 | 2010 | ||||||||||||||||||||
| Statement of operations data: |
||||||||||||||||||||||||
| Revenues: |
||||||||||||||||||||||||
| Passenger ticket |
$ | 994,751 | $ | 779,309 | $ | 731,629 | $ | 947,071 | $ | 834,868 | $ | 642,068 | ||||||||||||
| Onboard and other |
161,197 | 124,007 | 114,023 | 151,213 | 134,270 | 107,025 | ||||||||||||||||||
| Charter |
18,779 | 14,046 | 9,004 | 13,737 | — | — | ||||||||||||||||||
|
|
|
|
|
|
|
|
|
|
|
|
|
|||||||||||||
| Total revenue |
1,174,727 | 917,362 | 854,656 | 1,112,021 | 969,138 | 749,093 | ||||||||||||||||||
| Cruise operating expenses: |
||||||||||||||||||||||||
| Commissions, transportation and other |
325,701 | 247,248 | 252,801 | 331,254 | 271,527 | 192,285 | ||||||||||||||||||
| Onboard and other |
43,065 | 33,732 | 31,085 | 40,418 | 36,854 | 28,981 | ||||||||||||||||||
| Payroll, related and food |
177,819 | 133,918 | 124,693 | 168,594 | 153,754 | 122,801 | ||||||||||||||||||
| Fuel |
104,391 | 77,978 | 75,272 | 101,685 | 92,921 | 57,913 | ||||||||||||||||||
| Other ship operating |
99,964 | 74,694 | 70,538 | 95,808 | 86,022 | 68,517 | ||||||||||||||||||
| Other |
14,026 | 8,368 | 16,310 | 21,968 | 26,305 | 16,085 | ||||||||||||||||||
|
|
|
|
|
|
|
|
|
|
|
|
|
|||||||||||||
| Total cruise operating expenses |
764,966 | 575,938 | 570,699 | 759,727 | 667,383 | 486,582 | ||||||||||||||||||
| Selling and administrative |
170,633 | 131,871 | 114,985 | 153,747 | 145,802 | 134,676 | ||||||||||||||||||
| Depreciation and amortization |
87,731 | 62,683 | 67,955 | 93,003 | 79,269 | 56,606 | ||||||||||||||||||
|
|
|
|
|
|
|
|
|
|
|
|
|
|||||||||||||
| Total operating expenses |
1,023,330 | 770,492 | 753,639 | 1,006,477 | 892,454 | 677,864 | ||||||||||||||||||
|
|
|
|
|
|
|
|
|
|
|
|
|
|||||||||||||
| Operating income |
151,397 | 146,870 | 101,017 | 105,544 | 76,684 | 71,229 | ||||||||||||||||||
|
|
|
|
|
|
|
|
|
|
|
|
|
|||||||||||||
| Non-operating income (expense): |
||||||||||||||||||||||||
| Interest expense, net of capitalized interest |
(142,774 | ) | (106,470 | ) | (95,347 | ) | (131,651 | ) | (101,560 | ) | (91,325 | ) | ||||||||||||
| Interest income |
552 | 367 | 567 | 752 | 670 | 513 | ||||||||||||||||||
| Other income (expense) (1) |
9,333 | 6,651 | 20,274 | 22,956 | (45,901 | ) | (42,179 | ) | ||||||||||||||||
|
|
|
|
|
|
|
|
|
|
|
|
|
|||||||||||||
| Total non-operating expense |
(132,889 | ) | (99,452 | ) | (74,506 | ) | (107,943 | ) | (146,791 | ) | (132,991 | ) | ||||||||||||
|
|
|
|
|
|
|
|
|
|
|
|
|
|||||||||||||
| Income (loss) before income taxes |
18,508 | 47,418 | 26,511 | (2,399 | ) | (70,107 | ) | (61,762 | ) | |||||||||||||||
| Income tax benefit (expense) |
181 | 183 | (211 | ) | (213 | ) | 335 | (358 | ) | |||||||||||||||
|
|
|
|
|
|
|
|
|
|
|
|
|
|||||||||||||
| Net income (loss) |
$ | 18,689 | $ | 47,601 | $ | 26,300 | $ | (2,612 | ) | $ | (69,772 | ) | $ | (62,120 | ) | |||||||||
|
|
|
|
|
|
|
|
|
|
|
|
|
|||||||||||||
| Earnings (loss) per share: |
||||||||||||||||||||||||
| Basic |
$ | 3.51 | $ | 1.94 | $ | (0.19 | ) | $ | (5.14 | ) | $ | (4.60 | ) | |||||||||||
| Diluted |
$ | 2.45 | $ | 1.94 | $ | (0.19 | ) | $ | (5.14 | ) | $ | (4.60 | ) | |||||||||||
| Balance sheet data (at end of period): |
||||||||||||||||||||||||
| Cash and cash equivalents |
$ | 263,781 | $ | 253,303 | $ | 139,556 | $ | 147,212 | $ | 117,635 | ||||||||||||||
| Total restricted cash (2) |
51,693 | 65,588 | 63,692 | 58,168 | 40,768 | |||||||||||||||||||
| Property and equipment, net |
2,016,783 | 2,050,064 | 2,035,449 | 1,644,971 | 1,181,262 | |||||||||||||||||||
| Total assets |
2,983,085 | 3,013,632 | 2,872,110 | 2,479,581 | 1,939,146 | |||||||||||||||||||
| Total passenger deposits (2) |
428,265 | 364,347 | 365,296 | 336,203 | 291,977 | |||||||||||||||||||
| Long-term debt (3) |
1,618,585 | 1,717,712 | 1,695,656 | 1,328,518 | 830,724 | |||||||||||||||||||
| Total debt (3) |
1,685,940 | 1,839,884 | 1,713,216 | 1,350,840 | 855,724 | |||||||||||||||||||
| Related party notes payable |
698,985 | 649,714 | 661,304 | 615,143 | 572,736 | |||||||||||||||||||
| Total liabilities |
2,946,508 | 2,999,041 | 2,885,453 | 2,489,409 | 1,916,804 | |||||||||||||||||||
| Total stockholders’ equity (deficit) |
36,577 | 14,593 | (13,343 | ) | (9,828 | ) | 22,342 | |||||||||||||||||
16
Table of Contents
| (in thousands, except operating data) | Twelve Months Ended September 30, 2013 |
Nine Months Ended September 30, |
Year Ended December 31, | |||||||||||||||||||||
| 2013 | 2012 | 2012 | 2011 | 2010 | ||||||||||||||||||||
| Cash flow data: |
||||||||||||||||||||||||
| Net cash provided by operating activities |
$ | 200,309 | $ | 167,192 | $ | 188,068 | $ | 186,317 | $ | 89,766 | ||||||||||||||
| Net cash provided by (used in) investing activities |
(26,734 | ) | (549,116 | ) | (539,501 | ) | (603,733 | ) | (179,173 | ) | ||||||||||||||
| Net cash (used in) provided by financing activities |
(49,381 | ) | 487,920 | 343,621 | 447,193 | 57,743 | ||||||||||||||||||
| Operating data: |
||||||||||||||||||||||||
| Passenger Days Sold (4) |
1,966,601 | 1,488,703 | 1,395,793 | 1,873,691 | 1,688,958 | 1,305,578 | ||||||||||||||||||
| Available Passenger Cruise Days (5) |
2,092,920 | 1,571,934 | 1,464,536 | 1,985,522 | 1,836,722 | 1,406,298 | ||||||||||||||||||
| Occupancy (6) |
94.0 | % | 94.7 | % | 95.3 | % | 94.4 | % | 92.0 | % | 92.8 | % | ||||||||||||
| Net Per Diem (7) |
$ | 400.28 | $ | 418.04 | $ | 402.47 | $ | 387.80 | $ | 391.22 | $ | 404.29 | ||||||||||||
| Gross Yield (8) |
552.31 | 574.65 | 577.42 | 553.15 | 527.65 | 532.67 | ||||||||||||||||||
| Net Yield (9) |
376.12 | 395.90 | 383.58 | 365.96 | 359.75 | 375.33 | ||||||||||||||||||
| Adjusted EBITDA (10) |
253,370 | 216,171 | 190,138 | 227,337 | 182,196 | 152,246 | ||||||||||||||||||
| Capital Expenditures |
47,145 | 38,814 | 471,436 | 478,962 | 535,531 | 158,836 | ||||||||||||||||||
| (1) | Other income (expense) consists of a variety of non-operating items including but not limited to foreign transaction gains and losses, gain (loss) on early extinguishment of debt and realized and unrealized gain (loss) on derivative instruments. |
| (2) | Total restricted cash represents reserve requirements for credit card and vendor agreements. Total passenger deposits represent cash collected in advance for future cruises. |
| (3) | Includes the debt discount of $31.0 million and $32.8 million as of September 30, 2013 and December 31, 2012, respectively. |
| (4) | Passenger Days Sold refers to the number of revenue passengers carried for the period multiplied by the number of days within the period in their respective cruises. |
| (5) | Available Passenger Cruise Days (“APCD”) is our measurement of capacity and represents double occupancy per cabin multiplied by the number of cruise days for the period. We use this measure to perform capacity and rate analysis to identify our main non-capacity drivers which cause our cruise revenue and expense to vary. |
| (6) | Occupancy is calculated by dividing Passenger Days Sold by APCD. |
| (7) | Net Per Diem represents Net Revenue divided by Passenger Days Sold. |
| (8) | Gross Yield refers to total revenue, excluding charter per APCD. |
| (9) | Net Yield refers to Net Revenue per APCD. |
| We utilize Net Revenue, Net Per Diem and Net Yield to manage our business on a day-to-day basis and believe that they are the most relevant measures of our revenue performance because they reflect the revenue earned by us net of significant variable costs. The table below illustrates the calculation of Net Revenue, Net Per Diem, Gross Yield and Net Yield. |
| (in thousands, except operating data) | Twelve Months Ended September 30, 2013 |
Nine Months Ended September 30, |
Year Ended December 31, | |||||||||||||||||||||
| 2013 | 2012 | 2012 | 2011 | 2010 | ||||||||||||||||||||
| Passenger ticket revenue |
$ | 994,751 | $ | 779,309 | $ | 731,629 | $ | 947,071 | $ | 834,868 | $ | 642,068 | ||||||||||||
| Onboard and other revenue |
161,197 | 124,007 | 114,023 | 151,213 | 134,270 | 107,025 | ||||||||||||||||||
|
|
|
|
|
|
|
|
|
|
|
|
|
|||||||||||||
| Total revenue, excluding charter |
1,155,948 | 903,316 | 845,652 | 1,098,284 | 969,138 | 749,093 | ||||||||||||||||||
| Less: |
||||||||||||||||||||||||
| Commissions, transportation and other expense |
325,701 | 247,248 | 252,801 | 331,254 | 271,527 | 192,285 | ||||||||||||||||||
| Onboard and other expense |
43,065 | 33,732 | 31,085 | 40,418 | 36,854 | 28,981 | ||||||||||||||||||
|
|
|
|
|
|
|
|
|
|
|
|
|
|||||||||||||
| Net Revenue |
$ | 787,182 | $ | 622,336 | $ | 561,766 | $ | 726,612 | $ | 660,757 | $ | 527,827 | ||||||||||||
|
|
|
|
|
|
|
|
|
|
|
|
|
|||||||||||||
| Passenger Days Sold |
1,966,601 | 1,488,703 | 1,395,793 | 1,873,691 | 1,688,958 | 1,305,578 | ||||||||||||||||||
| Available Passenger Cruise Days |
2,092,920 | 1,571,934 | 1,464,536 | 1,985,522 | 1,836,722 | 1,406,298 | ||||||||||||||||||
| Net Per Diem |
$ | 400.28 | $ | 418.04 | $ | 402.47 | $ | 387.80 | $ | 391.22 | $ | 404.29 | ||||||||||||
| Gross Yield |
552.31 | 574.65 | 577.42 | 553.15 | 527.65 | 532.67 | ||||||||||||||||||
| Net Yield |
376.12 | 395.90 | 383.58 | 365.96 | 359.75 | 375.33 | ||||||||||||||||||
| (10) | Adjusted EBITDA refers to net income (loss) excluding depreciation and amortization, interest income, interest expense, other income (expense), and income tax benefit (expense), and other supplemental adjustments in connection with the calculation of certain financial ratios permitted in calculating covenant compliance under the indenture governing the Senior Secured Notes (as defined herein) and our Secured Credit Facilities (as defined herein). |
17
Table of Contents
| We believe EBITDA and Adjusted EBITDA can provide a more complete understanding of the underlying operating results and trends and an enhanced overall understanding of our financial performance and prospects for the future. EBITDA is defined as net income (loss) excluding depreciation and amortization, net interest expense and income tax benefit (expense). This non-GAAP financial measure has certain material limitations, including: |
| • | It does not include net interest expense. As we have borrowed money for general corporate purposes, interest expense is a necessary element of our costs and ability to generate profits and cash flows; and |
| • | It does not include depreciation and amortization expense. As we use capital assets, depreciation and amortization are necessary elements of our costs and ability to generate profits and cash flows. Management compensates for these limitations by using EBITDA, as defined, as only one of several measures for evaluating our business performance. In addition, capital expenditures, which impact depreciation and amortization, interest expense and income tax expense (benefit), net, are reviewed separately by management. |
| We believe Adjusted EBITDA, when considered along with other performance measures, is a useful measure as it reflects certain operating drivers of our business, such as sales growth, operating costs, selling and administrative expense, and other operating income and expense. |
| While Adjusted EBITDA is not a recognized measure under GAAP, management uses this financial measure to evaluate and forecast our business performance. Adjusted EBITDA is not intended to be a measure of liquidity or cash flows from operations or a measure comparable to net income as it does not take into account certain requirements such as capital expenditures and related depreciation, principal and interest payments, and tax payments, and it is subject to certain additional adjustments as permitted under the agreements governing our indebtedness. Our use of Adjusted EBITDA may not be comparable to other companies within our industry. Management compensates for these limitations by using Adjusted EBITDA as only one of several measures for evaluating our business performance. In addition, capital expenditures, which impact depreciation and amortization, interest expense, and income tax benefit (expense), are reviewed separately by management. |
The following table provides a reconciliation of net income (loss) to Adjusted EBITDA:
| (in thousands) | Twelve Months Ended September 30, 2013 |
Nine Months Ended September 30, |
Year Ended December 31, | |||||||||||||||||||||
| 2013 | 2012 | 2012 | 2011 | 2010 | ||||||||||||||||||||
| Net income (loss) |
$ | 18,689 | $ | 47,601 | $ | 26,300 | $ | (2,612 | ) | $ | (69,772 | ) | $ | (62,120 | ) | |||||||||
| Interest income |
(552 | ) | (367 | ) | (567 | ) | (752 | ) | (670 | ) | (513 | ) | ||||||||||||
| Interest expense, net of capitalized interest |
142,774 | 106,470 | 95,347 | 131,651 | 101,560 | 91,325 | ||||||||||||||||||
| Depreciation and amortization |
87,731 | 62,683 | 67,955 | 93,003 | 79,269 | 56,606 | ||||||||||||||||||
| Income tax (benefit) expense, net |
(181 | ) | (183 | ) | 211 | 213 | (335 | ) | 358 | |||||||||||||||
|
|
|
|
|
|
|
|
|
|
|
|
|
|||||||||||||
| EBITDA |
248,461 | 216,204 | 189,246 | 221,503 | 110,052 | 85,656 | ||||||||||||||||||
| Other (income) expense |
(9,333 | ) | (6,651 | ) | (20,274 | ) | (22,956 | ) | 45,901 | 42,179 | ||||||||||||||
| Equity-based compensation/ transactions (a) |
1,860 | 1,084 | 1,353 | 2,129 | 2,153 | 5,111 | ||||||||||||||||||
| Fuel hedge gain (b) |
876 | 392 | 4,308 | 4,792 | 10,553 | 2,011 | ||||||||||||||||||
| Loss on disposal (c) |
279 | — | 492 | 771 | 1,174 | — | ||||||||||||||||||
| Newbuild (d) |
— | — | 11,088 | 11,088 | 4,051 | 1,859 | ||||||||||||||||||
| Other addback expenses per credit agreement (e) |
11,227 | 5,142 | 3,925 | 10,010 | 8,312 | 15,430 | ||||||||||||||||||
|
|
|
|
|
|
|
|
|
|
|
|
|
|||||||||||||
| Adjusted EBITDA |
$ | 253,370 | $ | 216,171 | $ | 190,138 | $ | 227,337 | $ | 182,196 | $ | 152,246 | ||||||||||||
|
|
|
|
|
|
|
|
|
|
|
|
|
|||||||||||||
| (a) | Equity-based compensation/transactions represent stock compensation expense in each period. |
| (b) | Fuel hedge gain represents the realized gain on fuel hedges triggered by the settlement of the hedge instrument and is included in other income (expense). |
| (c) | Loss on disposal primarily represents asset write-offs during vessel drydocks. |
| (d) | Newbuild represents costs incurred specific to new ships that we have contracted to build. |
| (e) | Other addback expenses per credit agreement represents the net impact of time out of service as a result of unplanned repairs to vessels; expenses associated with consolidating corporate headquarters; certain professional fees and other costs associated with raising capital through debt and equity offerings; certain litigation fees; restructuring fees representing expenses associated with personnel changes, lease termination; management fees paid to Apollo per our management agreement; and other corporate reorganizations to improve efficiencies. In February 2011, Regent amended the Regent license agreement to perpetually license the “Regent” name; as such it will not incur any future license fees. |
18
Table of Contents
An investment in our ordinary shares involves a high degree of risk. In addition to the other information in this prospectus, you should carefully consider the following risk factors and the cautionary statement referred to under “Cautionary Statement Regarding Forward-Looking Statements” in evaluating us and our business before purchasing our ordinary shares. If any of the risks discussed in this prospectus materialize, our business, financial condition and results of operations could be materially adversely affected. If this were to occur, the value of our ordinary shares could decline and you may lose all or part of your investment.
Risks Related to Our Business
Adverse economic conditions in North America and throughout the world and related factors such as fluctuating or increasing fuel prices, declines in the securities and real estate markets, and perceptions of these conditions could decrease the level of disposable income of consumers or consumer confidence and adversely affect our financial condition and results of operations.
Our revenues are highly concentrated from North American passengers, comprising 83% and 86% of our total cruise revenues for the nine months ended September 30, 2013 and the year ended December 31, 2012, respectively. Adverse changes in the perceived or actual economic climate, such as higher fuel prices, stock and real estate market declines and/or volatility, more restrictive credit markets, higher unemployment and underemployment rates, higher taxes and changes in governmental policies, both in North America and worldwide, could reduce consumers’ discretionary income or consumer confidence. Consequently, this may negatively affect demand for cruise vacations in North America and worldwide, which are a discretionary purchase. Decreases in demand could result in price discounting which, in turn, could reduce the profitability of our business. In addition, these conditions could also impact our suppliers, which could result in disruptions in our suppliers’ services and financial losses for us.
An increase in the supply of cruise ships without a corresponding increase in passenger demand could adversely affect our financial condition and results of operations.
Historically, cruise capacity has grown to meet the growth in demand. According to CLIA, North American cruise passenger capacity included 221 ships with approximately 339,000 berths as of December 31, 2012. Upscale cruise companies account for 24 of the 221 ships and 3.3% of total berths. In order to profitably utilize this capacity, the North American cruise industry will need to increase the portion of the U.S. population that has cruised at least once, which was approximately 24% in 2012, according to CLIA. If there is an industry-wide increase in capacity without a corresponding increase in public demand, we, as well as the entire cruise industry, could experience reduced occupancy rates and/or be forced to discount our prices, which could adversely affect our financial condition and results of operations.
We face intense competition from other cruise companies as well as non-cruise vacation alternatives, and we may not be able to compete effectively, which could adversely affect our financial condition and results of operations.
We face intense competition from other cruise companies, particularly in North America, where the cruise market is mature and developed. The North American cruise industry is highly concentrated among three companies. As of December 31, 2012, Carnival Corporation, Royal Caribbean Cruises Ltd. and Norwegian Cruise Line Holdings Ltd. together account for 82% of North American cruise passenger berth capacity. We compete against these operators principally on the quality of our ships, our differentiated product offering, selection of our itineraries and value proposition of our cruises. In addition, Carnival Corporation and Royal Caribbean Cruises Ltd. have multiple brands with various price points and ships deployed in numerous geographic regions. In addition to their increased scale and diversification, they may have greater financial, technological, sales and marketing resources than we do. We also face competition for many itineraries from other cruise operators as well as competition from non-cruise vacation alternatives. In the event we do not compete effectively, our financial condition and results of operations could be adversely affected.
19
Table of Contents
Our substantial indebtedness could adversely affect our ability to raise additional capital to fund our operations, limit our ability to react to changes in the economy or our industry and prevent us from making debt service payments.
We are highly leveraged with a high level of floating rate debt, and our level of indebtedness could limit cash flow available for our operations and could adversely affect our financial condition, prospects and flexibility. As of September 30, 2013, we had $2,570.1 million of total debt, which consisted of $895.7 million under term loan facilities used to finance the Marina and Rivera newbuilds, $296.3 million under the Regent Term Loan (as defined herein), $225.0 million of outstanding Senior Secured Notes, $300.0 million under Oceania’s Term Loan and $853.2 million of related party debt. In addition, as of September 30, 2013, Regent had $40.0 million and Oceania had $75.0 million in available borrowings under their respective revolving credit facilities. Our related party debt will be capitalized prior to the consummation of this offering. See “Unaudited Pro Forma Consolidated Financial Data.”
Our substantial indebtedness could:
| • | limit our ability to borrow money for working capital, capital expenditures, development projects, debt service requirements, strategic initiatives or other purposes; |
| • | make it more difficult for us to satisfy our obligations with respect to our indebtedness, and any failure to comply with the obligations of any of our debt instruments, including restrictive covenants and borrowing conditions, could result in an event of default under the agreements governing our indebtedness; |
| • | require us to dedicate a substantial portion of our cash flow from operations to pay principal and interest on our outstanding debt, thereby reducing funds available to us for other purposes; |
| • | limit our flexibility in planning for, or reacting to, changes in our operations or business; |
| • | make us more highly leveraged than some of our competitors, which may place us at a competitive disadvantage; |
| • | make us more vulnerable to downturns in our business or the economy and in the industry in which we operate; |
| • | limit our ability to make strategic acquisitions or exploit business opportunities; |
| • | limit our ability to borrow additional funds or dispose of assets, among other financial and restrictive covenants in the agreements governing our indebtedness; and |
| • | make our credit card processors seek more restrictive terms in respect of our credit card arrangements. |
Any of the factors listed above could materially and adversely affect our business and our results of operations. Furthermore, our interest expense could increase if interest rates rise, since certain portions of our debt bear interest at floating rates. If we do not have sufficient cash flows to service our debt, we may be required to refinance all or part of our existing debt, sell assets, borrow more money or sell securities, none of which we can guarantee we will be able to do.
We may be able to incur significant additional indebtedness in the future. Although the agreements governing our indebtedness contain limitations on the incurrence of certain additional indebtedness, these limitations are subject to a number of important qualifications and exceptions, and the indebtedness incurred in compliance with these limitations could be substantial. If we incur new indebtedness, the related risks, including those described above, could intensify.
20
Table of Contents
We may not be able to generate sufficient cash to service all of our indebtedness, and we may be forced to take other actions to satisfy our obligations under our indebtedness that may not be successful.
Our ability to satisfy our debt obligations will depend upon, among other things:
| • | our future financial and operating performance, which will be affected by prevailing economic conditions and financial, business, regulatory and other factors, many of which are beyond our control; and |
| • | our ability to borrow additional debt or to access available borrowings under our Secured Credit Facilities, the availability of which depends on, among other things, our compliance with the covenants in Regent’s Senior Secured Notes and our Secured Credit Facilities. |
We cannot assure you that our business will generate sufficient cash flows from operations, or that we will be able to access available borrowings under our Secured Credit Facilities or otherwise in an amount sufficient to fund our liquidity needs. If our cash flows and capital resources are insufficient to service our indebtedness, we may be forced to reduce or delay capital expenditures, sell assets, seek additional capital or restructure or refinance our indebtedness. Our ability to restructure or refinance our indebtedness will depend upon numerous factors, including but not limited to the condition of the capital markets, our financial condition at such time, credit ratings and the performance of our industry in general. Any refinancing of our indebtedness could be at higher interest rates and may require us to comply with more onerous covenants, which could further restrict our business operations. In the absence of operating results or resources sufficient to service our indebtedness, we could also face substantial liquidity problems and might be required to dispose of material assets or operations to meet our debt service and other obligations. Some or all of our assets may be illiquid and may have no readily ascertainable market value, however, and we may not be able to consummate such dispositions for fair market value or at all. Furthermore, any proceeds that we could realize from any such dispositions may not be adequate to meet our debt service obligations when due. These alternative measures may not be successful and may not permit us to meet our scheduled debt service obligations. In addition, the terms of existing or future debt agreements may restrict us from adopting some of these alternatives.
The agreements governing our indebtedness contain restrictions that will limit our flexibility in operating our business.
The agreements governing our indebtedness contain, and any instruments governing future indebtedness of ours would likely contain, a number of covenants that impose operating and financial restrictions on us, including requirements under our newbuild debt that we maintain a minimum liquidity balance, a maximum debt to EBITDA ratio, a minimum EBITDA to debt service ratio and a maximum debt to adjusted equity ratio, requirements under our Secured Credit Facilities that we maintain a maximum loan-to-value ratio, a minimum interest coverage ratio (applicable only to revolving credit facilities) and restrictions under Regent’s Senior Secured Notes and our Secured Credit Facilities on our and our subsidiaries’ ability to, among other things:
| • | incur or guarantee additional indebtedness or issue preferred shares; |
| • | grant liens on assets; |
| • | pay dividends or make distributions to our shareholders; |
| • | repurchase or redeem capital stock or subordinated indebtedness; |
| • | make investments or acquisitions; |
| • | restrict the ability of our subsidiaries to pay dividends or to make other payments to us; |
| • | enter into transactions with our affiliates; |
| • | merge or consolidate with other companies or transfer all or substantially all of our assets; |
| • | transfer or sell assets; |
| • | pledge the capital stock issued by the guarantors of our indebtedness; and |
| • | designate our subsidiaries as unrestricted subsidiaries. |
21
Table of Contents
In addition, our ability to meet those financial covenants can be affected by events beyond our control, and there can be no assurance that we will meet those covenants. A failure to comply with these financial covenants could result in an event of default under the facilities or the existing agreements, which, if not cured or waived, could have a material adverse effect on our business, financial condition and results of operations. In the event of any default under Regent’s Senior Secured Notes and our Secured Credit Facilities or our other indebtedness, the holders of our indebtedness thereunder:
| • | will not be required to lend any additional amounts to us, if applicable; |
| • | could, in certain circumstances, elect to declare all indebtedness outstanding, together with accrued and unpaid interest and fees, to be due and payable and terminate all commitments to extend further credit, if applicable; or |
| • | could require us to apply all of our available cash to repay such indebtedness. |
Additionally, under the terms of the agreements governing our indebtedness, certain holders could bring actions against us that would cause cross defaults under our other indebtedness. If we were unable to repay those amounts, the holders of our indebtedness under Regent’s Senior Secured Notes and our Secured Credit Facilities could proceed against the collateral granted to them to secure that indebtedness. As a result of these restrictions, we would be limited in the manner in which we conduct our business, and we may be unable to engage in favorable business activities or finance future operations or capital needs.
The impact of disruptions in the global credit markets may adversely affect our ability to borrow and could increase our counterparty credit risks, including those under our Secured Credit Facilities, derivative instruments, contingent obligations and insurance contracts.
There can be no assurance that we will be able to borrow additional money on terms as favorable as our current debt, on commercially acceptable terms, or at all.
Economic downturns, including failures of financial institutions and any related liquidity crisis, can disrupt the capital and credit markets. Such disruptions could cause counterparties under our Secured Credit Facilities, derivative instruments, contingent obligations and insurance contracts to be unable to perform their obligations or to breach their obligations to us under our contracts with them, or result in failures of financial institutions to fund required borrowings under our Secured Credit Facilities and to pay us amounts that may become due under our derivative contracts and other agreements. We could also be limited in obtaining funds to pay amounts due to our counterparties under our derivative contracts and to pay amounts that may become due under other agreements. If we were to elect to replace any counterparty for its failure to perform its obligations under such instruments, we would likely incur significant costs to replace the counterparty. Any failure to replace any counterparties under these circumstances, however, may result in additional costs to us.
Increases in fuel prices or other cruise operating costs could have an adverse impact on our financial condition and results of operations.
Fuel costs accounted for 13.5% and 13.4% of our total cruise operating expenses for the nine months ended September 30, 2013 and the year ended December 31, 2012, respectively, as compared to 13.9% and 11.9% for the years ended December 31, 2011 and 2010, respectively. Economic, market and political conditions in certain parts of the world make it challenging to predict the future prices and availability of fuel. Future increases in fuel prices would increase our cost of cruise ship operations. We could also experience increases in other cruise operating costs, such as food, crew, port, repairs and maintenance, insurance and security costs, due to market forces and economic or political instability beyond our control. Despite any fuel hedges we are currently a party to or may enter into in the future, increases in fuel prices or other cruise operating costs could have a material adverse effect on our financial condition and results of operations if we are unable to recover these increased costs through price increases charged to our guests. Conversely, significant declines in fuel prices could result in margin calls under certain of our fuel hedges, which could create a short-term liquidity risk. While we anticipate
22
Table of Contents
that the costs of any such margin calls would be recouped over time as a result of lower fuel costs, any such margin calls may affect our ability to comply with the covenant obligations under Regent’s Senior Secured Notes and our Secured Credit Facilities
Conducting business internationally may result in increased costs and risks.
We operate our business internationally and plan to continue to develop our international presence. Operating internationally exposes us to a number of risks, including political risks, risks of increases in duties and taxes, risks relating to anti-bribery laws, as well as risks that laws and policies affecting cruising, vacation or maritime businesses, or governing the operations of foreign-based companies may change. Additional risks include interest rate movements, imposition of trade barriers, restrictions on repatriation of earnings, withholding and other taxes on remittances and other payments by subsidiaries, and changes in and application of foreign taxation structures, including value added taxes. Furthermore, we operate in waters and call at ports that have experienced political and civil unrest, insurrection and armed hostilities. If we are unable to address these risks adequately, our financial condition and results of operations could be adversely affected.
Operating internationally also exposes us to numerous and sometimes conflicting legal and regulatory requirements. In many parts of the world, including countries in which we operate, practices in the local business communities might not conform to international business standards. We must adhere to policies designed to promote legal and regulatory compliance as well as applicable laws and regulations. However, we might not be successful in ensuring that our employees, agents, representatives and other third parties with which we associate throughout the world properly adhere to them. Failure by us, our employees or any of these third parties to adhere to our policies or applicable laws or regulations could result in penalties, sanctions, damage to our reputation and related costs, which in turn could negatively affect our results of operations and cash flows.
Our efforts to expand our business into new markets may not be successful.
While our historical focus has been to serve the North American cruise market, we are expanding our focus to increase our international guest sourcing. Since the expansion of our fleet in 2011, we have worked to diversify the sourcing of our passengers worldwide. In 2010, 20.2% of our passengers were sourced from outside the United States, which grew to 25.3% in 2012. For the twelve months ended September 30, 2013, 26.6% of our passengers were sourced from outside the United States. We believe there remains significant opportunity to expand our passenger sourcing into major markets such as Europe and Australia, as well as into emerging markets in the Asia Pacific region. Expansion into new markets requires significant levels of investment. There can be no assurance that these markets will develop as anticipated or that we will have success in these markets, and if we do not, we may be unable to recover our investment spent to expand our business into these markets, which could adversely impact our business, financial condition and results of operations.
Fluctuations in foreign currency exchange rates could affect our financial results.
We have historically and may in the future enter into ship construction contracts denominated in euros. While we have entered into foreign currency swaps and collar options to manage a portion of the currency risk associated with such contracts, we are exposed to fluctuations in the euro exchange rate for the portions of the ship construction contracts that have not been hedged. Additionally, if the shipyard is unable to perform under the related ship construction contract, any foreign currency hedges that were entered into to manage the currency risk would need to be terminated. Termination of these contracts could result in a significant loss and materiality adversely affect our results of operations.
Delays in our shipbuilding program and ship repairs, maintenance and refurbishments could adversely affect our results of operations and financial condition.
The new construction, refurbishment, repair and maintenance of our cruise ships are complex processes and involve risks similar to those encountered in other large and sophisticated equipment construction, refurbishment
23
Table of Contents
and repair projects. Our ships are subject to the risk of mechanical failure or accident, which we have occasionally experienced and have had to repair. If there is a mechanical failure or accident in the future, we may be unable to procure spare parts when needed or make repairs without incurring material expense or suspension of service, especially if a problem affects certain specialized maritime equipment, such as the radar, a pod propulsion unit, the electrical/power management system, the steering gear or the gyro system.
In addition, availability, work stoppages, insolvency or financial problems in the shipyards’ construction, refurbishment or repair of our ships, or other “force majeure” events that are beyond our control and the control of shipyards or subcontractors, could also delay or prevent the newbuild delivery, refurbishment, repair and maintenance of our ships. Any termination or breach of contract following such an event may result in, among other things, the forfeiture of prior deposits or payments made by us, potential claims and impairment of losses. A significant delay in the delivery of a new ship, or a significant performance deficiency or mechanical failure of a new ship could also have an adverse effect on our business. The consolidation of the control of certain European cruise shipyards could result in higher prices for refurbishment and repairs due to reduced competition. Also, the lack of qualified shipyard repair facilities could result in the inability to repair and maintain our ships on a timely basis. These potential events and the associated losses, to the extent that they are not adequately covered by contractual remedies or insurance, could adversely affect our results of operations and financial condition.
We rely on external distribution channels for passenger bookings. Major changes in the availability of external distribution channels could undermine our customer base.
The majority of our passengers book their cruises through independent travel agents, wholesalers and tour operators. In the event that the travel agent distribution channel is adversely impacted by an economic downturn, this could reduce the distribution channels available for us to market and sell our cruises and we could be forced to use alternative distribution channels we are not accustomed to. If this were to occur, it could have an adverse impact on our financial condition and results of operations.
Additionally, independent travel agents, wholesalers and tour operators generally sell and market our cruises on a non-exclusive basis. Although we offer commissions and other incentives to them for booking our cruises, there can be no guarantee that our competitors will not offer higher commissions and incentives in the future. Travel agents may face increasing pressure from our competitors, particularly in the North American market, to sell and market our competitors’ cruises exclusively. If such exclusive arrangements were introduced, there can be no assurances that we will be able to find alternative distribution channels to ensure that our customer base would not be affected.
We rely on third parties to provide hotel management services for our vessels and certain other services, and we are exposed to risks facing such providers. In certain circumstances, we may not be able to replace such third parties or we may be forced to replace them at an increased cost to us.
We rely on external third parties to provide hotel management services for our vessels and certain other services that are vital to our business. If these service providers suffer financial hardship or are otherwise unable to continue providing such services, we cannot guarantee that we will be able to replace such service providers in a timely manner, which may cause an interruption in our operations. To the extent that we are able to replace such service providers, we may be forced to pay an increased cost for equivalent services. Both the interruption of operations and the replacement of the third-party service providers at an increased cost could adversely impact our financial condition and results of operations.
24
Table of Contents
We rely on scheduled commercial airline services for passenger and crew connections. Increases in the price of, or major changes or reduction in, commercial airline services could undermine our customer base or disrupt our operations.
A number of our passengers and crew depend on scheduled commercial airline services to transport them to ports of embarkation for our cruises. Increases in the price of airfare due to increases in fuel prices, fuel surcharges, changes in commercial airline services as a result of strikes, weather or other events, or the lack of availability due to schedule changes or a high level of airline bookings could adversely affect our ability to deliver guests and crew to or from our cruise ships and thereby increase our cruise operating expenses which would, in turn, have an adverse effect on our financial condition and results of operations.
Acts of terrorism, acts of piracy, armed conflict and threats thereof, and other international events impacting the security of travel could adversely affect the demand for cruises and as a result adversely affect our financial condition and results of operations.
Past acts of terrorism and piracy have had an adverse effect on tourism, travel and the availability of air service and other forms of transportation. The threat or possibility of future terrorist acts, an increase in or outbreak of additional hostilities or armed conflict abroad or the possibility thereof, an increase in the activity of pirates operating off the western coast of Africa or elsewhere, political unrest and instability, the issuance of government travel advisories, and other geopolitical uncertainties have had in the past and may again in the future have an adverse impact on the demand for cruises and consequently the pricing for cruises. Decreases in demand and reduced pricing in response to such decreased demand would adversely affect our financial condition and results of operations by reducing our profitability.
Our revenues are seasonal, owing to variations in passenger fare rates and occupancy levels at different times of the year. We may not be able to generate revenues that are sufficient to cover our expenses during certain periods of the year.
The demand for our cruises is seasonal, with greatest demand for cruises generally occurring during the third quarter. This seasonality in demand has resulted in fluctuations in our revenues and results of operations. The seasonality of our results is increased due to ships being taken out of service for drydocks, which we typically schedule during off-peak demand periods for such ships. Accordingly, seasonality in demand and drydock periods could adversely affect our ability to generate sufficient revenues to cover the expenses we incur during certain periods of the year.
Future epidemics and viral outbreaks may have an adverse effect on our financial condition and results of operations.
Public perception about the safety of travel and adverse publicity related to passenger or crew illness, including incidents of H1N1 flu, stomach flu, or other contagious diseases, may impact demand for cruises and result in cruise cancellations and employee absenteeism. Such events could decrease our future sales and increase our operating expenses, adversely affecting our financial condition and results of operations.
Adverse incidents and publicity involving cruise ships may have an adverse effect on our financial condition and results of operations.
The operation of cruise ships carries an inherent risk of loss caused by adverse events at sea or in port and by weather conditions. Adverse incidents could involve collisions, groundings, fire, oil spills, other maritime or environmental mishaps, mechanical failure, missing passengers, inappropriate crew or passenger behavior, onboard crimes, human errors, terrorism, piracy, political action and civil unrest or insurrection.
Adverse incidents such as these could result in increased costs, lost sales, injuries, loss of life or property or reputational damage. We could be forced to cancel a cruise or a series of cruises due to such events, resulting in
25
Table of Contents
reimbursements to passengers, increased port-related costs and lost revenue. If there is a significant accident, mechanical failure or similar problem involving a ship, we may have to place a ship in an extended drydock period for repairs. This could result in material lost revenue and/or expenditures, and there can be no assurance that insurance proceeds would compensate us fully or at all for our losses. We have experienced unscheduled drydocks in the past and there can be no assurances that we will not experience unexpected drydocks in the future. Any such event involving our cruise ships or other cruise ships may adversely affect passengers’ perceptions of safety, negatively affect future industry performance or result in increased governmental or other regulatory oversight. Such incidents also may lead to litigation against us. We may suffer penalties, fines and damages from judgments or settlements of any ongoing or future claims against us. Anything that damages our reputation (whether or not justified), including adverse publicity about passenger safety, could adversely impact demand and reduce our sales. Such incidents may have a material adverse impact on our financial condition and results of operations.
There can be no assurance that all risks are insured against or that any particular claim will be fully paid. Such losses, to the extent that they are not adequately covered by contractual remedies or insurance, could affect our financial condition and results of operations. We have been and may continue to be subject to calls, or premiums, in amounts based not only on our own claim records, but also the claim records of all other members of the protection and indemnity associations through which we receive indemnity coverage for tort liability. Our payment of these calls could result in significant expenses to us, which could reduce our cash flows. If we were to sustain significant losses in the future, our ability to obtain insurance coverage or coverage at commercially reasonable rates could be materially adversely affected.
Data security breaches, denial of service attacks, and/or disruptions to our information technology, telecommunications, and/or other networks could have an adverse impact on our financial results.
The integrity and reliability of our information technology, telecommunications, and other networks are crucial to our operations and financial results. Disruptions to these networks could impair our operations and have an adverse impact on our financial results, negatively affect our reputation and customer demand. In addition, certain networks are dependent on third-party technologies, systems and service providers for which there is no certainty of uninterrupted availability. Among other things, actual or threatened natural disasters (e.g., hurricanes, earthquakes, tornadoes, fires, floods) or similar events, information systems failures, computer viruses, denial or service attacks, and other cyber-attacks may cause disruptions to our information technology, telecommunications, and other networks. While we have and continue to invest in business continuity, disaster recovery and data restoration plans, we cannot completely insulate ourselves from disruptions that could result in adverse effects on our operations and financial results. We do not carry business interruption insurance for our ships based on our evaluation of the risks involved and protective measures already in place, as compared to the cost of insurance. We carry business interruption insurance for certain of our shoreside operations, subject to limitations, exclusions and deductibles.
In the event of a data security breach of our systems and/or third-party systems, we may incur costs associated with the following: breach response, notification, forensics, regulatory investigations, public relations, consultants, credit identity monitoring, credit freezes, fraud alert, credit identity restoration, credit card cancellation, credit card reissuance or replacement, regulatory fines and penalties, vendor fines and penalties, legal fees and damages. Denial of service attacks may result in costs associated with, among other things, the following: response, forensics, public relations, consultants, data restoration, legal fees and settlement. In addition, data security breaches or denial of service attacks may cause business interruption, information technology disruption, disruptions as a result of regulatory investigation, digital asset loss related to corrupted or destroyed data, damage to our reputation, damages to intangible property, and other intangible damages, such as loss of consumer confidence, all of which could impair our operations and have an adverse impact on our financial results. While we have and continue to invest in data and information technology security initiatives, we cannot completely insulate ourselves from the risks of data security breaches and denial of service attacks that could result in adverse effects on our operations and financial results. We carry privacy liability and network security insurance to partially cover us in the event of an attack.
26
Table of Contents
Unavailability of ports of call may adversely affect our results of operations and financial condition.
We believe that attractive port destinations are a major reason why passengers choose to go on a particular cruise versus an alternative vacation option. The availability of ports, including the specific port facility at which our guests will embark and disembark, is affected by a number of factors, including, but not limited to, existing capacity constraints, security, safety and environmental concerns, adverse weather conditions and natural disasters, financial limitations on port development, political instability, exclusivity arrangements that ports may have with our competitors, local governmental regulations and fees, local community concerns about port development and other adverse impacts on their communities from additional tourists, and sanctions programs implemented by the Office of Foreign Assets Control of the United States Treasury Department or other regulatory bodies. Any limitations on the availability of ports of call or on the availability of shore excursion and other service providers at such ports could adversely affect our results of operations and financial condition.
The loss of key personnel, our inability to recruit or retain qualified personnel or the diversion of our key personnel’s attention could adversely affect our results of operations.
We rely upon the ability, expertise, judgment, discretion, integrity and good faith of our senior management team. Our success is dependent upon our personnel and key consultants and our ability to recruit and retain high quality employees. We must continue to recruit, retain and motivate management and other employees sufficient to maintain our current business and support our projected growth. The loss of services of any of our key management, in particular, Mr. Frank J. Del Rio, our Chief Executive Officer, could have a material adverse effect on our business. See “Management” and “Executive Compensation” for additional information about our management personnel.
The leadership of our Chief Executive Officer and other executive officers has been a critical element of our success. The death or disability of Mr. Frank J. Del Rio or other extended or permanent loss of his services, or any negative market or industry perception with respect to him or arising from his loss, could have a material adverse effect on our business. Our other executive officers and other members of senior management have substantial experience and expertise in our business and have made significant contributions to our growth and success. The unexpected loss of services of one or more of these individuals could also adversely affect us. We are not protected by key person or similar life insurance covering members of our senior management. We have employment agreements with certain of our executive officers, but these agreements do not guarantee that any given executive will remain with us.
A failure to keep pace with developments in technology could impair our operations or competitive position.
Our business continues to demand the use of sophisticated systems and technology. These systems and technologies must be refined, updated and replaced with more advanced systems on a regular basis in order for us to meet our customers’ demands and expectations. If we are unable to do so on a timely basis or within reasonable cost parameters, or if we are unable to appropriately and timely train our employees to operate any of these new systems, our business could suffer. We also may not achieve the benefits that we anticipate from any new system or technology, such as fuel abatement technologies, and a failure to do so could result in higher than anticipated costs or could impair our operating results.
Our sponsor controls us, and the interests of our sponsor may conflict with or differ from our interests or the interests of our public shareholders.
Prior to this offering, Apollo beneficially owned approximately 59% of our outstanding ordinary shares, and immediately after giving effect to this offering, Apollo will own approximately % of our outstanding ordinary shares (without giving effect to the exercise of the underwriters’ option to purchase additional shares). The PCI Stockholders’ Agreement (as defined herein) gives Apollo effective control over our affairs and policies, subject to certain limitations. Apollo also controls the election of our Board of Directors, the appointment of management, the entering into of mergers, sales of substantially all of our assets and other material transactions. In addition, three of our directors are affiliated with Apollo. As a result, Apollo, through
27
Table of Contents
the PCI Stockholders’ Agreement and its voting and board control, has the ability to control our policies and business, including the election of our directors, the approval of significant transactions such as mergers and tender offers and the sale of all or substantially all of our assets. Apollo also has the authority, subject to the terms of the agreements governing our indebtedness, to issue additional debt, implement debt repurchase programs, pay dividends, pay advisory fees (including to itself or its affiliates) and make other key decisions, and they may do so at any time. The interests of Apollo and its affiliates could conflict with or differ from our interests or the interests of our public shareholders.
Furthermore, Apollo is in the business of making investments in companies, and may from time to time acquire and hold interests in businesses that compete directly or indirectly with us. For example, Apollo is a significant shareholder and controls the board of Norwegian Cruise Line Holdings Ltd., which, though it does not compete with us in the Luxury segment, competes with us indirectly as a cruise operator. Any such investment may increase the potential for conflicts of interest. There are no agreements that govern the outcome of any conflicts of interests among us and any affiliates of Apollo. There is no assurance that when conflicts of interest arise, any or all of these affiliates will act in our best interests or that any conflict of interest will be resolved in our favor. Moreover, the concentration of ownership held by Apollo could delay, defer or prevent a change of control of our company or impede a merger, takeover or other business combination that may otherwise be viewed favorably to us. Apollo may also pursue acquisition opportunities that may be complementary to our business, and as a result, those acquisition opportunities may not be available to us. Certain provisions of the PCI Stockholders’ Agreement may also make it more difficult to reissue additional equity capital in the future, if needed. See “Certain Relationships and Related Party Transactions—Stockholders’ Agreement.”
Risks Related to the Regulatory Environment in Which We Operate
Future changes in applicable tax laws, or our inability to take advantage of favorable tax regimes, may have an adverse impact on our financial condition and results of operations.
As we generally derive revenue from shipboard activity in international waters and not in a particular jurisdiction, our exposure to income tax is limited in some instances. We do, however, submit to the income tax regimes of the jurisdictions in which we operate and pay taxes as required by those regimes.
It is possible that certain states, countries or ports of call that our ships visit may decide to assess new taxes or fees or change existing taxes or fees specifically applicable to the cruise industry and its employees and/or guests, which could adversely affect our financial condition and results of operations.
Provided that we satisfy certain complex stock ownership tests (as described below), income that is considered to be derived from the international operation of ships, as well as certain income that is considered to be incidental to such income (“Shipping Income”), is currently exempt from U.S. federal income taxes under Section 883 of the Internal Revenue Code of 1986, as amended (the “Code”). The U.S.-source portion of our Shipping Income (if we do not qualify for the exemption under Section 883 of the Code) and the U.S.-source portion of our income that is not Shipping Income are generally subject to U.S. federal corporate income tax on a net basis (generally at a 35% rate) and possible state and local taxes, and our effectively connected earnings and profits generally are subject to an additional branch profits tax of 30%. See “Business—Taxation—U.S. Federal Income Taxation of Regent and Oceania Shipping Income.”
We believe substantially all of our income derived from the international operation of ships is properly categorized as Shipping Income, and that our income other than Shipping Income is not currently, nor is it expected to become, a material amount. It is possible, however, that a material amount of our income does not actually qualify (or will not qualify) as Shipping Income.
Even if our interpretation of Section 883 is correct, the exemption for Shipping Income is not applicable in any year in which we do not satisfy complex stock ownership tests. While we believe that we have satisfied the
28
Table of Contents
ownership tests and expect to continue to do so absent a material change in our ownership, the application of these tests is subject to some uncertainty and there is no assurance that our view is correct. Further, for the exemption for Shipping Income to apply, we must satisfy the Substantiation Requirements (as defined herein). While we expect we will satisfy such requirements, we can give no assurance that we will be able to do so. Additionally, any change in our operations could change the amount of our income that is considered Shipping Income under Section 883. Finally, any change in the tax laws governing our operations, including Section 883 of the Code and the regulations thereunder, could increase the amount of our income that is subject to tax. Any of the foregoing risks could significantly increase our exposure to U.S. federal income and branch profits taxes.
The Seven Seas Navigator and Seven Seas Voyager were operated by subsidiaries that were strategically and commercially managed in the United Kingdom (“UK”) and these subsidiaries had elected to enter the UK tonnage tax regime. Effective February 4, 2013, both ships exited the UK tonnage tax regime upon transfer of the ships to U.S. subsidiaries.
We are subject to complex laws and regulations, including environmental laws and regulations, which could adversely affect our operations. Any changes in the current laws and regulations could lead to increased costs or decreased revenue and adversely affect our business prospects, financial condition and results of operations.
Increasingly stringent federal, state, local and international laws and regulations on environmental protection, and the health and safety of workers could affect our operations. Many aspects of the cruise industry are subject to governmental regulation by the U.S. Environmental Protection Agency, the International Maritime Organization, (the “IMO”), the Council of the European Union, and the U.S. Coast Guard, as well as international treaties such as the International Convention for the Safety of Life at Sea (“SOLAS”), the International Convention for the Prevention of Pollution from Ships (“MARPOL”) and the Standard of Training Certification and Watchkeeping for Seafarers (“STCW”). For example, international regulations regarding ballast water and shipboard/shoreside security have been adopted. Additionally, the U.S. federal and various state, foreign and international regulatory agencies have enacted or are considering new environmental regulations or policies, such as requiring the use of low sulfur fuels, increasing fuel efficiency requirements, restricting diesel engine emissions and managing cruise ship waste. Compliance with such laws and regulations may entail significant expenses for ship modifications and changes in operating procedures, which could adversely impact our operations as well as our competitors’ operations. For example, in 2010, Alaska issued a final permit that regulates discharges of treated wastewater from cruise ships for the summer tourist seasons running from 2010 to 2012. The permit requires cruise companies to gather data on performance of new shipboard environmental control systems that will allow a scientific review committee to advise state officials on improving the regulations. These issues are, and we believe will continue to be, an area of focus by the relevant authorities throughout the world. This could result in the enactment of more stringent regulation of cruise ships that would subject us to increasing compliance costs in the future.
We may be subject to taxation under the laws of certain jurisdictions.
We may be subject to state, local and non-U.S. income or non-income taxes in various jurisdictions, including those in which we transact business, own property or reside. We may be required to file tax returns in some or all of those jurisdictions. Our state, local or non-U.S. tax treatment may not conform to the U.S. federal income tax treatment of Section 883 of the Code discussed above. We may be required to pay non-U.S. taxes on dispositions of foreign property and operations involving foreign property may give rise to non-U.S. income or other tax liabilities in amounts that could be substantial. For example, we operated Seven Seas Navigator and Seven Seas Voyager under long-term charter agreements by subsidiaries that were strategically and commercially managed in the UK. These charter agreements are subject to the ongoing review of the taxing authorities in these jurisdictions and such review could result in the imposition of additional taxes in such jurisdictions.
29
Table of Contents
The various tax regimes to which we are currently subject result in a relatively low effective tax rate on our world-wide income. These tax regimes, however, are subject to change. Moreover, we may become subject to new tax regimes and may be unable to take advantage of favorable tax provisions afforded by current or future law.
Litigation, enforcement actions, fines or penalties could adversely impact our financial condition or results of operations and damage our reputation.
Our business is subject to various U.S. and international laws and regulations that could lead to enforcement actions, fines, civil or criminal penalties or the assertion of litigation claims and damages. In addition, improper conduct by our employees or agents could damage our reputation and/or lead to litigation or legal proceedings that could result in civil or criminal penalties, including substantial monetary fines. In certain circumstances, it may not be economical to defend against such matters, and a legal strategy may not ultimately result in us prevailing in a matter. Such events could lead to an adverse impact on our financial condition or results of operations.
As a result of any ship-related or other incidents, litigation claims, enforcement actions and regulatory actions and investigations, including, but not limited to, those arising from personal injury, loss of life, loss of or damage to personal property, business interruption losses or environmental damage to any affected coastal waters and the surrounding area, may be asserted or brought against various parties including us and/or our cruise brands. The time and attention of our management may also be diverted in defending such claims, actions and investigations. Subject to applicable insurance coverage, we may also incur costs both in defending against any claims, actions and investigations and for any judgments, fines, civil or criminal penalties if such claims, actions or investigations are adversely determined.
Risks Related to the Offering and to Our Ordinary Shares
There has been no prior market for our ordinary shares, and an active trading market for our ordinary shares may not develop, which could impede your ability to sell your ordinary shares and depress the market price of your ordinary shares.
Prior to this offering, there has been no public market for our ordinary shares, and we cannot assure you that an active and liquid public market for our ordinary shares will develop or be sustained after this offering or that investors will in the future be able to sell the ordinary shares they purchase in this offering should they desire to do so. The failure of an active trading market to develop could affect your ability to sell your ordinary shares and depress the market price of your ordinary shares. We will negotiate with the representatives of the underwriters to determine the initial public offering price, which will be based on numerous factors and may bear no relationship to the price at which the ordinary shares will trade upon completion of this offering. See “Underwriting.” The market price of the ordinary shares may fall below the initial public offering price.
The price of our shares may fluctuate substantially, and your investment may decline in value.
The trading price of our ordinary shares could be volatile and subject to wide fluctuations in response to various factors, many of which are beyond our control, including those described in this “Risk Factors” section. Further, the stock markets in general, and the stock exchange and the market for travel and leisure-related companies in particular, have experienced extreme price and volume fluctuations that have often been unrelated or disproportionate to the operating performance of these companies. We cannot assure you that trading prices and valuations of our ordinary shares will be sustained. These broad market and industry factors may materially and adversely affect the market price of our ordinary shares, regardless of our operating performance. Market fluctuations, as well as general political and economic conditions in the countries where we operate, such as recession or currency exchange rate fluctuations, may also adversely affect the market price of our ordinary shares. In the past, following periods of volatility in the market price of a company’s securities, that company is often subject to securities class-action litigation. This kind of litigation, regardless of the outcome, could result in substantial costs and a diversion of management’s attention and resources, which could have a material adverse effect on our business, results of operations and financial condition.
30
Table of Contents
We are a “controlled company” within the meaning of the rules of and, as a result, will qualify for, and intend to rely on, exemptions from certain corporate governance requirements.
Upon the closing of this offering, Apollo will continue to control a majority of our ordinary shares. As a result, we will be a “controlled company” within the meaning of the corporate governance standards of . Under the rules of , a company of which more than 50% of the voting power is held by an individual, group or another company is a “controlled company” and may elect not to comply with certain corporate governance requirements, including:
| • | the requirement that a majority of our Board of Directors consists of independent directors; |
| • | the requirement that we have a nominating and governance committee that is composed entirely of independent directors with a written charter addressing the committee’s purpose and responsibilities; |
| • | the requirement that we have a compensation committee that is composed entirely of independent directors with a written charter addressing the committee’s purpose and responsibilities; and |
| • | the requirement for an annual performance evaluation of the nominating and governance committee and compensation committee. |
Following this offering, we intend to utilize these exemptions. As a result, we will not have a majority of independent directors nor will be required to have any independent directors on our Nominating and Governance Committee and Compensation Committee, and we will not be required to have an annual performance evaluation of the Nominating and Governance Committee and Compensation Committee. See “Management.” Accordingly, you will not have the same protections afforded to shareholders of companies that are subject to the general corporate governance requirements (without giving effect to the “controlled company” exemptions) of .
Because the price you will pay for our ordinary shares is above our net tangible book value per ordinary share, you will experience an immediate and substantial dilution upon the completion of this offering.
The initial public offering price of our ordinary shares is substantially higher than what the net tangible book value per ordinary share will be immediately after this offering. If you purchase our ordinary shares in this offering, you will experience immediate dilution of approximately $ in the net tangible book value per ordinary share from the price you pay for our ordinary shares, representing the difference between (1) the assumed initial public offering price of $ per ordinary share, which is the midpoint of the range shown on the cover of this prospectus, and (2) the pro forma net tangible book value per ordinary share of $ at September 30, 2013, after giving effect to this offering. For additional information on discussion of the effect of a change in the price of this offering see “Dilution.”
As a shareholder of our Company, you may have greater difficulties in protecting your interests than as a shareholder of a U.S. corporation.
We are a Panamanian corporation (“sociedad anónima”). Under Panamanian law, the protections afforded to minority shareholders are different from, and much more limited than, those in the United States and some other Latin American countries. For example, the legal framework with respect to shareholder disputes is less developed under Panamanian law than under U.S. law and there are different procedural requirements for bringing shareholder lawsuits, including shareholder derivative suits. As a result, it may be more difficult for our minority shareholders to enforce their rights against us or our directors or controlling shareholder than it would be for shareholders of a U.S. company. In addition, Panamanian law does not afford minority shareholders as many protections for investors through corporate governance mechanisms as in the United States and provides no mandatory tender offer or similar protective mechanisms for minority shareholders in the event of a change in control.
31
Table of Contents
If we are unable to implement and maintain effective internal control over financial reporting, investors may lose confidence in the accuracy and completeness of our financial reports and the market price of our ordinary shares may be negatively affected.
As a public company, we will be required to maintain internal controls over financial reporting and to report any material weaknesses in such internal controls. We are in the process of designing, implementing and testing the internal control over financial reporting in order to furnish a report by management on the effectiveness of our internal control over financial reporting pursuant to Section 404 of the Sarbanes-Oxley Act of 2002 (the “Sarbanes-Oxley Act”). In the past, material weaknesses in our internal control over financial reporting have been identified relating to derivatives and stock compensation, which have been remediated. In the future, if we identify material weaknesses in our internal control over financial reporting, or if we are unable to comply with the requirements of Section 404 in a timely manner, or if our independent registered public accounting firm is unable to express an opinion as to the effectiveness of our internal control over financial reporting, investors may lose confidence in the accuracy and completeness of our financial reports and the market price of our ordinary shares could be negatively affected.
The market price for our ordinary shares could be subject to wide fluctuations, and you could lose all or part of your investment.
The market price for our ordinary shares could be volatile and subject to wide fluctuations in response to factors including the following:
| • | actual or anticipated fluctuations in our quarterly results; |
| • | the public reaction to our press releases, other public announcements and filings with the SEC; |
| • | sales of large blocks of our ordinary shares, or the expectation that such sales may occur, including sales by our directors, officers, Apollo or other significant shareholders; |
| • | market and industry perception of our success, or lack thereof, in pursuing our growth strategy; |
| • | announcements of new itineraries or services or the introduction of new ships by us or our competitors; |
| • | changes in financial estimates by securities analysts; |
| • | conditions in the cruise industry; |
| • | price and volume fluctuations in the stock markets generally; |
| • | announcements by our competitors of significant acquisitions, strategic partnerships, joint ventures or capital commitments; |
| • | our involvement in a significant acquisition, strategic alliance or joint venture; |
| • | changes in government and environmental regulation; |
| • | additions or departures of key personnel; |
| • | changes in general market, economic and political conditions in the United States and global economies or financial markets, including those resulting from natural disasters, terrorist attacks, acts of war and responses to such events; |
| • | changes in accounting standards, policies, guidance, interpretations or principles; or |
| • | potential litigation. |
In addition, the securities markets have from time to time experienced significant price and volume fluctuations that are not related to the operating performance of particular companies. These market fluctuations may also materially and adversely affect the market price of our shares.
32
Table of Contents
The substantial number of ordinary shares that will be eligible for sale in the near future may cause the market price of our ordinary shares to decline.
Immediately after the completion of this offering, we will have an aggregate of ordinary shares issued and outstanding (without giving effect to the exercise of the underwriters’ option to purchase additional shares). Our ordinary shares sold in this offering will be eligible for immediate resale in the public market without restrictions, and those held by Apollo and key employees may also be sold in the public market in the future subject to applicable lock-up agreements as well as the restrictions contained in Rule 144 under the Securities Act of 1933, as amended (the “Securities Act”). If Apollo sells a substantial amount of our ordinary shares after the expiration of the lock-up period, the prevailing market price for our ordinary shares could be adversely affected. See “Shares Eligible for Future Sale.”
We may issue our ordinary shares or other securities from time to time as consideration for future acquisitions and investments. If any such acquisition or investment is significant, the number of ordinary shares, or the number or aggregate principal amount, as the case may be, of other securities that we may issue may in turn be substantial. We may also grant registration rights covering those ordinary shares or other securities in connection with any such acquisitions and investments.
We may use the proceeds of this offering in ways with which you may not agree.
Although we currently intend to use the proceeds of this offering to repay outstanding indebtedness and to pay expenses associated with this offering, our management will have considerable discretion in the application of the net proceeds received by us. You will not have the opportunity, as part of your investment decision, to assess whether the proceeds are being used appropriately. You must rely on the judgment of our management regarding the application of the net proceeds of this offering. The net proceeds may be used for corporate purposes that do not improve our efforts to achieve profitability or increase the price of our ordinary shares.
We do not intend to pay dividends on our ordinary shares at any time in the foreseeable future.
We do not currently intend to pay dividends to our shareholders and our Board of Directors may never declare a dividend. You should not anticipate receiving dividends with respect to ordinary shares that you purchase in the offering. The agreements governing our indebtedness limit or prohibit, and any of our future debt arrangements may restrict, among other things, the ability of our subsidiaries to pay distributions to us and our ability to pay cash dividends to our shareholders. In addition, any determination to pay dividends in the future will be entirely at the discretion of our Board of Directors and will depend upon our results of operations, cash requirements, financial condition, business opportunities, contractual restrictions, restrictions imposed by applicable law and other factors that our Board of Directors deems relevant. We are not legally or contractually required to pay dividends. Accordingly, if you purchase ordinary shares in this offering, it is likely that in order to realize a gain on your investment, the price of our ordinary shares will have to appreciate. This may or may not occur. In addition, we are a holding company and would depend upon our subsidiaries for their ability to pay distributions to us to finance any dividend or pay any other of our obligations. Investors seeking dividends should not purchase our ordinary shares. See “Dividend Policy.”
Enforcement of civil liabilities against us by our shareholders and others may be difficult.
We are a corporation (“sociedad anónima”) incorporated under the laws of Panama. In addition, certain of our subsidiaries are organized outside the United States. A substantial portion of our assets are located outside the United States. As a result, it may not be possible for investors to effect service of process upon us or upon such persons within the United States or to enforce judgments obtained in U.S. courts against us or them predicated upon the civil liability provisions of the U.S. federal securities laws. Furthermore, we have been advised by counsel in Panama that Panamanian courts will not enforce a U.S. federal securities law that is either penal or contrary to the public policy of Panama. An action brought pursuant to a public or penal law, the purpose of which is the enforcement of a sanction, power or right at the instance of the state in its sovereign
33
Table of Contents
capacity, may not be entertained by a Panamanian court. Certain remedies available under the laws of U.S. jurisdictions, including certain remedies under U.S. federal securities laws, may not be available under Panamanian law or enforceable in a Panamanian court, as they may be contrary to Panamanian public policy. Further, no claim may be brought in Panama against us or our directors and officers in the first instance for violations of U.S. federal securities laws, because these laws have no extraterritorial jurisdiction under Panamanian law and do not have force of law in Panama. A Panamanian court may, however, impose civil liability on us or our directors and officers if the facts alleged in a complaint constitute or give rise to a cause of action under Panama law.
Provisions in our constitutional documents may prevent or discourage takeovers and business combinations that our shareholders might consider to be in their best interests.
Following the consummation of this offering, our by-laws will contain provisions that may delay, defer, prevent or render more difficult a takeover attempt that our shareholders consider to be in their best interests. As a result, these provisions may prevent our shareholders from receiving a premium to the market price of our shares offered by a bidder in a takeover context. Even in the absence of a takeover attempt, the existence of these provisions may adversely affect the prevailing market price of our shares if they are viewed as discouraging takeover attempts in the future. These provisions include (subject to the PCI Stockholders’ Agreement):
| • | the ability of our Board of Directors to designate one or more series of preference shares and issue preference shares without shareholder approval; |
| • | a classified board of directors; |
| • | the sole power of a majority of our Board of Directors to fix the number of directors; |
| • | the power of our Board of Directors to fill any vacancy on our Board of Directors in most circumstances, including when such vacancy occurs as a result of an increase in the number of directors or otherwise; and |
| • | advance notice requirements for nominating directors or introducing other business to be conducted at shareholder meetings. |
Additionally, our by-laws will contain provisions that prevent third parties, other than Apollo, from acquiring beneficial ownership of more than 4.9% of our outstanding shares without the consent of our Board of Directors, and will provide for the lapse of rights, and sale, of any shares acquired in excess of that limit. The effect of these provisions, as well as the significant ownership of ordinary shares by Apollo, may preclude third parties from seeking to acquire a controlling interest in us in transactions that shareholders might consider to be in their best interests, and may prevent shareholders from receiving a premium above market price for their shares. See “Certain Relationships and Related Party Transactions—Stockholders’ Agreement” and “Description of Capital Stock.”
Any issuance of preferred shares could make it difficult for another company to acquire us or could otherwise adversely affect holders of our ordinary shares, which could depress the price of our ordinary shares.
Our Board of Directors has the authority to issue preferred shares and to determine the preferences, limitations and relative rights of shares of preferred shares and to fix the number of shares constituting any series and the designation of such series, without any further vote or action by our shareholders, subject to the PCI Stockholders’ Agreement. Our preferred shares could be issued with voting, liquidation, dividend and other rights superior to the rights of our ordinary shares. The potential issuance of preferred shares may delay or prevent a change in control of us, discouraging bids for our ordinary shares at a premium over the market price, and adversely affect the market price and the voting and other rights of the holders of our ordinary shares. See “Description of Capital Stock.”
34
Table of Contents
We estimate that we will receive net proceeds from the sale of our ordinary shares in this offering of approximately $ million, after deducting the underwriting discount and estimated offering expenses, assuming the ordinary shares are offered at $ per share, which is the midpoint of the estimated offering price range set forth on the cover page of this prospectus, and assuming that the underwriters do not exercise their option to purchase additional shares.
We intend to use the net proceeds from this offering (i) to redeem $ million of Regent’s outstanding Senior Secured Notes, (ii) to repay $ million of the Oceania Term Loan and $ million of the Regent Term Loan and (iii) for future capital expenditures and general corporate purposes.
As of September 30, 2013, we had $225.0 million in aggregate principal amount of Senior Secured Notes outstanding, which bear interest at an annual rate of 9.125% and mature on May 15, 2019. As of September 30, 2013, we had approximately $300.0 million in principal amount outstanding under the Oceania Term Loan, which bears interest at LIBOR with a floor of 1% plus an applicable margin of 5.75% and matures in July 2020. As of September 30, 2013, we had approximately $296.3 million in principal amount outstanding under the Regent Term Loan, which bears interest at LIBOR with a floor of 1.25% plus an applicable margin and matures in December 2018.
A $1.00 increase or decrease in the assumed initial public offering price of $ per share would increase or decrease, as applicable, the net proceeds to us from this offering by approximately $ million (or $ million if the underwriters exercise in full their option to purchase additional shares), assuming the number of shares offered by us remains the same as set forth on the cover page of this prospectus and after deducting the underwriting discount and estimated offering expenses.
35
Table of Contents
We have no current plans to pay dividends on our ordinary shares. The agreements governing our indebtedness prohibit, among other things, our ability to pay cash dividends to our shareholders above specified levels. Our future dividend policy will also depend on the requirements of any future financing agreements to which we may be a party and other factors considered relevant by our Board of Directors. In addition, any determination to pay dividends in the future will be at the discretion of our Board of Directors and will depend upon our results of operations, financial condition, contractual restrictions, restrictions imposed by applicable law and other factors that our Board of Directors deems relevant.
We did not declare or pay any dividends on our ordinary shares in 2010, 2011, 2012, or during the nine months ended September 30, 2013.
36
Table of Contents
The following table sets forth our capitalization as of September 30, 2013:
| • | on an actual basis; and |
| • | on an as adjusted basis to give effect to (i) the restructuring and capitalization of our related party debt and (ii) the issuance of the ordinary shares in this offering and the application of the net proceeds therefrom, as described under “Use of Proceeds.” |
You should read this table together with the information contained in this prospectus, including “Use of Proceeds,” “Selected Consolidated Financial Data,” “Unaudited Pro Forma Consolidated Financial Data,” “Management’s Discussion and Analysis of Financial Condition and Results of Operations,” “Description of Certain Indebtedness” and our historical financial statements and related notes included elsewhere in this prospectus.
| As of September 30, 2013 | ||||||||
| (in thousands, except share and per share data) | Actual | As adjusted (1) | ||||||
| Cash and cash equivalents |
$ | 263,781 | ||||||
|
|
|
|
|
|||||
| Oceania Term Loan, First Lien, due through 2020 |
$ | 300,000 | ||||||
| Oceania Marina Newbuild Debt, due through 2023 |
424,123 | |||||||
| Oceania Riviera Newbuild Debt, due through 2024 |
471,611 | |||||||
| Regent Term Loan, First Lien, due through 2018 |
296,250 | |||||||
| Regent Senior Secured Notes, due 2019 |
225,000 | |||||||
|
|
|
|
|
|||||
| Total third party debt (2) |
1,716,984 | |||||||
| Related party notes payable (3) |
853,159 | |||||||
| Shareholders’ Equity: |
||||||||
| Ordinary shares, $.01 par value; 100,000,000 shares authorized and 13,572,765 shares issued and outstanding; shares authorized and shares issued and outstanding, as adjusted |
136 | |||||||
| Additional paid-in capital |
306,651 | |||||||
| Accumulated other comprehensive loss |
(211,201 | ) | ||||||
| Accumulated deficit |
(59,009 | ) | ||||||
|
|
|
|
|
|||||
| Total shareholders’ equity |
36,577 | |||||||
|
|
|
|
|
|||||
| Total capitalization |
$ | 2,606,720 | $ | |||||
|
|
|
|
|
|||||
| (1) | Each $1.00 increase or decrease in the assumed initial public offering price of $ per share would increase or decrease, as applicable, the amount of our as adjusted long-term debt, additional paid-in capital and total stockholders’ equity by approximately $ million, assuming the number of shares offered by us remains the same as set forth on the cover page of this prospectus and after deducting the estimated underwriting discounts and commissions and estimated offering expenses that we must pay. |
| (2) | Excludes the debt discount of $31.0 million as of September 30, 2013. |
| (3) | Excludes the related unamortized discount of $154.2 million as of September 30, 2013. |
37
Table of Contents
If you invest in our ordinary shares in this offering, your investment will be immediately diluted to the extent of the difference between the initial public offering price per ordinary share and the net tangible book value per ordinary share upon completion of this offering. Dilution results from the fact that the per share offering price of the ordinary shares is substantially in excess of the net tangible book value per share attributable to the ordinary shares held by existing owners.
Our net tangible book value as of September 30, 2013 was $ million, or $ per share, based on 13,572,765 shares outstanding as of September 30, 2013. Net tangible book value per ordinary share is equal to our total tangible assets less total liabilities, divided by the number of issued and outstanding ordinary shares as of the most recent quarter for which financial statements are available.
After giving effect to (a) our sale of ordinary shares in this offering at an assumed initial public offering price of $ per share, which is the midpoint of the price range per share of ordinary shares set forth on the cover of this prospectus, and after deducting the underwriting discount and estimated offering expenses, and (b) our issuance of ordinary shares upon the exercise of outstanding options and our receipt of the aggregate exercise price therefrom since September 30, 2013, our net tangible book value as of September 30, 2013 would have been approximately $ million, or $ per share. This represents an immediate increase in net tangible book value of $ per share to our existing shareholders and an immediate dilution of $ per share to new investors purchasing ordinary shares in this offering at the assumed initial public offering price. The following table illustrates the per share dilution on a per share basis:
The following table illustrates the per share dilution on a per ordinary share basis:
| Assumed initial public offering price per share |
$ | |||
|
|
|
|||
| Net tangible book value per share as of September 30, 2013 |
||||
| Increase in net tangible book value per share attributable to existing shareholders |
||||
| Increase in net tangible book value attributable to exercise of stock options |
||||
| Net tangible book value per share after giving effect to this offering |
||||
|
|
|
|||
| Dilution per share to new investors in this offering |
$ | |||
|
|
|
A $1.00 increase or decrease in the assumed initial public offering price of $ per ordinary share would increase or decrease, as applicable, our net tangible book value after giving effect to this offering by $ million, or by $ per ordinary share, assuming the number of shares offered by us remains the same and after deducting the underwriting discount and the estimated offering expenses payable by us.
If the underwriters’ option to purchase additional ordinary shares from us is exercised in full, the net tangible book value per ordinary share, as adjusted to give effect to this offering, would be $ per share, and the dilution in net tangible book value per share to new investors in this offering would be $ per share.
38
Table of Contents
The following table summarizes as of September 30, 2013, on an adjusted basis, the number of ordinary shares purchased from us, the total consideration paid to us and the average price per share paid by existing shareholders and by new investors purchasing ordinary shares in this offering (before deducting the estimated underwriting discount and estimated offering expenses) based upon an assumed initial public offering price of $ per share, which is the midpoint of the price range per share of ordinary shares set forth on the cover of this prospectus, before deducting the underwriting discount and estimated offering expenses:
| Shares Purchased | Total Consideration | Average Price Per Share |
||||||||||||||||
| Number | Percent | Amount | Percent | |||||||||||||||
| Existing shareholders |
% | $ | % | $ | ||||||||||||||
| New investors in this offering |
||||||||||||||||||
|
|
|
|
|
|
|
|
|
|
||||||||||
| Total |
% | $ | % | $ | ||||||||||||||
|
|
|
|
|
|
|
|
|
|
||||||||||
Each $1.00 increase or decrease in the assumed offering price of $ per share, which is the midpoint of the estimated offering price range set forth on the cover page of this prospectus, would increase or decrease, as applicable, the total consideration paid by investors in this offering and total consideration paid by all shareholders by $ million, assuming the number of shares offered by us remains the same and after deducting the underwriting discount and the estimated offering expenses payable by us.
Except as otherwise indicated, the above discussion and tables assume no exercise of the underwriters’ option to purchase additional ordinary shares from us. If the underwriters’ option to purchase additional ordinary shares were exercised in full, our existing shareholders would own % and our new investors in this offering would own % of the total number of our ordinary shares outstanding upon the completion of this offering.
The dilution information above is for illustration purposes only. Our net tangible book value following the consummation of this offering is subject to adjustment based on the actual initial public offering price of our shares and other terms of this offering determined at pricing.
The number of our ordinary shares that will be outstanding after this offering is based on ordinary shares outstanding as of the date of this prospectus, and excludes ordinary shares issuable upon the exercise of options to purchase our ordinary shares outstanding as of the date of this prospectus, with a weighted-average exercise price of $ per share.
As of the date of this prospectus, there are options outstanding to purchase a total of shares of ordinary shares with a weighted average exercise price of $ per share and there are shares available for future awards. To the extent that any of these additional options are exercised, there will be further dilution to new public investors. See “Capitalization,” “Executive Compensation—Equity Incentive Plan Awards” and the notes to our consolidated financial statements included elsewhere in this prospectus.
39
Table of Contents
SELECTED CONSOLIDATED FINANCIAL DATA
The following table sets forth our selected consolidated financial data as of the dates and for the periods indicated. The selected consolidated financial data for the years ended December 31, 2012, 2011 and 2010 and as of December 31, 2012 and 2011 have been derived from our audited consolidated financial statements and related notes included elsewhere in this prospectus. The selected consolidated financial data for the years ended December 31, 2009 and 2008 and as of December 31, 2010, 2009, and 2008 have been derived from our audited consolidated financial statements not included in this prospectus. We derived the selected consolidated statement of operations data for the nine months ended September 30, 2013 and 2012 and the selected consolidated balance sheet data as of September 30, 2013 from our unaudited condensed consolidated financial statements included elsewhere in this prospectus. We have prepared our unaudited condensed consolidated financial statements on the same basis as our audited consolidated financial statements and, in our opinion, have included all adjustments, which include only normal recurring adjustments, necessary to present fairly in all material respects our financial position and results of operations. The results for any interim period are not necessarily indicative of the results that may be expected for the full year.
The historical results set forth below do not necessarily indicate results expected for any future period, and should be read in conjunction with, “Risk Factors,” “Management’s Discussion and Analysis of Financial Condition and Results of Operations,” “Description of Certain Indebtedness” and our consolidated financial statements and related notes thereto included elsewhere in this prospectus.
40
Table of Contents
| (in thousands, except per share data) | Nine Months Ended September 30, |
Year Ended December 31, | ||||||||||||||||||||||||||
| 2013 | 2012 | 2012 | 2011 | 2010 | 2009 | 2008 | ||||||||||||||||||||||
| Statement of operations data: |
||||||||||||||||||||||||||||
| Revenues: |
||||||||||||||||||||||||||||
| Passenger ticket |
$ | 779,309 | $ | 731,629 | $ | 947,071 | $ | 834,868 | $ | 642,068 | $ | 529,646 | $ | 599,032 | ||||||||||||||
| Onboard and other |
124,007 | 114,023 | 151,213 | 134,270 | 107,025 | 94,116 | 117,844 | |||||||||||||||||||||
| Charter |
14,046 | 9,004 | 13,737 | — | — | — | — | |||||||||||||||||||||
|
|
|
|
|
|
|
|
|
|
|
|
|
|
|
|||||||||||||||
| Total revenue |
917,362 | 854,656 | 1,112,021 | 969,138 | 749,093 | 623,762 | 716,876 | |||||||||||||||||||||
| Cruise operating expenses: |
||||||||||||||||||||||||||||
| Commissions, transportation and other |
247,248 | 252,801 | 331,254 | 271,527 | 192,285 | 143,372 | 154,520 | |||||||||||||||||||||
| Onboard and other |
33,732 | 31,085 | 40,418 | 36,854 | 28,981 | 28,746 | 36,361 | |||||||||||||||||||||
| Payroll, related and food |
133,918 | 124,693 | 168,594 | 153,754 | 122,801 | 113,203 | 115,653 | |||||||||||||||||||||
| Fuel |
77,978 | 75,272 | 101,685 | 92,921 | 57,913 | 44,220 | 58,494 | |||||||||||||||||||||
| Other ship operating |
74,694 | 70,538 | 95,808 | 86,022 | 68,517 | 61,732 | 64,641 | |||||||||||||||||||||
| Other |
8,368 | 16,310 | 21,968 | 26,305 | 16,085 | 37,016 | 18,091 | |||||||||||||||||||||
|
|
|
|
|
|
|
|
|
|
|
|
|
|
|
|||||||||||||||
| Total cruise operating expenses |
575,938 | 570,699 | 759,727 | 667,383 | 486,582 | 428,289 | 447,760 | |||||||||||||||||||||
| Selling and administrative |
131,871 | 114,985 | 153,747 | 145,802 | 134,676 | 116,989 | 106,061 | |||||||||||||||||||||
| Depreciation and amortization |
62,683 | 67,955 | 93,003 | 79,269 | 56,606 | 62,528 | 65,626 | |||||||||||||||||||||
|
|
|
|
|
|
|
|
|
|
|
|
|
|
|
|||||||||||||||
| Total operating expenses |
770,492 | 753,639 | 1,006,477 | 892,454 | 677,864 | 607,806 | 619,447 | |||||||||||||||||||||
|
|
|
|
|
|
|
|
|
|
|
|
|
|
|
|||||||||||||||
| Operating income |
146,870 | 101,017 | 105,544 | 76,684 | 71,229 | 15,956 | 97,429 | |||||||||||||||||||||
|
|
|
|
|
|
|
|
|
|
|
|
|
|
|
|||||||||||||||
| Non-operating income (expense): |
||||||||||||||||||||||||||||
| Interest expense, net of capitalized interest |
(106,470 | ) | (95,347 | ) | (131,651 | ) | (101,560 | ) | (91,325 | ) | (91,048 | ) | (93,229 | ) | ||||||||||||||
| Interest income |
367 | 567 | 752 | 670 | 513 | 143 | 2,320 | |||||||||||||||||||||
| Other income (expense) (1) |
6,651 | 20,274 | 22,956 | (45,901 | ) | (42,179 | ) | 12,902 | (7,359 | ) | ||||||||||||||||||
|
|
|
|
|
|
|
|
|
|
|
|
|
|
|
|||||||||||||||
| Total non-operating expense |
(99,452 | ) | (74,506 | ) | (107,943 | ) | (146,791 | ) | (132,991 | ) | (78,003 | ) | (98,268 | ) | ||||||||||||||
|
|
|
|
|
|
|
|
|
|
|
|
|
|
|
|||||||||||||||
| Income (loss) before income taxes |
47,418 | 26,511 | (2,399 | ) | (70,107 | ) | (61,762 | ) | (62,047 | ) | (839 | ) | ||||||||||||||||
| Income tax (expense) benefit, net |
183 | (211 | ) | (213 | ) | 335 | (358 | ) | 171 | (555 | ) | |||||||||||||||||
|
|
|
|
|
|
|
|
|
|
|
|
|
|
|
|||||||||||||||
| Net income (loss) |
$ | 47,601 | $ | 26,300 | $ | (2,612 | ) | $ | (69,772 | ) | $ | (62,120 | ) | $ | (61,876 | ) | $ | (1,394 | ) | |||||||||
|
|
|
|
|
|
|
|
|
|
|
|
|
|
|
|||||||||||||||
| Earnings (loss) per share: |
||||||||||||||||||||||||||||
| Basic |
$ | 3.51 | $ | 1.94 | $ | (0.19 | ) | $ | (5.14 | ) | $ | (4.60 | ) | $ | (4.63 | ) | $ | (0.42 | ) | |||||||||
| Diluted |
$ | 2.45 | $ | 1.94 | $ | (0.19 | ) | $ | (5.14 | ) | $ | (4.60 | ) | $ | (4.63 | ) | $ | (0.42 | ) | |||||||||
| (in thousands) | As of September 30, 2013 |
As of December 31, | ||||||||||||||||||||||
| 2012 | 2011 | 2010 | 2009 | 2008 | ||||||||||||||||||||
| Balance sheet data: |
||||||||||||||||||||||||
| Cash and cash equivalents |
$ | 263,781 | $ | 139,556 | $ | 147,212 | $ | 117,635 | $ | 149,838 | $ | 95,050 | ||||||||||||
| Total assets |
2,983,085 | 2,872,110 | 2,479,581 | 1,939,146 | 1,837,955 | 1,818,722 | ||||||||||||||||||
| Total passenger deposits |
428,265 | 365,296 | 336,203 | 291,977 | 247,484 | 195,841 | ||||||||||||||||||
| Long-term debt (2) |
1,618,585 | 1,695,656 | 1,328,518 | 830,724 | 878,036 | 938,750 | ||||||||||||||||||
| Total debt (2) |
1,685,940 | 1,713,216 | 1,350,840 | 855,724 | 903,036 | 963,750 | ||||||||||||||||||
| Related party notes payable |
698,985 | 661,304 | 615,143 | 572,736 | 499,152 | 430,996 | ||||||||||||||||||
| Total liabilities |
2,946,508 | 2,885,453 | 2,489,409 | 1,916,804 | 1,817,980 | 1,795,332 | ||||||||||||||||||
| Total stockholders’ equity (deficit) |
36,577 | (13,343 | ) | (9,828 | ) | 22,342 | 19,975 | 23,390 | ||||||||||||||||
| (1) | Other income (expense) consists of a variety of non-operating items including but not limited to foreign transaction gains and losses, gain (loss) on early extinguishment of debt and realized and unrealized gain (loss) on derivative instruments. |
| (2) | Includes the debt discount of $31.0 million and $32.8 million as of September 30, 2013 and December 31, 2012, respectively. |
41
Table of Contents
UNAUDITED PRO FORMA CONSOLIDATED FINANCIAL DATA
The following tables present unaudited pro forma balance sheet data as of September 30, 2013 and the pro forma statement of operations data for the nine months ended September 30, 2013 and the year ended December 31, 2012. We derived the unaudited pro forma consolidated financial data from our unaudited interim consolidated financial statements and our audited financial statements included elsewhere in this prospectus. The pro forma balance sheet and the statement of operations presented are not necessarily indicative of what our actual results of operations would have been as of the date and for the periods indicated, nor does it purport to represent our future results of operations.
The unaudited pro forma consolidated financial data is presented to give effect to the restructuring and capitalization of our related party debt. The unaudited pro forma consolidated balance sheet assumes that the restructuring and capitalization of our related party debt occurred on September 30, 2013. The unaudited pro forma consolidated statement of operations for the nine months ended September 30, 2013 and the year ended December 31, 2012 assumes that the restructuring and capitalization of our related party debt occurred on January 1, 2012.
You should read the following table in conjunction with “Prospectus Summary,” “Use of Proceeds,” “Selected Consolidated Financial Data,” “Management’s Discussion and Analysis of Financial Condition and Results of Operations,” and the historical financial statements and the notes thereto included elsewhere in this prospectus.
42
Table of Contents
| As of September 30, 2013 | ||||||||||||
| (in thousands) | Unaudited | Pro Forma Adjustments (1) |
Pro Forma Adjusted |
|||||||||
| (unaudited) | ||||||||||||
| Balance sheet data: |
||||||||||||
| Assets: |
||||||||||||
| Current assets: |
||||||||||||
| Cash and cash equivalents |
$ | 263,781 | $ | 263,781 | ||||||||
| Restricted cash |
39,075 | 39,075 | ||||||||||
| Trade and other receivables, net |
14,895 | 14,895 | ||||||||||
| Inventories |
14,984 | 14,984 | ||||||||||
| Prepaid expenses |
52,686 | 52,686 | ||||||||||
| Other current assets |
14,168 | 14,168 | ||||||||||
|
|
|
|
|
|
|
|||||||
| Total current assets |
399,589 | 399,589 | ||||||||||
| Property and equipment, net |
2,016,783 | 2,016,783 | ||||||||||
| Goodwill |
404,858 | 404,858 | ||||||||||
| Intangible assets, net |
82,042 | 82,042 | ||||||||||
| Other long-term assets |
79,813 | 79,813 | ||||||||||
|
|
|
|
|
|
|
|||||||
| Total assets |
$ | 2,983,085 | $ | 2,983,085 | ||||||||
|
|
|
|
|
|
|
|||||||
| Liabilities and stockholders’ equity: |
||||||||||||
| Current liabilities: |
||||||||||||
| Accounts payable |
$ | 7,087 | $ | 7,087 | ||||||||
| Accrued expenses |
99,700 | 99,700 | ||||||||||
| Passenger deposits |
410,262 | 410,262 | ||||||||||
| Derivative liabilities |
7,779 | 7,779 | ||||||||||
| Current portion of long-term debt |
67,355 | 67,355 | ||||||||||
|
|
|
|
|
|
|
|||||||
| Total current liabilities |
592,183 | 592,183 | ||||||||||
| Long-term debt |
1,618,585 | 1,618,585 | ||||||||||
| Related party notes payable (2) |
698,985 | $ | (698,985 | ) | — | |||||||
| Other long-term liabilities |
36,755 | 36,755 | ||||||||||
|
|
|
|
|
|
|
|||||||
| Total liabilities |
2,946,508 | (698,985 | ) | 2,247,523 | ||||||||
|
|
|
|
|
|
|
|||||||
| Stockholders’ equity: |
||||||||||||
| Ordinary shares (1) |
136 | |||||||||||
| Additional paid-in capital (1) |
306,651 | |||||||||||
| Accumulated deficit (1) |
(211,201 | ) | 83,841 | (127,360 | ) | |||||||
| Accumulated other comprehensive loss |
(59,009 | ) | ||||||||||
|
|
|
|
|
|
|
|||||||
| Total stockholders’ equity |
36,577 | |||||||||||
|
|
|
|
|
|
|
|||||||
| Total liabilities and stockholders’ equity |
$ | 2,983,085 | ||||||||||
|
|
|
|
|
|
|
|||||||
| (1) | The Pro Forma column in the balance sheet data table reflects (i) the restructuring and capitalization of our related party debt as of September 30, 2013, (ii) the impact on related party interest expense as reported in interest expense, net of capitalized interest on our consolidated statement of operations for the nine months ended September 30, 2013 and the year ended December 31, 2012, respectively, and (iii) the effects to accumulated deficit on the consolidated balance sheet as of September 30, 2013 as a result of such pro forma adjustment to related party interest expense on the consolidated statement of operations for the nine months ended September 30, 2013, and the year ended December 31, 2012, respectively. |
| (2) | The pro forma adjustment to related party notes payable in the balance sheet data table gives effect to the Pro Forma adjustments discussed in note 1 above. The related party debt consists of approximately $828.9 million plus related accrued interest of $24.3 million, less related unamortized discounts of $154.2 million, as of September 30, 2013. |
43
Table of Contents
| Nine Months Ended September 30, 2013 | ||||||||||||
| (in thousands) | Unaudited | Pro Forma Adjustments |
Pro Forma Adjusted |
|||||||||
| (unaudited) | ||||||||||||
| Statement of operations data: |
||||||||||||
| Revenues: |
||||||||||||
| Passenger ticket |
$ | 779,309 | $ | 779,309 | ||||||||
| Onboard and other |
124,007 | 124,007 | ||||||||||
| Charter |
14,046 | 14,046 | ||||||||||
|
|
|
|
|
|
|
|||||||
| Total Revenue |
917,362 | 917,362 | ||||||||||
| Cruise operating expenses: |
||||||||||||
| Commissions, transportation and other |
247,248 | 247,248 | ||||||||||
| Onboard and other |
33,732 | 33,732 | ||||||||||
| Payroll, related and food |
133,918 | 133,918 | ||||||||||
| Fuel |
77,978 | 77,978 | ||||||||||
| Other ship operating |
74,694 | 74,694 | ||||||||||
| Other |
8,368 | 8,368 | ||||||||||
|
|
|
|
|
|
|
|||||||
| Total cruise operating expenses |
575,938 | 575,938 | ||||||||||
| Selling and administrative |
131,871 | 131,871 | ||||||||||
| Depreciation and amortization |
62,683 | 62,683 | ||||||||||
|
|
|
|
|
|
|
|||||||
| Total operating expenses |
770,492 | 770,492 | ||||||||||
|
|
|
|
|
|
|
|||||||
| Operating income |
146,870 | 146,870 | ||||||||||
|
|
|
|
|
|
|
|||||||
| Non-operating income (expense): |
||||||||||||
| Interest expense, net of capitalized |
(106,470 | ) | $ | 37,680 | (68,790 | ) | ||||||
| Interest income |
367 | 367 | ||||||||||
| Other income (expense) |
6,651 | 6,651 | ||||||||||
|
|
|
|
|
|
|
|||||||
| Total non-operating expense |
(99,452 | ) | 37,680 | (61,772 | ) | |||||||
|
|
|
|
|
|
|
|||||||
| Income before income taxes |
47,418 | 37,680 | 85,098 | |||||||||
| Income tax benefit |
183 | 183 | ||||||||||
|
|
|
|
|
|
|
|||||||
| Net income |
$ | 47,601 | $ | 37,680 | $ | 85,281 | ||||||
|
|
|
|
|
|
|
|||||||
| (3) | The pro forma adjustments in the statement of operations data table to interest expense, net of capitalized interest gives effect to (i) the pro forma adjustments discussed in note 1 above, (ii) related party interest expense of approximately $24.3 million and $30.9 million for the nine months ended September 30, 2013 and for the year ended December 31, 2012, respectively, and (iii) debt discount accretion of approximately $13.4 million and $15.3 million for the nine months ended September 30, 2013 and for the year ended December 31, 2012, respectively. |
44
Table of Contents
| Year Ended December 31, 2012 | ||||||||||||
| (in thousands) | Audited | Pro Forma Adjustments |
Pro Forma Adjusted |
|||||||||
| (unaudited) | ||||||||||||
| Statement of operations data: |
||||||||||||
| Revenues: |
||||||||||||
| Passenger ticket |
$ | 947,071 | $ | 947,071 | ||||||||
| Onboard and other |
151,213 | 151,213 | ||||||||||
| Charter |
13,737 | 13,737 | ||||||||||
|
|
|
|
|
|
|
|||||||
| Total Revenue |
1,112,021 | 1,112,021 | ||||||||||
| Cruise operating expenses: |
||||||||||||
| Commissions, transportation and other |
331,254 | 331,254 | ||||||||||
| Onboard and other |
40,418 | 40,418 | ||||||||||
| Payroll, related and food |
168,594 | 168,594 | ||||||||||
| Fuel |
101,685 | 101,685 | ||||||||||
| Other ship operating |
95,808 | 95,808 | ||||||||||
| Other |
21,968 | 21,968 | ||||||||||
|
|
|
|
|
|
|
|||||||
| Total cruise operating expenses |
759,727 | 759,727 | ||||||||||
| Selling and administrative |
153,747 | 153,747 | ||||||||||
| Depreciation and amortization |
93,003 | 93,003 | ||||||||||
|
|
|
|
|
|
|
|||||||
| Total operating expenses |
1,006,477 | 1,006,477 | ||||||||||
|
|
|
|
|
|
|
|||||||
| Operating income |
105,544 | 105,544 | ||||||||||
|
|
|
|
|
|
|
|||||||
| Non-operating income (expense): |
||||||||||||
| Interest expense, net of capitalized interest (3) |
(131,651 | ) | $ | 46,161 | (85,490 | ) | ||||||
| Interest income |
752 | 752 | ||||||||||
| Other income (expense) |
22,956 | 22,956 | ||||||||||
|
|
|
|
|
|
|
|||||||
| Total non-operating expense |
(107,943 | ) | 46,161 | (61,782 | ) | |||||||
|
|
|
|
|
|
|
|||||||
| (Loss) income before income taxes |
(2,399 | ) | 46,161 | 43,762 | ||||||||
| Income tax expense |
(213 | ) | (213 | ) | ||||||||
|
|
|
|
|
|
|
|||||||
| Net (loss) income |
$ | (2,612 | ) | $ | 46,161 | $ | 43,549 | |||||
|
|
|
|
|
|
|
|||||||
45
Table of Contents
MANAGEMENT’S DISCUSSION AND ANALYSIS OF FINANCIAL
CONDITION AND RESULTS OF OPERATIONS
The following discussion and analysis of our financial condition and results of operations is intended to clarify the results of our operations, certain changes in our financial position, liquidity, capital structure and business developments for the periods covered by the consolidated financial statements included elsewhere in this prospectus. Our actual results could differ materially from those discussed below. This discussion should be read in conjunction with, and is qualified by reference to, the other related information contained in this prospectus, including the consolidated financial statements and the related notes thereto and the description of our business as well as the risk factors discussed in “Risk Factors” and “Cautionary Statement Concerning Forward-Looking Statements.”
Key Operational and Financial Metrics, including Non-GAAP Measures
We utilize a variety of operational and financial metrics, which are defined below, to evaluate our performance and financial condition. We use certain non-GAAP financial measures, such as EBITDA, Adjusted EBITDA, Net Per Diems, Net Yields and Net Cruise Costs to enable us to analyze our performance and financial condition. We utilize these financial measures to manage our business on a day-to-day basis and believe that they are the most relevant measures of our performance. Some of these measures are commonly used in the cruise industry to measure performance. We believe these non-GAAP measures provide expanded insight to measure revenue and cost performance, in addition to the standard GAAP-based financial measures. There are no specific rules or regulations for determining non-GAAP measures, and as such, they may not be comparable to measured used by other companies within our industry. The presentation of non-GAAP financial information should not be considered in isolation or as a substitute for, or superior to, the financial information prepared and presented in accordance with GAAP. You should read this discussion and analysis of our financial condition and results of operations together with the reconciliation of these non-GAAP measures set forth in the footnotes to “Prospectus Summary—Summary Consolidated Financial Information.”
EBITDA is net income (loss) excluding depreciation and amortization, net interest expense and income tax benefit (expense).
Adjusted EBITDA is net income (loss) excluding depreciation and amortization, interest income, interest expense, other income (expense), and income tax benefit (expense), and other supplemental adjustments in connection with the calculation of certain financial ratios permitted in calculating covenant compliance under the indenture governing the Senior Secured Notes and our Secured Credit Facilities. We believe Adjusted EBITDA, when considered along with other performance measures, is a useful measure as it reflects certain operating drivers of our business, such as sales growth, operating costs, selling and administrative expense and other operating income and expense. We believe Adjusted EBITDA can provide a more complete understanding of the underlying operating results and trends and an enhanced overall understanding of our financial performance and prospects for the future. While Adjusted EBITDA is not a recognized measure under GAAP, management uses this financial measure to evaluate and forecast our business performance. Adjusted EBITDA is not intended to be a measure of liquidity or cash flows from operations or a measure comparable to net income as it does not take into account certain requirements such as capital expenditures and related depreciation, principal and interest payments, and tax payments, and it is subject to certain additional adjustments as permitted under the agreements governing our indebtedness. Our use of Adjusted EBITDA may not be comparable to other companies within our industry. Management compensates for these limitations by using Adjusted EBITDA as only one of several measures for evaluating our business performance. In addition, capital expenditures, which impact depreciation and amortization, interest expense, and income tax benefit (expense), are reviewed separately by management.
Available Passenger Cruise Days (“APCD”) is our measurement of capacity and represents double occupancy per cabin multiplied by the number of cruise days for the period. We use this measure to perform capacity and rate analysis to identify our main non-capacity drivers that cause our cruise revenue and expense to vary.
46
Table of Contents
Gross Cruise Cost represents the sum of total cruise operating expense plus selling and administrative expense.
Gross Yield represents total revenue, excluding charter per APCD.
Net Cruise Cost represents Gross Cruise Cost excluding commissions, transportation and other expense, and onboard and other expense.
Net Cruise Cost excluding Fuel and Other represents Gross Cruise Cost excluding commissions, transportation and other expense, onboard and other expense, fuel expense and other expense.
Net Per Diem represents Net Revenue divided by Passenger Days Sold. We utilize Net Per Diem to manage our business on a day-to-day basis, as we believe that it is the most relevant measure of our pricing performance as it reflects the revenues earned by us, net of our most significant variable costs. Other cruise lines use Net Yield to analyze business, which is a similar measurement that divides Net Revenue by APCD instead of Passenger Days Sold. The distinction is significant as other cruise companies focus more on potential onboard sales, resulting in a bias to fill each bed to maximize onboard revenue at the expense of passenger ticket revenue. Conversely, as our product has all-inclusive elements, we derive nearly all of our revenue from passenger ticket revenue. Hence it is far more important for us to maintain a pricing discipline focusing on passenger ticket revenue rather than to discount cruises in order to achieve higher occupancy to drive potential onboard revenues. We believe that this pricing discipline drives our revenue performance, our relatively long booking window, and allows us to maintain a positive relationship with the travel agency community.
Net Revenue represents total revenue, excluding charter revenue less commissions, transportation and other expense, and onboard and other expense.
Net Yield represents Net Revenue per APCD.
Occupancy is calculated by dividing Passenger Days Sold by APCD.
Passenger Days Sold (“PDS”) represents the number of revenue passengers carried for the period multiplied by the number of days within the period of their respective cruises.
Description of Certain Line Items
Revenues
Our revenue consists of the following:
| • | Passenger ticket revenue consists of gross revenue recognized from the sale of passenger tickets net of dilutions, such as shipboard credits and certain included passenger shipboard event costs. Also included is gross revenue for air and related ground transportation sales. |
| • | Onboard and other revenue consists of revenue derived from the sale of goods and services rendered onboard the ships (net of related concessionaire costs as applicable), travel insurance (net of related costs), and cancellation fees. Also included in onboard and other revenue is gross revenue from pre- and post-cruise hotel accommodations, shore excursions, land packages, and ground transportation for which we assume the risks of loss for collections and cancellations. Certain of our cruises include free unlimited shore excursions (“FUSE”) and/or free pre-cruise hotel accommodations, and such free excursions and hotel accommodations have no revenue attributable to them. The costs for FUSE and free hotel accommodations are included in commissions, transportation and other expense in the consolidated statements of operations. |
| • | Charter revenue consists of charter hire fees, net of commissions, to bareboat charter with a third party. The charter agreement constitutes an operating lease and charter revenue is recognized on a straight-line basis over the charter term. |
47
Table of Contents
| • | Cash collected in advance for future cruises is recorded as a passenger deposit liability. Those deposits for sailings traveling more than 12 months in the future are classified as a long-term liability. We recognize the revenue associated with these cash collections in the period in which the cruise occurs. For cruises that occur over multiple periods, revenue is prorated and recognized ratably in each period based on the overall length of the cruise. Cancellation fee revenue, along with associated commission expense and travel insurance revenue, if any, are recorded in the period the cancellation occurs. |
Expenses
Cruise Operating Expense
Our cruise operating expense consists of the following:
| • | Commissions, transportation and other consists of payments made to travel agencies that sell our product, costs associated with air and related ground transportation pre-sold to our guests, all credit card fees, and the costs associated with shore excursions and hotel accommodations included as part of the overall cruise purchase price. |
| • | Onboard and other consists of costs related to land packages and ground transportation, as well as shore excursions and hotel accommodations costs not included in commissions, transportation and other. |
| • | Payroll, related and food consists of the costs of crew payroll and related expenses for shipboard personnel, as well as food expenses for both passengers and crew. We include food and payroll costs in a single expense line item as we contract with a single vendor to provide many of our hotel and restaurant services, including both food and labor costs, which are billed on a per-passenger basis. This per-passenger fee reflects the cost of both of the aforementioned expenses. |
| • | Fuel consists of fuel costs and related delivery and storage costs. |
| • | Other ship operating consists of port, deck and engine, certain entertainment-related expenses, and hotel consumables expenses. |
| • | Other consists primarily of drydock, ship insurance costs, loss on disposals of ship related assets and passenger claims. |
Selling and Administrative Expense
Selling and administrative expense includes advertising and promotional activities, shoreside personnel wages, benefits and expenses relating to our worldwide offices, professional fees, information technology support, our reservation call centers, and related support activities. Such expenditures are generally expensed in the period incurred.
Critical Accounting Policies and Estimates
Our consolidated financial statements are prepared in accordance with GAAP, which requires us to make estimates and assumptions that affect the reported amounts of assets and liabilities as of the date of the financial statements, the reported amounts of revenues and expenses during the reporting periods and the related disclosures in the consolidated financial statements and accompanying footnotes. We believe that of our significant accounting policies, which are described in Note 2: “Basis of Presentation and Summary of Significant Accounting Policies” in our audited consolidated financial statements included elsewhere in this prospectus, the following accounting policies are critical because they involve a higher degree of judgment, and the estimates required to be made were based on assumptions that are inherently uncertain. As a result, these accounting policies could materially affect our financial position, results of operations, and related disclosures. On an ongoing basis, we evaluate these estimates and judgments based on historical experiences and various other factors that we believe reflect current circumstances. While we believe our estimates, assumptions and judgments are reasonable, they are based on information presently available. Actual results may differ significantly from these estimates due to changes in judgments, assumptions and conditions, which could have a material impact on our financial position or results of operations.
48
Table of Contents
Asset Impairment
Goodwill
We record goodwill as the excess of the purchase price over the estimated fair value of net assets acquired, including identifiable intangible assets. We assess goodwill for impairment in accordance with ASC 350, Intangibles—Goodwill and Other, which requires that goodwill be tested for impairment at the “reporting unit level” (“Reporting Unit”) at least annually and more frequently when events or circumstances dictate, as defined by ASC 350. As our two cruise brands have similar economic characteristics, we have determined that we have only one Reporting Unit.
In 2012, we adopted new authoritative accounting guidance that allows us to first assess qualitative factors to determine whether it is necessary to perform the two-step quantitative goodwill impairment test. We would perform the two-step test if our qualitative assessment determined it is more-likely-than-not that a Reporting Unit’s fair value, determined using the discounted cash flow method, is less than its carrying amount. We may also elect to bypass the qualitative assessment and proceed directly to step one of the quantitative test. The first step of the impairment review requires that we determine the fair value of the Reporting Unit and compare it to the carrying value of the net assets allocated to the Reporting Unit. If the fair value of the Reporting Unit exceeds the carrying value, no further analysis or write-down of goodwill is required. If the fair value of the Reporting Unit is less than the carrying value of its net assets, the implied fair value of the Reporting Unit is allocated to all of its underlying assets and liabilities, including both recognized and unrecognized tangible and intangible assets, based on their fair value. If necessary, goodwill is then written down to its implied fair value.
Our annual goodwill impairment test date is September 30, which coincides with our annual budget/forecasting cycle and the end of our seasonally highest quarter. As of September 30, 2013, we did not have any impairment on goodwill, indefinite-lived intangible assets or other long-lived assets.
The principal assumptions we use in the discounted cash flow model are projected operating results, discount rate, weighted-average cost of capital and terminal value. Cash flows are calculated using projected operating results as a base. To that base we added estimated future years’ cash flows, considering the global economic environment as well as internal projections based on projected occupancy levels, cost structure and other variables. We discounted the projected cash flows using a rate equivalent to our weighted-average cost of capital. Based on the discounted cash flow model, we determined that the fair value of the Reporting Unit exceeded the carrying value and is therefore not impaired.
The estimation of fair value utilizing discounted expected future cash flows includes numerous uncertainties that require significant judgments when making assumptions of expected revenues, operating costs, selling and administrative expenses, capital expenditures, as well as assumptions regarding the competition and business conditions within the cruise vacation industry, among other factors. It is possible that changes in our assumptions and projected operating results could lead to impairment of our goodwill.
Identifiable Intangible Assets
Regent recorded identifiable intangible assets consisting of trade names, customer relationships, non-competition agreements, backlog and customer database. The trade names acquired include “Seven Seas Cruises” and “Luxury Goes Exploring” were determined to have indefinite lives. During 2011, Regent amended its agreement with Regent Hospitality Worldwide, which granted exclusive and perpetual licensing rights to use the “Regent” trade name and trademarks in conjunction with cruises. The amended and restated trademark license agreement allows us to use the Regent trade name and trademark rights, in conjunction with cruises, in perpetuity, subject to the terms and conditions stated in the agreement. The Regent licensing rights are being amortized over an estimated useful life of 40 years.
Our identifiable intangible assets, except the trade names acquired and noted above, are subject to amortization over their estimated lives and are reviewed for impairment whenever events or changes in
49
Table of Contents
circumstances indicate that the carrying amount of an asset may not be recoverable based on market factors and operational considerations. Identifiable intangible assets not subject to amortization, such as trade names, are reviewed for impairment whenever events or circumstances indicate, but at least annually, by comparing the estimated fair value of the intangible asset with its carrying value. We perform our annual impairment review of our trade names as of September 30 using the relief-from-royalty method. The royalty rate used is based on comparable royalty agreements in the tourism and hospitality industry. The discount rate used was the same rate used in our goodwill impairment test.
Ship Accounting
Upon acquisition of our ships, excluding newbuilds, we record the acquisition cost at the estimated fair value of the ship, which is calculated based on a market approach that takes into consideration recent transactions of similar ships, conditions of the cruise market at the date of valuation and the price a willing third party would pay for a ship with similar characteristics. Our ships represent our most significant asset and are stated at cost less accumulated depreciation. Depreciation of the ships is computed net of projected residual values of 30% using the straight-line method over their original estimated service lives ranging from 20 to 30 years. Service life is based on when the assets were originally placed in service. We did not extend the life of the Regent ships we acquired at the time of the Regent Seven Seas Transaction. Our service life and residual value estimates take into consideration the impact of anticipated technological changes, long-term cruise and vacation market conditions, and historical useful lives of similarly built ships.
As of January 1, 2013, we changed our estimate for all our ships’ projected residual values. The change was triggered as we obtained recent sales information for luxury cruise ship sales that occurred during the three months ended March 31, 2013. As a result, we increased each ship’s projected residual value ranging from 10-15% to 30%. The change in estimate has been applied prospectively. The effect of the change on both operating income and net loss for the nine months ended September 30, 2013 is approximately $12.3 million of reduced depreciation expense. The estimated impact of this change for full year 2013 is a reduction of depreciation expense of approximately $16.4 million. We periodically review and evaluate these estimates and judgments based on historical experiences and new factors and circumstances. As part of our ongoing reviews, our estimates may change in the future. If such a change is necessary, depreciation expense could be materially higher or lower.
Improvement costs that add value to the ships and have a useful life greater than one year are capitalized as additions to the ships and are depreciated over the lesser of the ships’ remaining service lives or the improvements’ estimated useful lives. Improvement costs are related to new components that have been added to, replaced or refurbished on the ship. The remaining estimated cost and accumulated depreciation (i.e. book value) of replaced ship components are written off and any resulting losses are recognized in the consolidated statements of operations. Examples of significant capitalized improvement costs are electrical system upgrades, such as the upgrade of stabilizers, electrical system generators and the refurbishment of major mechanical systems such as diesel engines, boilers, and generators, along with new stateroom and guest facility equipment. Given the very large and complex nature of our ships, our accounting estimates related to ships and determination of ship improvement costs to be capitalized require considerable judgment of management and are inherently uncertain.
Drydock costs are scheduled maintenance activities that require the ships to be taken out of service and are expensed as incurred. Drydocks are required to maintain each vessel’s Class certification. Class certification is necessary in order for our cruise ships to be flagged in a specific country, obtain liability insurance and legally operate as passenger cruise ships. Typical drydock costs include drydock fees and wharfage services provided by the drydock facility, hull inspection and certification related activities, external hull cleaning and painting below the waterline including pressure cleaning and scraping, additional below the waterline work such as maintenance and repairs on propellers and replacement of seals, cleaning and maintenance on holding tanks and sanitary discharge systems, related outside contractor services including travel and related expenses and freight and logistics costs related to drydock activities. Repair and maintenance activities are charged to expense as incurred.
50
Table of Contents
We review our ships for impairment whenever events or changes in circumstances indicate that the carrying amount of these assets may not be fully recoverable. The assessment of possible impairment is based on our ability to recover the carrying value of these assets based on our estimate of its undiscounted future cash flows. If estimated future cash flows are less than the carrying value of an asset, an impairment charge is recognized for the difference between the asset’s estimated fair value and its carrying value. We perform our ship impairment reviews on an individual ship basis utilizing an undiscounted cash flow analysis. The principle assumptions used in the undiscounted cash model are projected operating results, including net per diems, net cruise costs, projected occupancy, available passenger days, and projected growth. We have not recognized any impairment losses on any of our ships.
We believe our estimates and judgments with respect to our ships are reasonable. However, should certain factors or circumstances cause us to revise our estimates of ship service lives, projected residual value or the lives of major improvements, depreciation expense could be materially higher or lower. If circumstances cause us to change our assumptions in making determinations as to whether ship improvements should be capitalized, the amount we expense each year as repair and maintenance costs could increase, partially offset by a decrease in depreciation expense. If we had reduced our estimated average service life of our ships by one year, depreciation expense for 2012 would have increased by $2.4 million. If our ships were estimated to have no residual value, depreciation expense for 2012 would have increased by $12.3 million.
Contingencies—Litigation
On an ongoing basis, we assess the potential liabilities related to any lawsuits or claims brought against us. While it is typically very difficult to determine the timing and ultimate outcome of such actions, we use our best judgment to determine if it is probable that we will incur an expense related to the settlement or final adjudication of such matters and whether a reasonable estimation of such probable loss, if any, can be made. In assessing probable losses, we take into consideration estimates of the amount of insurance recoveries, if any. We accrue a liability when we believe a loss is probable and the amount of loss can be reasonably estimated. Due to the inherent uncertainties related to the eventual outcome of litigation and potential insurance recoveries, it is possible that certain matters may be resolved for amounts materially different from any provisions or disclosures that we have previously made.
Executive Overview
We reported total revenue, total cruise operating expense, operating income and net income (loss) as shown in the following table:
| (in thousands, except per share data) | Nine Months Ended September 30, |
Year Ended December 31, |
||||||||||||||||||
| 2013 | 2012 | 2012 | 2011 | 2010 | ||||||||||||||||
| Total revenue |
$ | 917,362 | $ | 854,656 | $ | 1,112,021 | $ | 969,138 | $ | 749,093 | ||||||||||
| Total cruise operating expenses |
575,938 | 570,699 | 759,727 | 667,383 | 486,582 | |||||||||||||||
| Operating income |
146,870 | 101,017 | 105,544 | 76,684 | 71,229 | |||||||||||||||
| Net income (loss) |
47,601 | 26,300 | (2,612 | ) | (69,772 | ) | (62,120 | ) | ||||||||||||
| Earnings (loss) per share: |
||||||||||||||||||||
| Basic |
$ | 3.51 | $ | 1.94 | $ | (0.19 | ) | $ | (5.14 | ) | $ | (4.60 | ) | |||||||
| Diluted |
$ | 2.45 | $ | 1.94 | $ | (0.19 | ) | $ | (5.14 | ) | $ | (4.60 | ) | |||||||
Revenue increased $62.7 million, or 7.3%, to $917.4 million for the nine months ended September 30, 2013 compared to $854.7 million for the nine months ended September 30, 2012. The increase was due to additional capacity in 2013 as PDS increased 6.7% due to Riviera beginning revenue generating sailings in May 2012. Additionally, there were no drydocks for the nine months ended September 30, 2013 compared to one drydock for the nine months ended September 30, 2012.
51
Table of Contents
Net Yield increased 3.2% to $395.90 for the nine months ended September 30, 2013 from $383.58 for the nine months ended September 30, 2012, primarily due to a decrease in air costs.
Net Cruise Cost per APCD, excluding fuel cost and other expense, increased to $216.60, or 2.3%, for the nine months ended September 30, 2013 from $211.82 for the nine months ended September 30, 2012, primarily driven by increased sales and marketing expenses.
Fuel expense, net of settled fuel hedges, increased $6.6 million to $77.6 million for the nine months ended September 30, 2013 from $71.0 million for the nine months ended September 30, 2012. The increase was driven by a 5.7% increase in consumption due to the addition of Riviera, offset by a 2.0% decrease in our average cost of fuel per metric ton.
Adjusted EBITDA was $216.2 million for the nine months ended September 30, 2013, compared to $190.1 million for the nine months ended September 30, 2012.
Results of Operations
The following table sets forth our operating data as a percentage of total revenue:
| (in thousands) | Nine Months Ended September 30, |
Year Ended December 31, |
||||||||||||||||||
| 2013 | 2012 | 2012 | 2011 | 2010 | ||||||||||||||||
| Revenues: |
||||||||||||||||||||
| Passenger ticket |
85.0 | % | 85.6 | % | 85.2 | % | 86.1 | % | 85.7 | % | ||||||||||
| Onboard and other |
13.5 | 13.3 | 13.6 | 13.9 | 14.3 | |||||||||||||||
| Charter |
1.5 | 1.1 | 1.2 | — | — | |||||||||||||||
|
|
|
|
|
|
|
|
|
|
|
|||||||||||
| Total revenue |
100.0 | % | 100.0 | % | 100.0 | % | 100.0 | % | 100.0 | % | ||||||||||
|
|
|
|
|
|
|
|
|
|
|
|||||||||||
| Cruise operating expenses: |
||||||||||||||||||||
| Commissions, transportation and other |
27.0 | % | 29.6 | % | 29.8 | % | 28.0 | % | 25.7 | % | ||||||||||
| Onboard and other |
3.7 | 3.6 | 3.6 | 3.8 | 3.9 | |||||||||||||||
| Payroll, related and food |
14.6 | 14.6 | 15.2 | 15.9 | 16.4 | |||||||||||||||
| Fuel |
8.5 | 8.8 | 9.1 | 9.6 | 7.7 | |||||||||||||||
| Other ship operating |
8.1 | 8.3 | 8.6 | 8.9 | 9.1 | |||||||||||||||
| Other |
0.9 | 1.9 | 2.0 | 2.7 | 2.1 | |||||||||||||||
|
|
|
|
|
|
|
|
|
|
|
|||||||||||
| Total cruise operating expenses |
62.8 | 66.8 | 68.3 | 68.9 | 65.0 | |||||||||||||||
| Selling and administrative |
14.4 | 13.5 | 13.8 | 15.0 | 18.0 | |||||||||||||||
| Depreciation and amortization |
6.8 | 8.0 | 8.4 | 8.2 | 7.6 | |||||||||||||||
|
|
|
|
|
|
|
|
|
|
|
|||||||||||
| Total operating expenses |
84.0 | 88.2 | 90.5 | 92.1 | 90.5 | |||||||||||||||
|
|
|
|
|
|
|
|
|
|
|
|||||||||||
| Operating income |
16.0 | 11.8 | 9.5 | 7.9 | 9.5 | |||||||||||||||
|
|
|
|
|
|
|
|
|
|
|
|||||||||||
| Non-operating income (expense): |
||||||||||||||||||||
| Interest expense, net of capitalized interest |
(11.6 | ) | (11.2 | ) | (11.8 | ) | (10.5 | ) | (12.2 | ) | ||||||||||
| Interest income |
— | 0.1 | 0.1 | 0.1 | 0.1 | |||||||||||||||
| Other income (expense) |
0.7 | 2.4 | 2.1 | (4.7 | ) | (5.6 | ) | |||||||||||||
|
|
|
|
|
|
|
|
|
|
|
|||||||||||
| Total non-operating expense |
(10.8 | ) | (8.7 | ) | (9.7 | ) | (15.1 | ) | (17.8 | ) | ||||||||||
|
|
|
|
|
|
|
|
|
|
|
|||||||||||
| Income (loss) before income taxes |
5.2 | 3.1 | (0.2 | ) | (7.2 | ) | (8.2 | ) | ||||||||||||
| Income tax (expense) benefit, net |
— | — | — | — | — | |||||||||||||||
|
|
|
|
|
|
|
|
|
|
|
|||||||||||
| Net income (loss) |
5.2 | % | 3.1 | % | (0.2 | )% | (7.2 | )% | (8.2 | )% | ||||||||||
|
|
|
|
|
|
|
|
|
|
|
|||||||||||
52
Table of Contents
The following table sets forth our Passenger Days Sold, APCD and Occupancy for the years ended December 31, 2012, 2011 and 2010 and the nine months ended September 30, 2013 and 2012.
| Nine Months Ended September 30, |
Year Ended December 31, |
|||||||||||||||||||
| 2013 | 2012 | 2012 | 2011 | 2010 | ||||||||||||||||
| Passenger Days Sold |
1,488,703 | 1,395,793 | 1,873,691 | 1,688,958 | 1,305,578 | |||||||||||||||
| APCD |
1,571,934 | 1,464,536 | 1,985,522 | 1,836,722 | 1,406,298 | |||||||||||||||
| Occupancy |
94.7 | % | 95.3 | % | 94.4 | % | 92.0 | % | 92.8 | % | ||||||||||
In the following table, Net Per Diem is calculated by dividing net revenue by Passenger Days Sold, Gross Yield is calculated by dividing total revenue by Available Passenger Cruise Days, and Net Yield is calculated by dividing net revenue by Available Passenger Cruise Days for the years ended December 31, 2012, 2011 and 2010 and the nine months ended September 30, 2013 and 2012.
| Nine Months Ended September 30, |
Year Ended December 31, |
|||||||||||||||||||
| (in thousands, except operating data) | 2013 | 2012 | 2012 | 2011 | 2010 | |||||||||||||||
| Passenger ticket revenue |
$ | 779,309 | $ | 731,629 | $ | 947,071 | $ | 834,868 | $ | 642,068 | ||||||||||
| Onboard and other revenue |
124,007 | 114,023 | 151,213 | 134,270 | 107,025 | |||||||||||||||
|
|
|
|
|
|
|
|
|
|
|
|||||||||||
| Total revenue, excluding charter |
903,316 | 845,652 | 1,098,284 | 969,138 | 749,093 | |||||||||||||||
| Less: |
||||||||||||||||||||
| Commissions, transportation and other expense |
247,248 | 252,801 | 331,254 | 271,527 | 192,285 | |||||||||||||||
| Onboard and other expense |
33,732 | 31,085 | 40,418 | 36,854 | 28,981 | |||||||||||||||
|
|
|
|
|
|
|
|
|
|
|
|||||||||||
| Net Revenue |
$ | 622,336 | $ | 561,766 | $ | 726,612 | $ | 660,757 | $ | 527,827 | ||||||||||
|
|
|
|
|
|
|
|
|
|
|
|||||||||||
| Passenger Days Sold |
1,488,703 | 1,395,793 | 1,873,691 | 1,688,958 | 1,305,578 | |||||||||||||||
| APCD |
1,571,934 | 1,464,536 | 1,985,522 | 1,836,722 | 1,406,298 | |||||||||||||||
| Net Per Diem |
$ | 418.04 | $ | 402.47 | $ | 387.80 | $ | 391.22 | $ | 404.29 | ||||||||||
| Gross Yield |
574.65 | 577.42 | 553.15 | 527.65 | 532.67 | |||||||||||||||
| Net Yield |
395.90 | 383.58 | 365.96 | 359.75 | 375.33 | |||||||||||||||
In the following table, Gross Cruise Cost per Available Passenger Cruise Days is calculated by dividing Gross Cruise Cost by Available Passenger Cruise Days, and Net Cruise Cost per Available Passenger Cruise Days is calculated by dividing Net Cruise Costs by Available Passenger Cruise Days for the years ended December 31, 2012, 2011 and 2010 and the nine months ended September 30, 2013 and 2012.
| Nine Months Ended September 30, |
Year Ended December 31, |
|||||||||||||||||||
| (in thousands, except APCD data) | 2013 | 2012 | 2012 | 2011 | 2010 | |||||||||||||||
| Total cruise operating expense |
$ | 575,938 | $ | 570,699 | $ | 759,727 | $ | 667,383 | $ | 486,582 | ||||||||||
| Selling and administrative expense |
131,871 | 114,985 | 153,747 | 145,802 | 134,676 | |||||||||||||||
|
|
|
|
|
|
|
|
|
|
|
|||||||||||
| Gross Cruise Cost |
707,809 | 685,684 | 913,474 | 813,185 | 621,258 | |||||||||||||||
| Less: |
||||||||||||||||||||
| Commissions, transportation and other expense |
247,248 | 252,801 | 331,254 | 271,527 | 192,285 | |||||||||||||||
| Onboard and other expense |
33,732 | 31,085 | 40,418 | 36,854 | 28,981 | |||||||||||||||
|
|
|
|
|
|
|
|
|
|
|
|||||||||||
| Net Cruise Cost |
426,829 | 401,798 | 541,802 | 504,804 | 399,992 | |||||||||||||||
| Less: |
||||||||||||||||||||
| Fuel |
77,978 | 75,272 | 101,685 | 92,921 | 57,913 | |||||||||||||||
| Other |
8,368 | 16,310 | 21,968 | 26,305 | 16,085 | |||||||||||||||
|
|
|
|
|
|
|
|
|
|
|
|||||||||||
| Net Cruise Cost, excluding Fuel and Other |
$ | 340,483 | $ | 310,216 | $ | 418,149 | $ | 385,578 | $ | 325,994 | ||||||||||
|
|
|
|
|
|
|
|
|
|
|
|||||||||||
| APCD |
1,571,934 | 1,464,536 | 1,985,522 | 1,836,722 | 1,406,298 | |||||||||||||||
| Gross Cruise Cost per APCD |
$ | 450.28 | $ | 468.19 | $ | 460.07 | $ | 442.74 | $ | 441.77 | ||||||||||
| Net Cruise Cost per APCD |
271.53 | 274.35 | 272.88 | 274.84 | 284.43 | |||||||||||||||
| Net Cruise Cost, excluding Fuel and Other, per APCD |
216.60 | 211.82 | 210.60 | 209.93 | 231.81 | |||||||||||||||
53
Table of Contents
Nine Months Ended September 30, 2013 Compared to Nine Months Ended September 30, 2012
Revenue
Total revenue increased $62.7 million, or 7.3%, to $917.4 million for the nine months ended September 30, 2013, from $854.7 million for the nine months ended September 30, 2012. This increase was mainly due to the following factors:
| • | Passenger ticket revenue increased $47.7 million, or 6.5%, to $779.3 million in for the nine months ended September 30, 2013 from $731.6 million for the nine months ended September 30, 2012, primarily due to additional capacity in 2013 as PDS increased 6.7% due to Riviera beginning revenue generating sailings in May 2012. Additionally, there were no drydocks for the nine months ended September 30, 2013 compared to one drydock for the nine months ended September 30, 2012. |
| • | Onboard and other revenue increased $10.0 million, or 8.8%, to $124.0 million for the nine months ended September 30, 2013 from $114.0 million for the nine months ended September 30, 2012, driven by a $7.6 million increase due to a 6.7% increase in PDS and a $2.4 million due to pricing increases. |
| • | Charter revenue increased $5.0 million to $14.0 million for the nine months ended September 30, 2013 from $9.0 million for the nine months ended September 30, 2012 due to Insignia bareboat charter to an unrelated party for a period of two years commencing in April 2012. |
Cruise Operating Expense
Total cruise operating expense increased $5.2 million, or 0.9%, to $575.9 million for the nine months ended September 30, 2013, from $570.7 million for the nine months ended September 30, 2012. The increase was mainly due to the following factors:
| • | Payroll, related and food increased $9.2 million, or 7.4%. The increase was primarily due to costs associated with additional capacity in 2013 as PDS increased 6.7%. |
| • | Other ship operating increased $4.2 million, or 5.9%, primarily driven by increased deck, engine and port costs as a result of capacity growth with the addition of Riviera in May 2012. |
| • | Fuel increased $2.7 million, or 3.6%, driven by a 5.7% increase in consumption due to the addition of Riviera, offset by a 2.0% decrease in our average fuel cost per Metric Ton to $724 per Metric Ton for the nine months ended September 30, 2013, from $739 per Metric Ton for the nine months ended September 30, 2012. |
| • | Onboard and other increased $2.6 million, or 8.5%, due primarily to the 6.7% increase in PDS. |
The increase was partially offset by the following factors:
| • | Other decreased $7.9 million, or 48.7%, primarily due to expenses associated with one drydock during the nine months ended September 30, 2012 compared to none during the same period in 2013. |
| • | Commissions, transportation and other decreased $5.6 million, or 2.2%, primarily due to decreased air costs and air participation. |
Selling and Administrative Expense
Selling and administrative expense for the nine months ended September 30, 2013 increased $16.9 million or 14.7% to $131.9 million, from $115.0 million for the nine months ended September 30, 2012. The increase was primarily due to marketing expenses of $9.1 million, general and administrative costs totaling $6.6 million which were primarily attributable to employee cost and professional fees and $1.2 million in sales expenses.
54
Table of Contents
Depreciation and Amortization Expense
Depreciation and amortization expense for the nine months ended September 30, 2013 decreased $5.3 million, or 7.8%, to $62.7 million from $68.0 million for the nine months ended September 30, 2012. In 2013, we increased each ship’s projected residual value as a result of our change in the estimated residual values on January 1, 2013, which resulted in $12.3 million of reduced depreciation expense compared to 2012. This decrease was primarily offset by $5.5 million in additional depreciation during 2013 on Riviera, as it was placed in service in May 2012. The remaining $1.5 million offset is due to vessel refurbishment additions for drydocks in May 2012 and November 2012.
Non-Operating Income (Expense)
Interest expense, net of capitalized interest, increased $11.1 million, or 11.7%, to $106.5 million for the nine months ended September 30, 2013, from $95.3 million for the nine months ended September 30, 2012. The increase was primarily driven by the addition of the Riviera Loan (as defined herein), debt discount amortization specific to bifurcated embedded derivatives, a higher fixed interest rate under our interest rate swap agreement related to the Marina Loan, the refinancing of the Oceania First Lien Term Loan and Oceania Second Lien Term Loan in July 2013 with a loan bearing a higher average interest rate and the refinancing of the Regent Term Loan in August 2012 with a higher interest rate bearing loan.
Other income (expense) decreased $13.6 million, or 67.2%, to $6.7 million for the nine months ended September 30, 2013, from income of $20.3 million for the nine months ended September 30, 2012. For the nine months ended September 30, 2013, we recorded a $13.0 million gain on derivative instruments, offset by a $3.7 million loss on the early extinguishment of Regent’s first lien term loan and a $1.9 million loss on early extinguishment of Oceania’s First Lien Term Loan (as defined herein), a $0.5 million loss related to fuel hedge contracts and a $0.2 million loss on foreign transactions. For the nine months ended September 30, 2012, we recorded a $10.1 million gain on derivative instruments and had a $9.9 million gain on our foreign currency hedge contracts, an $8.2 million gain related to fuel hedge contracts offset by a $4.5 million loss on the early extinguishment of Regent’s first lien term loan and a $3.4 million loss on foreign currency transactions.
Net Yield
Net Yield increased 3.2% to $395.90 for the nine months ended September 30, 2013 from $383.58 for the nine months ended September 30, 2012 primarily due to a decrease in air costs.
Net Cruise Cost per APCD
Net Cruise Cost per APCD decreased to $271.53, or 1.0%, in 2013 from $274.35 in 2012, due to the addition of Riviera and there being no drydocks for the nine months ended September 30, 2013 compared to one drydock for the nine months ended September 30, 2012. Net Cruise Cost, excluding fuel cost and other expense, per APCD increased to $216.60, or 2.3%, for the nine months ended September 30, 2013 from $211.82 for the nine months ended September 30, 2012, primarily driven by increased sales and marketing expenses.
Year Ended December 31, 2012 Compared to Year Ended December 31, 2011
Revenue
Total revenue increased $142.9 million, or 14.7%, to $1,112.0 million in 2012, from $969.1 million in 2011. This increase was mainly due to the following factors:
| • | Passenger ticket revenue increased $112.2 million, or 13.4%, to $947.1 million in 2012, from $834.9 million in 2011, driven by a $91.0 million increase due to a 10.9% increase in PDS and |
55
Table of Contents
| $21.2 million due to pricing increases. The increase in PDS was attributable to revenue generating sailings on Riviera beginning in May 2012, and two drydocks in 2012 compared to three in 2011. |
| • | Onboard and other revenue increased $16.9 million, or 12.6%, to $151.2 million in 2012 from $134.3 million in 2011, driven by a $14.6 million increase due to a 10.9% increase in PDS and $2.3 million increase due to pricing increases. |
| • | Charter revenue increased $13.7 million due to Insignia bareboat charter in April 2012. There were no bareboat charters in 2011. |
Cruise Operating Expense
Total cruise operating expense increased $92.3 million, or 13.8%, to $759.7 million in 2012, from $667.4 million in 2011. The increase was mainly due to the following factors:
| • | Commissions, transportation and other increased $59.7 million, or 22.0%, primarily due to $35.7 million for higher air costs due to increased prices as well as additional capacity associated with the addition of Riviera and $6.9 million for additional product costs associated with the increased inclusive product offerings we added to our European cruise packages in light of the softer European market, while $17.1 million of the increase and costs associated with increased revenues were primarily due to an increase in PDS. |
| • | Onboard and other increased $3.6 million, or 9.7%, due primarily to the revenue generating sailings Riviera beginning May 2012 and an increase of 10.9% in PDS. |
| • | Payroll, related and food increased $14.8 million, or 9.7%. The increase was driven by the addition of Riviera to our fleet in April 2012, offset by the chartering of Insignia in April 2012. The remainder is due to an increase in hotel services costs due to higher passenger volume and higher food costs per PDS, which is based on changes to the Consumer Price Index. |
| • | Fuel increased $8.8 million, or 9.4%, driven by a 3.3% increase in consumption due to the addition of Riviera and a 6.0% increase in our average fuel cost per Metric Ton to $734 per Metric Ton in 2012 from $692 per Metric Ton in 2011. |
| • | Other ship operating increased $9.8 million, or 11.4%, primarily driven by increased capacity with the addition of Riviera partially offset by the chartering of Insignia in 2012. |
The increase was partially offset by the following factors:
| • | Other decreased $4.3 million, or 16.5%, primarily due to expenses associated with two drydocks in 2012 compared to three in 2011. |
Selling and Administrative Expense
Selling and administrative expense for 2012 increased by $7.9 million, or 5.4%, to $153.7 million from $145.8 million for 2011. The increase was primarily due to higher employee costs totaling $9.8 million, which was partially offset by a $1.1 million decrease in sales and marketing costs and a $0.8 million decrease in certain general and administrative costs.
Depreciation and Amortization Expense
Depreciation and amortization expense for 2012 increased $13.7 million, or 17.3%, to $93.0 million from $79.3 million for 2011. The increase was mainly driven by increased depreciation for the addition of Riviera in April 2012.
56
Table of Contents
Non-Operating Income (Expense)
Interest expense, net of capitalized interest, increased $30.1 million, or 29.6%, to $131.7 million in 2012, from $101.6 million in 2011. The increase was primarily driven by the incurrence of the Riviera Loan (as defined herein) and additional interest expense relating to debt discount amortization specific to embedded derivatives. Additionally, in August 2012 the Regent Term Loan was refinanced with a new term loan bearing a higher interest rate margin.
Other income (expense) increased $68.9 million, or 150.0%, to $23.0 million in 2012, from a loss of $45.9 million in 2011. In 2012, we had a net $6.3 million gain on fuel hedges, a net $9.9 million gain of foreign currency hedges and a $15.0 million gain on a bifurcated embedded derivative. These gains were offset by a $4.6 million loss on extinguishment of debt due to the Regent financing transaction and $3.6 million of foreign transaction losses. In 2011, we had a net gain of $9.2 million on fuel hedges, a net loss of $47.1 million on foreign currency hedges primarily due to the foreign currency collars for the Oceania newbuilds, and a $7.6 million loss on extinguishment of debt related to refinancing transactions.
Net Yield
Net Yield increased 1.7% to $365.96 in 2012 from $359.75 in 2011 due to higher cruise fare and onboard and other revenues. The increase in revenues were due to higher occupancy and increases in our ticket prices partially offset by additional product costs associated with the increased inclusive product offerings we added to our European cruise packages in light of the softer European market.
Net Cruise Cost per APCD
Net Cruise Cost per APCD decreased by 0.7% to $272.88 in 2012 from $274.84 in 2011. Net Cruise Cost, excluding fuel cost and other expense, per APCD increased by 0.3% to $210.60 in 2012 from $209.93 in 2011, primarily driven by increased other ship operating costs.
Year Ended December 31, 2011 Compared to Year Ended December 31, 2010
Revenue
Total revenue in 2011 increased $220.0 million, or 29.4%, to $969.1 million from $749.1 million in 2010. The increase was attributable to higher passenger ticket and onboard and other revenues.
| • | Passenger ticket revenue increased $192.8 million, or 30.0%, to $834.9 million in 2011 from $642.1 million in 2010, driven by a $188.8 million increase due to a 29.4% increase in PDS revenue generating sailings on Marina beginning in February 2011, and a $4.0 million increase due to ticket pricing. |
| • | Onboard and other revenue increased $27.2 million, or 25.5%, to $134.3 million in 2011 from $107.0 million in 2010 primarily driven by a $31.5 million increase due to a 29.4% increase in PDS. In 2010 we received a $2.9 million insurance recovery resulting from a ship’s unexpected time out of service for repairs. There was no similar insurance recovery in 2011. |
Cruise Operating Expense
Total cruise operating expense increased $180.8 million, or 37.2%, to $667.4 million in 2011 from $486.6 million in 2010. The increase was primarily due to the following factors:
| • | Commission, transportation and other increased $79.2 million, or 41.2%, primarily due to $37.9 million for higher air costs due to increased capacity with the introduction of Marina in 2011 and $5.1 million for additional product costs associated with the increased inclusive product offerings we added |
57
Table of Contents
| to our European cruise packages in light of a softer European market, including Regent’s launching of its free hotel program, totaling approximately $3.2 million. Commissions expense increased by $30.8 million due to increases in passenger ticket revenue primarily associated with the introduction of Marina. The remaining increase of $4.4 million was primarily due to the addition of Marina in February 2011 and an increase in PDS. |
| • | Onboard and other increased $7.9 million, or 27.2%, due primarily to the addition of Marina beginning February 2011 and an increase of 29.4% in PDS. |
| • | Payroll, related & food increased $31.0 million, or 25.2%, primarily driven by $19.7 million due to the launch of Marina and higher food costs per PDS, which was driven by changes to the Consumer Price Index. |
| • | Fuel expense increased $35.0 million, or 60.4%, driven by a 21.6% increase in consumption due to the addition of Marina and a 32.0% increase in our average cost per Metric Ton to $692 per Metric Ton in 2011 compared to $524 per Metric Ton in 2010. |
| • | Other ship operating increased by $17.5 million, or 25.5%, primarily driven by the launch of Marina in February 2011 and additional port expenses due to changes in itinerary mix. |
| • | Other expenses increased $10.2 million, or 63.5%, primarily attributable an increase of $5.3 million in drydock expenses, $3.7 million increase in pre-opening expense relating to the launch of Marina, and a $1.2 million increase in loss on disposals of property plant and equipment. |
Selling and Administrative Expense
Selling and administrative expense for 2011 increased $11.1 million, or 8.2%, to $145.8 million from $134.7 million for 2010 primarily due to an $11.1 million increase in sales and marketing expenses and a $3.1 million on general and administrative expenses, offset by a $3.1 million reduction in Regent’s trade name royalty fees due to our acquisition of the rights to the trade name in the Regent Seven Seas Transaction. The increase in sales and marketing costs is primarily related to marketing initiatives associated with Marina and Riviera.
Depreciation and Amortization Expense
Depreciation and amortization expense for 2011 increased by $22.7 million to $79.3 million in 2011, compared to $56.6 million for 2010, mainly driven by the addition of Marina in 2011 and capital improvements to our ships made during 2011 drydocks.
Non-Operating Income (Expense)
Interest expense, net of capitalized interest, increased $10.2 million, or 11.2%, to $101.6 million in 2011 from $91.3 million in 2010. The increase was mainly due to the incurrence of the Marina Loan (as defined herein) in 2011.
Other expense increased $3.7 million to $45.9 million in 2011 from $42.2 million in 2010. In 2011, we had a net gain of $9.2 million on fuel hedges, a net loss of $47.1 million on foreign currency hedges primarily due to the foreign currency collars for the Oceania newbuilds, and a $7.6 million loss on extinguishment of debt related to refinancing transactions. In 2010, we had a net gain of $1.1 million on fuel hedges offset by a $43.3 million loss on the foreign currency collars for the Marina and Riviera.
Net Yield
Net Yield decreased by 4.2% to $359.75 for 2011 from $375.33 for 2010, primarily driven by increased capacity of 30.6% associated with the delivery of Marina in 2011.
58
Table of Contents
Net Cruise Cost per APCD
Net Cruise Cost per APCD decreased by 3.4% to $274.84 in 2011, from $284.43 in 2010. Net Cruise Cost, excluding fuel cost and other expense, per APCD decreased by 9.4% to $209.93 in 2011, from $231.81 in 2010, primarily driven by increased capacity due to Marina.
Liquidity and Capital Resources
The following tables summarize our net cash flows and key metrics related to our liquidity:
| Nine Months Ended September 30, |
Percent Change | |||||||||||
| (in thousands) | 2013 | 2012 | 2013 vs. 2012 | |||||||||
| Net cash provided by operating activities |
$ | 200.3 | $ | 167.2 | 19.8 | % | ||||||
| Net cash used in investing activities |
(27.5 | ) | (549.1 | ) | (95.0 | ) | ||||||
| Net cash used in (provided by) financing activities |
(48.6 | ) | 487.9 | (110.0 | ) | |||||||
| Working capital deficit (1) |
(192.6 | ) | (245.8 | ) | (21.6 | ) | ||||||
| Years Ended December 31, | Percent Change | |||||||||||||||||||
| 2012 vs. 2011 |
2011 vs. 2010 |
|||||||||||||||||||
| 2012 | 2011 | 2010 | ||||||||||||||||||
| Net cash provided by operating activities |
$ | 188.1 | $ | 186.3 | $ | 89.8 | 1.0 | % | 107.5 | % | ||||||||||
| Net cash (used in) investing activities |
(539.5 | ) | (603.7 | ) | (179.2 | ) | (10.6 | ) | 236.9 | |||||||||||
| Net cash provided by financing activities |
343.6 | 447.2 | 57.7 | (23.2 | ) | 675.0 | ||||||||||||||
| Working capital deficit (1) |
(267.4 | ) | (272.7 | ) | (208.7 | ) | (1.9 | ) | 30.7 | |||||||||||
| (1) | Total changes in current assets and liabilities |
Sources and Uses of Cash—Operating Activities
Net cash provided by operating activities increased by $33.1 million to $200.3 million for the nine months ended September 30, 2013, from $167.2 million for the nine months ended September 30, 2012, primarily due to an increase in net income adjusted for non-cash items (such as depreciation, amortization, stock compensation, and an unrealized loss on derivative contracts) of $30.3 million and in passenger deposits of $34.9 million, offset by a decrease in other working capital of $32.1 million.
The net increase of $1.8 million in cash provided by operating activities during 2012 compared to 2011 was primarily due to a reduction in net loss adjusted for non-cash items (such as depreciation, amortization, stock compensation, and an unrealized loss on derivative contracts) of $12.4 million, offset by a decrease in passenger deposits of $15.2 million and an increase in other working capital of $4.6 million.
The net increase of $96.6 million in cash provided by operating activities during 2011 compared to 2010 was primarily due to a reduction in net loss adjusted for non-cash items (such as depreciation, amortization, stock compensation, and an unrealized loss on derivative contracts) of $36.5 million, of which $21.6 million is attributable to an increase in depreciation and amortization resulting from the addition of Marina to our fleet during 2011, and an increase in other working capital of $60.1 million.
Sources and Uses of Cash—Investing Activities
Net cash used in investing activities decreased by $521.6 million to $27.5 million for the nine months ended September 30, 2013, compared to net cash used in investing activities of $549.1 million for the nine months ended September 30, 2012. The decrease was primarily due to $431.8 million relating to the purchase of Riviera in 2012. Additionally, in 2012 we had a settlement of a foreign currency collar associated with the Riviera new build that resulted in the payment of $70.3 million. The decrease was offset by an increase in restricted cash of $19.4 million. There were no settled hedges for the nine months ended September 30, 2013.
59
Table of Contents
Net cash used in investing activities decreased by $64.2 million to $539.5 million in 2012, from $603.7 million in 2011. The decrease was primarily due to lower capital expenditures in 2012 and the change in restricted cash.
Net cash used in investing activities increased by $424.6 million to $603.7 million from $179.2 million in 2010. During 2011 we launched Marina and settled $63.1 million of derivative contracts related to the financing of the Marina newbuild, compared to none in 2010.
Sources and Uses of Cash—Financing Activities
Net cash provided by financing activities decreased by $536.5 million to $48.6 million used in financing activities for the nine months ended September 30, 2013, from $487.9 million provided by financing activities for the nine months ended September 30, 2012. In 2013, we had $282.5 million in proceeds from debt issuance, net of debt issuance costs and original issue discount, for the Regent and OCI bank debt refinancing offset by $329.0 million in repayments for the OCI refinancing and a Marina semi-annual principal payment. In 2012, we had $805.7 million in proceeds from debt issuance, net of debt issuance costs and original issue discount related to the drawdown of the Riviera newbuild loan and the refinancing of the Regent Term Loan offset by $315.8 million repayments of bank debt for the Regent refinancing and a Marina semi-annual principal payment.
Net cash provided by financing activities decreased by $103.6 million to $343.6 million in 2012, from $447.2 million in 2011. We had an additional $178.2 million in debt repayments in 2012 compared to 2011, which includes $67.2 million in prepayments on the Oceania O-class debt. We also repaid $34.6 million on the Oceania First Lien Term Loan due April 2012.
Net cash provided by financing activities increased by $389.5 million to $447.2 million in 2011 from $57.7 million in 2010. The increase was primarily due to the proceeds received from the issuance of $760.7 million of long-term debt in 2011 relating to financing the Marina newbuild and Regent’s Senior Secured Notes, offset by $265.6 million repayment of bank debt and proceeds received in 2010 from the issuance of $108.3 million in related party notes.
Funding Sources and Future Commitments
As of September 30, 2013, our liquidity was $378.8 million, consisting of $263.8 million in cash and cash equivalents and $115.0 million available under our revolving credit facilities. We had a working capital deficit of $192.6 million as of September 30, 2013, as compared to a working capital deficit of $267.4 million as of December 31, 2012. Similar to others in our industry, we operate with a substantial working capital deficit. This deficit is mainly attributable to the following: (1) passenger deposits are normally paid in advance with a relatively low level of accounts receivable, (2) rapid turnover results in a limited investment in inventories, and (3) voyage-related accounts payable usually become due after receipt of cash from related bookings. Passenger deposits remain a liability until the sailing date, however the cash generated from these advance receipts is used interchangeably with cash on hand from other sources, such as our revolving credit facilities and other cash from operations. This cash can be used to fund operating expenses for the applicable future sailing, pay down our credit facilities, fund down payments on new vessels or other uses.
We have contractual obligations, of which our debt maturities represent our largest funding requirement. As of September 30, 2013, we have $2,570.1 million in future debt maturities, excluding the debt discount and the unamortized discount on related party debt of $31.0 million and $154.2 million, respectively.
The agreements governing our indebtedness contain a number of covenants that impose operating and financial restrictions, including requirements under our newbuild debt that we maintain a minimum liquidity balance, a maximum debt to EBITDA ratio, a minimum EBITDA to debt service ratio and a maximum debt to
60
Table of Contents
adjusted equity ratio, requirements under our Secured Credit Facilities that we maintain a maximum loan-to-value ratio, a minimum interest coverage ratio (applicable only to revolving credit facilities) and restrictions under Regent’s Senior Secured Notes and our Secured Credit Facilities on our and our subsidiaries’ ability to, among other things, incur additional indebtedness, issue preferred stock, pay dividends on or make distributions with respect to our capital stock, restrict certain transactions with affiliates and sell certain key assets, principally our ships. As of September 30, 2013, we are in compliance with all financial covenants.
Our operating companies credit agreements include various restrictions on the ability to make dividends and distributions to their parent entities and ultimately to us. The following are restricted net assets of our subsidiaries at September 30, 2013, December 31, 2012 and December 31, 2011, respectively: $576.4 million, $458.6 million and $442.9 million.
We believe our cash on hand, expected future operating cash inflows, additional borrowings under existing facilities, our ability to issue debt securities, and our ability to raise additional equity, including capital contributions, will be sufficient to fund operations, debt service requirements, and capital expenditures, and to maintain compliance with financial covenants under the agreements governing our indebtedness, over the next twelve-month period. There can be no assurance, however, that cash flows from operations and additional fundings will be available in the future to fund our future obligations.
On February 1, 2013, Regent amended its $340.0 million Regent Credit Facility (as defined herein), consisting of the $300.0 million Regent Term Loan (as defined herein) and the $40.0 million Regent Revolving Credit Facility (as defined herein). In conjunction with this amendment, the outstanding balance of the Regent Term Loan of $296.3 million was repriced with a margin of 3.5%. There was no change to the $40.0 million Regent Revolving Credit Facility or the maturity date of the Regent Term Loan. There was no impact on covenants, liquidity or debt capacity.
On July 2, 2013, Oceania entered into a new $375.0 million first lien credit facility (the “Oceania Credit Facility”) consisting of a $300.0 million first lien term loan (the “Oceania Term Loan”), which bears interest at a rate of LIBOR with a floor of 1.0% plus a margin of 5.75%, and a $75.0 million revolving credit facility (the “Oceania Revolving Credit Facility”), which includes an original issue discount of 1%. The maturity date of the Oceania Term Loan is July 2, 2020 and the maturity date of the Oceania Revolving Credit Facility is July 2, 2018. As part of this financing transaction, Oceania repaid its outstanding $231.7 million Oceania First Lien Term Loan and $75.0 million Oceania Second Lien Term Loan.
On July 5, 2013, Regent entered into a definitive contract with Italy’s Fincantieri shipyard to build a luxury cruise ship to be named Seven Seas Explorer. Under the terms of the contract, SSC will pay approximately $450.0 million to Fincantieri for the new vessel. Financing for the project was arranged by Credit Agricole Corporate and Investment Bank with support from SACE SpA, Italy’s export credit agency providing borrowings up to $440.0 million. During July 2013, SSC made a payment of approximately $22.0 million to Fincantieri for the initial installment payment for Seven Seas Explorer.
On July 31, 2013, Regent entered into a loan agreement providing for borrowings of up to $440.0 million with a syndicate of financial institutions to finance 80% of the contract cost of the Seven Seas Explorer newbuild plus the export credit premium. The twelve-year fully amortizing loan requires semi-annual principal and interest payments commencing six months following the draw-down date. Borrowings under this loan agreement will bear interest, at the election of Regent, at either (i) a fixed rate of 3.43% per year, or (ii) 2.8% per year plus the LIBOR rate for the applicable interest period. Regent is required to pay various fees to the lenders under this loan agreement, including a commitment fee of 1.1% per annum on the undrawn loan amount. Obligations under the loan agreement are guaranteed by SSC and PCH.
On August 19, 2013, and in connection with the construction of Seven Seas Explorer, we entered into a foreign currency collar with a notional amount of €274.4 million ($365.8 million as of September 30, 2013) to limit our exposure to foreign currency exchange rates for euro denominated payments due at the time the ship will be delivered to us. The maturity date of the collar is June 20, 2016.
61
Table of Contents
Contractual Obligations
As of December 31, 2012, our contractual obligations with initial or remaining terms in excess of one year, including interest expense on long-term debt obligations, were:
| Payments Due By Period | ||||||||||||||||||||
| (in thousands) | Total | Less than 1 year |
1 - 3 years | 3 - 5 years | More than 5 years |
|||||||||||||||
| Interest on long-term debt (1) |
$ | 370,796 | $ | 72,907 | $ | 128,751 | $ | 97,843 | $ | 71,295 | ||||||||||
| Consulting agreement (2) |
1,197 | 772 | 425 | — | — | |||||||||||||||
| Operating lease obligations |
1,758 | 820 | 906 | 32 | — | |||||||||||||||
| Maintenance contract obligations (3) |
23,664 | 6,454 | 10,440 | 6,770 | — | |||||||||||||||
| Regent licensing rights (4) |
2,000 | 2,000 | — | — | — | |||||||||||||||
| Long-term debt (5) |
1,745,994 | 22,322 | 491,807 | 185,120 | 1,046,745 | |||||||||||||||
| Capital lease obligation (6) |
12,455 | 1,122 | 2,329 | 2,448 | 6,556 | |||||||||||||||
| Promissory Notes (7) |
828,859 | — | — | 429,795 | 399,064 | |||||||||||||||
|
|
|
|
|
|
|
|
|
|
|
|||||||||||
| Total |
$ | 2,986,723 | $ | 106,397 | $ | 634,658 | $ | 722,008 | $ | 1,523,660 | ||||||||||
|
|
|
|
|
|
|
|
|
|
|
|||||||||||
| (1) | Long-term debt obligations mature at various dates through fiscal year 2024 and bear interest at fixed and variable rates. The various agreements governing our debt possess variable rate interest calculated based upon LIBOR, plus the applicable margins (the “All In Rate”). At December 31, 2012, the All In Rate was between 1.47% to 9.125% for all periods. Amounts are based on existing debt obligations and do not consider potential refinancing of expiring debt obligations. |
| (2) | Amounts due to former Regent President Mark S. Conroy relating to his independent contractor agreement with Prestige Cruise Services, LLC. |
| (3) | Amounts include obligations under the maintenance agreement with Wartsila Corporation, a third party vendor for certain equipment purchases and monthly maintenance fees signed on March 1, 2012 for a term of sixty months and a software maintenance contract with a third party. |
| (4) | Amounts represent obligations under the terms of the Regent trademark license agreement. |
| (5) | Amounts represent debt obligations with initial terms in excess of one year. The contractual obligation under long-term debt does not reflect any excess cash flow payments we may be required to make pursuant to our Secured Credit Facilities (as defined herein). |
| (6) | Amounts represent capital lease obligations with initial term in excess of one year. |
| (7) | Amounts represent redemption obligations relating to issued promissory notes. |
On July 5, 2013, SSC entered into a definitive contract with Italy’s Fincantieri shipyard to build a luxury cruise ship to be named the Seven Seas Explorer. Under the terms of the contract, SSC will pay approximately $450.0 million to Fincantieri for the new vessel. During July 2013, SSC made a payment of approximately $22.0 million to Fincantieri for the initial installment payment for Seven Seas Explorer.
On July 31, 2013, SSC entered into a loan agreement providing for borrowings of up to $440.0 million to finance 80% of the construction contract for the Seven Seas Explorer. SSC is required to pay various fees to the lenders under this loan agreement, including a commitment fee of 1.10% per annum on the undrawn loan amount payable semi-annually until the delivery of the vessel.
As a normal part of our business, depending on market conditions, pricing and our overall growth strategy, we continuously consider opportunities to enter into contracts for building additional ships. We may also consider the sale of ships or the purchase of existing ships. We continuously consider potential acquisitions and strategic alliances. If any of these were to occur, they would be financed through the incurrence of additional indebtedness, the issuance of additional capital contributions, or through cash flows from operations.
Off-Balance Sheet Arrangements
None.
Quantitative and Qualitative Disclosures About Market Risk
General
We are exposed to market risks attributable to changes in interest rates, foreign currency exchange rates and fuel prices. We manage these risks through a combination of our normal operating and financing activities and
62
Table of Contents
through the use of derivative financial instruments pursuant to our hedging practices and policies as described below. The financial impacts of these hedging instruments are primarily offset by corresponding changes in the underlying exposures being hedged. We achieve this by closely matching the amount, term and conditions of the derivative instrument with the underlying risk being hedged. We do not hold or issue derivative financial instruments for trading or other speculative purposes. Our maximum exposure to counter parties for non-performance is limited to our mark-to-market exposure. We monitor our derivative positions using techniques including market valuations and sensitivity analyses. The turbulence in the credit and capital markets has increased the volatility associated with interest rates, foreign currency exchange rates and fuel prices. However, we have taken steps to mitigate these risks such as the interest rate swap agreements, foreign currency swaps or collars, and fuel hedge swap agreements described below.
Interest Rate Risk
Our exposure to market risk for changes in interest rates relates to our long-term debt obligations including future interest payments. We use interest rate swap agreements to modify our exposure to interest rate fluctuations and to manage our interest expense.
In July 2011, Oceania entered into three forward starting interest rate swap agreements to hedge the variability of the interest payments related to the outstanding variable-rate debt associated with Marina newbuild financing. The first swap, with an amortizing notional amount of $450.0 million at inception, was effective beginning January 19, 2012 and matured on January 19, 2013. The second swap, with an amortizing notional amount of $405.4 million became effective on January 19, 2013 and matures on January 19, 2014. The third swap, with an amortizing notional amount of $360.8 million becomes effective January 19, 2014 and matures on January 19, 2015.
In March 2013, Oceania entered into an additional forward starting interest rate swap agreement to hedge the variability of the interest payments related to the outstanding variable-rate debt associated with Marina newbuild financing. The swap, with an amortizing notional amount of $300.0 million at inception, is effective beginning January 20, 2015 and matures on January 19, 2016.
Also in March 2013, Oceania entered into two forward starting interest rate swap agreements to hedge the variability of the interest payments related to the outstanding variable-rate debt associated with Riviera newbuild financing. The first swap, with an amortizing notional amount of $422.4 million at inception, is effective beginning October 28, 2013 and matures on October 27, 2014. The second swap, with an amortizing notional amount of $377.6 million becomes effective on October 27, 2014 and matures on October 27, 2015.
All interest rate swaps are designated as cash-flow hedges and meet the requirements to qualify for hedge accounting treatment. The changes in fair value of the effective portion of the interest rate swaps are recorded as a component of accumulated other comprehensive income (loss) on our consolidated balance sheets. The total notional amount of interest rate swap agreements effective and outstanding as of September 30, 2013 and December 31, 2012 was $383.1 million and $427.7 million, respectively.
Foreign Currency Exchange Risk
Our exposure to market risk for changes in foreign currency relates to our use of foreign currency swaps. These foreign currency swaps are used to limit the exposure to foreign currency exchange rates, for euro denominated payments related to the construction of newbuilds, payments related to drydock expenses and other operational expenses.
63
Table of Contents
During August 2013, Regent entered into a foreign currency collar option with an aggregate notional amount of €274.4 million ($365.8 million as of September 30, 2013) to hedge a portion of our foreign currency exposure related to the ship construction contract for of Seven Seas Explorer. The notional amount of the collar represents 80% of the contract cost of the vessel due at delivery. This foreign currency collar option was designated as a cash flow hedge at the inception of the instrument and will mature in June 2016. The change in fair value of the effective portion of the derivative was recorded as a component of accumulated other comprehensive income in the accompanying consolidated balance sheets. There was no ineffectiveness recorded as of September 30, 2013. Ineffective portions of future changes in fair value of the instrument will be recognized in other income (expense) in the statement of operations.
Fuel Price Risk
Our exposure to market risk for changes in fuel prices relates to the consumption of fuel on our vessels. We use fuel derivative swap agreements to mitigate the financial impact of fluctuations in fuel prices. As of September 30, 2013, we entered into fuel related swap agreements to hedge 170,100 barrels, or 75%, of our estimated fuel consumption for the remainder of 2013 and 400,800 barrels, or 40%, of our estimated 2014 fuel consumption and 101,100 barrels, or 10%, of our estimated 2015 fuel consumption. The fuel swaps do not qualify for hedge accounting; therefore, the changes in fair value of these instruments are recorded in other income (expense) in the consolidated statements of operations.
We have certain fuel derivative contracts that are subject to margin requirements. For these specific fuel derivative contracts, we may be required to post collateral if the mark-to-market exposure exceeds $3.0 million. On any business day, the amount of collateral required to be posted is an amount equal to the difference between the mark-to-market exposure and $3.0 million. As of December 31, 2012 and 2011, we were not required to post any collateral for our fuel derivative instruments. As of September 30, 2013, our exposure was $0.0 million. Therefore, we would have had to incur an additional mark-to-market exposure of $3.0 million on our outstanding fuel derivative contracts in order for us to be required to post collateral.
Recently Adopted and Future Application of Accounting Standards
As of January 1, 2013, we adopted Financial Accounting Standards Board ASU 2011-11, Disclosures about Offsetting Assets and Liabilities. It requires an entity to disclose information about offsetting and related arrangements to enable users of its financial statements to understand the effect of those arrangements on its financial position. In 2013, this pronouncement was enhanced by ASU 2013-1, Balance Sheet Offsetting. This update clarifies that ordinary receivables are not within the scope of ASU 2011-11 and it applies only to derivatives, repurchase agreements, reverse purchase agreements and other securities lending transactions. The adoption did not materially impact our consolidated financial statements.
In February 2013, the Financial Accounting Standards Board issued ASU 2013-02, Comprehensive Income (Topic 220): Reporting of Amounts Reclassified Out of Accumulated Other Comprehensive Income. It requires an entity to present the effects on the line items of net income of significant amounts reclassified out of accumulated other comprehensive income, but only if the item reclassified is required under GAAP to be reclassified to net income in its entirety in the same reporting period. Entities must also cross-reference to other disclosures currently required under GAAP for other reclassification items to be reclassified directly to net income in their entirety in the same reporting period. This standard was effective beginning January 1, 2013. See Note 6. “Accumulated Other Comprehensive Income” to our unaudited consolidated financial statements included elsewhere in this prospectus for impact.
In July 2013, the Financial Accounting Standards Board issued ASU 2013-10, Inclusion of the Federal Funds Effective Swap Rate as a benchmark interest rate for hedge accounting purposes. This guidance is effective prospectively for qualifying new or redesignated hedging relationships entered into on or after July 17, 2013. We adopted this guidance as of July 17, 2013, and it did not have a material impact on our consolidated financial statements.
64
Table of Contents
Our Company
We are the market leader in the Upscale segment, which is comprised of the Upper Premium and Luxury segments, of the $29 billion cruise industry, and we are focused on providing our guests with extraordinary experiences. These experiences are characterized by gourmet cuisine, high quality service, luxurious accommodations and distinctive itineraries to “must see” destinations worldwide. Our cruise vacations are tailored to the preferences of affluent individuals globally, who are generally 55 years of age and older. This target market, referred to as the baby-boomers in the United States, is both the largest and fastest growing U.S. demographic. Our focus on this demographic allows us to deliver a vacation lifestyle that our guests can expect, enjoy and are willing to pay a premium price to experience. Our cruise vacations are exclusive and upscale and are designed to encourage our guests to form an emotional attachment to our ships and staff, creating a long-lasting affinity for our brands.
Our brands, Oceania and Regent, are comprised of eight cruise ships, with a ninth under construction for Regent. Oceania operates in the Upper Premium segment and Regent operates in the Luxury segment. We believe we have successfully positioned our two brands as the cruise lines of choice with the fast growing baby-boomer demographic. Our brands occupy a leading position in the Upscale segment, representing approximately 46% of the combined berth capacity of the Upscale segment as of September 30, 2013. We believe our two-brand strategy is key to maintaining our market leading position, as it allows us to offer products in the Upscale segment with distinct brand promises to a growing global demographic.
We focus on providing destination-oriented vacations combined with distinctive onboard experiences, such as gourmet cuisine, spacious and comfortable public areas, high levels of service and luxurious in-suite amenities. Our ships have limited guest capacity per ship, ranging from 490 to 1,250 guests, and are significantly smaller than the typical 2,000 to 5,000 passenger ships operated by the Contemporary and Premium segment brands. Our stateroom accommodations are large and luxurious, consistent with an upscale and exclusive cruise experience, with over 87% of the suites and staterooms on our ships featuring private balconies. Our onboard dining is a central highlight of our cruise experience and features multiple open seating gourmet dining venues where guests may dine when, where and with whom they wish. Our ships are staffed with a crew-to-guest ratio of approximately 1 to 1.7, further promoting a high level of service. This luxury-focused product offering drives our industry leading Net Yields.
We focus on deploying our ships to high demand and in-season locations worldwide. Our smaller ship size allows us to travel to more remote ports around the world, thereby meeting our guests’ demand for experiencing the most sought after destinations. The duration of our cruises varies from seven to 180 days, featuring worldwide itineraries that visit approximately 350 ports each year, including destinations such as Scandinavia, Russia, the Mediterranean, the Greek Isles, Alaska, Canada and New England, Asia, Tahiti and the South Pacific, Australia and New Zealand, Africa, India, South America, the Panama Canal and the Caribbean. We also have the only cruise line (Oceania) to offer a port-intensive 180 day “Around the World” cruise that circumnavigates the globe. Our ships are designed to be classic and refined, providing a comfortable cruise experience featuring the gourmet cuisine, highly attentive service and elegant surroundings that our target market is seeking, rather than the extravagant and flashy onboard features found on many larger ships catering to the mass market. We believe this key advantage will allow us to continue to grow our Net Yields across our entire fleet, and not just from new ship introductions, and to experience a more consistent and predictable return on invested capital over the useful life of our ships.
Our affluent and mostly retired or semi-retired guests plan their cruise vacations well ahead of sail date, which gives us high visibility into our future revenues. On average, our guests book seven to nine months in advance of sail date, which provides us ample lead time to effectively plan our sales and marketing initiatives and optimize our industry leading Net Yields. Because of the more all-inclusive nature of our product offerings, we generate a larger share of our overall revenue at time of booking compared to the rest of the industry, which
65
Table of Contents
provides us with even greater visibility into our total revenues. Another key differentiating factor is our disciplined and transparent go-to-market strategy. Unlike most cruise lines that discount inventory regularly to fill capacity (“price to fill”), our strategy to maximize revenue is to increase marketing efforts (“market to fill”) as the cruise date approaches. In order to accelerate sales, we clearly articulate to customers and travel agents that our prices are subject to increase as the cruise date approaches, as well as the specific dates on which those increases may occur. This strategy allows us to maintain and improve our high price point, which is fundamental in the Upscale segment.
Our senior management team has delivered consistent revenue, EBITDA and net income growth, producing measurable improvements in all three growth phases of the cruise industry. Frank J. Del Rio launched a new brand with the introduction of Oceania in 2003 and leads the company as our Chairman and CEO. We acquired Regent in 2008 and improved our results following the acquisition, including generating $18.0 million in cost synergies and increasing occupancy and yields. We also completed a newbuild program with the successful launch of Oceania’s Marina in January 2011 and Oceania’s Riviera in April 2012. We are committed to maintaining a disciplined growth strategy to maximize shareholder value by profitably growing our business while continuing to reduce our debt and increase our return on invested capital.
Our operating structure is integrated, with both of our brands sharing a single headquarter location and back office functions. This approach creates a culture of institutionalizing best practices, driving efficiencies and taking advantage of scale. Our brands maintain separate sales and marketing teams as well as dedicated reservation centers, which allows each brand to maintain and effectively communicate its unique identity and brand promise. This balanced approach leverages best-in-class operations to deliver consistently outstanding experiences to our guests while keeping our overhead expenditures low and our competitive position strong. This strategy also allows us to leverage our scale in order to develop international source markets effectively and permits other efficiencies such as implementing a common reservation system, shared data center and a common pool of well trained and experienced onboard crew and officers.
For the twelve months ended September 30, 2013, we generated total revenue of $1.2 billion, Net Revenue of $787.2 million, Adjusted EBITDA of $253.4 million and Adjusted EBITDA Margin of 21.6%. In comparing our Adjusted EBITDA Margin to other cruise lines, it is important to note that our more inclusive product offering results in higher Commissions, transportation and other expense. Accordingly, we believe a more appropriate margin analysis is Net Revenue Adjusted EBITDA Margin, which is Adjusted EBITDA divided by Net Revenue, which was 32.2% for the twelve months ended September 30, 2013. See “Prospectus Summary—Summary Consolidated Financial Information” for a reconciliation of Adjusted EBITDA to net income.
Our Brands
Oceania
Oceania was formed in 2003 by Frank J. Del Rio, now Chairman and CEO of our company, to focus on the under-penetrated midsize ship cruise market. Oceania specializes in offering destination-oriented cruise vacations, gourmet culinary experiences, elegant accommodations and personalized service at a compelling value. Oceania owns and operates a five ship fleet, comprised of three 684 guest R-Class ships: Regatta, Insignia and Nautica, and two new 1,250 guest O-Class ships: Marina and Riviera, which joined the fleet in 2011 and 2012, respectively.
Oceania provides an Upper Premium midsize ship cruise experience designed primarily for affluent baby-boomers. The line positions itself as the affordable cruising alternative between the Luxury ($500 plus per person per diems) and Premium ($150 to $250 per person per diems) segments of the cruise industry. Affluent guests, who historically have been loyal cruise customers on small and midsize ships, have seen the number of these type of ships diminish in recent years as the major cruise operators have focused on building ever larger ships (2500+ passengers) in the Premium cruise category.
66
Table of Contents
In 2011 and 2012, Oceania took delivery of the first two O-Class vessels, Marina and Riviera, with a capacity of 1,250 guests each. We believe the O-Class ships are the world’s finest vessels designed and purpose-built for the Upper Premium market, expanding upon the popular elements featured on Oceania’s original fleet of vessels, with an emphasis on large suites and staterooms and an exceptional epicurean experience. The overall mix of suite and balcony stateroom accommodations on the O-Class ships of 95% positions these vessels to generate higher Net Yields than the R-Class ships, with 68% balcony staterooms.
Oceania is ranked as one of the world’s best cruise lines by Condé Nast Traveler, Travel + Leisure, Departures, Travel Age West and Cruise Critic. Oceania ships received Best Dining, Best Public Rooms and Best Cabins from Cruise Critic Cruisers’ Choice Awards in 2013. Oceania also is the only cruise line to have had one of its ships receive a perfect “100” score for “Dining” in the Condé Nast Traveler Reader’s Choice Awards.
Regent
Regent is recognized as one of the world’s top luxury lines, featuring six-star service, oversized balcony suite staterooms and the cruise industry’s most inclusive product offering. Regent is a leading luxury cruise company and traces its origins to 1992, when Seven Seas Cruise Line merged with Diamond Cruise to become Radisson Seven Seas Cruises. In 2006, the cruise line was re-branded by its then-owner Carlson Company as Regent Seven Seas Cruises. Regent currently operates three award-winning, all-suite ships, comprised of Seven Seas Navigator, the all-balcony Seven Seas Mariner and the all-balcony Seven Seas Voyager, totaling 1,890 aggregate berths. Regent offers the industry’s most all-inclusive cruise vacation experience, including free air transportation, a pre-cruise hotel night stay, premium wines and top shelf liquors, gratuities, internet access and unlimited shore excursions.
Regent is currently building a 750 passenger ship, Seven Seas Explorer, for delivery in the summer of 2016, which we believe will further elevate the position of the Regent brand. The all-suite, all-balcony ship will feature sophisticated designer suites ranging from 300 to 3,500 square feet with an industry leading space ratio of 89.3 and a crew-to-guest ratio of 1 to 1.4. The ship will include six open-seating gourmet restaurants, Regent’s signature nine-deck open atrium, a two-story theater, three boutiques and an expansive Canyon Ranch SpaClub®. Operationally, the vessel will be a green ship, employing the most advanced environmental systems and state-of-the-art technology.
Regent focuses on providing guests with a high level of personal service, imaginative world-wide itineraries, unique shore excursions and land tours, world-class accommodations and top-rated cuisine. Regent is consistently ranked among the top luxury cruise lines by various travel publications. In 2011, 2012 and 2013, Regent was named the Best Luxury Cruise Line by Virtuoso, one of America’s largest travel agency networks, which caters to the highly affluent traveler. In 2012, Condé Nast Traveler awarded the brand “Best Cabins” and it received the “Best for Luxury” award from the Cruise Critic Editor’s Pick Awards. Regent also was honored with “World’s Best Service” from Travel + Leisure’s World’s Best Awards in 2013.
Our Industry
We believe that the cruise industry demonstrates the following positive fundamentals:
Strong Growth with Low Penetration and Significant Upside
Cruising represents a small but fast growing sector of the overall global vacation market. Cruising is a vacation alternative with broad appeal, as it offers a wide range of products, destinations and experiences from offerings in the Contemporary (large ships / low ticket prices) to Luxury (small ships / high ticket prices) segments to suit the various preferences of vacationing consumers of all ages, wealth levels and nationalities. According to CLIA, only 24% of the U.S. population has taken a cruise. However, CLIA estimates that during 2012, approximately 17 million global passengers went on a cruise, an increase of 5.4% over the preceding year.
67
Table of Contents
According to CLIA, the number of cruise passengers originating from North America has increased each year since 1995 as cruising has evolved from a niche vacation experience to a leisure holiday with broad appeal across all demographic and psychographic groups. Despite this consistent growth, the cruise industry still has low penetration levels compared to similar land-based vacations. Based on industry research, in 2012, 57.2 million people visited Orlando, Florida and 39.7 million people visited Las Vegas, Nevada. We believe this data highlights the continued growth potential for ocean going cruising. The future growth of the Contemporary and Premium segments, along with the normal aspirational life cycle of consumer preferences, is especially important for our company, because the vast majority of our first time guests are not first time cruisers. Accordingly, increases in the number of guests in the Contemporary and Premium segments will increase the pool of potential first time guests for our two brands.
Attractive Demographics of Target Market
Long-term demographics are favorable for the cruise industry, in particular for the Upscale segment. Historically, people 55 years of age and older have had the highest disposable income levels and the most leisure time, making them prime candidates for Upscale cruising given the longer itineraries and higher per diems of cruises in that category. According to U.S. Census Bureau data, in 2010, the 55 years and older age group was comprised of 77 million individuals, representing approximately 25% of the U.S. population. This group is expected to increase to 87 million by 2015 and 106 million by 2025. These individuals control $12.7 trillion of wealth and represent approximately 31% of the global high net worth individual population. The demographics in Europe are expected to follow a similar growth trend.
International Growth in Emerging Markets
Significant growth opportunities exist for sourcing guests from Europe and other international markets, as the percentage of guests from outside North America who have taken cruises is far lower than the percentage of North Americans. Emerging markets in Asia and the Pacific Rim also hold strong potential for us to source future cruise passengers. As recently as seven years ago, no international cruise lines serviced these regions. However, a number of cruise lines in the Contemporary and Premium segments, which typically includes cruises of seven days or less, have a more casual ambiance, and offer the lowest prices, have recently deployed ships in Asia for seasonal or year-round operations. The increase in personal wealth in these and other emerging markets is particularly beneficial to the cruise industry, as historically, when the living standards improve in a country, the population first focuses on buying physical assets (e.g., houses, cars, etc.) and then focuses on buying aspirational experiences, such as travel. Overall, the growth in cruising outside of North America has been increasing at a considerably faster pace than within North America.
68
Table of Contents
Multiple Segments
The cruise industry’s brands have been historically segmented into the Contemporary, Premium, Upper Premium and Luxury categories. Collectively, we refer to the Upper Premium and Luxury categories as the Upscale segment. The Premium segment typically includes cruises that range from seven to fourteen days. Premium cruises emphasize higher quality offerings, more personal comfort and greater worldwide itineraries, with higher average pricing than the Contemporary cruises. Upper Premium is a niche market segment created by Oceania in 2003 and defined by an experience that straddles the Premium and Luxury segments but with smaller ships than those operated by the Premium lines, higher space and higher crew-to-guest ratios, more refined culinary programs, higher service standards and a greater destination-oriented focus than the Premium segment. The Luxury segment is characterized by the smallest vessel size, unique itineraries, the largest stateroom accommodations, gourmet culinary programs, highly personalized service and a more inclusive offering. These exclusive attributes, combined with limited supply growth and a growing worldwide target population, provide Upscale operators with significant pricing leverage as compared to the other segments of the cruise industry.
High Barriers to Entry
The cruise industry is characterized by high barriers to entry, including the existence of well-known and established consumer brands, the cost, time and personal relationships required to develop strong travel agent network partnerships necessary for success, the large capital expenditures required to build new and sophisticated ships, the limited number of ship builders with experience in constructing passenger ships and the long lead time necessary to construct new ships. Based on recently announced newbuilds and depending on the intended industry segment, the cost to build a new cruise ship can range from $340 million to $1.3 billion, or $195,000 to $741,000 per berth. The ultimate cost depends on the ship’s size and product offering, with the Upper Premium and Luxury segments having the highest cost per berth in the industry, ranging from $443,000 to $741,000 per berth. The Luxury segment in particular has demonstrated high barriers to entry with our competitors having participated in the market for an average of approximately 24 years. We believe that the newbuild pipeline in the Upscale segment is relatively favorable compared to the broader industry, with few deliveries scheduled through 2016 other than Regent’s newbuild.
Our Competitive Strengths
We believe that the following business model attributes enable us to successfully execute our strategy:
Lifestyle Brand
Prestige’s two brands, Regent and Oceania, both have long and venerable histories. We believe the two brands are well known within the affluent 55 and older age group in North America as offering a sophisticated experience. We partner with several fine luxury brands, including Lalique, Hermes, Bulgari, Canyon Ranch and Bon Appetit, to further add caché to the lifestyle experiences we deliver onboard our cruises. Consistent with our upscale image, we believe our two brands will continue to enjoy resiliency in economic downturns and achieve above-market Net Yields during normal economic conditions.
High Quality Fleet
Our two-brand fleet, which currently consists of eight ships, is designed to provide guests with the highest quality cruise experience. Our accommodations are large and luxurious with over 87% of our staterooms and suites featuring private balconies. Capacity per ship is limited and ranges from 490 to 1,250 guests, providing each guest a unique and highly personalized experience, with space ratios of 44.26 to 68.68, which are among the highest in the industry. Our cruises are staffed at a crew-to-guest ratio of approximately 1 to 1.7, further promoting a high level of personalized service. Seven Seas Mariner and Seven Seas Voyager feature all suite, all balcony accommodations, and Marina and Riviera, 95% of whose accommodations feature balconies, are the
69
Table of Contents
only ships at sea to feature suites designed and furnished by Ralph Lauren Home and noted interior designer Dakota Jackson. We expect delivery of our newbuild Seven Seas Explorer in the summer of 2016, which we believe will be the most luxurious ocean-going ship ever built.
Differentiated Product Offering
We believe that our destination-focused worldwide itineraries of varying lengths, augmented by exciting shore excursions and other land based programs and a diverse set of onboard enrichment programs, further differentiate our two brands from our competitors. We also focus on deploying our ships to high demand and in-season locations worldwide. We cruise to more remote ports around the world to meet passengers’ demands to experience new, exotic and out-of-the-way destinations. We feature itineraries that call on “must see” destinations, many of which include overnight stays in port, allowing guests to enjoy greater local immersion. A competitive advantage of our smaller ship size is that we can access smaller ports that are off-limits to larger ships. Our onboard dining is a central highlight of our cruise experience, with multiple open seating dining venues where guests may dine when, where and with whom they wish. We continue to receive awards for our onboard dining and, in 2013 received “Best Dining” from both Condé Nast Traveler Reader’s Choice Awards and Cruise Critic Cruisers Choice Awards. We also feature the only hands-on instructional culinary centers at sea onboard Oceania’s Marina and Riviera. Our state-of-the-art spa facilities on each vessel feature the highly renowned Canyon Ranch SpaClub®. We believe that these high quality product offerings positions us well compared to other cruise operators and provides us with the opportunity to continue growing our capacity and Net Yields.
Loyal and Repeat Customer Base
Our target customer is 55 years of age or older, has a net worth of over $1.0 million, is well educated and is a seasoned world traveler. This target audience has reached an age and wealth status where the convenience, comfort and luxury amenities of an upscale cruise product are extremely appealing.
Our award-winning service, innovative itineraries, gourmet cuisine and luxurious onboard amenities have resulted in nearly perfect passenger satisfaction ratings. In 2013, approximately 98% of guests that responded to our survey reported that their cruise experience met or exceeded their expectations, and that they will “definitely” or “probably” return. Furthermore, for the nine months ended September 30, 2013, repeat guests accounted for approximately 41% of total guests on a Passenger Days Sold basis. Our ability to consistently deliver a high quality, high value product, resulting in high guest satisfaction, continues to be a competitive advantage.
Experienced Management Team and Shareholder
We are led by a management team with extensive cruise and leisure industry experience. The team includes Frank J. Del Rio as Chairman and CEO with 20 years of industry experience, Robert J. Binder as Vice Chairman and President with 23 years of industry experience, Kunal S. Kamlani as President of PCH, Regent and Oceania with 19 years of experience in the financial services and leisure industries, T. Robin Lindsay as Executive Vice President of Vessel Operations with 34 years of industry experience and Jason M. Montague as Executive Vice President and Chief Financial Officer with 13 years of industry experience.
Our principal shareholder and sponsor Apollo has experience investing in the cruise, leisure and travel related industries. Apollo is a leading global alternative asset manager. In addition to holding a controlling interest in us, Apollo is a significant shareholder and controls the board of Norwegian Cruise Line Holdings Ltd., one of the leading global cruise line operators. Apollo also has current investments in other travel and leisure companies, including Caesars Entertainment and Great Wolf Resorts, and has in the past invested in Vail Resorts, Wyndham International and other hotel properties.
70
Table of Contents
Cash Flow Generation
Our business model allows us to generate a significant amount of free cash flow with high revenue visibility. We encourage our target customers to book their cruise vacations as early as possible in the sales cycle and to prepay for certain optional services. We begin to sell our inventory up to 20 months prior to sail date, with deposits generally due within seven days of booking and final payment collected 90 to 150 days before sailing. This payment model results in passenger deposits being a source of cash, provides strong visibility into our future revenues and corresponding cash flows and gives us ample time to adjust selling price and sales and marketing initiatives to minimize acquisition costs and maximize Net Yields. Moreover, we benefit from favorable U.S. tax status, as our income is primarily derived from the operation of cruise ships in international waters and is therefore generally exempt from U.S. federal income taxes. As a result of these factors, we generate significant free cash flow, a portion of which can be used for debt reduction and capacity expansion.
Superior Value Proposition
A substantial number of cruise customers purchase large balcony staterooms measuring over 200 square feet in size on cruise lines in the Contemporary and Premium segments. We believe that after factoring in additional onboard spending for items that would be included in our ticket price, these passengers are currently paying per diems similar to what we charge, but in our opinion, receive a lower quality product, with inferior cuisine, standard itinerary offerings, diminished personalized service due to significantly lower crew-to-guest ratios and markedly lower space ratios. According to our research, there are approximately 22,297 large balcony staterooms measuring over 200 square feet in the North American cruise industry. Our market share of this type of stateroom was only 10% in 2012. We believe our brands are well positioned for future capacity growth given each brand’s market positioning and strong value proposition.
Our Business Strategy
The following are the key components of our business strategy:
Disciplined Growth
Our goal is to grow with discipline, and we are constantly evaluating various strategies for further increasing our passenger capacity and, accordingly, our total revenues and net income with a specific focus on increasing our return on invested capital. These strategies include further penetration into emerging international markets and potential acquisitions of niche cruise operators, similar to the successful acquisition of Regent in 2008. Other possibilities include additional newbuild programs, similar to the additions of Marina and Riviera to the Oceania fleet in 2011 and 2012, respectively, as well as the scheduled delivery of the Seven Seas Explorer to the Regent fleet in the summer of 2016. Each ship that has joined our fleet has had a significant positive impact on our financial results with limited incremental overhead.
High Visibility and Differentiated Revenue Management Strategy
We have implemented a differentiated price enhancing revenue management strategy that encourages our target market to book early to obtain the most attractive value offering, with bookings made up to 20 months in advance of sail date. This timeline provides us with greater visibility into our future revenues and gives us ample time to adjust sales, marketing and pricing initiatives as necessary. Due to the more inclusive nature of our product offerings, a greater percentage of our Net Revenue is comprised of net ticket revenue as compared to Contemporary and Premium segment cruise lines, which must wait until the actual sailing to gain visibility into much of their revenues, as their onboard revenue represents a greater portion of their total revenue. On average, our guests book seven to nine months in advance of sail date. Based on our research, we believe the industry average booking curve is five months or less.
When we launch new itineraries, we clearly articulate to potential customers and travel agents that prices are subject to increase as the cruise date approaches, as well as the specific dates on which those price increases may
71
Table of Contents
occur. We believe the travel agent community favors our pricing strategy as it allows them to provide value to their customers in a completely transparent manner, resulting in early bookings. This early booking cycle allows us to make more informed decisions about pricing, inventory management and marketing efforts.
Focus on Occupancy and Maximize Net Yields
We concentrate on improving our early booking occupancy rates to drive higher Net Yields. We execute targeted and high frequency marketing campaigns that communicate a distinct message of our differentiated value-packed cruise offerings in both North American and select international markets. To increase the effectiveness of our targeted marketing programs, we recently transformed our Miami call center from an inbound-only reservation center to one that also makes outbound calls to high potential targeted customers. This dual prong strategy allows us to maximize the revenue potential from each customer contact (“leads”) generated by our various marketing campaigns. We expect that this strategic change and other initiatives in our sales organization and distribution channels will help drive sustainable growth in the number of guests carried and in Net Yields achieved.
Due to our brands’ clear positioning and our target market focus on an older and more affluent clientele, we do not carry many families with children or groups of individuals that travel three or four to a stateroom. Conversely, we have a small but increased number of elderly guests who prefer to travel as “singles,” or one to a stateroom. Because 100% occupancy is based on two persons in a stateroom, we tend to report occupancies that are somewhat lower than those of the Premium and Contemporary cruise lines, while still sailing close to full in terms of cabin occupancy.
Improve Operating Efficiency and Lower Costs
We focus on driving continued financial performance through a variety of business improvement initiatives. These initiatives focus on reducing costs while also improving the overall product quality we deliver to our customers. For example, when we acquired Regent in 2008, we were able to achieve $18 million in annual cost savings through rationalizing overhead and institutionalizing best practices across the two brands.
Our business improvement initiatives focus on various cost containment programs such as contract negotiations, global purchasing and logistics, fuel consumption efficiencies and optimal itinerary deployments. We hedge our fuel purchases in order to provide greater visibility and certainty of our fuel expenses. As of September 30, 2013, we had hedged approximately 75% of estimated fuel consumption for the remainder of 2013, and approximately 40% and 10% of our estimated fuel consumption for 2014 and 2015, respectively. In addition, we expect benefits derived from economies of scale from additional newbuilds will further drive operating efficiencies over the medium and long term.
Expand and Strengthen Our Product Distribution Channels
We have three primary sales channels that we constantly strive to optimize: “Retail/Travel Agent,” “International” and “Meetings, Incentives and Charters.” As part of this optimization, we continue to invest in our brands by enhancing our technology platforms across these channels, including through websites and other global distribution systems, as well as our inbound and outbound reservations department that travel agents and customers use to book cruise vacations. We strive to continually deliver efficient and timely marketing information across multiple technological and legacy type platforms.
| • | Retail/Travel Agent. We make substantial investments to facilitate our travel agent partners’ success with improvements in booking technologies, transparent pricing strategies, effective marketing tools, improved communication and cooperative marketing initiatives. We have also implemented automated communication, training and booking tools specifically designed to improve our efficiency with the |
72
Table of Contents
| travel agency community and our guests, including aggressive call center quality monitoring. We have sales force teams dedicated to each of our two brands who work closely with our travel agency partners on maximizing their marketing and sales effectiveness through product training, education and the sharing of “best-practices.” |
| • | International. We have an international sales office in Southampton, United Kingdom that services Europe and various general sales agents covering Latin America, Australia and Asia. Since the expansion of our fleet in 2011, we have made a concerted effort to diversify the sourcing of our passengers worldwide. In 2010, 20.2% of our passengers were sourced from outside the United States. In 2012, we grew that amount to 25.3%. For the twelve months ended September 30, 2013, 26.6% of our passengers were sourced from outside the United States. We believe there remains significant opportunity to grow passenger sourcing in many major markets such as Europe and Australia as well as in emerging markets in the Asia Pacific region. |
| • | Meetings, Incentives and Charters. This channel focuses on full ship charters as well as partial ship groups for corporate meeting and incentive travel. These sales often have very long lead times and can fill a significant portion of a ship’s capacity, or even an entire sailing, in one transaction. In addition, full ship charters and/or large groups strengthens base-loading, which allows us to fill a particular sailing earlier than usual which in turn allows us to reduce sales and marketing spend on both the sailing with the large group as well as surrounding sailings. |
Our Fleet
Collectively, our two brands operate eight ships with 6,442 berths in aggregate. We also have one newbuild, Seven Seas Explorer, with 750 berths on order for delivery in the summer of 2016. Our current fleet has a maximum of 2,351,330 capacity days that will grow 11.6% to 2,625,080 after delivery of the Seven Seas Explorer in the summer of 2016.
Oceania operates five ships. The R-Class ships, Regatta, Insignia and Nautica are identical highly-rated 5-star ships featuring country club style accommodations and amenities. Capacity on each ship is limited to 684 guests and our cruises are staffed at a crew-to-guest ratio of approximately 1 to 1.7. These ships provide 68% of suites and staterooms with private balconies. Recently, Oceania successfully executed a fleet expansion program with the additions of two O-Class ships, Marina and Riviera, in 2011 and 2012, respectively. The O-Class vessels are staffed at a crew-to-guest ratio of approximately 1 to 1.6 and 95% of the staterooms are suites and have private balconies. Oceania’s fleet has grown 122% since 2010 to 4,552 berths in aggregate and operating a maximum annual capacity of 1,661,480 capacity days. Oceania is the world’s largest Upper Premium cruise line.
Regent currently operates three six-star luxury cruise ships, Seven Seas Navigator, Seven Seas Mariner and Seven Seas Voyager, with 1,890 berths in aggregate, featuring world-class accommodations and amenities. Regent operates at a maximum capacity of 689,850 capacity days. Capacity on each ship is limited and ranges from 490 to 700 guests and cruises are staffed at a crew-to-guest ratio of approximately 1 to 1.6. All ships offer all-suite accommodations with 90-100% of the suites featuring private balconies. Delivery of the 750 guest newbuild, Seven Seas Explorer, is expected in the summer of 2016. The all-suite, all-balcony Seven Seas Explorer will feature sophisticated designer suites ranging from 300 square feet to 3,500 square feet with an industry leading space ratio of 89.3 gross tons per guest and a crew-to-guest ratio of 1 to 1.4. The ship will include six open-seating gourmet restaurants, Regent’s signature nine-deck open atrium, a two-story theater, three boutiques and an expansive Canyon Ranch SpaClub®. Operationally, it will be a green ship, employing the most advanced environmental systems and state-of-the-art technology. Upon delivery of the Seven Seas Explorer, Regent will be the world’s largest luxury cruise line.
73
Table of Contents
The following table describes the features of our ships:
| Marina, Riviera |
Regatta, Insignia, Nautica |
Seven Seas Explorer |
Seven Seas Voyager |
Seven Seas Mariner |
Seven Seas Navigator | |||||||
| Berths |
1,250 | 684 | 750 | 700 | 700 | 490 | ||||||
| Balconies |
95% | 68% | 100% | 100% | 100% | 90% | ||||||
| Gross tonnage |
66,084 | 30,277 | 67,000 | 42,363 | 48,075 | 28,803 | ||||||
| Space ratio (1) |
52.86 | 44.26 | 89.33 | 60.52 | 68.68 | 58.78 | ||||||
| Accommodations (sq ft) |
174-2,000 | 160-982 | 300-3,500 | 350-1,403 | 301-2,002 | 301-1,173 | ||||||
| Crew-to-guest ratio |
1:1.6 | 1:1.7 | 1:1.4 | 1:1.6 | 1:1.6 | 1:1.4 | ||||||
| Country of registry |
Marshall Islands |
Marshall Islands |
Marshall Islands |
Bahamas | Bahamas | Bahamas | ||||||
| Restaurants |
6 | 4 | 6 | 4 | 4 | 3 | ||||||
| Year built |
2011, 2012 | 1998, 1998, 2000 |
(2) | 2003 | 2001 | 1999 |
| (1) | Space ratio refers to a unit of enclosed space per passenger on the ship measured in cubic feet, and represents gross tonnage divided by the number of double occupancy berths. |
| (2) | The Seven Seas Explorer is currently under construction, with delivery expected in the summer of 2016. |
Our Destinations
We deploy our fleet to worldwide destinations, allowing our brands to meet our customers’ demands for a global and differentiated travel experience. Our cruises feature worldwide itineraries that visit close to 350 ports each year, including destinations such as Scandinavia, Russia, Alaska, the Caribbean, the Panama Canal, South America, the Mediterranean, the Greek Isles, Africa, India, Asia, Canada and New England, Tahiti and the South Pacific, Australia and New Zealand.
The following map displays a subset of our global destinations.
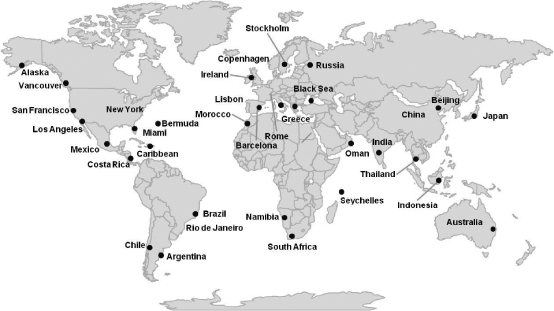
These destination-focused itineraries, complemented by a comprehensive shore excursion program (which is included in the all-inclusive fare for cruises on the Regent ships), differentiate our brands from many of our competitors. We call on “must-see” and exotic destinations, many of which include overnight stays in port, allowing guests to have more in-depth experiences than would otherwise be possible in only a single day port call.
74
Table of Contents
Oceania operates cruises primarily 10, 12 and 14 days in length, with a number of itineraries that last between 20 and 180 days, primarily offered during the winter season in North America. These varying cruise lengths are ideally suited to the aging baby-boomer generation’s time availability and economic parameters, creating strong appeal in this fast-growing market segment. Regent also offers several longer itineraries of up to 143 days, which is a staple of the Luxury segment. At the same time, Regent has expanded its addressable market and captured guest spending for a greater portion of their cruising life cycle by selling segments of these longer itineraries as shorter cruises (i.e., which last seven to 14 day) designed for more time-constrained customers. The deployment flexibility created by the use of longer itineraries translates off-peak seasons into more profitable portions of longer cruises.
Our multi-faceted operating strategy is aimed at delivering the most unique and differentiated upscale experiences for our travelers onboard and onshore, which are highly tailored to the individual while optimizing operational efficiencies. Given the relatively small size of our ships, we are able to access a greater number and variety of ports around the globe. We deploy the fleet to seasonal destinations, allowing us to service our guests’ demands for a global and differentiated travel experience while limiting our reliance on and exposure to one specific region.
Onboard Services and Programs
Oceania distinguishes itself by an onboard product which heavily emphasizes the culinary experience and has broad appeal to both epicureans and those who appreciate fine dining. Oceania has engaged Master Chef Jacques Pepin as its Executive Culinary Director. Pepin has cooked for several French heads of state and is known worldwide as one of the finest chefs of the modern era. Oceania also focuses on both comfort and service, with staff trained to deliver personalized and attentive service and a commitment to superior onboard accommodations and design that creates a country club casual ambiance for which the line is well known.
Regent distinguishes itself by its comprehensive all-inclusive onboard and onshore offerings and the onboard service designed to anticipate our guests’ needs. The core of the Regent guest experience centers on the ability to offer various options throughout our guests’ cruise and to have our guests’ needs met with best-in-class service in a relaxed atmosphere. We continually strive for innovative ways to enhance the onboard experience through new offerings. For example, we recently added top-shelf open bars, unlimited shore excursions and pre-cruise hotel packages as part of our all-inclusive product offering.
Onboard and Shore Excursion Program
We strive to make our guests feel more like seasoned travelers instead of tourists by innovating the traditionally uniform and regimented nature of cruising to make it fully customized and experiential. This aim is reflected in our onboard and onshore activity offerings, which include a wide variety of onboard personal enrichment programs featuring expert guest lecturers. These lecturers often have first-hand knowledge of the locales on an itinerary and come from diverse backgrounds including the United States Foreign Service, leading universities, the arts and journalism. All of these programs enrich the passenger experience and round out our portfolio of onboard offerings to address the varied interests and discriminating tastes of our guests. In the diverse world of upscale travel, we believe that we continue to differentiate ourselves and drive customer loyalty by providing such unique experiences.
Food and Dining
An important aspect of the dining experience aboard our ships is the diversity and quality of our selections as well as our open seating dining. Unlike large cruise ships, where dining times and tables are typically assigned in advance, guests on our ships may choose from a variety of onboard restaurants. There are three to four distinctive restaurants on Regent, four on the Oceania R-Class ships and six on the Oceania O-Class ships. Each restaurant’s open seating policy allows our guests the freedom to dine whenever, wherever and with whomever they wish.
75
Table of Contents
We also offer complimentary 24-hour room service, allowing guests the option of enjoying a private dinner in suite or on their private balcony. On Regent, top-shelf open bar is included in the all-inclusive fare and can be enjoyed at the onboard restaurants, in any of the bars or as part of the 24-hour room service.
Other Onboard Amenities
Our ships feature a state-of-the-art spa, wellness and fitness facility and full-service beauty salon operated by Canyon Ranch. The Canyon Ranch SpaClub® offers all the most popular spa treatments and physical facilities, such as body and skin-care treatment rooms, a well-equipped gym and weight room with cardio and weight training equipment, a juice bar, men’s and women’s locker rooms, thalassotherapy and sauna and steam rooms. We also serve a full range of Canyon Ranch’s Spa Cuisine for breakfast, lunch and dinner at the main dining rooms, casual dining venues, poolside and on the 24-hour room service menu for in-suite dining. On select voyages, Canyon Ranch healthy living experts offer onboard presentations and workshops addressing lifestyle change, healthy living and stress management.
Evening entertainment onboard our ships includes a nightclub with live music, a show lounge featuring a variety of production shows from Broadway revues to classical concerts and a casino. Each ship also includes a well-stocked library, an outdoor pool deck, an internet café, paddle tennis and a jogging track. Shopping is available at several onboard duty-free boutiques.
Pre- and Post-Cruise Activity / Guest Services
We are equipped to handle virtually all aspects of guest reservations and transportation requirements. A significant number of our guests elect to take advantage of our free air program, which includes a comprehensive package of air, meet and greet services and ground transfer to and from the ship. We also offer guests the opportunity to purchase pre- and post-cruise hotel accommodations and excursion packages.
Loyalty Program
We maintain loyalty programs designed to cultivate long-term customer relationships with our customers. The Oceania loyalty program, Oceania Club, and Regent loyalty program, Seven Seas Society®, collectively cover more than 300,000 households. The programs have evolved to offer a range of guest rewards tailored to customer preferences, including select cruise fare and onboard services discounts, onboard recognition, and additional amenities awarded in proportion to a member’s number of nights onboard.
The programs offer significant value to us, both directly and indirectly. Program members act as ambassadors for our brands, conveying the benefits of the platform to potential customers. In addition, repeat cruisers tend to reserve future cruises farther in advance than first-time cruisers, giving us earlier insight into future booking revenue. The program bases are extremely active, with members re-qualifying themselves frequently. Acquisition costs for our past guests are much lower than new guests, in part because after experiencing our world-class product, such individuals are simply more likely to return as compared to similar individuals without prior cruise experience on our brands. Customer loyalty is an important driver of our business; for the nine month period ended September 30, 2013 and the year ended December 31, 2012, approximately 41% and 42%, respectively, Passenger Days Sold were occupied by repeat guests.
Sales and Marketing
We have a U.S.-based sales team of 70 people as of September 30, 2013, including three representatives dedicated to Charter & Incentive (“C&I”) and three international account managers that collectively oversee important strategic relationships and develop marketing plans and budgets for marketing campaigns across key accounts. In addition to the U.S.-based sales team, we have a UK-based sales team consisting of 16 people as of September 30, 2013. This combined team sells our cruises to more than 4,250 producing travel agents, C&I clients and tour operators. We also utilize onboard sales consultants to directly book current passengers for their next itinerary. Additional international revenue comes from general sales agents located throughout the world, with the majority of sales coming from Australia, Germany, Spain and Mexico.
76
Table of Contents
We are also focused on increasing our sales and marketing efforts to complement our existing travel agency relationships and give us the flexibility to adapt to changing market conditions. We have an outbound call center located at our corporate headquarters in Miami, Florida, with 34 sales agents focused on optimizing leads created by other marketing programs and following up directly with potential future guests. This strategic business unit offers attractive occupancy growth potential as a sales generator.
Our sales efforts are supported by a robust and targeted marketing platform. We place a strong focus on product innovation, not only for stimulating repeat business, but also for driving new demand for our products, and our marketing effort supports that focus. Innovations in online capabilities provide more efficient methods for communicating with past and prospective guests, including the integration of print and online marketing efforts, which increase efficiencies and product exposure.
Ship Operations
Crew and Staff
Best-in-class guest service levels are paramount in the Upscale market, where travelers have discriminating tastes and high expectations for service quality. We have dedicated increasing attention and resources to ensure that our service offerings meet the demands of the most discriminating guests. Among other initiatives, we have implemented rigorous onboard training programs and HR and career development resources. In addition, to ensure that guests receive highly personalized service and attention to detail, we staff our ships to offer crew to guest ratios that range from 1 to 1.4 to 1 to 1.7, which is among the highest in the industry. We believe that our dedication to anticipating and meeting our guests’ every need differentiates our operations and fosters close relationships between our guests and crew, helping to build customer loyalty.
Logistics and Technology
Sophisticated and efficient maintenance and operations systems support the technical superiority and modern look of our fleet. We created a department to manage deck and engine operations in-house for both brands, which has resulted in higher quality maintenance and better cost control. Additionally, we have purchased source code from our reservation system developer to allow us more functionality and the ability to enhance the code to meet our increasing business needs.
Ship Maintenance
Each of our ships is taken out of service as necessary for a period of approximately ten days for scheduled maintenance work, repairs and improvements that are performed in drydock. We have regulatory requirements that require our ships to drydock periodically. Drydocks are typically performed during off-peak demand periods to minimize the effect on revenues.
Seasonality
The seasonality of the cruise industry generally results in the greatest demand for cruises during the summer months of the third quarter. This predictable seasonality in demand has resulted in quarterly fluctuations in our revenue and results of operations, which we expect will continue in the future.
Employees
As of September 30, 2013, we had a total of 1,615 officers, crew members and other employees, comprised of 996 officers and crew members onboard our fleet and 619 shoreside employees.
Insurance
We maintain marine insurance on the hull and machinery of our ships, which are maintained in amounts related to the estimated market value of each ship. The coverage for each of the hull and machinery policies is maintained with syndicates of insurance underwriters from the European and U.S. insurance markets.
77
Table of Contents
In addition to the marine insurance coverage in respect of the hull and machinery of our ships discussed above, we seek to maintain comprehensive insurance coverage at commercially reasonable rates and believe that our current coverage is adequate to protect against most of the accident-related risks involved in the conduct of our business. We carry:
| • | protection and indemnity insurance (that is, coverage for passenger, crew and third-party liabilities) on each ship, including insurance against risk of pollution liabilities; |
| • | war risk insurance, including terrorist risk insurance, on each ship in an amount equal to the total insured hull value, subject to certain coverage limits, deductibles and exclusions. The terms of our marine war risk policies include provisions where underwriters can give seven days notice to the insured that the policies will be canceled, which is typical for policies in the marine industry; |
| • | insurance for cash onboard; |
| • | insurance for our shoreside property and general liability risks; and |
| • | cyber insurance (privacy liability and network security insurance), which provides coverage for theft of personally identifiable non-public information in computer data and hard copy form, liability arising from failure to comply with state breach-notice laws and failure to comply with our privacy policies. Additionally, it provides third-party coverage in response to unauthorized access, theft of or destruction of data, denial of service attacks and virus transmission involving our computer systems resulting from computer security breaches. |
All of our insurance coverage, including the coverage described above, is subject to market-standard limitations, exclusions and deductible levels. We will endeavor to continue to obtain insurance coverage in amounts and at premiums that are commercially acceptable to us.
The Athens Convention Relating to the Carriage of Passengers and Their Luggage by Sea (1974) and the Protocol to the Athens Convention Relating to the Carriage of Passengers and Their Luggage by Sea (1976) are generally applicable to passenger ships. The United States has not ratified the Athens Convention. However, with limited exceptions, the 1976 Protocol to the Athens Convention may be contractually enforced with respect to cruises that do not call at a U.S. port. The International Maritime Organization Diplomatic Conference agreed to a new protocol to the Athens Convention on November 1, 2002 (the “2002 Protocol”). The 2002 Protocol, which will be entered into force on April 23, 2014, establishes for the first time a level of compulsory insurance which must be maintained by passenger ship operators with a right of direct action against the insurer. We believe our ship’s entries with their respective protection and indemnity associations will provide the compulsory insurance; however, no assurance can be given that affordable and secure insurance markets will be available to provide the level and type of coverage required under the 2002 Protocol.
Properties
Information about our cruise ships, including their size and primary areas of operation, estimated expenditures and financing may be found under “—Our Fleet” and “Management’s Discussion and Analysis of Financial Condition and Results of Operations—Liquidity and Capital Resources.”
Our principal executive office is located in Miami, Florida. We are party to three real property leases: in Miami, Florida, where we lease 77,943 square feet for our executive office, in Omaha, Nebraska, where we lease approximately 17,641 square feet for our call center, and in Southampton, England, where we lease approximately 3,082 square feet for our international office. These leases expire at various times through 2020, subject to renewal options. We believe that our facilities are in good condition and are adequate for our current needs, and that we are capable of obtaining additional facilities as necessary.
78
Table of Contents
Trademarks
Under our ships operating under the Oceania brand, we own a number of registered trademarks in the United States and in foreign jurisdictions relating to, among other things, the names “Oceania Cruises,” and “Your World. Your Way,” “Regatta,” “Insignia” and the Oceania logo.
We own various U.S. and foreign trademark registrations, including registrations covering “Seven Seas Cruises,” “Seven Seas Navigator,” “Seven Seas Mariner,” “Seven Seas Voyager” and “Luxury Goes Exploring.” We also claim common law rights in trademarks and trade names used in conjunction with our ships, incentive programs, customer loyalty program, and specialty services rendered on board our ships.
The Regent ships have been operating under the Regent brand since 2006. In connection with the Regent Seven Seas Transaction, we entered into a trademark license agreement with Regent Hospitality Worldwide, Inc. granting us the right to use the “Regent” brand family of marks, which we amended in February 2011. The amended trademark license agreement allows Regent to use the Regent trade name, in conjunction with cruises, in perpetuity, subject to the terms and conditions stated in the agreement. In consideration for the rights and privilege to use the license under this agreement, Regent paid the licensor approximately $9.1 million.
Legal Proceedings
We are routinely involved in claims typical within the cruise industry. The majority of these claims are covered by insurance and, accordingly, the maximum amount of our liability is typically limited to our deductible amount. We believe the outcome of such claims in the aggregate, net of expected insurance recoveries will not have a material adverse impact on our financial condition or results of operations.
Competition
We face intense competition from other cruise companies in North America where the cruise market is mature and developed. The North American cruise industry is highly concentrated among three companies. As of September 30, 2013, Carnival Corporation, Royal Caribbean Cruises Ltd. and Norwegian Cruise Line Holdings Ltd. together accounted for 82% of North American cruise passenger berth capacity. We also face competition for many itineraries from other cruise operators as well as competition from non-cruise vacation alternatives.
Governmental Regulations
Maritime—General
The international, national, state and local laws, regulations, treaties and other legal requirements applicable to our operations change regularly, depending on the itineraries of our ships and the ports and countries visited. Our ships, which are registered with and regulated by the Bahamas or the Marshall Islands, are required to comply with the international conventions that govern health, environmental, safety and security matters in relation to our guests, crew and ships. Regulatory authorities in the Bahamas and the Marshall Islands conduct periodic inspections or appoint ship classification societies to conduct periodic inspections on their behalf to verify compliance with these regulations. In addition, requirements of the European Union (“EU”), the United States and the other international ports that our ships visit apply to some aspects of our ship operations.
Our ships are also subject to periodic class surveys by ship classification societies, including drydock inspections, to verify that they have been maintained in accordance with the rules of the classification societies and that recommended maintenance and required repairs have been satisfactorily completed. Class certification is required for our cruise ships to be flagged in a specific country, obtain liability insurance and legally operate as passenger cruise ships. Drydock frequency is a statutory requirement controlled under the International Convention for Safety of Life at Sea (“SOLAS”). Our ships qualify to drydock once or twice every five years. Drydock, which requires that the ship be temporarily taken out-of-service, typically lasts for an average of ten days. Significant drydock work includes repairs, maintenance, ship improvement projects and hull inspection and related activities, such as pressure cleaning and bottom painting, and maintenance of steering gear equipment, stabilizers, thruster equipment and tanks.
79
Table of Contents
As noted above, our ships are subject to inspection by the port regulatory authorities in the various countries that they visit. Such inspections include verification of compliance with the maritime safety, security, environmental, customs, immigration, health and labor regulations applicable to each port as well as with international requirements. For example, in U.S. ports, these authorities include the U.S. Coast Guard, U.S. Customs and Border Protection and U.S Public Health, and in Canada, such authorities include the Canadian Coast Guard and Public Health Agency of Canada. In EU ports, the Paris Memorandum of Understanding authorizes the enforcement of internationally accepted conventions through Port State Control inspections by the relevant authorities. For example, in Italian ports, these authorities include the Italian Coast Guard, Maritime Health and the State Police. In U.K. ports, these authorities include the Maritime and Coastguard Agency, the Department for Transport’s Transport Security team, and the Port Health Authority. Similar Memoranda of Understanding govern Port State Control inspections of our ships in most other areas of the world where we operate.
Maritime—Safety
The International Maritime Organization (“IMO”), a specialized agency of the United Nations, has adopted safety standards as part of SOLAS, which apply to all of our ships. SOLAS establishes requirements for vessel design, structural features, construction methods and materials, refurbishment standards, life-saving equipment, fire protection and detection, safe management and operation and security in order to help ensure the safety and security of our guests and crew. All of our crew undergo regular safety training exercises that meet all international maritime regulations.
SOLAS requires implementation of the International Safety Management Code (“ISM Code”), which provides an international standard for the safe management and operation of ships and for pollution prevention. The ISM Code is mandatory for passenger vessel operators. Our shoreside operations, shipboard operations and ships are regularly audited by national authorities and maintain the certificates of compliance required by the ISM Code.
Maritime—Security
Our ships are subject to various security requirements, including the International Ship and Port Facility Security Code (“ISPS Code,” a part of SOLAS); the U.S. Maritime Transportation Security Act of 2002, which addresses port and waterway security, and the U.S. Cruise Vessel Security and Safety Act, which will phase in through 2013 and applies to all of our ships that embark or disembark passengers in the United States. These maritime security regulations require that, among other things, (i) we implement specific security measures, (ii) conduct vessel security assessments, (iii) identify and deter security threats and (iv) develop security plans that may include guest, vehicle and baggage screening procedures, security patrols, establishment of restricted areas, personnel identification procedures, access control measures and installation of surveillance equipment. Our ships are regularly audited and maintain the certificates of compliance required by the ISPS Code.
Maritime—Environmental
We are subject to numerous international, national, state and local environmental laws, regulations and treaties that govern, among other things, air emissions, waste discharge, water management and disposal and the storage, handling, use and disposal of hazardous substances such as chemicals, solvents and paints. In addition to the existing legal requirements, we are committed to helping to preserve the environment, because a clean, unspoiled environment is a key element that attracts guests to our ships. If we violate or fail to comply with environmental laws, regulations or treaties, we could be fined, or otherwise sanctioned by regulators. However, more importantly preserving the environment for future generations to enjoy is our responsibility as stewards of the ocean. We have made, and will continue to make, capital and other expenditures to comply with environmental laws, regulations and treaties.
80
Table of Contents
Maritime—International
The environmental convention governing ships is the IMO International Convention for the Prevention of Pollution from Ships (“MARPOL”). This convention includes requirements designed to prevent and minimize both accidental and operational pollution by oil, sewage, garbage and air emissions. Many countries have ratified and adopted IMO Conventions that, among other things, impose liability for pollution damage, subject to defenses and to monetary limits. Monetary limits do not apply where the spill is caused by the owner’s actual fault or by the owner’s intentional or reckless conduct. All of our ships must carry an International Oil Pollution Prevention Certificate, an International Sewage Pollution Prevention Certificate, an International Air Pollution Prevention Certificate and a Garbage Management Plan. These certificates and plan are issued by the ship’s state of registry and evidence their compliance with the MARPOL regulations regarding oil, sewage and air pollution prevention. In jurisdictions that have not adopted the IMO Conventions, various national, regional or local laws and regulations have been established to address these issues and/or may have more stringent requirements.
Recently adopted amendments to MARPOL will make the Baltic Sea a “Special Area” where sewage discharges from passenger ships will be restricted. We are not certain as to when these amendments are expected to enter into effect. The underlying requirements may impact our operations unless suitable port waste facilities are available, or new technologies for onboard waste treatment are developed. Accordingly, the cost of complying with these requirements is not determinable at this time, however, we do not expect it to be material.
Maritime—U.S. Federal and State
The U.S. Act to Prevent Pollution from Ships, which implements the MARPOL convention, provides for severe civil and criminal penalties related to ship-generated pollution for incidents in U.S. waters within three nautical miles and in some cases within the 200-mile exclusive economic zone.
The U.S. Oil Pollution Act of 1990 (“OPA 90”) provides for strict liability for water pollution caused by oil pollution or possible oil pollution incidents in the 200-mile exclusive economic zone of the United States, subject to defined monetary limits. OPA 90 requires that in order for us to operate in U.S. waters, we must have Certificates of Financial Responsibility from the U.S. Coast Guard for each of our ships that operate in these waters. We have these certificates that demonstrate our ability to meet the maximum amount of OPA 90 related liability that our ships could be subject to for removal costs and damages, such as from an oil spill or a release of a hazardous substance.
The Clean Water Act of 1972 and other laws and regulations provide the U.S. Environmental Protection Agency (“EPA”) with the authority to regulate commercial vessels’ incidental discharges of ballast water, bilge water, gray water, anti-fouling paints and other substances during normal operations within the U.S. three mile territorial sea and inland waters. The U.S. National Pollutant Discharge Elimination System was designed to minimize pollution within U.S. territorial waters. For our affected ships, all of the requirements are laid out in the Vessel General Permit (“VGP”), which is an EPA requirement. The VGP establishes effluent limits for 26 specific discharges incidental to the normal operation of a vessel. In addition to these discharge and vessel specific requirements, the VGP includes requirements for inspections, monitoring, reporting and record-keeping.
Most U.S. states that border navigable waterways or sea coasts have also enacted environmental regulations that impose strict liability for removal costs and damages resulting from a discharge of oil or a release of a hazardous substance. These laws may be more stringent than U.S. federal law and in some cases have no statutory limits of liability. The state of Alaska enacted legislation that prohibits certain discharges in designated Alaskan waters and requires that certain discharges be monitored to verify compliance with the standards established by the legislation. Both the state and federal environmental regimes in Alaska are more stringent than the federal regime under the Federal Water Pollution Control Act with regard to discharge from vessels. The legislation also provides that repeat violators of the regulations could be prohibited from operating in Alaskan waters.
81
Table of Contents
Maritime—EU
The EU has adopted a substantial and diverse range of environmental measures aimed at improving the quality of the environment. To support the implementation and enforcement of European environmental legislation, the EU has adopted directives on environmental liability and enforcement and a recommendation providing for minimum criteria for environmental inspections. The European Commission’s (“EC”) strategy is to reduce atmospheric emissions from seagoing ships. The EC strategy seeks to implement SOx Emission Control Areas set out in MARPOL as discussed below. In addition, the EC goes beyond the IMO by introducing requirements to use low sulfur (less than 0.1%) marine gas oil in EU ports.
Maritime—Low Sulfur Fuel
MARPOL specifies requirements for Emission Control Areas (“ECAs”) with stricter limitations on sulfur emissions in these areas. Ships operating in the Baltic Sea ECA, the North Sea/English Channel ECA and the North American ECA are required to use fuel with a sulfur content of no more than 1% or use alternative emission reduction methods, provided the alternatives are at least as effective in terms of emissions reductions. Beginning in January 2014, the area which extends approximately 50 miles off the coasts of Puerto Rico and the U.S. Virgin Islands will also become an ECA, but we do not believe this will result in a significant impact on our fuel costs. Other additional ECAs may also be established in the future, such as for areas around Australia, Hong Kong, Japan, the Mediterranean Sea and Mexico. From January 2015 and thereafter, the fuel sulfur content limit in ECAs will be further reduced to 0.1%. Compliance with these requirements will further increase our fuel costs.
The MARPOL global limit on fuel sulfur content outside of ECAs will be reduced to 0.5% from the current 3.5% global limit on and after January 2020. The 0.5% global standard will be subject to an IMO review by 2018 to determine the availability of fuel oil to comply with this standard, taking into account the global fuel oil market supply and demand, an analysis of trends in fuel oil markets and any other relevant issues. If the IMO determines that there is insufficient fuel to comply with the 0.5% standard in January 2020, then this requirement will be delayed to January 2025, at the latest. However, the European Union Parliament and Council have set 2020 as the final date for the 0.5% fuel sulfur limit to enter force, regardless of the 2018 IMO review results. This European Union Sulfur Directive will cover European Union Member State territorial waters that are within 12 nautical miles of their coastline. We believe that compliance with the 0.5% global standard could significantly increase our fuel costs. However, the magnitude of this increase is not reasonably determinable at this time due to the length of time until the global standard becomes effective and the other potential mitigating factors discussed below. The cost impacts from implementing progressively lower sulfur content requirements may be mitigated by the favorable impact of future changes in the supply and demand balance for marine and other fuels, future developments of and investments in sulfur emission abatement and propulsion technologies, including more advanced engines, more effective hull coatings and paints, exhaust gas cleaning systems and propeller design, more efficient shipboard systems, the use of alternative lower cost and lower emission fuels, such as liquefied natural gas (“LNG”) at sea and in port.
Maritime—Labor
In 2006, the International Labor Organization (“ILO”), an agency of the United Nations that develops and oversees international labor standards, adopted a new Consolidated Maritime Labor Convention (“MLC 2006”). MLC 2006 contains a comprehensive set of global standards based on those that are already found in 68 maritime labor Conventions and Recommendations adopted by the ILO since 1920. MLC 2006 includes a broad range of requirements, such as a broader definition of a seafarer, minimum age of seafarers, medical certificates, recruitment practices, training, repatriation, food, recreational facilities, health and welfare, hours of work and rest, accommodations, wages and entitlements. MLC 2006 added requirements not previously in effect, in the areas of occupational safety and health. MLC 2006 became effective in certain countries commencing August 2013. The International Convention on Standards of Training, Certification and Watchkeeping for Seafarers (“STCW”), as amended, establishes minimum standards relating to training, certification and Watchkeeping for our seafarers.
82
Table of Contents
Maritime—Financial Requirements
Our ships that call on U.S. ports are regulated by the Federal Maritime Commission (“FMC”). 46 U.S.C. 44102, which is administered by the FMC, requires all of our ships that call on U.S. ports and embark or disembark guests in U.S. ports to establish financial responsibility for their liability to passengers for nonperformance of transportation, for personal injury and for loss of life. The FMC’s regulations require that a cruise line demonstrate its financial responsibility for nonperformance of transportation through a guarantee, escrow arrangement, surety bond or insurance. In February, 2013, the FMC approved amendments to the performance bond requirements that will increase the required guarantee requirements from $15 million to $30 million per operator over a two-year period, with $22 million required guarantee as of April 2014 and $30 million required guarantee as of April 2015. Once fully effective in April 2015, the guarantee requirements will be subject to additional consumer price index based adjustments. We do not anticipate that compliance with the new rules will have a material effect on our costs.
From time to time, various other regulatory and legislative changes have been or may in the future be proposed that may have an effect on our operations in the U.S. and the cruise industry in general.
Taxation
International Shipping Income
In many of the jurisdictions in which we operate as a non-resident ship operator, the shipping revenue derived therefrom is taxed on a “deemed international shipping income” basis, meaning that the tax is levied based on a statutorily prescribed percentage of “gross shipping income” derived from the relevant jurisdictions. We believe that “gross shipping income” consists of cruise package fares received from passengers. The applicability of U.S. federal income taxes to us is separately discussed below.
Revenue from Shipboard Activities
In most countries in which we operate, tax is payable on income derived within the respective jurisdictions. We believe that the majority of the onboard revenue generated from activities such as beverage and gift shop sales is derived while the ships are navigating in international waters. Consequently, we are of the view that onboard revenue generated from such activities is not taxable. The majority of the countries in which we operate adopt the definition of territorial waters in accordance with Article 3 of the 1982 United Nations Convention on the Law of the Sea whereby 12 nautical miles from the baseline of the respective countries is the limit for taxation purposes unless there are express domestic laws which state otherwise.
U.S. Federal Income Taxation of Regent and Oceania Shipping Income
The following discussion of the application to the Company of U.S. federal income tax laws is based upon current provisions of the Internal Revenue Code (the “Code”), legislative history, U.S. Treasury regulations, administrative rulings and court decisions. The following description is subject to change and any change could affect the continuing accuracy of this discussion (and any such change may also have retroactive effect).
Under Section 883 of the Code, certain foreign corporations, though engaged in the conduct of a trade or business within the United States, are exempt from United States federal income and branch profits taxes on (or in respect of) gross income derived from or incidental to the international operation of ships. U.S. Treasury regulations provide that a foreign corporation will qualify for the Section 883 exemption if, in relevant part: (i) the foreign country in which the foreign corporation is organized grants an “equivalent exemption” from tax for income from the international operation of ships of sufficiently broad scope to corporations organized in the U.S. (an “Equivalent Exemption”) and (ii) the foreign corporation is a “controlled foreign corporation” (a “CFC”) for more than half of the taxable year, and more than 50% of its stock is owned by qualified U.S. persons for more than half of the taxable year (the “CFC Test”). In addition, the U.S. Treasury regulations require a
83
Table of Contents
foreign corporation and certain of its direct and indirect shareholders to satisfy detailed substantiation requirements (“Substantiation Requirements”) in order to establish that the foreign corporation meets the CFC Test.
For purposes of the CFC Test, a qualified U.S. person is defined as an individual who is a U.S. citizen or resident alien, a domestic corporation or one of certain domestic tax-exempt trusts. Stock owned by or for a domestic partnership, taxable domestic trust, estate, mutual insurance company or similar entity is treated for these purposes as owned proportionately by its partners, beneficiaries, grantors or other interest holders.
We believe that substantially all of Regent’s and Oceania’s income derived from the international operation of ships is properly categorized as Shipping Income, and that our income other than Shipping Income is not currently, nor is it expected to become, a material amount. It is possible, however, that a material amount of our income may not actually qualify (or will not qualify) as Shipping Income.
Even if our interpretation of Section 883 is correct, the exemption for Shipping Income is not applicable in any year in which we do not satisfy complex stock ownership tests, as described above. Additionally, any change in our operations could change the amount of our income that is considered Shipping Income under Section 883. Finally, any change in the tax laws governing our operations, including Section 883 of the Code and the regulations thereunder, could increase the amount of our income that is subject to tax. Any of the foregoing risks could significantly increase our exposure to U.S. federal income and branch profits tax.
The U.S.-source portion of our income that is not Shipping Income is generally subject to U.S. federal corporate income tax on a net basis (generally at a 35% rate) and possible state and local taxes, and our effectively connected earnings and profits generally are subject to an additional branch profits tax of 30%.
For U.S. federal income tax purposes, Regent and its non-U.S. subsidiaries are disregarded as entities separate from us and Oceania is treated as a corporation. Both Regent and Oceania rely on our ability as their parent corporation to meet the requirements necessary to qualify for the benefits of Section 883. We are organized as a company in Panama, which grants an equivalent tax exemption to U.S. corporations, and is thus classified as a qualified foreign country for purposes of Section 883. We are currently classified as a CFC and we believe we meet the ownership and substantiation requirements of the CFC test under the regulations. Therefore, we believe most of our income and the income of our ship-owning subsidiaries, which is derived from or incidental to the international operation of ships, is exempt from U.S. federal income taxation under Section 883. In 2005, final regulations became effective under Section 883, which, among other things, narrow somewhat the scope of activities that are considered by the Internal Revenue Service to be incidental to the international operation of ships. The activities listed in the regulations as not being incidental to the international operation of ships include income from the sale of air and land transportation, shore excursions, and pre- and post-cruise tours. To the extent the income from these activities is earned from sources within the United States that income is subject to U.S. taxation.
Taxation of Regent and Oceania’s International Shipping Income Where Section 883 of the Code is Inapplicable
We believe that, if the Shipping Income of Regent and Oceania were not exempt from U.S. federal income taxation under Section 883 of the Code, as described above, that income, as well as any other income from cruise operations that is not Shipping Income, to the extent derived from U.S. sources, generally would be taxed on a net basis under Section 882 of the Code (after allowance for deductions, assuming that a true and accurate federal income tax return is filed within the permitted time frame) at graduated U.S. federal corporate income tax rates (currently, a maximum of 35%), and possible state and local income taxes. We would also be subject to a 30% (unless a lower treaty rate applies) federal branch profits tax under Section 884 of the Code, generally on the portion of our earnings and profits that was derived from U.S. sources each year to the extent such earnings and profits were not properly viewed as reinvested and maintained in the U.S. business of Regent and Oceania. To the extent that our income derived from the use of our ships, or services related to the use of our ships, is not
84
Table of Contents
exempt under Section 883 of the Code or subject to net basis taxation under Section 882 of the Code, such income would be subject to a 4% gross basis tax under Section 887 of the Code. We believe that the income of Regent and Oceania generally would not be subject to the 4% gross basis tax under Section 887 of the Code.
Income of Regent and Oceania derived from U.S. sources includes 100% of its income, if any, from transportation that begins and ends in the United States, and 50% of its income from transportation that either begins or ends in the United States. Income from transportation that neither begins nor ends in the United States would not be taxable. There are indications in the legislative history of the transportation income source rules that suggest that a cruise that begins and ends in a U.S. port, but that calls on one or more foreign ports, will derive U.S. source income only from the first and last legs of such cruise. However, since there are no regulations or other IRS guidance with respect to these rules, the applicability of the transportation income source rules in the aforesaid manner is not free from doubt.
Certain State, Local and Non-U.S. Tax Matters
We may be subject to state, local and non-U.S. income or non-income taxes in various jurisdictions, including those in which we transact business, own property, or reside. We may be required to file tax returns in some or all of those jurisdictions. The state, local or non-U.S. tax treatment of Regent and Oceania may not conform to the U.S. federal income tax treatment discussed above. We may be required to pay non-U.S. taxes on dispositions of foreign property, or operations involving foreign property may give rise to non-U.S. income or other tax liabilities in amounts that could be substantial.
85
Table of Contents
Directors and Executive Officers
Set forth below are the names and current positions of our executive officers and Board of Directors. All ages are as of January 22, 2014.
| Name |
Age | Position | ||||
| Directors |
||||||
| Frank J. Del Rio |
59 | Chief Executive Officer and Chairman of the Board of Directors | ||||
| Adam M. Aron |
59 | Director | ||||
| Kevin E. Crowe |
31 | Director | ||||
| Russell W. Galbut |
61 | Director | ||||
| Daniel M. Holtz |
54 | Director | ||||
| Steve Martinez |
44 | Director | ||||
| Eric L. Press |
48 | Director | ||||
| Executive Officers & Senior Management |
||||||
| Robert J. Binder |
49 | Vice Chairman and President | ||||
| Jason M. Montague |
40 | Executive Vice President and Chief Financial Officer | ||||
| Kunal S. Kamlani |
41 | President and Chief Operating Officer of PCH | ||||
| T. Robin Lindsay |
56 | Executive Vice President of Vessel Operations | ||||
Frank J. Del Rio is the founder of Oceania and has served as Chief Executive Officer and Chairman of the Board of Directors of Prestige or its predecessor since April 2007. Based in Miami, Florida, Mr. Del Rio is responsible for the financial and strategic development of Prestige. Between 2003 and 2007, Mr. Del Rio was instrumental in the development and growth of Oceania. Prior to founding Oceania, Mr. Del Rio played a vital role in the development of Renaissance Cruises, serving as Co-Chief Executive Officer, Executive Vice President and CFO from 1993 to April 2001. Mr. Del Rio holds a B.S. in Accounting from the University of Florida and is a Certified Public Accountant (inactive license). Mr. Del Rio brings a wealth of managerial and operational expertise to our Board as a result of his significant experience as CEO of our company and his long track record of success in the cruise industry.
Adam M. Aron has been a member of the Board of Directors of Prestige or its predecessor since April 2007. Since 2006, he has been Chairman of the board of directors and CEO of World Leisure Partners, Inc., a personal consultancy for matters related to travel and tourism and high-end real estate development, which acts in partnership with Apollo. Mr. Aron has previously served as Chairman of the board of directors and Chief Executive Officer of Vail Resorts, Inc. from 1996 to 2006; President and CEO of NCL Corporation Ltd. from 1993 to 1996; Senior Vice President of Marketing for United Airlines from 1990 to 1993; and Senior Vice President—Marketing for Hyatt Hotels Corporation from 1987 to 1990. Mr. Aron currently serves on the boards of directors of Cap Jaluca Properties Ltd., E-miles, Inc., Norwegian Cruise Line Holdings Ltd. and Starwood Hotels and Resorts Worldwide. Mr. Aron also serves on the boards of directors of a number of non-profit organizations. He is a member of the Council on Foreign Relations, Business Executives for National Security, and is a former member of the Young Presidents’ Organization. In addition, Mr. Aron formerly served as First Vice Chairman of the U.S. Travel Association and as Vice Chairman of the National Finance Committee of the Democratic Senatorial Campaign Committee for the 2008 election cycle. Mr. Aron was previously selected by the U.S. Secretary of Defense to participate in the Joint Civilian Orientation Conference in 2004, was appointed by the U.S. Secretary of Agriculture to serve on the board of directors of the National Forest Foundation from 2000 through 2006 and was a delegate to President Clinton’s White House Conference on Travel and Tourism. Mr. Aron received a M.B.A. with distinction from the Harvard Business School and a B.S. cum laude from Harvard College. Mr. Aron provides our Board with substantial knowledge of and expertise in the cruise, travel and hospitality industries. In addition, his directorships at other public companies provide him with broad experience on governance issues facing public companies.
86
Table of Contents
Kevin E. Crowe has been a member of the Board of Directors of Prestige since December 2009. Mr. Crowe joined Apollo in 2006 and is a Principal. Mr. Crowe currently serves on the board of directors of Nine Entertainment Co Holdings, Ltd. and Norwegian Cruise Line Holdings Ltd. He previously served as a director for Quality Distribution Inc. Prior to joining Apollo, Mr. Crowe was a member of the Financial Sponsors Group at Deutsche Bank. Mr. Crowe graduated from Princeton University with an A.B. in Economics and a certificate in Finance. Mr. Crowe brings to our Board experience in the issues facing public companies and multinational businesses, and his directorships at other public companies provide him with broad experience on governance issues facing public companies.
Russell W. Galbut has been a member of the Board of Directors of Prestige or its predecessor since April 2007. Mr. Galbut currently serves as the Managing Principal of Crescent Heights, one of America’s largest and most respected residential developers of quality condominiums. Having been active in the urban mixed-use real estate sector for over 30 years, Mr. Galbut and Crescent Heights are a “best in class” developer with a successful track record of new constructions and renovations. Crescent Heights has been active in over 15 markets from coast-to-coast and has developed over 35,000 residential units, including pioneering the condo hotel concept. After graduating from Cornell University with a degree in Hotel Management, Mr. Galbut became the youngest consultant with the then-accounting firm of Laventhal Krekstein, Horwath and Horwath. Mr. Galbut was a Florida licensed CPA from 1975 to 2004. In 1980, Mr. Galbut received his J.D. degree from the University of Miami School of Law. Besides serving on the boards of directors of Prestige and Crescent Heights, Mr. Galbut also serves on the board of directors of Gibraltar Private Bank and Trust. He also sits on several other charitable boards, including the National Board of the Simon Wiesenthal Institute and Colel Chabad, the largest free food bank in Israel. Mr. Galbut provides our Board with significant expertise in accounting, legal, corporate finance and transactional matters.
Daniel M. Holtz has been a member of the Board of Directors of Prestige or its predecessor since April 2007. Since 1998, Mr. Holtz has served as Managing Principal of Walden Capital Management, a Miami-based financial services company. Mr. Holtz currently serves on the boards of directors of Verifier Capital, L.L.C. and IWM Holdings, L.L.C. He is also involved in numerous non-profit and civic organizations, including serving as member of the Board of Trustees of Holtz Center for Maternal and Child Care at Jackson Memorial Hospital in Miami, Florida, the Museum of Contemporary Art in North Miami, Florida and the Aspen Art Museum in Aspen, Colorado. Mr. Holtz holds an undergraduate degree from the University of Florida. With his experience in the financial services industry as well as his directorships on other companies, Mr. Holtz brings to our Board extensive experience managing sophisticated businesses, insight into organizational and corporate governance issues, as well as financial acumen critical to a public company.
Steve Martinez has been a member of the Board of Directors of Prestige or its predecessor since April 2007. Mr. Martinez joined Apollo in 2000 and is a Senior Partner and Head of the Asia Pacific region. He has led investments at Apollo in a variety of sectors including leisure, media, shipping and industrials, and currently serves on the boards of directors of Norwegian Cruise Line Holdings Ltd., Veritable Maritime, Nine Entertainment Co Holdings, Ltd. and Rexnord Corporation. He has previously served on the boards of directors of Allied Waste Industries, Inc., Goodman Global, Inc., Hughes Telematics Inc., Jacuzzi Brands Corp. and Hayes-Lemmerz International, Inc. Prior to joining Apollo, Mr. Martinez was a member of the mergers and acquisitions department of Goldman Sachs & Co. with responsibilities in merger structure negotiation and financing. Before that, he worked at Bain & Company Tokyo, advising U.S. corporations on corporate strategies in Japan. Mr. Martinez received a M.B.A. from the Harvard Business School and a B.A. and B.S. from the University of Pennsylvania and the Wharton School of Business, respectively. Mr. Martinez brings to our Board extensive experience in the issues facing public companies and multinational business, including expertise in management, accounting, corporate finance and transactional matters. In addition, his directorships at other public companies provide him with broad experience on governance issues facing public companies.
Eric L. Press has been a member of the Board of Director of Prestige or its predecessor since April 2007. He is a partner at Apollo, where he has worked since 1998. From 1992 to 1998, Mr. Press was associated with the law firm of Wachtell, Lipton, Rosen & Katz LLP, specializing in mergers, acquisitions, restructurings and
87
Table of Contents
related financing transactions. From 1987 to 1989, Mr. Press was a consultant with The Boston Consulting Group, a management consulting firm focused on corporate strategy. Mr. Press also serves on the boards of directors of Apollo Commercial Real Estate Finance, Athene Group Ltd., Affinion Group, Inc., Caesars Entertainment Corporation, Noranda Aluminum, Inc. and Verso Paper Corp. Previously, he served on the boards of directors of Innkeepers USA Trust, Quality Distribution, Inc., Wyndham International, AEP Industries Inc. and Metals USA Holdings Corp. Mr. Press graduated magna cum laude from Harvard College with an A.B. in Economics, and from Yale Law School, where he was a Senior Editor of the Yale Law Review. Mr. Press brings to our Board extensive experience in the issues facing public companies and multinational business, including expertise in management, accounting, legal, corporate finance and transactional matters. In addition, his directorships at other public companies provide him with broad experience on governance issues facing public companies.
Robert J. Binder has served as the Vice Chairman and President of PCI since May 2011. He oversees the global expansion of our brands and is responsible for sales, marketing and branding efforts internationally. Mr. Binder has played a key role in the development and design of the new Oceania ships, the new restaurant concepts and the introduction of the Bon Apetit Culinary Center. He is co-founder of Oceania and previously served as President of Oceania. Before launching Oceania, Mr. Binder was the President of Meadowoods Consulting, which provided consulting services to the financial and travel services industries. From 1992 to 2001 he held several executive posts in the cruise industry. Mr. Binder has also held senior management positions at JP Morgan Chase, where he was a Strategic Planning Officer, and at Renaissance Cruises, where he was Vice President of Sales. Mr. Binder earned master’s degrees in both Finance and Marketing from Cornell University and did his undergraduate studies at Purdue University.
Jason M. Montague is our Executive Vice President and Chief Financial Officer, a position he has held since 2010. He is responsible for all day-to-day financial operations as well as the mid- and long-term strategic planning and financial development of Prestige and its two brands, Oceania and Regent. Part of the Oceania’s start-up team, Mr. Montague has seen the company through the purchase of its three R-Class vessels, the equity investment by Apollo, the financing for the Oceania-Class newbuilds and the acquisition and integration of Regent. Prior to joining Oceania, he operated a successful consulting practice focused on strategic planning and development of small to medium-sized companies. Before that, he held the position of Vice President Finance for Alton Entertainment Corporation, a brand equity marketer that was majority owned by the Interpublic Group of Companies. Mr. Montague holds a bachelor’s degree in Accounting from the University of Miami.
Kunal S. Kamlani is the President and Chief Operating Officer of PCH and has served as the President of Oceania since October 2011 and Regent since February 2013. Mr. Kamlani is responsible for revenue management, strategic marketing, sales, e-commerce, public relations and procurement for both Oceania and Regent. Mr. Kamlani rejoined us in September 2011 from Bank of America/Merrill Lynch, where he served as head of the multi-billion dollar Global Investment Solutions division with approximately 1,000 employees worldwide beginning in March 2010. Prior to that, Mr. Kamlani was Chief Financial Officer of PCH from August 2009 through March 2010. His past experiences also include serving as the Chief Operating Officer of Smith Barney and Vice President of corporate development for Starwood Hotels & Resorts. Mr. Kamlani earned his M.B.A. from Columbia University and a bachelor’s degree in Economics and Political Science from Colgate University.
T. Robin Lindsay has served as the Executive Vice President of Vessel Operations since April 2009 and oversees all marine, technical and hotel operations. Mr. Lindsay was instrumental in the extensive refurbishment and launch of Oceania’s Regatta, Insignia and Nautica and the development of the new Marina and Riviera. Mr. Lindsay possesses a substantial amount of experience in the luxury cruise industry and has overseen the design and construction of many of the industry’s most acclaimed luxury cruise ships. Prior to joining Oceania in 2003, Mr. Lindsay was the Senior Vice President of Vessel Operations at Silversea Cruises and, prior to that, Vice President of Operations at Radisson Seven Seas Cruises. Mr. Lindsay earned his B.S. degree from Louisiana Tech University.
88
Table of Contents
Board of Directors
Upon the consummation of this offering, our Board will consist of directors, of whom will be independent directors.
We intend to avail ourselves of the “controlled company” exception under the rules, which eliminates the requirement that we have a majority of independent directors on our Board and that we have compensation and nominating and governance committees composed entirely of independent directors. We are required, however, to have an audit committee with one independent director during the 90-day period beginning on the date of effectiveness of the registration statement filed with the SEC in connection with this offering and of which this prospectus is part. After such 90-day period and until one year from the date of effectiveness of the registration statement, we are required to have a majority of independent directors on our Audit Committee. Beginning one year after the date of effectiveness of this registration statement, we are required to have an audit committee comprised entirely of independent directors. If at any time we cease to be a “controlled company” under the rules, our Board will take all action necessary to comply with such rules, including appointing a majority of independent directors to the Board and establishing certain committees composed entirely of independent directors.
Committees of our Board of Directors
Board Committees
Upon consummation of this offering, our Board will have three standing committees: an audit committee, a compensation committee and a nominating and corporate governance committee. The charters for each of these committees will be available on our website upon the consummation of this offering.
Audit Committee
Upon the consummation of this offering, our Audit Committee will consist of Messrs. , and . Our Board has determined that Mr. qualifies as an “audit committee financial expert” as such term is defined in Item 407(d)(5) of Regulation S-K. The purpose of the Audit Committee is to oversee our accounting and financial reporting processes and the audits of our financial statements, provide an avenue of communication among our independent auditors, management, our internal auditors and our Board, and prepare the audit-related report required by the SEC to be included in our annual proxy statement or annual report on Form 10-K.
The principal duties and responsibilities of our Audit Committee are to oversee and monitor the following:
| • | preparation of annual audit committee report to be included in our annual proxy statement; |
| • | our financial reporting process and internal control system; |
| • | the integrity of our financial statements; |
| • | the independence, qualifications and performance of our independent auditor; |
| • | the performance of our internal audit function; and |
| • | our compliance with legal, ethical and regulatory matters. |
The Audit Committee will have the power to investigate any matter brought to its attention within the scope of its duties. It will also have the authority to retain counsel and advisors to fulfill its responsibilities and duties. We intend to avail ourselves of the “controlled company” exemption under the rules, which exempts us from the requirement that we have an audit committee composed entirely of independent directors.
Compensation Committee
Upon the consummation of this offering, our Compensation Committee will consist of Messrs. , and .
89
Table of Contents
The principal duties and responsibilities of our Compensation Committee are as follows:
| • | to provide oversight and make recommendations to our Board on the development and implementation of the compensation policies, strategies, plans and programs for our key employees, executive officers and outside directors and disclosure relating to these matters and to establish and administer incentive compensation, benefit and related plans; |
| • | to review and make recommendations to our Board regarding corporate goals and objectives, performance and the compensation of our chief executive officer, chief financial officer and the other executive officers of us and our subsidiaries; and |
| • | to provide oversight and make recommendations to our Board concerning selection of officers, regarding performance of individual executives and related matters. |
We intend to avail ourselves of the “controlled company” exemption under the rules, which exempts us from the requirement that we have a compensation committee composed entirely of independent directors.
Nominating and Corporate Governance Committee
Prior to consummation of this offering, our Board will establish a Nominating and Corporate Governance Committee. We expect that the members of the Nominating and Corporate Governance Committee will be Messrs. , and , who will be appointed to the committee promptly following this offering. The principal duties and responsibilities of the Nominating and Corporate Governance Committee will be as follows:
| • | to establish criteria for board and committee membership and recommend to our Board proposed nominees for election to the Board and for membership on committees of our Board; |
| • | to make recommendations regarding proposals submitted by our stockholders; and |
| • | to make recommendations to our Board regarding board governance matters and practices. |
We intend to avail ourselves of the “controlled company” exception under the rules, which exempts us from the requirement that we have a nominating and corporate governance committee composed entirely of independent directors.
Board Compensation
Our non-executive directors who hold a status as an investment professional of Apollo or a partner or senior partner with Apollo do not receive any annual retainer, meeting, committee or chair fees. Additionally, there are no automatic annual equity grants, rather grants are made from time to time as determined by our Board, and the last such grant was in 2010. Except for Mr. Aron, those non-executive directors that do not hold a status of investment professional of Apollo or partner or senior partner with Apollo receive an annual director fee of $50,000 or 5,000 stock options, at their discretion. For so long as Mr. Aron serves as a member of our Board, World Leisure Partners, Inc. will receive a $100,000 annual fee as payment for his service.
Compensation Committee Interlocks and Insider Participation
Our Compensation Committee consists of Messrs. , and . None of our executive officers serves as a member of a board of directors or compensation committee (or other committee performing equivalent functions) of any entity that has one or more executive officers serving on our Board or Compensation Committee. No interlocking relationship exists between any member of our Board or any member of the compensation committee (or other committee performing equivalent functions) of any other company.
Code of Business Conduct and Ethics
Our Board of Directors has adopted a Code of Business Conduct and Ethics that is applicable to all officers, directors and employees. Following the consummation of this offering, this Code will be available on our website.
90
Table of Contents
This section describes the material elements of compensation awarded to, earned by or paid to our executive officers identified in the Summary Compensation Table, which we refer to in this section as our “named executive officers” or “NEOs.” This section also provides a discussion of the process and rationale for the compensation decisions of the Board of Directors and its Compensation Committee and describes the role of various parties in determining our executive compensation programs. Unless otherwise specified, references throughout this “Executive Compensation” to the Board of Directors or the Compensation Committee are to the board or compensation committee of Prestige Cruise International, Inc. (“Prestige”).
The named executive officers for 2013 were:
| Frank J. Del Rio |
Chief Executive Officer and Chairman of the Board | |
| Jason M. Montague |
Executive Vice President, Chief Financial Officer | |
| Robert J. Binder |
Vice Chairman and President | |
| Kunal S. Kamlani |
President and Chief Operating Officer of PCH | |
| T. Robin Lindsay |
Executive Vice President of Vessel Operations | |
| Mark S. Conroy |
Former President of Regent |
The Compensation Committee was established in 2007, following an investment by Apollo in the Company. Since its inception, the Compensation Committee has reviewed and determined the compensation plans in place for our named executive officers, including reviewing terms of employment agreements, setting performance goals, evaluating the competitiveness of our executive compensation program, and administering our benefit and incentive plans.
Executive Compensation Program Objectives and Philosophy
The Company’s executive compensation arrangements are guided by the following principles:
| • | We believe that a capable, experienced and highly motivated executive management team is critical to our success and to the creation of long-term shareholder value. |
| • | We believe that the most effective executive compensation program is one that focuses on pay for performance and (i) rewards the achievement of annual, long-term and strategic goals and (ii) aligns the interests of our executives with those of our shareholders. |
The Company’s 2013 executive compensation program was designed according to the above principles and had the primary aim of (1) attracting and retaining executives with the requisite skills and experience to help achieve our business objectives of developing and expanding business opportunities that improve long-term shareholder value; and (2) encouraging executives to achieve our business objectives by linking executive compensation to Company performance and long-term shareholder value.
Our compensation approach for our named executive officers in 2013 had three key elements, designed to be consistent with the Company’s compensation philosophy and business objectives: (1) base salary; (2) annual incentive bonuses; and (3) long-term equity awards, subject to both time and performance-based vesting requirements. In structuring executive compensation arrangements, our Compensation Committee carefully considers how each component of our compensation program meets our business objectives.
Base salary is intended to attract and retain highly qualified executives, by providing current cash compensation commensurate with expertise, experience, tenure, performance, potential and scope of responsibility. The annual incentive bonuses motivate our executives to perform and meet our short term business goals and annual financial objectives. The equity based component of our executive compensation approach fosters a long term view of the business and helps align officer interests with shareholder interests. Further, we believe that equity awards that vest based on time enhance the stability of our senior team and
91
Table of Contents
provide greater incentives for our named executive officers to remain with the Company. We believe that the combination of annual fixed pay and equity ownership provides our named executive officers with an appropriate mix of guaranteed current cash compensation, allowing them to stay focused on their duties, and long term compensation, encouraging them to work toward increasing long term shareholder value.
We believe that a substantial portion of an executive officer’s compensation should be at-risk, in accordance with our compensation philosophy that links executive compensation to the attainment of business objectives and earnings performance, over the near and long term, which in turn enables us to attract, retain and reward executive officers who contribute to our success. For the named executive officers as a group, excluding Mark S. Conroy, for fiscal 2013, on an annualized basis, base salary represents 48.5% of their total target direct compensation, annual bonus and non-equity incentive compensation combined represents 44.7% of their total target direct compensation, long-term incentives (stock options) represent 6.8% of their total target direct compensation and all other compensation represents 2.3% of their total target direct compensation. The Company believes that this is an appropriate mix of fixed and variable compensation intended to incentivize our named executive officers to focus on both continued improved annual operating performance and continued long-term growth of the Company. In determining the appropriate mix of compensation components for each of our named executive officers, our Compensation Committee annually assesses, among other factors, each named executive officer’s responsibilities, prior experience and value to the Company, as well as each named executive officer’s expected level of contribution toward achieving the Company’s long-term objectives.
Compensation Setting Process
Compensation Consultants; Review of Relevant Compensation Data
Consistent with past practice, in 2013 neither our Compensation Committee nor management retained a compensation consultant to review or recommend the amount or form of compensation paid to our executive officers, including our named executive officers, or our directors. We have not adopted a policy regarding compensation consultant independence. We will consider the implementation of such a policy if and when we decide to retain a compensation consultant to assist us with our executive compensation programs in the future.
Our Compensation Committee believes that, in order to effectively attract and retain high level executive talent, each element of the compensation program should establish compensation levels that take into account current market practices. Our Compensation Committee does not “benchmark” executive compensation at any particular level in comparison with other companies. Rather, our Compensation Committee familiarizes itself with compensation trends and competitive conditions through the review of non-customized third-party market surveys and other relevant publicly available data. In setting compensation levels for 2013, after determining the types and amount of compensation based on its own evaluation, our Compensation Committee considered publicly available compensation data solely to determine the relative strengths and weaknesses of our compensation packages on an aggregate basis. Our Compensation Committee also relied on its extensive experience managing portfolio companies and considered each executive’s level of responsibility for the overall operations of the Company, historical Company practices, long-term market trends, internal pay equity, expectations regarding future named executive officer contributions, our own performance, budget considerations and succession planning and retention strategies.
Role of Executive Officers in Compensation Decisions
The Compensation Committee makes all compensation decisions related to the CEO and equity-based compensation awards. The Compensation Committee, together with recommendations and input from our CEO, sets and determines the compensation for the other named executive officers.
Compensation Risk Assessment
The Company conducted a risk assessment of our compensation policies and practices and concluded that such policies and practices do not create risks that are reasonably likely to have a material adverse effect on the Company. In particular, the Compensation Committee believes that the design of our annual performance
92
Table of Contents
incentive program and long-term equity incentives provides a balanced approach and an effective and appropriate mix of incentives to ensure our executive compensation program is focused on long-term shareholder value creation. To strengthen the relationship between pay and performance, our annual cash incentive bonus plan and many of our equity grants are subject to the achievement of pre-established performance goals established independently of the plan participants. In addition, a portion of such variable pay is delivered through equity awards with both time-based and performance-based vesting schedules, and performance periods covering multiple years, thus emphasizing retention and long-term company performance while discouraging the taking of short-term risks at the expense of long-term results.
Compensation Elements
The three key compensation elements for our named executive officers identified above (base pay, annual performance bonus and long-term equity awards), as well as other elements of compensation, are discussed below.
Base Salary
Base Salary is intended to provide a baseline level of fixed compensation that reflects each named executive officer’s level of responsibility. Each named executive officer is party to an employment agreement that provides for a fixed base salary, subject to annual review. The initial base salary level for each named executive officer was negotiated in connection with the executive joining the Company or our affiliates or upon a change of his or her responsibilities. Decisions regarding adjustments to base salaries are made at the discretion of our Compensation Committee, though the salaries are generally subject only to increases, not decreases. In reviewing base salary levels for our named executive officers, the Compensation Committee annually considers and assesses, among other factors, a named executive officer’s current base salary, job responsibilities, leadership and experience, and value to our Company. In addition, as noted above, base salary levels are generally intended to be consistent with competitive market base salary levels, but are not specifically targeted or “benchmarked” against any particular company or group of companies.
The chart below indicates the annual base salary for each of our named executive officers in 2013.
| 2013 Annual Base Salary |
||||
| Frank J Del Rio |
$ | 1,597,200 | ||
| Jason M. Montague |
$ | 475,000 | ||
| Robert J. Binder |
$ | 300,000 | ||
| Kunal S. Kamlani |
$ | 900,000 | ||
| T. Robin Lindsay |
$ | 475,000 | ||
| Mark S. Conroy |
$ | 550,000 | ||
Annual Incentive Bonus
Each named executive officer, with the exception of Messrs. Kamlani and Conroy, is eligible to receive an annual cash bonus for fiscal 2013 in accordance with the Company’s 2013 management incentive compensation plan (the “MICP”), subject to the provisions of his employment agreement. The 2013 MICP provides for bonus payments upon the achievement of an EBITDA-based corporate performance goal. We use our annual incentive bonus program to incentivize and motivate our named executive officers by providing the opportunity to receive additional compensation tied to annual Company performance.
Each year, the Compensation Committee establishes the performance goal after careful review of the annual budget. For 2013, the Compensation Committee determined that the MICP bonus target would be an adjusted EBITDA of PCH and its consolidated subsidiaries, defined as earnings before interest, other income (expense),
93
Table of Contents
income taxes, depreciation and amortization, and MICP compensation expense adjusted for the impact from settled fuel hedges (“MICP EBITDA”). We believe the MICP EBITDA performance target is useful as it reflects certain operating drivers of our business, such as sales growth, operating costs, selling and administrative expenses and other operating income and expense. The MICP EBITDA target was $251.3 million for 2013. The Compensation Committee reserves the right to adjust the performance goal during the course of the year to take into consideration changes in deployment of the fleet, major unforeseen and uncontrollable events and other non-recurring and extraordinary costs and revenues experienced by us during the year. Taking into account the Company’s relevant recent historical experience with respect to achievement of MICP EBITDA targets as well as the then-current environment for the cruise industry and the 2013 annual budget, the Compensation Committee believed that the MICP EBITDA target for 2013, although not substantially certain to be achieved, was reasonably possible to be achieved.
The following chart sets forth the MICP EBITDA levels at which various levels of incentive payout would become available to our named executive officers for 2013, with the bonus percentage amounts expressed as a percentage of the named executive officer’s base salary for 2013. Between these points the payout is calculated on a sliding straight line basis. There is no maximum bonus for the named executive officers and the sliding straight line allocation between 91.7% and 100% will be applied to MICP EBITDA over 100% of performance target.
| Name |
Percentage of MICP EBITDA goal Achieved |
Annual Incentive Bonus Percentage |
||||||
| Frank J. Del Rio |
76.2 | % | — | % | ||||
| 80.9 | % | 15.3 | % | |||||
| 92.5 | % | 63.6 | % | |||||
| 100.0 | % | 100.0 | % | |||||
| Jason M. Montague |
76.2 | % | — | % | ||||
| 80.9 | % | 11.5 | % | |||||
| 92.5 | % | 47.7 | % | |||||
| 100.0 | % | 75.0 | % | |||||
| Robert J. Binder |
76.2 | % | — | % | ||||
| 80.9 | % | 13.0 | % | |||||
| 92.5 | % | 54.1 | % | |||||
| 100.0 | % | 85.0 | % | |||||
| Kunal S. Kamlani (1) |
— | % | — | % | ||||
| T. Robin Lindsay |
76.2 | % | — | % | ||||
| 80.9 | % | 11.5 | % | |||||
| 92.5 | % | 47.7 | % | |||||
| 100.0 | % | 75.0 | % | |||||
| Mark S. Conroy (2) |
76.2 | % | — | % | ||||
| 80.9 | % | 13.0 | % | |||||
| 92.5 | % | 54.1 | % | |||||
| 100.0 | % | 85.0 | % | |||||
| (1) | Mr. Kamlani’s annual bonus is not based on performance against MICP EBITDA. |
| (2) | The Company agreed with Mark S. Conroy on September 26, 2012 that he would step down as president of Regent on January 30, 2013. As of January 31, 2013 he was appointed as an executive adviser to the CEO and President of PCH. In connection with these arrangements, on November 9, 2012 the Company entered into a Separation Agreement and an Independent Contractor Agreement with Mr. Conroy. In connection therewith, Mr. Conroy will receive amounts to which he is entitled pursuant to his existing employment agreement. |
94
Table of Contents
Our fiscal 2013 MICP EBITDA was % of our performance target. As a result, Frank J. Del Rio received an annual bonus equal to % of his base salary. Jason M. Montague received an annual bonus equal to % of his base salary, Robert J. Binder received an annual bonus equal to % of his base salary, T. Robin Lindsay received an annual bonus equal to % of his base salary and Mark S. Conroy received an annual bonus equal to 85.0% of his base salary through January 30, 2013.
In 2013, pursuant to his employment agreement, Mr. Kamlani is eligible to receive a cash bonus in an amount determined by the Board of Directors, subject to a guaranteed minimum annual bonus of $750,000. Based on the Compensation Committee’s review of Mr. Kamlani’s performance in fiscal 2013, including , the Committee decided to award him an annual bonus equal to $ .
The chart below shows the annual incentive bonus that was paid in 2014 based on services provided in 2013:
| Name |
Total Bonus | Bonus as % of 2013 Annual Base Salary | ||||||||
| Frank J. Del Rio |
$ | % | ||||||||
| Jason M. Montague |
$ | % | ||||||||
| Robert J. Binder |
$ | % | ||||||||
| Kunal S. Kamlani |
$ | % | ||||||||
| T. Robin Lindsay |
$ | % | ||||||||
| Mark S. Conroy |
$ | 39,558 | 7.2 | % | ||||||
Long-Term Equity Incentive Compensation
We believe that long-term compensation of our executives, including our named executive officers, should be directly linked to the value provided to shareholders. Accordingly, our long-term equity incentive program is intended to directly align a significant portion of the compensation of our named executive officers with the interests of our shareholders by motivating and rewarding creation and preservation of long-term shareholder value with measurement over a multi-year performance period. In this regard, the Compensation Committee determined that stock options in Prestige is the most appropriate equity-based compensation award, as it provides value only if there is appreciation in the value of Prestige’s ordinary shares following the date of grant, and no value if there is no such appreciation. We use a combination of time-based vesting awards (which enhance retention) and performance-based vesting (which strengthens the link between pay and performance).
Certain of our named executive officers have been granted stock options pursuant to the 2008 Stock Option Plan of Prestige (the “Prestige option plan”). Each option granted under the Prestige option plan represents the right to purchase one ordinary share of Prestige. Our philosophy is that options are granted to named executive officers when the Compensation Committee determines that it would be to the advantage and in the best interests of the Company and its stockholders to grant such options as an inducement to enter into or remain in the employ of the Company or one of its subsidiaries and as an incentive for increased efforts during such employment. The number of equity awards granted annually to our named executive officers is determined both in the discretion of the Compensation Committee and pursuant to certain agreements with certain named executive officers. Option grants to the CEO are at the discretion of the Compensation Committee, while grants to all other named executive officers are determined by the Compensation Committee after consultation with and recommendation of the CEO.
Mr. Del Rio was not granted any options in 2013, in light of the significant option grants made in 2009 in connection with the signing of his employment agreement.
Mr. Kamlani is entitled to receive time-based option grants in connection with his employment which vests in three cumulative and substantially equal installments on each of the first, second and third anniversaries of his employment for his 2012 grant and on December 31, 2013, 2014 and 2015 for his 2013 grant.
95
Table of Contents
For Mr. Montague, Mr. Binder and Mr. Lindsay, fifty percent (50%) of the option grants have time-based vesting in three cumulative and substantially equal installments at the end of each calendar year of the grant date, provided that the named executive officer remains continuously employed in active service with the Company or one of its subsidiaries. The remaining fifty percent (50%) of the option grants have performance-based vesting in three substantially equal installments on December 31 of each applicable performance measurement year if the applicable MICP EBITDA performance target for such year (which is the same target as used under the 2013 MICP) is satisfied. If the performance targets for any year are not satisfied, the performance based options scheduled to vest that year are forfeited. However, the Board of Directors or Compensation Committee reserves the right to vest or modify the options to the extent it determines that achievement of the performance criteria was affected by changes in deployment of fleet, major unforeseen and uncontrollable events and other non-recurring and extraordinary costs experienced by the Company during the year.
For Mr. Conroy, as part of his Separation Agreement and Independent Contractor Agreement entered into on November 9, 2012, all of his existing option grants were either canceled or forfeited; vested options were canceled and unvested options were forfeited as of such date.
The performance target for the performance-based options is the same as the MICP EBITDA target. The performance criteria for Messrs. Montague, Binder and Lindsay’s performance-based options were met, and their options based on 2013 performance vested in full on December 31, 2013.
Except as otherwise provided in a named executive officer’s employment agreement, unvested options are generally forfeited upon a termination from service, although certain option holders will also become vested in their awards in connection with certain terminations of employment. For a discussion of vesting under specific termination scenarios, see the section titled, “Potential Payments upon Termination of Employment and Change of Control” below.
Other Elements of Compensation
Benefits and Perquisites
We provide our named executive officers with the opportunity to participate in our medical, dental and insurance programs and vacation and other holiday pay, all in accordance with the terms of such plans and programs in effect from time to time and substantially on the same terms as those generally offered to our other employees.
In addition, certain of the named executive officers receive a cash automobile allowance, as well as Company paid long term disability coverage. The Company believes that the level and mix of perquisites it provides to the named executive officers is consistent with market compensation practices.
Severance Arrangements and Change in Control Benefits
Each of our named executive officers is employed pursuant to an employment agreement that provides for severance benefits upon an involuntary termination of the named executive officer’s employment by us, a termination by the executive as a result of a constructive termination, or in certain instances, non-renewal of an employment agreement. The severance benefit in each employment agreement was negotiated in connection with the commencement of each executive’s employment with the Company, or upon a change of their responsibilities. In each case, our Board of Directors or Compensation Committee determined that it was appropriate to provide the executive with severance and related benefits in light of his or her position with the Company, general competitive practices and as part of an overall compensation package. The severance benefits payable to each of our named executive officers upon a qualifying termination of employment generally includes a cash payment based on the executive’s base salary (and bonus, in some cases) and continued medical benefits and car allowance for the applicable severance period at the Company’s expense.
96
Table of Contents
The Company does not believe that the named executive officers should be entitled to any “single-trigger” cash severance benefits merely because of a change in control of the Company. Accordingly, none of the named executive officers are entitled to any such payments or benefits upon the occurrence of a change in control of the Company, unless there is an actual or constructive termination of employment following such change in control (“double-trigger” payments). However, the employment agreements for certain executives provide for additional payments to make them whole for any excise taxes that may be imposed on them in the event of a change in control, which payments were agreed to by the Compensation Committee in connection with the negotiation of the executive’s overall compensation package, and which the Compensation Committee believes are reasonable and competitive. The material terms of such payments and benefits are described in the section titled “Potential Payments Upon a Termination or Change in Control.”
Summary Compensation Table
The following table provides summary information concerning compensation paid or accrued during the fiscal years ended December 31, 2013, 2012 and 2011 to our principal executive officer, our principal financial officer, our three other most highly paid executive officers, and our former executive officer.
| Name and Principal Position |
Year | Salary | Bonus | Option Awards (3) |
Non-equity Incentive Plan Compensation |
All Other Compensation (4) |
Total | |||||||||||||||||||||
| Frank J. Del Rio |
2013 | $ | 1,597,200 | — | — | $ | — | $ | 109,600 | $ | — | |||||||||||||||||
| Chief Executive Officer and |
2012 | $ | 1,452,000 | — | $ | 42,199 | $ | 1,452,000 | $ | 60,149 | $ | 3,006,348 | ||||||||||||||||
| Chairman of the Board |
2011 | $ | 1,320,000 | — | $ | 7,049 | $ | 699,347 | $ | 92,726 | $ | 2,119,122 | ||||||||||||||||
| Jason M. Montague |
2013 | $ | 475,000 | — | $ | 177,309 | $ | — | $ | 19,791 | $ | — | ||||||||||||||||
| Executive Vice President, |
2012 | $ | 400,000 | $ | — | $ | 83,533 | $ | 300,000 | $ | 13,200 | $ | 796,733 | |||||||||||||||
| Chief Financial Officer |
2011 | $ | 325,000 | $ | — | $ | 40,497 | $ | 170,466 | $ | 15,377 | $ | 551,340 | |||||||||||||||
| Robert J. Binder (1) |
2013 | $ | 300,000 | — | $ | 25,330 | $ | — | — | $ | — | |||||||||||||||||
| Vice Chairman and |
||||||||||||||||||||||||||||
| President |
||||||||||||||||||||||||||||
| Kunal S. Kamlani |
2013 | $ | 900,000 | $ | 750,000 | $ | 272,222 | $ | — | $ | 29,417 | $ | — | |||||||||||||||
| President and Chief |
2012 | $ | 750,000 | $ | 750,000 | $ | 1,374,198 | $ | — | $ | 17,246 | $ | 2,891,444 | |||||||||||||||
| Operating Officer of PCH (2) |
2011 | $ | 256,849 | $ | 500,000 | $ | — | $ | — | $ | 22,547 | $ | 779,396 | |||||||||||||||
| Mark S. Conroy |
2013 | $ | 42,308 | $ | — | $ | 123,281 | $ | 39,558 | $ | 788,301 | $ | 993,448 | |||||||||||||||
| President of Regent |
2012 | $ | 550,000 | $ | — | $ | 28,588 | $ | 467,500 | $ | 13,200 | $ | 1,059,288 | |||||||||||||||
| 2011 | $ | 535,000 | $ | — | $ | 40,461 | $ | 318,028 | $ | 13,318 | $ | 906,807 | ||||||||||||||||
| T. Robin Lindsay |
2013 | $ | 475,000 | $ | — | $ | 25,963 | $ | — | $ | 13,200 | $ | — | |||||||||||||||
| Executive Vice President of |
2012 | $ | 450,000 | $ | — | $ | 73,925 | $ | 164,835 | $ | 13,200 | $ | 701,960 | |||||||||||||||
| Vessel Operations |
2011 | $ | 425,000 | $ | — | $ | 40,914 | $ | 222,917 | $ | 13,200 | $ | 702,031 | |||||||||||||||
| (1) | Mr. Binder first became a named executive officer in 2013. |
| (2) | Mr. Kamlani rejoined the Company from Bank of America/Merrill Lynch during the third quarter of 2011 and as such he did not earn his entire 2011 annualized base salary. Prior to that, Mr. Kamlani was the Chief Financial Officer for PCH. |
| (3) | Represents the aggregate grant date fair value of options granted to such named executive officers in 2013, computed in accordance with FASB ASC Topic 718, disregarding any estimates of forfeitures related to service-based vesting conditions. See Note 8—Share-Based Employee Compensation, to the Company’s consolidated financial statements set forth in this prospectus for the assumptions made in determining those values. |
| (4) | Included within Mr. Del Rio’s “All Other Compensation” for fiscal 2013 is $62,000 personal allowances, $27,600 car allowance, and $20,000 personal tax service. Included within Mr. Montague’s and Mr. Kamlani’s “All Other Compensation” for fiscal 2013 is $13,200 car allowance and cruise benefits. Included within Mr. Lindsay’s “All Other Compensation” for fiscal 2013 is $13,200 car allowance. Mr. Conroy’s “All Other Compensation” amount for fiscal 2013 includes $550,000 severance, $137,500 consulting fees, $65,053 COBRA, $27,500 car allowance and $5,908 Long Term Care insurance premium and cruise benefits. The cruise benefit was valued on the basis of the aggregate incremental cost to the Company. |
97
Table of Contents
Grants of Plan-Based Awards for Fiscal 2013
The following Grants of Plan-Based Awards table provides information concerning awards granted in 2013 to our named executive officers.
| Estimated Future Payouts Under Non-Equity Incentive Plan Awards (1) |
Estimated Future Payouts Under Equity Incentive Plan Awards (2) |
All other Option Awards: # of Securities Underlying |
Grant Date Fair Value of Stock & Option |
|||||||||||||||||||||||||||||||||
| Name |
Grant Date |
Threshold ($) |
Target ($) |
Maximum ($) |
Threshold ($) |
Target ($) |
Maximum ($) |
Options | Awards (4) |
|||||||||||||||||||||||||||
| Frank J. Del Rio |
— | — | 1,597,200 | — | — | — | — | — | — | |||||||||||||||||||||||||||
| Jason M. Montague |
— | 356,250 | — | — | — | — | — | — | ||||||||||||||||||||||||||||
| 2/11/13 | — | — | — | — | — | — | 35,000 | $ | 88,654 | |||||||||||||||||||||||||||
| 2/11/13 | — | — | — | — | 11,666 | — | — | $ | 30,692 | |||||||||||||||||||||||||||
| 2/11/13 | — | — | — | — | 11,667 | — | — | $ | 29,538 | |||||||||||||||||||||||||||
| 2/11/13 | — | — | — | — | 11,667 | — | — | $ | 28,424 | |||||||||||||||||||||||||||
| Robert J. Binder |
— | 255,000 | — | |||||||||||||||||||||||||||||||||
| 2/11/13 | — | — | — | — | — | — | 5,000 | $ | 12,665 | |||||||||||||||||||||||||||
| 2/11/13 | — | — | — | — | 1,666 | — | — | $ | 4,383 | |||||||||||||||||||||||||||
| 2/11/13 | — | — | — | — | 1,667 | — | — | $ | 4,220 | |||||||||||||||||||||||||||
| 2/11/13 | — | — | — | — | 1,667 | — | — | $ | 4,061 | |||||||||||||||||||||||||||
| Kunal S. Kamlani (3) |
||||||||||||||||||||||||||||||||||||
| 2/11/13 | — | — | — | — | — | — | 100,000 | $ | 272,222 | |||||||||||||||||||||||||||
| Mark S. Conroy (5) |
||||||||||||||||||||||||||||||||||||
| 1/31/13 | — | — | — | — | — | — | 100,000 | $ | 123,281 | |||||||||||||||||||||||||||
| T. Robin Lindsay |
— | 356,250 | — | — | — | — | — | — | ||||||||||||||||||||||||||||
| 2/11/13 | — | — | — | — | — | — | 5,125 | $ | 12,982 | |||||||||||||||||||||||||||
| 2/11/13 | — | — | — | — | 1,708 | — | — | $ | 4,494 | |||||||||||||||||||||||||||
| 2/11/13 | — | — | — | — | 1,708 | — | — | $ | 4,324 | |||||||||||||||||||||||||||
| 2/11/13 | — | — | — | — | 1,709 | — | — | $ | 4,164 | |||||||||||||||||||||||||||
| (1) | Represents potential payout levels based on 2013 performance for awards granted pursuant to the 2013 MICP. There is no maximum amount payable under the 2013 MICP. Mr. Kamlani’s bonus is fully discretionary, with a minimum guaranteed bonus of $750,000. For amounts actually paid to each of the named executive officers pursuant to such awards based on results achieved in 2013, see the Summary Compensation Table column titled “Non-Equity Incentive Plan Compensation.” For a more detailed description of the potential payout under the 2013 MICP, see “—Annual Incentive Bonus.” |
| (2) | Represents performance-based options granted to such named executive officers in 2013 pursuant to the Prestige option plan. There is no threshold or maximum performance and the options are generally forfeited if the relevant performance target is not satisfied. For a more detailed description of the performance-based options, see “—Long-Term Equity Incentive Compensation.” |
| (3) | Represents time-based options granted to such named executive officers in 2013, pursuant to the Prestige option plan. The options vest and become exercisable in three cumulative and substantially equal installments at the end of each calendar year of the grant date, provided that the named executive officer remains continuously employed in active service with the Company or one of its subsidiaries. |
| (4) | Represents the aggregate grant date fair value of options granted to such named executive officers in 2013, computed in accordance with FASB ASC Topic 718, disregarding any estimates of forfeitures related to service-based vesting conditions. See Note 8—Share-Based Employee Compensation, to the Company’s consolidated financial statements set forth in this filing for the assumptions made in determining those values. |
| (5) | Represents time-based options granted to such named executive officer in 2013, pursuant to the Prestige option plan. The options vest and become exercisable on January 31, 2015. |
Employment Agreements
Though the employment agreements reference the boards and compensation committees of various subsidiaries and affiliates, our current practice is that compensation decisions are made by the Board and/or Compensation Committee.
98
Table of Contents
Frank J. Del Rio
The Company and Chairman and Chief Executive Officer of the Company, Frank J. Del Rio, agreed on March 22, 2013 to amend and extend Mr. Del Rio’s executive employment agreement with Prestige through December 31, 2016. The amendment modifies certain terms of his existing employment agreement. Mr. Del Rio’s annual base salary for the period July 1, 2013 through December 31, 2013 will be at a prorated rate of $1,597,200. Beginning on January 1, 2014 and for each year thereafter, Mr. Del Rio shall receive an annual base salary of $1,750,000. Effective as of March 22, 2013, Mr. Del Rio will receive a travel allowance of $30,000 per year and certain other benefits. In the event of a termination of Mr. Del Rio’s employment before the end of the term of his employment either (1) by Prestige without cause within 180 days prior to the sale of Prestige or any time thereafter, or (2) by Mr. Del Rio for good reason any time after the sale of Prestige, Mr. Del Rio is entitled to a severance equal to the sum of two years of Base Salary and targeted annual incentive bonus, and certain other benefits including continued allowance for country club dues and fees, automobile allowance, health/medical plan benefits and certain other benefits for two years.
For 2013, Mr. Del Rio is eligible for a target incentive bonus equal to one hundred percent (100%) of his then current salary, provided that the actual bonus shall be determined by the Board in its sole discretion, based on performance objectives established with respect to that year by the Board, in good faith consultation with Mr. Del Rio. In 2009, pursuant to his officer employment agreement, Mr. Del Rio received an option to purchase 216,216 shares of Prestige. Such option grant was intended as incentive compensation for 2010 and 2011, with fifty percent (50%) vesting at the end of each year, subject to continued employment and the achievement of performance objectives established by the Board. Additionally, in 2009, pursuant to his officer employment agreement, Mr. Del Rio received a time based option to purchase 1,000,000 shares of Prestige, with fifty percent (50%) vesting on the second anniversary of the grant, and then an additional twenty five percent (25%) vesting on each of the third and fourth anniversaries of the grant. As a condition to receiving such option, Mr. Del Rio was required to make an equity investment in Prestige, in the amount of $3,000,000. The agreement also provides for participation in employee benefit plans and perquisite programs generally available to similarly situated executives. In particular, Mr. Del Rio is entitled to an automobile allowance of $2,300 per month, a personal expense allowance of $12,000 per year (subject to review and upward adjustment), an allowance for country club dues and fees up to $20,000 per year (subject to review and upward adjustment), an allowance for tax advice and preparation up to $20,000 per year, business class travel and forty (40) days annual paid vacation. Mr. Del Rio is also eligible for a tax “gross up,” to make him whole in the event that an excise tax is due under Section 280G of the Internal Revenue Code in connection with payments contingent on a change in control of Prestige.
Jason M. Montague
Mr. Montague is employed as Executive Vice President and Chief Financial Officer pursuant to an employment agreement with PCS, dated January 1, 2013. The term of Mr. Montague’s original employment agreement is three years. The agreement provides for a minimum annual base salary of $475,000, which shall be evaluated for an upward adjustment annually before each compensation determination date, which shall be no later than the first quarter of the applicable fiscal year. Mr. Montague is eligible for an annual cash bonus in an amount to be determined at the sole discretion of the compensation committee of PCS based on MICP EBITDA and the job performance of Mr. Montague. The agreement also provides for participation in employee benefit plans and perquisite programs generally available to our senior executives. In particular, Mr. Montague is entitled to an annual automobile allowance of $13,200, twenty-five (25) days annual paid vacation and business class travel. Mr. Montague is also eligible for a tax “gross up,” to make him whole in the event that an excise tax is due under Section 280G of the Internal Revenue Code in connection with payments contingent on a change in control of PCS.
Robert J. Binder
Mr. Binder is employed as Vice Chairman and President pursuant to an employment agreement with PCS, dated January 1, 2013. The term of Mr. Binder’s agreement is one year. The agreement provides for an annual base salary of $300,000. Mr. Binder is eligible for an annual cash bonus in an amount to be determined at the
99
Table of Contents
sole discretion of the compensation committee of PCS based on EBITDA and the job performance of Mr. Binder. The agreement also provides for participation in employee benefit plans and perquisite programs generally available to our senior executives. In particular, Mr. Binder is entitled to fifteen (15) days annual paid vacation, business class travel internationally and first class travel to California. Mr. Binder is also eligible for a tax “gross up,” to make him whole in the event that an excise tax is due under Section 280G of the Internal Revenue Code in connection with payments contingent on a change in control of PCS.
Mr. Binder has entered into a new employment agreement effective January 1, 2014, which will terminate December 31, 2016. The agreement provides for a minimum base salary of $500,000, which shall be evaluated for an upward adjustment annually before each compensation determination date, which shall be no later than the first quarter of the applicable fiscal year. Mr. Binder is eligible for an annual cash bonus in an amount to be determined at the sole discretion of the compensation committee of PCS based on MICP EBITDA and the job performance of Mr. Binder. The agreement also provides for participation in employee benefit plans and perquisite programs generally available to our senior executives. In particular, Mr. Binder is entitled to twenty-five (25) days annual paid vacation, business class travel and first class travel to California. Mr. Binder is also eligible for a tax “gross up,” to make him whole in the event that an excise tax is due under Section 280G of the Internal Revenue Code in connection with payments contingent on a change in control of PCS.
Kunal S. Kamlani
Pursuant to an employment agreement with Oceania and PCH dated June 17, 2011, Mr. Kamlani is employed as President and Chief Operating Officer of the above companies and any of their majority owned subsidiaries. The initial term of Mr. Kamlani’s employment expires on December 31, 2014, and the term will automatically renew for an additional year and each anniversary thereafter, unless either party gives written notice of non-renewal within ninety days prior to the expiration of the term (including any renewal thereof). The agreement provides for an annual base salary of $750,000, which shall be reviewed on an annual basis and may be increased, but not decreased, at the discretion of the Board of Directors. Mr. Kamlani is eligible for an annual cash bonus equal to a minimum of $750,000, pro-rated for any fiscal year in which Mr. Kamlani is not employed for the entire year. If Oceania, PCH, and each of their majority owned subsidiaries do not pay any form of cash bonus to their executives or key employees generally, the payment of Mr. Kamlani’s cash bonus may be deferred for up to one calendar year, if such deferral is permitted under applicable law. The employment agreement also provides Mr. Kamlani a time based option to purchase 600,000 shares of Prestige which vest in three cumulative and substantially equal installments on each of the first, second and third anniversaries of his employment, and contemplates future additional grants subject to Board discretion and evaluation of Mr. Kamlani’s performance. Mr. Kamlani is eligible for participation in employee benefit plans and perquisite programs generally available to executives of Oceania. In particular, Mr. Kamlani is entitled to an annual automobile allowance of $13,200 and twenty (20) days annual paid vacation.
Mark S. Conroy
Effective January 31, 2013 Mr. Conroy stepped down as President of Regent. He previously was employed pursuant to an employment agreement with PCS and Prestige dated February 1, 2011. The agreement provided for a minimum annual base salary of $535,000. Mr. Conroy was eligible for an annual cash bonus, the target of which shall be determined by PCS pursuant to its then applicable management incentive compensation plan, provided that Mr. Conroy’s actual bonus amount will be determined by the board of PCS in its discretion based on performance objectives it establishes with respect to a particular fiscal year. Mr. Conroy was eligible for participation in employee benefit plans and perquisite programs generally available to executives of PCS. In particular, Mr. Conroy was entitled to an annual automobile allowance of $13,200 and six (6) weeks of annual paid vacation.
T. Robin Lindsay
Mr. Lindsay is employed as Executive Vice President, Vessel Operations pursuant to an employment agreement with PCS, dated January 1, 2012. The term of Mr. Lindsay’s employment agreement is three years.
100
Table of Contents
The agreement provides for a minimum annual base salary of $450,000, which shall be evaluated for an upward adjustment annually before each compensation determination date, which shall be no later than the first quarter of the applicable fiscal year. Mr. Lindsay is eligible for an annual cash bonus in an amount to be determined at the sole discretion of the compensation committee of PCS based on EBITDA and the job performance of Mr. Lindsay. The agreement also provides for participation in employee benefit plans and perquisite programs generally available to our senior executives. In particular, Mr. Lindsay is entitled to an annual automobile allowance of $13,200, twenty-five (25) days annual paid vacation and business class travel. Mr. Lindsay is also eligible for a tax “gross up,” to make him whole in the event that an excise tax is due under Section 280G of the Internal Revenue Code in connection with payments contingent on a change in control of PCS.
Outstanding Equity Awards
At Fiscal 2013 Year-End
| Option Awards | ||||||||||||||||||||
| Name |
Number of Securities Underlying Unexercised Options (#) Exercisable |
Number of Securities Underlying Unexercised Options (#) Unexercisable |
Equity Incentive Plan Awards: Number of Securities Underlying Unexercised Unearned Options (#) |
Option Exercise Price ($) |
Option Expiration Date |
|||||||||||||||
| Frank J. Del Rio |
1,000,000 | — | — | 8.00 | 7/1/2017 | |||||||||||||||
| 216,216 | — | — | 9.25 | 1/1/2018 | ||||||||||||||||
| Jason M. Montague |
15,000 | — | — | 40.02 | 6/1/2015 | |||||||||||||||
| 15,000 | — | — | 40.32 | 4/22/2016 | ||||||||||||||||
| 7,500 | — | — | 8.00 | 3/31/2017 | ||||||||||||||||
| 25,000 | — | — | 8.00 | 12/15/2017 | ||||||||||||||||
| 55,000 | — | — | 10.11 | 3/31/2018 | ||||||||||||||||
| 12,500 | — | — | 9.50 | 1/1/2019 | ||||||||||||||||
| 20,000 | 5,000 | (2) | 5,000 | (4) | 4.87 | 2/10/2020 | ||||||||||||||
| 23,333 | 23,333 | (3) | 23,334 | (5) | 5.79 | 2/11/2021 | ||||||||||||||
| Robert J. Binder |
45,000 | — | — | 40.02 | 6/1/2015 | |||||||||||||||
| 40,000 | — | — | 40.32 | 4/22/2016 | ||||||||||||||||
| 50,000 | — | — | 8.00 | 12/15/2017 | ||||||||||||||||
| 50,000 | — | — | 10.11 | 3/31/2018 | ||||||||||||||||
| 3,333 | 3,333 | 3,334 | 5.79 | 2/11/2021 | ||||||||||||||||
| Kunal S. Kamlani |
400,000 | 200,000 | (6) | — | 4.87 | 2/28/2020 | ||||||||||||||
| 33,334 | 66,666 | (3) | — | 5.79 | 2/11/2021 | |||||||||||||||
| Mark S. Conroy (1) |
— | 100,000 | — | 8.85 | 1/31/2021 | |||||||||||||||
| T. Robin Lindsay |
30,000 | — | — | 40.02 | 6/1/2015 | |||||||||||||||
| 30,000 | — | — | 40.32 | 4/22/2016 | ||||||||||||||||
| 45,000 | — | — | 8.00 | 3/31/2017 | ||||||||||||||||
| 7,500 | — | — | 8.00 | 12/15/2017 | ||||||||||||||||
| 50,000 | — | — | 10.11 | 3/31/2018 | ||||||||||||||||
| 12,500 | — | — | 9.50 | 1/1/2019 | ||||||||||||||||
| 16,500 | 4,125 | (2) | 4,125 | (4) | 4.87 | 2/10/2020 | ||||||||||||||
| 3,417 | 3,417 | (3) | 3,416 | (5) | 5.79 | 2/11/2021 | ||||||||||||||
| (1) | As part of Mr. Conroy’s Separation Agreement and Independent Contractor Agreement entered into on November 9, 2012, he received a grant of 100,000 options, which will vest and become exercisable on January 31, 2015 provided that he remains in compliance with the agreement. |
| (2) | Options will vest and become exercisable on December 31, 2014, provided that the named executive officer remains continuously employed in active service with the Company or one of its subsidiaries. |
101
Table of Contents
| (3) | Options will vest and become exercisable ratably on December 31, 2014 and December 31, 2015, provided that the named executive officer remains continuously employed in active service with the Company or one of its subsidiaries. |
| (4) | Options will vest and become exercisable on December 31, 2014, subject to the achievement of the 2014 MICP EBITDA target. |
| (5) | Options will vest and become exercisable ratably on December 31, 2014 and December 31, 2015, if the applicable MICP EBITDA performance target for such year is satisfied. |
| (6) | Options will vest and become exercisable on August 29, 2014, provided that the named executive officer remains continuously employed in active service with the Company or one of its subsidiaries. |
Potential Payments upon Termination of Employment and Change of Control
Pursuant to their employment agreements, each of our named executive officers is eligible to receive certain payments and benefits in connection with termination of employment under various circumstances. The potential benefits payable to our named executive officers in the event of termination of employment under various scenarios are described below.
Payments Made Upon Any Termination of Employment
Regardless of the manner in which a named executive officer’s employment terminates, such named executive officer is entitled to receive amounts earned during the term of employment including accrued but unpaid base salary through the date of termination, accrued but unpaid incentive bonus for the year prior to the year of termination (except with respect to terminations for Cause, as defined in each employment agreement), unreimbursed employment-related expenses owed to the named executive officer under our policies and the value of any accrued benefits under any of our employee benefit programs (in accordance with the terms of such programs).
In addition to the accrued obligations, the employment agreements provide for certain additional benefits to be paid in connection with a termination of employment under the circumstances described below, subject to an officer executing a release of claims in favor of the Company:
Frank J. Del Rio
Upon Termination Without Cause or For Good Reason. Mr. Del Rio will be entitled to receive: (i) a pro rata incentive cash bonus for the year of termination and (ii) accelerated vesting of the next tranche of each of the option grants scheduled to vest (if the Board of Directors determines in good faith that the then current progress towards the achievement of performance goals, if applicable, would result in the successful attainment of such goals).
Upon a Sale of the Company. If Mr. Del Rio is terminated without cause (as defined below) during the one hundred eighty (180) day period preceding, or anytime after, or resigns for good cause after, a sale of the Company, he will be entitled to accelerated vesting of his option grants, and two years of each of the following elements of compensation: base salary, incentive bonus, medical benefits, auto allowance, personal tax advice fees, country club dues, personal travel and personal expense allowances.
280G Excise Tax Gross Up. Pursuant to his officer employment agreement, in the event that payments to or for the benefit of Mr. Del Rio relating to his termination of employment in connection with a change in control would be subject to an excise tax imposed by Section 4999 of the Internal Revenue Code, the aggregate amount of such payments will be increased so that, after the payment of taxes, he will be in the same position as he would have been had he not been required to pay such excise taxes.
Restrictive Covenants. Pursuant to his officer employment agreement, Mr. Del Rio may not disclose any of our confidential information at any time during or after employment. Additionally, Mr. Del Rio may not compete with our business for a post employment period of one year (two years if the employment terminates as a result of his voluntary termination without good reason) and may not solicit our employees for a post employment period of one year.
102
Table of Contents
For purposes of Mr. Del Rio’s employment agreement:
“Cause” means Mr. Del Rio’s: (i) willful and continued failure to substantially perform his duties under his officer employment agreement after the Board of Directors delivers a written demand for substantial performance and such nonperformance has continued for more than thirty (30) days following such notice; (ii) willful misconduct or gross misconduct that has resulted in material injury to our financial interests or reputation; (iii) violation of our policies and procedures which in the reasonable discretion of the Board of Directors is grounds for termination of employment; (iv) material breach of the restrictive covenants; (v) act or omission which, if convicted by a court of law, would constitute a felony; or involves disloyalty, dishonesty, or insubordination; (vi) act or omission which is an intentional violation of our written policies; (vii) act or omission which results in a breach of any term or condition of the officer employment agreement; or (viii) act or omission which has a material adverse effect on our reputation, business affairs or goodwill. In order for a termination to be for “cause,” such termination must be approved by not less than a majority of the entire membership of the Board of Directors at a meeting of the Board called and held for such purpose.
“Good Reason” means, without Mr. Del Rio’s consent and after receipt from him of written notice stating the good reason event (i) any substantial adverse change in the nature or scope of Mr. Del Rio’s responsibilities, authorities, powers, functions, or duties; (ii) an involuntary reduction in base salary or target incentive compensation; (iii) a breach by us of any material obligations under the officer employment agreement; or (iv) the relocation of the primary offices at which he is principally employed or the requirement that Mr. Del Rio be based anywhere other than our current location to more than sixty (60) miles therefrom on an extended basis, except for required business travel to an extent substantially consistent with his current business travel obligations. The Company has a 30 day cure right after receipt of written notice from Mr. Del Rio.
“Sale of the Company” means the consummation of (i) the transfer (in one or a series of related transactions) of all or substantially all of the consolidated assets of Prestige and its subsidiaries, taken as a whole, to a person or a group of persons acting in concert (other than a subsidiary or subsidiaries of Prestige), (ii) the transfer (in one or a series of related transactions) of the outstanding equity securities of Prestige to one person or a group of persons acting in concert, or (iii) the merger or consolidation of Prestige with or into another person, in the case of clauses (ii) and (iii) above, under circumstances in which (x) the holders of a majority of the voting power of the outstanding equity securities of Prestige immediately prior to such transaction (collectively, the “Majority Holder”) own less than a majority in voting power of the outstanding equity securities of Prestige or equity securities of the surviving or resulting person or acquirer, as the case may be, immediately following such transaction and (y) immediately following such transaction, a person (other than the Majority Holder) owns at least a majority in voting power of the outstanding equity securities of Prestige or equity securities of the surviving or resulting person or acquirer, as the case may be. A sale (or multiple related sales) of one or more subsidiaries of Prestige (whether by way of merger, consolidation, reorganization or sale of all or substantially all assets or securities) which constitutes all or substantially all of the consolidated assets of Prestige will be deemed a “Sale of the Company.” For the avoidance of doubt, an underwritten public offering of the securities of Prestige or any of its subsidiaries shall in no event constitute a “Sale of the Company.”
Jason M. Montague and T. Robin Lindsay
Upon Termination due to Death or Disability. The officer will be entitled to receive: (i) a pro rata incentive bonus for the year of termination, payable in a lump sum within thirty days of termination and (ii) accelerated vesting of all option grants.
Upon a Company Non-Renewal of the Employment Term. The officer will be entitled to receive: (i) a pro rata incentive bonus for the year of termination, payable within thirty days of termination, (ii) a severance payment payable in a lump sum within thirty days of termination equal to six months of the officer’s base salary and (iii) all insurance benefits and automobile allowances for a post termination period of six months.
103
Table of Contents
Upon Termination Without Cause or For Good Reason. The officer will be entitled to: (i) a pro rata incentive bonus for the year of termination, payable in a lump sum within thirty days of termination, (ii) accelerated vesting of all option grants, (iii) a severance payment payable in a lump sum within thirty days of termination equal to two years of the officer’s base salary and (iv) all insurance benefits and automobile allowances for a post termination period of one year.
Upon Termination due to a Change in Control. If, within ninety (90) days prior to, or within twelve (12) months after the occurrence of an event constituting a change in control, the officer’s employment is terminated without “cause,” for “good reason” (each as defined below) or due to non-renewal of the employment term, the officer shall receive, in a lump sum, within ten (10) days after the separation from service (i) $1,000,000 and (ii) a pro rata incentive bonus for the year of termination.
280G Excise Tax Gross Up. Pursuant to the officer employment agreements, in the event that payments to or for the benefit of the officer relating to his termination of employment in connection with a change in control would be subject to an excise tax imposed by Section 4999 of the Internal Revenue Code, the aggregate amount of such payments will be increased so that, after the payment of taxes, the officer will be in the same position as he would have been had he not been required to pay such excise taxes.
Restrictive Covenants. Pursuant to the officer employment agreements, the officer may not disclose any of our confidential information at any time during or after employment. Additionally, the officer may not compete with our business for a post-employment period of six months in the case of Mr. Montague and one year in the case of Mr. Lindsay and may not solicit our employees or customers for a post-employment period of one year.
For purposes of Mr. Montague’s and Mr. Lindsay’s employment agreements:
“Cause” means the officer’s: (i) willful and continued failure to perform his duties under his officer employment agreement after the Board of Directors delivers a written demand for substantial performance and such nonperformance has continued for more than thirty (30) days following such notice; (ii) willful misconduct or gross misconduct that has resulted in material injury to our financial interests or reputation; (iii) violation of our policies and procedures which in the reasonable discretion of the Board of Directors is grounds for termination of employment; (iv) material breach of the restrictive covenants; (v) act or omission which, if convicted by a court of law, would constitute a felony; or involves disloyalty, dishonesty, or insubordination; (vi) act or omission which is an intentional violation of our written policies; (vii) act or omission which results in a breach of any term or condition of the officer employment agreement; or (viii) act or omission which has a material adverse effect on our reputation, business affairs or goodwill.
“Good Reason” means, without the officer’s consent and after receipt from the officer of written notice stating the good reason event (i) any substantial adverse change in the nature or scope of the officer’s responsibilities, authorities, powers, functions, or duties; (ii) an involuntary reduction in base salary or target incentive compensation; (iii) a breach by us of any material obligations under the officer employment agreement; or (iv) the relocation of the primary offices at which the officer is principally employed or the requirement that the officer be based anywhere other than our current location to more than sixty (60) miles therefrom on an extended basis, except for required business travel to an extent substantially consistent with the officer’s current business travel obligations. The Company has a 30 day cure right after receipt of written notice from the officer.
“Change in Control” means the acquisition by any individual, entity, or group (within the meaning of Section 13(d)(3) or 14(d)(2) of the Exchange Act) other than PCS, or any of its subsidiaries, or affiliated companies, of beneficial ownership (within the meaning of Rule 13d-3 promulgated under the Exchange Act) of fifty-one percent (51%) or more of the common voting stock of the then outstanding voting securities of PCS, entitled to vote generally in the election of directors.
Robert J. Binder
Upon Termination due to Death or Disability. The officer will be entitled to receive: (i) a pro rata incentive bonus for the year of termination, payable in a lump sum within thirty days of termination and (ii) accelerated vesting of all option grants.
104
Table of Contents
Upon a Company Non-Renewal of the Employment Term. The officer will be entitled to receive: (i) a pro rata incentive bonus for the year of termination, payable within thirty days of termination, (ii) a severance payment payable in a lump sum within thirty days of termination equal to one year of the officer’s base salary and (iii) all insurance benefits and automobile allowances for a post termination period of one year.
Upon Termination Without Cause or For Good Reason. The officer will be entitled to: (i) a pro rata incentive bonus for the year of termination, payable in a lump sum within thirty days of termination, (ii) accelerated vesting of all option grants, (iii) a severance payment payable in a lump sum within thirty days of termination equal to two years of the officer’s base salary and (iv) all insurance benefits and automobile allowances for a post termination period of one year.
Upon Termination due to a Change in Control. If, within ninety (90) days prior to, or within twelve (12) months after the occurrence of an event constituting a change in control, the officer’s employment is terminated without “cause,” for “good reason” (each as defined below) or due to non-renewal of the employment term, the officer shall receive, in a lump sum, within ten (10) days after the separation from service (i) $1,000,000 and (ii) a pro rata incentive bonus for the year of termination.
280G Excise Tax Gross Up. Pursuant to the officer employment agreements, in the event that payments to or for the benefit of the officer relating to his termination of employment in connection with a change in control would be subject to an excise tax imposed by Section 4999 of the Internal Revenue Code, the aggregate amount of such payments will be increased so that, after the payment of taxes, the officer will be in the same position as he would have been had he not been required to pay such excise taxes.
Restrictive Covenants. Pursuant to the officer employment agreements, the officer may not disclose any of our confidential information at any time during or after employment. Additionally, the officer may not compete with our business for a post-employment period of one year and may not solicit our employees or customers for a post-employment period of one year.
For purposes of Mr. Binder’s employment agreement:
“Cause” means the officer’s: (i) willful and continued failure to perform his duties under his officer employment agreement after the Board of Directors delivers a written demand for substantial performance and such nonperformance has continued for more than thirty (30) days following such notice; (ii) willful misconduct or gross misconduct that has resulted in material injury to our financial interests or reputation; (iii) violation of our policies and procedures which in the reasonable discretion of the Board of Directors is grounds for termination of employment; (iv) material breach of the restrictive covenants; (v) act or omission which, if convicted by a court of law, would constitute a felony; or involves disloyalty, dishonesty, or insubordination; (vi) act or omission which is an intentional violation of our written policies; (vii) act or omission which results in a breach of any term or condition of the officer employment agreement; or (viii) act or omission which has a material adverse effect on our reputation, business affairs or goodwill.
“Good Reason” means, without the officer’s consent and after receipt from the officer of written notice stating the good reason event (i) any substantial adverse change in the nature or scope of the officer’s responsibilities, authorities, powers, functions, or duties; (ii) an involuntary reduction in base salary or target incentive compensation; (iii) a breach by us of any material obligations under the officer employment agreement; or (iv) the relocation of the primary offices at which the officer is principally employed or the requirement that the officer be based anywhere other than our current location to more than sixty (60) miles therefrom on an extended basis, except for required business travel to an extent substantially consistent with the officer’s current business travel obligations. The Company has a 30 day cure right after receipt of written notice from the officer.
“Change in Control” means the acquisition by any individual, entity, or group (within the meaning of Section 13(d)(3) or 14(d)(2) of the Exchange Act) other than PCS, or any of its subsidiaries, or affiliated companies, of beneficial ownership (within the meaning of Rule 13d-3 promulgated under the Exchange Act) of fifty-one percent (51%) or more of the common voting stock of the then outstanding voting securities of PCS, entitled to vote generally in the election of directors.
105
Table of Contents
Kunal S. Kamlani
Upon Termination due to Death or Disability. Mr. Kamlani will be entitled to receive a pro rata incentive bonus for the year of termination, payable at the time incentive bonuses are paid to other employees.
Upon Termination Without Cause, For Good Reason or Upon a Company Non-Renewal of the Employment Term. Mr. Kamlani will be entitled to receive: (i) a pro rata incentive bonus for the year of termination, payable at the time incentive bonuses are paid to other employees, (ii) accelerated vesting of all option grants, (iii) a severance payment equal to one year of his base salary plus $750,000, payable in substantially equal installments over six months, and (iv) all COBRA premium insurance charges for a period of one year post termination.
Upon a Change in Control. Mr. Kamlani will be entitled to accelerated vesting of his option grants.
Restrictive Covenants. Pursuant to his officer employment agreement, Mr. Kamlani may not disclose any of our confidential information at any time during or after employment. Additionally, Mr. Kamlani may not compete with our business or solicit our employees or customers for a period of one year post employment.
For purposes of Mr. Kamlani’s employment agreement:
“Cause” means Mr. Kamlani (i) is convicted of, or pleads guilty or no contest to, a felony; (ii) has engaged in fraud, or other acts of willful misconduct or dishonesty in the course of his duties; (iii) willfully fails to perform or uphold his duties under the officer employment agreement or willfully fails to comply with reasonable Board of Directors directives, and such failure is not cured within ten (10) days of Mr. Kamlani’s receipt of written notice of such failure; or (iv) materially breaches his restrictive covenant obligations under his officer employment agreement or any material breach of any other employment related contract which is not cured within ten (10) days following Mr. Kamlani’s receipt of written notice of such material breach.
“Good Reason” (constructive termination) means Mr. Kamlani’s resignation after the occurrence of any of the following conditions: (i) any diminution in base salary or minimum bonus amount; (ii) a diminution in his authority, duties, or responsibilities as measured in the aggregate; (iii) a change in the geographic location of his principal place of employment from the greater Miami, Florida area; or (iv) our material breach of Mr. Kamlani’s employment agreement. Mr. Kamlani must provide written notice of the condition claimed to constitute grounds for good reason within sixty (60) days of the initial existence of such condition and the Company has a thirty (30) day cure right after receiving such written notice. Additionally, the termination of his employment must occur within one hundred and twenty (120) days following the initial existence of the condition claimed to constitute grounds for good reason.
Mark S. Conroy
Pursuant to his Separation Agreement and Independent Contractor Agreement, Mr. Conroy was paid one year salary and COBRA benefits totaling $582,530 in February 2013. He also was paid $39,558 of pro-rata 2013 MICP from January 1 through January 30, 2013. In return for severance pay and benefits, Mr. Conroy has released the Company from any and all claims. As part of his consultant agreement, Mr. Conroy will receive total cash payments of $614,838, payable through January 2015, and was granted 100,000 Prestige options at a grant price of $8.85. The consultant agreement is for a term of twenty-four months.
Equity Incentive Plan Awards
2008 Stock Option Plan
Under the terms of the Prestige option plan, if there is a Sale of the Company, each named executive officer’s outstanding options granted under the plan will generally become fully vested and exercisable, unless the Compensation Committee provides for the substitution, assumption, exchange or other continuation or settlement of such options. The Compensation Committee however has authority to accelerate vesting in such circumstances as it may deem appropriate.
106
Table of Contents
“Sale of the Company” is defined as the consummation of (i) the transfer (in one or a series of related transactions) of all or substantially all of the consolidated assets of Prestige and its subsidiaries, taken as a whole, to a person or a group of persons acting in concert (other than a subsidiary or subsidiaries of Prestige), (ii) the transfer (in one or a series of related transactions) of the outstanding equity securities (including (A) any equity securities issued to Apollo upon exercise of the Apollo stock options and (B) any equity securities issued to the Non-Apollo Holders upon exercise of the Non-Apollo Holder stock options) to one person or a group of persons acting in concert, or (iii) the merger or consolidation of Prestige with or into another person, in the case of clauses (ii) and (iii) above, under circumstances in which (x) the holders of a majority of the voting power of the outstanding equity securities of Prestige immediately prior to such transaction (collectively, the “Majority Holder”) own less than a majority in voting power of the outstanding equity securities of Prestige or equity securities of the surviving or resulting person or acquirer, as the case may be, immediately following such transaction and (y) immediately following such transaction, a person (other than the Majority Holder) owns at least a majority in voting power of the outstanding equity securities of Prestige or equity securities of the surviving or resulting person or acquirer, as the case may be. A sale (or multiple related sales) of one or more subsidiaries of Prestige (whether by way of merger, consolidation, reorganization or sale of all or substantially all assets or securities) which constitutes all or substantially all of the consolidated assets of Prestige will be deemed a “Sale of the Company.” For the avoidance of doubt, an underwritten public offering of the securities of Prestige or any of its subsidiaries shall in no event constitute a “Sale of the Company.”
Subject to any accelerated vesting that may apply in the circumstances in connection with certain terminations of employment, as detailed above, unvested options are generally forfeited and immediately terminate upon a termination of employment.
The following table summarizes the approximate value of the termination payments and benefits that each of our named executive officers would receive if he had terminated employment at the close of business on December 31, 2013. The table does not include certain amounts that the named executive officer would be entitled to receive under certain plans or arrangements that do not discriminate in scope, terms or operation, in favor of our executive officers and that are generally available to all salaried employees.
| Name |
Voluntary termination or Cause |
Death or Disability |
Termination Without Cause or for Good Reason |
Termination Without Cause or for Good Reason Following a Change in Control |
Non-Renewal of an Employment Agreement (2) |
|||||||||||||||
| Frank J. Del Rio |
||||||||||||||||||||
| Severance Payment |
— | — | — | $ | 3,373,600 | — | ||||||||||||||
| Annual Bonus Award |
— | — | $ | 1,597,200 | $ | 3,194,400 | — | |||||||||||||
| Medical Continuation |
— | — | — | 48,436 | — | |||||||||||||||
| Stock Option Acceleration (1) |
— | — | — | — | — | |||||||||||||||
| Jason M. Montague |
||||||||||||||||||||
| Severance Payment |
— | — | $ | 963,200 | $ | 1,000,000 | — | |||||||||||||
| Annual Bonus Award |
— | — | $ | 356,250 | $ | 356,250 | — | |||||||||||||
| Medical Continuation |
— | — | $ | 33,560 | — | — | ||||||||||||||
| Stock Option Acceleration (1) |
— | — | $ | $ | — | |||||||||||||||
| Robert J. Binder |
||||||||||||||||||||
| Severance Payment |
— | — | $ | 600,000 | $ | 1,000,000 | $ | 300,000 | ||||||||||||
| Annual Bonus Award |
— | — | $ | 255,000 | $ | 255,000 | — | |||||||||||||
| Medical Continuation |
— | — | $ | 9,824 | $ | — | $ | 9,824 | ||||||||||||
| Stock Option Acceleration (1) |
— | — | $ | $ | — | |||||||||||||||
| Kunal S. Kamlani |
||||||||||||||||||||
| Severance Payment |
— | — | $ | 1,650,000 | $ | 1,650,000 | — | |||||||||||||
| Annual Bonus Award |
— | — | $ | 750,000 | $ | 750,000 | — | |||||||||||||
| Medical Continuation |
— | — | $ | 33,560 | $ | 33,560 | — | |||||||||||||
| Stock Option Acceleration (1) |
— | — | $ | $ | — | |||||||||||||||
| T. Robin Lindsay |
||||||||||||||||||||
| Severance Payment |
— | — | $ | 963,200 | $ | 1,000,000 | — | |||||||||||||
| Annual Bonus Award |
— | — | $ | 356,250 | $ | 356,250 | — | |||||||||||||
| Medical Continuation |
— | — | $ | 33,560 | — | — | ||||||||||||||
| Stock Option Acceleration (1) |
— | — | $ | $ | — | |||||||||||||||
| (1) | Under the terms of the Prestige option plan, upon a change in control of the Company, each named executive officer’s outstanding options granted under the plan will generally become fully vested and exercisable. Values shown are for outstanding stock options with a per share exercise price below $ , the estimated fair market value of an ordinary share as of December 31, 2013. |
| (2) | This would have been applicable only for Mr. Binder. |
107
Table of Contents
Our non-executive directors who hold a status as an investment professional of Apollo or a partner or senior partner with Apollo do not receive any annual retainer, meeting, committee or chair fees. Additionally, there are no automatic annual equity grants, rather grants are made from time to time as determined by our Board, and the last such grant was in 2010. Except for Mr. Aron, those non-executive directors that do not hold a status of investment professional of Apollo or partner or senior partner with Apollo receive an annual director fee of $50,000 or 5,000 stock options, at their discretion. For so long as Mr. Aron serves as a member of our Board, World Leisure Partners, Inc. will receive a $100,000 annual fee as payment for his service.
The following table sets forth information for compensation earned in fiscal year 2013 by our non-executive directors:
| Name |
Fees Earned or Paid in Cash ($) |
Stock Awards ($) |
Option Awards ($) (1) |
Non-Equity Incentive Plan Compensation ($) |
Change in Pension Value and Deferred Compensation Earnings |
All Other Compensation ($) (4) |
Total ($) | |||||||||||||||||||||
| Adam M. Aron (2) . . . . . . . |
100,000 | — | |
— |
|
— | — | — | 100,000 | |||||||||||||||||||
| Kevin E. Crowe (3). . . . . . |
— | — | — | — | — | — | — | |||||||||||||||||||||
| Russell W. Galbut (3). . . . . |
— | — | 7,653 | — | — | — | 7,653 | |||||||||||||||||||||
| Daniel M. Holtz (2)(3). . . . . .. |
50,000 | — | — | — | — | — | 50,000 | |||||||||||||||||||||
| Steve Martinez (2). . . . . . |
— | — | — | — | — | — | — | |||||||||||||||||||||
| Eric L. Press . . . . . . . . . . . . |
— | — | — | — | — | — | — | |||||||||||||||||||||
| (1) | In the case of Mr. Galbut, this represents the aggregate grant date fair value for options granted to him in 2013, computed in accordance with FASB ASC Topic 718, disregarding any estimates of forfeitures related to service-based vesting conditions. The other non-executive directors did not receive an option grant in 2013. However, the adjustment to their existing performance-based options as described in the section “Long Term Equity Incentive Compensation” resulted in an accounting charge equal to the increase in the fair value of the options as determined for accounting purposes in accordance with ASC 718. |
| (2) | Each of the above directors is a member of the Compensation Committee. |
| (3) | Each of the above directors is a member of the Audit Committee. |
| (4) | All non-executive directors are encouraged to take one cruise each year for product familiarization. The aggregate value of other compensation made available to non-executive directors, including discounts on company cruises, is less than $10,000 per person. |
108
Table of Contents
The outstanding equity awards held by our directors on December 31, 2013 are set forth on the table below:
| Name |
No. of Securities Underlying Unexercised Options (#) Exercisable |
No. of Securities Underlying Unexercised Options (#) Unexercisable |
||||||
| Adam M. Aron |
98,388 | — | ||||||
| Kevin E. Crowe (1) |
15,000 | — | ||||||
| Russell W. Galbut |
33,000 | — | ||||||
| Daniel M. Holtz |
15,000 | — | ||||||
| Steve Martinez (1) |
15,000 | — | ||||||
| Eric L. Press (1) |
15,000 | — | ||||||
| (1) | In the case of Messrs. Crowe, Press and Martinez, the stock options are not granted to the director individually, but are granted to Apollo in recognition of the director’s service on our Board. Although each of Messrs. Crowe, Press, and Martinez may be deemed a beneficial owner of equity interests of the Company beneficially owned by Apollo through Prestige due to his status as an investment professional with Apollo or a partner or senior partner of Apollo, each such person disclaims beneficial ownership of any such shares. |
109
Table of Contents
The following table sets forth information regarding the beneficial ownership of our ordinary shares by:
| • | each person known by us to beneficially own more than 5% of our outstanding ordinary shares; |
| • | each of our named executive officers; |
| • | each of our directors; and |
| • | all directors and named executive officers as a group. |
The percentage of ordinary shares beneficially owned immediately prior to the completion of this offering is based on ordinary shares issued and outstanding as of the date of this prospectus, but without giving effect to the exercise of stock options to acquire ordinary shares in connection with this offering. The percentage of ordinary shares beneficially owned after this offering is based on ordinary shares that will be issued and outstanding upon the completion of this offering (including ordinary shares issued upon the exercise of stock options in connection with this offering). In addition, ordinary shares issuable pursuant to stock options are deemed outstanding for computing the percentage of the person holding such options, but are not outstanding for computing the percentage of any other person. All ordinary shares listed in the table below are entitled to one vote per share, unless otherwise indicated in the notes thereto. Unless otherwise indicated, the address of each person named in the table below is c/o Prestige Cruises International, Inc., 8300 NW 33rd Street, Suite 100, Miami, Florida 33122.
| Name of Beneficial Owner: |
Prior to this Offering | After Giving Effect to this Offering | ||||||||
| Shares Beneficially Owned |
Percentage of Shares Beneficially Owned |
Percent of Shares Beneficially Owned Assuming no Exercise of the Option to Purchase Additional Shares |
Percent of Shares Beneficially Owned Assuming Full Exercise of the Option to Purchase Additional Shares | |||||||
| Apollo Management Holdings, L.P. (1) |
43,797,618 | |||||||||
| Kevin E. Crowe (1)(2) |
— | |||||||||
| Eric L. Press (1)(2) |
— | |||||||||
| Steve Martinez (1)(2) |
— | |||||||||
| Adam M. Aron (1)(3) |
98,388 | |||||||||
| Frank J. Del Rio (4) |
2,628,630 | |||||||||
| Russell W. Galbut (5) |
1,727,217 | |||||||||
| Daniel M. Holtz (6) |
433,382 | |||||||||
| Kunal S. Kamlani (7) |
433,334 | |||||||||
| Jason M. Montague (8) |
179,559 | |||||||||
| Robert J. Binder (9) |
221,389 | |||||||||
| T. Robin Lindsay (10) |
231,197 | |||||||||
| All directors and executive officers as a group (11 persons) |
5,953,096 | |||||||||
| * | Represents beneficial ownership of less than one percent of ordinary shares outstanding. |
| (1) | Represents (i) ownership of capital stock of PCI by AAA Guarantor—Co-Invest VI, L.P. (“AAA Co-Invest VI”), AIF VI Euro Holdings, L.P. (“AIF VI Euro Holdings”), AAA Guarantor—Co-Invest VII, L.P. (“AAA Co-Invest VII”) and AIF VII Euro Holdings, L.P. (“AIF VI Euro Holdings,” and together with AAA Co-Invest VI, AIF VI Euro Holdings and AAA Co-Invest VII, the “Apollo Funds”), and (ii) options to purchase shares of common stock of PCI held by PCI Investco I, Inc., PCI Investco II, Inc., PCI Investco III, Inc., and PCI Investco IV, Inc. (collectively, the “PCI Investco Entities”). The Apollo Funds are affiliates of Apollo and are each managed by affiliates of Apollo Management Holdings, L.P. The general partner of Apollo Management Holdings, L.P. is Apollo Management Holdings GP, LLC. The sole member and manager of |
110
Table of Contents
| Apollo Management Holdings GP, LLC is an affiliate of Apollo. The PCI Investco Entities are affiliates of the Apollo Funds and of Apollo. The number of shares reported as beneficially owned by Apollo Management Holdings, L.P. in the above table includes options to purchase 45,000 shares of common stock of PCI issued to certain affiliates of Apollo Management Holdings, L.P. under the Prestige option plan in connection with board services provided to PCI or its subsidiaries by such affiliates which have vested. The address of each of AAA Co-Invest VI and AAA Co-Invest VII is Trafalgar Court, Les Banques, GY1 3QL, St. Peter Port, Guernsey, Channel Islands. The address of each of AIF VI Euro Holdings and AIF VII Euro Holdings is c/o Walkers Corporate Services Limited, P.O. Box 908-GT, Walker House, 87 Mary Street, George Town, Grand Cayman, KY1-9005. The address of the PCI Investco Entities is c/o Arias, Fabrega & Fabrega, P.H. Plaza 2000 Building, 16th Floor, 50th Street, Panama, Republic of Panama. The address of each of Apollo Management Holdings, L.P. and Apollo Management Holdings GP, LLC is c/o Apollo Management, L.P., 9 West 57th Street, 43rd Floor, New York, New York. |
| (2) | Although each of Messrs. Crowe, Press, and Martinez may be deemed a beneficial owner of ordinary shares of PCI beneficially owned by Apollo due to his status as an investment professional with Apollo or a partner or senior partner of Apollo, each such person disclaims beneficial ownership of any such shares. The address of Messrs. Crowe, Press, and Martinez is c/o Apollo Management, L.P., 9 West 57th Street, New York, New York 10019. |
| (3) | Although Mr. Aron may be deemed a beneficial owner of ordinary shares of PCI beneficially owned by Apollo due to his status as a consultant of Apollo, he disclaims beneficial ownership of any such shares. The address of Mr. Aron is c/o Apollo Management, L.P., 9 West 57th Street, New York, New York 10019. Includes options to purchase 15,000 ordinary shares of PCI issued to Mr. Aron under the Prestige option plan in connection with his service on the boards of directors of PCI and options to purchase 83,388 ordinary shares of PCI issued to World Leisure Partners, Inc., a corporation owned and controlled by Mr. Aron, under the Prestige option plan, all of which have vested. |
| (4) | Includes options to purchase 1,216,216 ordinary shares of PCI issued to Mr. Del Rio under the Prestige option plan, which have vested. |
| (5) | Includes options to purchase 33,000 ordinary shares of PCI issued to Mr. Galbut under the Prestige option plan in connection with his service on the boards of directors of PCI, which have vested. |
| (6) | Includes options to purchase 15,000 ordinary shares of PCI issued to Mr. Holtz under the Prestige option plan in connection with his service on the boards of directors of PCI, which have vested. |
| (7) | Includes options to purchase 433,334 ordinary shares of PCI issued to Mr. Kamlani under the Prestige option plan, which have vested. Does not include options to purchase 66,666 ordinary shares of PCI issued to Mr. Kamlani under the Prestige option plan, which have not vested. |
| (8) | Includes options to purchase 173,383 ordinary shares of PCI issued to Mr. Montague under the Prestige option plan, which have vested. Does not include options to purchase 56,617 ordinary shares of PCI issued to Mr. Montague under the Prestige option plan, which have not vested. |
| (9) | Includes options to purchase 188,333 ordinary shares of PCI issued to Mr. Binder under the Prestige option plan, which have vested. Does not include options to purchase 6,667 ordinary shares of PCI issued to Mr. Binder under the Prestige option plan, which have not vested. |
| (10) | Includes options to purchase 194,959 ordinary shares of PCI issued to Mr. Lindsay under the Prestige option plan, which have vested. Does not include options to purchase 15,041 ordinary shares of PCI issued to Mr. Lindsay under the Prestige option plan, which have not vested. |
111
Table of Contents
CERTAIN RELATIONSHIPS AND RELATED PARTY TRANSACTIONS
Stockholders’ Agreement
On May 18, 2009, we amended and restated our stockholders’ agreement (the “PCI Stockholders’ Agreement”) by and among us, PCI Investco I, Inc., PCI Investco II, Inc., PCI Investco III, Inc., PCI Investco IV, Inc., AIF VI Euro Holdings, L.P., AAA Guarantor—Co-Invest VI, L.P., AIF VII Euro Holdings, L.P., AAA Guarantor—Co-Investor VII, L.P. and our other shareholders from time to time party thereto. The PCI Stockholders’ Agreement governs certain aspects of the relationship between us and our security holders. The PCI Stockholders’ Agreement, among other things, provides for the following:
| • | restricts the ability of certain security holders of Prestige to transfer, assign, sell, gift, pledge, hypothecate or encumber, or otherwise dispose of, Prestige’s ordinary shares or of all or part of the voting power associated with the ordinary shares without prior consent of our Board of Directors; and |
| • | permits those holders of Prestige’s ordinary shares to include their shares in a registration statement filed by Prestige with respect to any offering of ordinary shares by Prestige. |
In addition, we have granted Apollo demand registration rights under the PCI Stockholders’ Agreement. These and the registration rights of our security holders pursuant to the PCI Stockholders’ Agreement are subject to customary cutback provisions, including the requirement that all holders of our ordinary shares will be subject to customary lock-up provisions in connection with their participation in any registered offering.
The PCI Stockholders’ Agreement terminates with respect to all rights or obligations related to Prestige’s ordinary shares upon the earliest to occur of (i) Prestige’s dissolution, (ii) an underwritten public offering of Prestige’s equity securities pursuant to which the aggregate offering price of the equity securities sold in such offering is at least $75 million in gross proceeds (provided, however, that the provision relating to registration rights do not terminate upon the consummation of such an offering), (iii) the transfer of all or substantially all of Prestige’s assets to a person or group other than a subsidiary of Prestige, (iv) the transfer to a person or group of the outstanding equity securities of Prestige, or (v) the merger or consolidation of Prestige with or into another entity; provided that, in the case of clauses (iv) and (v), the holders of a majority of the voting power of Prestige’s outstanding equity securities immediately prior to such transaction own less than a majority in voting power of Prestige’s outstanding equity securities immediately following such transaction, and immediately following such transaction, another person owns at least a majority in voting power of Prestige’s outstanding equity securities. At the time of the consummation of this offering, most provisions in the PCI Stockholders’ Agreement will terminate, other than those relating to the registration rights described above.
Apollo Agreements
Oceania Cruises, Inc. entered into a management agreement with Apollo on April 27, 2007, pursuant to which Apollo provides them with management services. Pursuant to such agreement, Apollo receives an annual management fee equal to either (i) $775,000, for so long as Adam M. Aron serves as a member of our Board or (ii) $875,000, in the event that Mr. Aron ceases to serve as a member of our Board and World Leisure Partners, Inc. no longer receives a $100,000 annual fee as payment for such service. Such fee shall be payable in four equal installments to Apollo. Oceania shall also pay Apollo a fee equal to 1.5% of the total amount of capital contributed from time to time to Oceania or its subsidiaries by Apollo or its affiliates. The management agreement will terminate on April 27, 2017, unless earlier terminated by Apollo or a Change of Control or Qualified IPO (each, as defined in the management agreement) occurs. In the event of a Change of Control or a Qualified IPO by Oceania or its subsidiaries, Oceania shall pay to Apollo a lump sum cash payment equal to the then present value of all then current and future annual fees (based on the annual fee then in effect) assuming the agreement ends on April 27, 2017, unless Apollo beneficially owns less than 20% of Oceania, in which case, no such fee is due. We and Apollo intend to amend the management agreement prior to the consummation of this offering to provide that this offering will constitute a Qualified IPO.
Upon consummation of this offering, Apollo intends to terminate the management agreement, and will receive approximately $ for reimbursement of expenses. Apollo intends not to receive a transaction fee in connection with this offering.
112
Table of Contents
The terms and fees payable to Apollo under the management agreement were determined through arm’s-length negotiations between us and Apollo, and reflect the understanding of Apollo and us of the fair value for such services, based in part on market conditions and what similarly situated companies have paid for similar services. The management agreement contains customary indemnification provisions in favor of Apollo, as well as expense reimbursement provisions with respect to expenses incurred by Apollo in connection with its performance of services thereunder, which will survive termination of the agreement.
Related Party Debt
From 2008 to 2010, we issued an aggregate principal amount of $662.5 million in promissory notes to Apollo and an aggregate principal amount of $32.7 million in promissory notes to certain other shareholders. A portion of the promissory notes, with an aggregate principal amount of $507.8 million, bear interest at a rate of 5% per annum, cumulative, compounding semi-annually (the “5% Notes”). The remaining promissory notes, with an aggregate principal amount of $187.4 million, are non-interest bearing and were only issued to Apollo (the “Non-Interest Bearing Notes”). The promissory notes mature at the earlier of a qualified public offering (as defined in the notes), the sale of Prestige, or on the tenth anniversary of the issue date of the promissory notes.
In conjunction with the issuances of the 5% Notes, we also issued a total of 24.3 million warrants to Apollo and 3.4 million warrants to certain other shareholders to purchase ordinary shares bearing a 5% payment-in-kind dividend rate per annum, with dividends being cumulative, compounding semi-annually and payable in additional warrants. In conjunction with the issuance of the Non-Interest Bearing Notes to Apollo, we issued 4.7 million non-dividend paying warrants to Apollo. The warrants issued in 2008 have an exercise price of $40.02355 and the warrants issued in 2009 and 2010 have an exercise price of $9.25. All such warrants are immediately exercisable and expire at the earlier of a qualified public offering (as defined in the applicable warrant agreement), the sale of Prestige or on the tenth anniversary of the effective date of the warrant agreement. See “Description of Certain Indebtedness—Related Party Debt.”
Related Party Transaction Policy and Procedure
Our management is responsible for the review and approval of all related party transactions. We believe management’s review is fair, in line with industry standards and on similar terms as could have been obtained from an unaffiliated third party. While we do not currently have a written policy for review and approval of related party transactions, we will have such a policy prior to the consummation of this offering.
113
Table of Contents
DESCRIPTION OF CERTAIN INDEBTEDNESS
We summarize below the principal terms of the agreements that govern our Secured Credit Facilities and Regent’s Senior Secured Notes. Our “Secured Credit Facilities” consist of the Oceania Credit Facility, the Oceania Newbuild Financings and the Regent Credit Facility. This summary is not a complete description of all of the terms of the agreements. The agreements contain covenants that, among other things, require us to maintain a minimum level of liquidity, maintain certain other ratios and restrict our ability to pay dividends. We were in compliance with these financial covenants as of September 30, 2013. Our ships are pledged as collateral for our debt.
We have incurred substantial indebtedness, mainly related to the acquisition of our ships, and are highly leveraged with a high level of floating rate debt. As of September 30, 2013 our shareholders’ equity was $36.6 million and as of December 31, 2012 our shareholders’ deficit was $13.3 million.
Third Party Debt
| (in thousands) |
September 30, 2013 |
December 31, 2012 |
||||||
| Oceania Term Loan, First Lien, due 2015 (1) |
$ | — | $ | 231,688 | ||||
| Oceania Term Loan, Second Lien, due 2014 (1) |
— | 4,843 | ||||||
| Oceania Term Loan, Second Lien, due 2015 (1) |
— | 70,157 | ||||||
| Oceania Term Loan, First Lien, due through 2020 |
300,000 | — | ||||||
| Oceania Marina Newbuild Debt, due through 2023 |
424,123 | 446,445 | ||||||
| Oceania Riviera Newbuild Debt, due through 2024 |
471,611 | 471,611 | ||||||
| Regent Term Loan, First Lien, due through 2018 |
296,250 | 296,250 | ||||||
| Regent Senior Secured Notes, due 2019 |
225,000 | 225,000 | ||||||
|
|
|
|
|
|||||
| Total third party debt |
$ | 1,716,984 | $ | 1,745,994 | ||||
|
|
|
|
|
|||||
| (1) | The Oceania First Lien Term Loan and Oceania Second Lien Term Loan were repaid in full with the proceeds of the Oceania Credit Facility on July 2, 2013. As of September 30, 2013, $300.0 million was outstanding under the Oceania Term Loan (as defined below) and $75.0 million in available borrowings under the Oceania Revolving Credit Facility (as defined below). |
Interest expense on third-party debt, including interest rate swaps, was $53.3 million (net of capitalized interest of $0.3 million) and $47.8 million (net of capitalized interest of $1.2 million) for the nine months ended September 30, 2013 and 2012, respectively.
Oceania Credit Facility
On April 27, 2007, our wholly owned subsidiaries Insignia Vessel Acquisition, LLC, Regatta Acquisition, LLC and Nautica Acquisition, LLC (collectively, the “Oceania Borrowers”) and Oceania, as guarantor, entered into a $75.0 million second lien credit agreement (the “Oceania Second Lien Term Loan). As of December 31, 2012, we had $75.0 million outstanding under the Oceania Second Lien Term Loan.
Also on April 27, 2007, the Oceania Borrowers entered into a $340.0 million first lien credit agreement consisting of a $300.0 million term loan (as subsequently amended, the “Oceania First Lien Term Loan”) and a
$40.0 million revolving credit facility (as subsequently amended to $35.0 million, the “Oceania Revolving Credit Facility”). As of December 31, 2012, we had $231.7 million outstanding under the Oceania First Lien Term Loan and $35.0 million in available borrowings under the Oceania Revolving Credit Facility.
On July 2, 2013, Oceania and OCI Finance Corp., as borrowers, entered into a $375.0 million credit agreement (the “Oceania Credit Facility”). The Oceania Credit Facility consists of a $300.0 million term loan
114
Table of Contents
(the “Oceania Term Loan”), which matures on July 2, 2020, and a $75.0 million revolving credit facility (the “Oceania Revolving Credit Facility”) which matures July 2, 2018 and replaces the previous Oceania Revolving Credit Facility. Proceeds from the Oceania Term Loan were used to repay in full the Oceania First Lien Term Loan and Oceania Second Lien Term Loan.
Borrowings under the Oceania Credit Facility bear interest at a rate of LIBOR with a floor of 1.0% plus a margin of 5.75%, and include an original issue discount of 1.0%. Oceania is required to pay a commitment fee for any unused and uncancelled commitments under the Oceania Revolving Credit Facility at an annual rate of up to 0.5%. The Oceania Term Loan requires quarterly payments of principal equal to 0.25% of the original principal amount of the term loan, beginning in December 2013, with the remaining unpaid amount due and payable at maturity. Borrowings under the Oceania Credit Facility are prepayable in whole or in part at any time without penalty, but are subject to a prepayment premium in the event of a refinancing of the term loan within twelve months of the closing date. As of September 30, 2013, we had $300.0 million outstanding under the Oceania Term Loan and $75.0 million in available borrowings under the Oceania Revolving Credit Facility.
Our obligations under the Oceania Credit Facility are guaranteed by Oceania and secured by a first priority security interest in the assets of Oceania, OCI Finance Corp. and the Oceania Borrowers, with certain exceptions. The Oceania Credit Facility contains covenants including requirements to maintain a maximum loan-to value ratio, a minimum interest coverage ratio (applicable only to Oceania’s Revolving Credit Facility, if drawn) and restrictions on our and our subsidiaries’ ability to, among other things, incur additional indebtedness, incur liens on assets, make certain investments, pay dividends or make distributions, enter into certain transactions with affiliates and merge, consolidate or sell certain key assets.
Oceania Newbuild Financings
Riviera Newbuild Debt
On July 18, 2008, Riviera New Build LLC, a wholly owned subsidiary of Oceania, entered into a €409.1 million ($539.0 million) loan facility (the “Riviera Loan”). On April 27, 2012, Oceania took delivery of Riviera. The Riviera Loan matures in April 2024, on the twelfth anniversary of the delivery date of the vessel. The proceeds of the Riviera Loan were used to finance 80% of the construction contract for the Riviera, the settlement of related euro foreign currency hedges and the balance of the export credit agency fee. Riviera New Build LLC’s obligations under the Riviera Loan are guaranteed by Oceania and PCH. The Riviera Loan is also 95% guaranteed by Servizi Assicurativi del Commercio Estero (“SACE”), the official export credit agency of Italy. Oceania is required to make 24 semi-annual principal payments on the loan commencing six months after the draw-down date of April 27, 2012. Borrowings under the Riviera Loan are prepayable in whole or in part without penalty. The interest rate for borrowings under the Riviera Loan is based on six-month LIBOR plus a
115
Table of Contents
margin of 0.55%. However, if a market disruption event (as defined by the lender) occurs, the floating interest rate can be amended to include an adjusted spread. As of September 30, 2013, the all-in interest rate, including an adjusted spread, was 1.17%. The outstanding balance under the Riviera Loan as of September 30, 2013 was $471.6 million. Additionally, PCI issued a $15.0 million letter of credit in 2012 for the benefit of the lenders under the Riviera Loan, which automatically renews each year. Pursuant to the terms of the loan agreement, we anticipate this letter of credit will be released during 2014. PCH guarantees this financing agreement.
Marina Newbuild Debt
On July 18, 2008, Marina New Build LLC, a wholly owned subsidiary of Oceania, entered into a €409.1 million ($535.7 million) loan facility (the “Marina Loan”). On January 19, 2011, Oceania took delivery of Marina. The Marina Loan matures in January 2023, on the twelfth anniversary of the delivery date of the vessel. Similar to the Riviera Loan, the proceeds of the Marina Loan were used to finance 80% of the construction contract for the Marina, the settlement of related euro foreign currency hedges and the balance of the export credit agency fee. Marina New Build LLC’s obligations under the Marina Loan are guaranteed by Oceania and PCH. The Marina Loan is also 95% guaranteed by SACE. Oceania is required to make 24 semi- annual principal payments on the loan commencing six months subsequent to the draw-down date of January 19, 2011.
Borrowings under the Marina Loan are prepayable in whole or in part without penalty. The interest rate for borrowings under the Marina Loan is based on six-month LIBOR plus a margin of 0.55%. However, if a market disruption event (as defined by the lender) occurs, the floating interest rate can be amended to include an adjusted spread. As of September 30, 2013, the all-in interest rate, including an adjusted spread, was 1.10%. The outstanding balance under the Marina Loan as of September 30, 2013 was $424.1 million. Additionally, PCI issued a $15.0 million letter of credit in 2011 for the benefit of the lenders under the Marina Loan, which automatically renews each year. Pursuant to the terms of the loan agreement, we anticipate this letter of credit will be released during 2014. PCH guarantees this financing agreement.
Oceania Newbuild Debt Covenants
The Oceania newbuild loan facilities contain financial covenants, including requirements for OCI to maintain a minimum liquidity balance, and for PCH to maintain a total debt to total adjusted equity ratio, a total debt to EBITDA ratio not to exceed a maximum amount and a minimum EBITDA to debt service ratio on the last day of the calendar year. EBITDA, as defined in the Oceania newbuild loan agreements, includes certain adjustments for purposes of calculating this ratio. PCH is a guarantor of these newbuild loan facilities.
Regent Credit Facility
In August 2012, Regent entered into a $340.0 million credit agreement, consisting of a $300.0 million term loan maturing in December 2018 (the “Regent Term Loan”) and a $40.0 million revolving credit facility maturing August 2017 (the “Regent Revolving Credit Facility” and, together with the Regent Term Loan, the “Regent Credit Facility”). Regent used the proceeds from the borrowings under the Regent Credit Facility to repay the outstanding balances of a previously existing credit facility and for general corporate purposes. The Regent Term Loan requires quarterly payments of principal equal to $0.75 million, beginning in December 2012, with the remaining unpaid amount due and payable at maturity. Borrowings under the Regent Credit Facility are prepayable in whole or in part at any time without premium or penalty, but are subject to a prepayment premium in the event of a refinancing of the term loan within twelve months of February 1, 2013.
Interest on borrowings under the Regent Credit Facility are calculated based upon LIBOR, with a floor of 1.25%, plus an applicable margin. On February 1, 2013, Regent amended the Regent Credit Facility to re-price
116
Table of Contents
the applicable margin on the outstanding balance of the Regent Term Loan to 3.50% for any Eurocurrency Loan (as defined in the Regent Credit Facility) and 2.50% for any ABR Loan (as defined in the Regent Credit Facility). Regent is required to pay a commitment fee for any unused and uncancelled commitments under the Regent Revolving Credit Facility at an annual rate of up to 0.50%. As of September 30, 2013, we had $296.3 million outstanding under the Regent Term Loan and $40.0 million in available borrowings under the Regent Revolving Credit Facility.
Regent’s obligations under the Regent Credit Facility are guaranteed by certain of its affiliates, including its parent companies Classic Cruises, LLC and Classic Cruises II, LLC, as well as certain of its subsidiaries. Regent’s obligations under the Regent Credit Facility are secured by a first priority security interest in the assets of Regent and the guarantors, with certain exceptions. The Regent Credit Facility contains covenants substantially similar to those of the Oceania Credit Facility.
Regent Senior Secured Notes
In May 2011, Regent issued $225.0 million in aggregate principal amount of 9.125% Second-Priority Senior Secured Notes due 2019 through a private placement with registration rights (the “Senior Notes”). The Senior Secured Notes are guaranteed by Regent’s material subsidiaries existing at the time of the notes issuance. The Senior Secured Notes are secured by, among other things, second-priority mortgage liens on Regent’s three passenger cruises ships and a second-priority security interest in all earnings, proceeds of insurance and certain other interests related to those ships, subject to certain exceptions and permitted liens. The liens securing the Senior Secured Notes and the related guarantees are second in priority to the liens on the collateral securing the Regent Credit Facility. Regent used the proceeds from the Senior Secured Notes to pay down previously existing indebtedness. Regent had $225.0 million in aggregate principal amount of the Senior Secured Notes outstanding at September 30, 2013.
Covenants under the Senior Secured Notes include, but are not limited to, limitations on Regent’s ability to incur indebtedness and issue disqualified stock and preferred stock, make restricted payments, pay dividends, enter into transactions with affiliates, sell certain assets, create or incur certain liens, and consolidate, merge, sell, transfer or otherwise dispose of all, or substantially all, of its assets. Interest is payable on the Senior Secured Notes semi-annually on May 15 and November 15 of each year beginning November 2011. Regent may redeem the Senior Secured Notes, in whole or in part, prior to May 15, 2015, at a price equal to 100% of the principal amount thereof plus the make-whole premium described in the notes. Thereafter, Regent may redeem some or all of the Senior Secured Notes at the applicable redemption prices set forth in the notes. Regent may redeem up to 35% of the aggregate principal amount of the Senior Secured Notes on or prior to May 15, 2014 with the net cash proceeds of one or more equity offerings by Regent or its direct or indirect parent companies at a redemption price equal to 109.125% of the aggregate principal amount thereof, plus accrued and unpaid interest, under the conditions set forth in the notes.
Regent Newbuild Financing
On July 31, 2013, Regent entered into a loan agreement providing for borrowings of up to $440.0 million with a syndicate of financial institutions to finance 80% of the construction contract for the Seven Seas Explorer, the settlement of related euro foreign currency hedges and the export credit agency fee. The twelve-year fully amortizing loan requires semi-annual principal and interest payments commencing six months following the draw-down date. Borrowings under this loan agreement will bear interest, at the election of Regent, at either (i) a fixed rate of 3.43% per year, or (ii) 2.80% per year plus six month LIBOR. Regent is required to pay various fees to the lenders under this loan agreement, including a commitment fee of 1.10% per annum on the undrawn loan amount payable semi-annually. Obligations under the loan agreement are guaranteed by Regent and PCH. As of September 30, 2013, no borrowings were outstanding under this loan agreement.
117
Table of Contents
The Regent newbuild loan facility contains financial covenants, including a requirement for SSC to maintain a minimum liquidity balance, and for PCH to maintain a maximum total debt to EBITDA ratio, a total debt to total adjusted equity ratio and a minimum EBITDA to debt service ratio as of the last day of the calendar year. EBITDA, as defined in the Regent newbuild loan agreement, includes certain adjustments for purposes of calculating these ratios. PCH is a guarantor of the Regent newbuild loan facility.
Related Party Debt
| (in thousands) |
September 30, 2013 |
December 31, 2012 |
||||||
| Apollo Term Notes, 5% interest, due April 27, 2017 |
$ | 377,858 | $ | 364,081 | ||||
| Apollo Term Notes, 5% interest, due June 19, 2017 |
68,206 | 65,714 | ||||||
| Apollo Term Notes, non-interest bearing, due January 31, 2018 |
187,431 | 187,431 | ||||||
| Apollo Term Notes, 5% interest, due May 18, 2019 |
62,062 | 59,789 | ||||||
| Non-Apollo Term Notes, 5% interest, due August 1, 2019 |
16,286 | 15,697 | ||||||
| Apollo Term Notes, 5% interest, due December 24, 2019 |
30,122 | 29,020 | ||||||
| Non-Apollo Term Notes, 5% interest, due December 31, 2019 |
13,195 | 12,711 | ||||||
| Apollo Term Notes, 5% interest, due May 6, 2020 |
61,420 | 59,172 | ||||||
| Apollo Term Notes, 5% interest, due October 26, 2020 |
26,739 | 25,764 | ||||||
| Non-Apollo Term Notes, 5% interest, due November 19, 2020 . . . |
9,840 | 9,480 | ||||||
|
|
|
|
|
|||||
| Total related party notes payable |
853,159 | 828,859 | ||||||
| Less: Unamortized discount on related party notes payable |
154,174 | 167,555 | ||||||
|
|
|
|
|
|||||
| Long-term portion of related party debt |
$ | 698,985 | $ | 661,304 | ||||
|
|
|
|
|
|||||
Interest expense on related party notes was $24.3 million and $23.1 million in the nine months ended September 30, 2013 and 2012, respectively, and has been added to long-term related party notes payable in our consolidated balance sheets. Debt discount accretion of $13.4 million and $11.4 million for the nine months ended September 30, 2013 and 2012, respectively, is included in interest expense, net in the consolidated statements of operations. Our related party debt will be restructured and capitalized prior to the consummation of this offering.
In January 2008, we issued an aggregate principal amount of $512.4 million in promissory notes to Apollo. The promissory notes are subordinate to all third-party nontrading debt. A portion of the promissory notes, with an aggregate principal amount of $325.0 million (“5% Notes”), bear interest at a rate of 5% per annum, cumulative, compounding semi-annually. The remaining promissory notes, with an aggregate principal amount of $187.4 million, are non-interest bearing (the “Non-Interest Bearing Notes”). The principal and any interest are due upon note maturity. The promissory notes mature at the earlier of a qualified public offering (as defined in the notes), the sale of Prestige, or on the tenth anniversary of the issue date of the promissory notes.
Also in January 2008, we issued 8.1 million warrants to Apollo to purchase ordinary shares bearing a 5% payment-in-kind dividend rate per annum, with dividends being cumulative, compounding semi-annually, and payable in additional warrants (the “5% Dividend Warrants”). An additional 4.7 million non-dividend paying warrants were also issued to Apollo in January 2008 in conjunction with the issuance of the Non-Interest Bearing Notes. All warrants issued in January 2008 have an exercise price of $40.02355, are immediately exercisable, and expire at the earlier of a qualified public offering (as defined in the warrant agreement), the sale of Prestige, or on the tenth anniversary of the issue date of the warrant agreement.
During 2009 and 2010, we issued an additional 16.2 million 5% Dividend Warrants to Apollo and 3.4 million 5% Dividend Warrants to certain other shareholders in conjunction with the issuance of additional 5% Notes in aggregate principal amounts of $150.0 million to Apollo and $32.7 million to certain other shareholders. The 5% Notes are subordinate to all third-party non-trading debt and bear interest at a rate of
118
Table of Contents
5% per annum, cumulative, compounding semi-annually. The principal and interest are due upon note maturity. The 5% Notes mature at the earlier of a qualified public offering (as defined in the notes), the sale of Prestige or on the tenth anniversary of the effective date of the promissory note. All 5% Dividend Warrants issued in 2009 and 2010 have an exercise price of $9.25, are immediately exercisable and expire at the earlier of a qualified public offering (as defined in the warrant agreement), the sale of Prestige or on the tenth anniversary of the effective date of the warrant agreement.
119
Table of Contents
The following is a summary of the material terms of our capital stock and a brief summary of certain significant provisions of our articles of incorporation and by-laws to be in effect following the consummation of this offering. This description is not complete, and we qualify this description by referring to our articles of incorporation and by-laws, copies of which have been filed as exhibits to the registration statement of which this prospectus forms a part.
General
Our articles of incorporation authorize us to issue 100,000,000 ordinary shares, par value of $0.01 per share. As of the date of this prospectus, we had ordinary shares issued and outstanding.
Ordinary Shares
Each holder of ordinary shares is entitled to, among other things, (i) one vote on all matters submitted to a vote at a general shareholders’ meeting; (ii) share equally in dividends from sources legally available therefor as declared at our annual shareholders’ meeting; (iii) freely inspect the corporate books and records; and (iv) any rights set forth in our articles of incorporation or Panamanian law.
Each holder of ordinary shares is entitled to vote on all matters submitted to a vote at a general shareholders’ meeting, including in connection with the following matters:
| • | any proposed amendment to our articles of incorporation; and |
| • | the sale, transfer or disposition of all or substantially all of our assets. |
Shareholders’ Meetings
General shareholders’ meetings may be ordinary or special. Ordinary meetings occur at least once a year at such place (within or outside of the Republic of Panama), date and hour as shall be fixed by the Board. Special meetings may take place when duly summoned for a specified purpose or purposes.
Ordinary meetings
At ordinary annual meetings of shareholders, the Board is elected and any other issues required by applicable law or our by-laws are approved. No annual ordinary meeting need be held if all actions required by the laws of Panama are taken by written consent in lieu of a meeting. At an ordinary meeting, only such business shall be conducted as shall have been properly brought before the meeting. To be properly brought before an ordinary meeting, business must be specified in the notice of meeting (or any supplement thereto) given by or at the direction of the Board, otherwise properly brought before the meeting by or at the direction of the Board, or otherwise properly brought before the meeting by a shareholder.
Special meetings
Special meetings may be called by the Chairman, the Chief Executive Officer, the President or at least a majority in voting interest of the shareholders. The order of business at each special meeting shall be determined by the chairman of such meeting, but such order of business may be changed by a majority in voting interest of those present in person or by proxy at such meeting and entitled to vote thereat.
Voting required
Resolutions are passed at shareholders’ meetings by the affirmative vote of a majority of those shares entitled to vote at such meeting and present or represented at the meeting.
120
Table of Contents
Notice and location
Notice to convene the ordinary annual meeting or an extraordinary shareholders’ meeting shall be given to each shareholder of record entitled to vote at such meeting not less than 10 nor more than 60 days before the day on which the meeting is to be held, by delivering written notice thereof to each shareholder personally, or by mailing a copy of such notice, postage prepaid, directly to each shareholder at its address as it appears in the records of the Issuer, or by transmitting such notice thereof to each shareholder by facsimile transmission or email or other form of recorded communication.
Quorum
Generally, at each meeting of the shareholders, the holders of a majority of the issued and outstanding shares entitled to vote at such meeting, present in person or represented by proxy, shall constitute a quorum for the transaction of business. In the absence of a quorum, a majority in voting interest of the shareholders present in person or represented by proxy and entitled to vote, or, in the absence of all the shareholders entitled to vote, any officer entitled to preside at, or act as secretary of, such meeting, shall have the power to adjourn the meeting from time to time, until shareholders holding the requisite amount of stock to constitute a quorum shall be present or represented. At any such adjourned meeting at which a quorum shall be present, any business may be transacted which might have been transacted at the meeting as originally called.
Other Shareholder Rights
As a general principle, Panamanian law bars the majority of a corporation’s shareholders from imposing resolutions which violate its articles of incorporation, by-laws or Panamanian law, and grants any shareholder the right to challenge, within 30 days, any shareholders’ resolution that is illegal or that violates its articles of incorporation or by-laws, by requesting the annulment of said resolution and/or the injunction thereof pending judicial decision. Minority shareholders representing at least 5% of all issued and outstanding shares have the right to request a judge to call a shareholders’ meeting and to appoint an independent auditor to examine the corporate accounting books, the background of the company’s incorporation or its operation.
Under Panamanian law, existing shareholders benefit from a pre-emptive subscription right in the event of an authorized capital increase or issuance of new shares against cash contributions.
Listing
We have applied to list our ordinary shares on under the symbol “ .”
Transfer Agent and Registrar
will be appointed as the transfer agent and registrar for our ordinary shares upon completion of this offering.
121
Table of Contents
Summary of Significant Differences between Shareholders’ Rights and Other Corporate Governance Matters Under Panamanian Corporation Law and Delaware Corporation Law
Prestige Cruises International is a Panamanian corporation (“sociedad anónima”). The Panamanian corporation law was originally modeled after the Delaware General Corporation Law. As such, many of the provisions applicable to Panamanian and Delaware corporations are substantially similar, including (1) a director’s fiduciary duties of care and loyalty to the corporation, (2) a lack of limits on the number of terms a person may serve on the board of directors, (3) provisions allowing shareholders to vote by proxy and (4) cumulative voting if provided for in the articles of incorporation. The following table highlights the most significant provisions that materially differ between Panamanian corporation law and Delaware corporation law.
| Panama |
Delaware | |
| Directors | ||
| Conflict of Interest Transactions. Transactions involving a Panamanian corporation and an interested director or officer are initially subject to the approval of the board of directors. At the next shareholders’ meeting, shareholders will have the right to disapprove the board of directors’ decision and to decide to take legal actions against the directors or officers who voted in favor of the transaction. | Conflict of Interest Transactions. Transactions involving a Delaware corporation and an interested director of that corporation are generally permitted if:
(1) the material facts as to the interested director’s relationship or interest are disclosed and a majority of disinterested directors approve the transaction;
(2) the material facts are disclosed as to the interested director’s relationship or interest and the stockholders approve the transaction; or
(3) the transaction is fair to the corporation at the time it is authorized by the board of directors, a committee of the board of directors or the stockholders. | |
| Terms. Panamanian law does not set limits on the length of the terms that a director may serve. Staggered terms are allowed but not required. | Terms. The Delaware General Corporation Law generally provides for a one-year term for directors. However, the directorships may be divided into up to three classes with up to three-year terms, with the years for each class expiring in different years, if permitted by the articles of incorporation, an initial by-law or a by-law adopted by the stockholders. | |
| Number. The board of directors must consist of a minimum of three members, which could be natural persons or legal entities. | Number. The board of directors must consist of a minimum of one member. | |
| Authority to take Actions. A simple majority of the board of directors is necessary and sufficient to take any action on behalf of the board of directors. | Authority to take Actions. The articles of incorporation or by-laws can establish certain actions that require the approval of more than a majority of directors. | |
| Shareholder Meetings and Voting Rights | ||
| Quorum. The quorum for shareholder meetings must be set by the articles of incorporation or the by-laws. If the articles of incorporation and by-laws are silent on the quorum required for meetings, the practice in Panama is to require the presence of the shareholders or their proxies of 51% of the shares issued and outstanding with the right to vote to obtain quorum. | Quorum. For stock corporations, the articles of incorporation or by-laws may specify the number to constitute a quorum, but in no event shall a quorum consist of less than one-third of shares entitled to vote at a meeting. In the absence of such specifications, a majority of shares entitled to vote shall constitute a quorum. | |
| Action by Written Consent. Panamanian law permits shareholder action without formally calling a meeting. | Action by Written Consent. Unless otherwise provided in the articles of incorporation, any action | |
122
Table of Contents
| Panama |
Delaware | |
| required or permitted to be taken at any annual meeting or special meeting of stockholders of a corporation may be taken without a meeting, without prior notice and without a vote, if a consent or consents in writing, setting forth the action to be so taken, is signed by the holders of outstanding shares having not less than the minimum number of votes that would be necessary to authorize or take such action at a meeting at which all shares entitled to vote thereon were present and noted. | ||
| Other Shareholder Rights | ||
| Shareholder Proposals. Shareholders representing 5% of the issued and outstanding capital of the corporation have the right to request a judge to call a general shareholders’ meeting and to propose the matters for vote. | Stockholder Proposals. Delaware law does not specifically grant stockholders the right to bring business before an annual or special meeting. If a Delaware corporation is subject to the SEC’s proxy rules, a stockholder who owns at least $2,000 in market value, or 1% of the corporation’s securities entitled to vote, may propose a matter for a vote at an annual or special meeting in accordance with those rules. | |
| Appraisal Rights. Shareholders of a Panamanian corporation do not have the right to demand payment in cash of the judicially determined fair value of their shares in connection with a merger or consolidation involving the corporation. Nevertheless, in a merger, the majority of shareholders could approve the total or partial distribution of cash, instead of shares, of the surviving entity. | Appraisal Rights. Delaware law affords stockholders in certain cases the right to demand payment in cash of the judicially-determined fair value of their shares in connection with a merger or consolidation involving their corporation. However, no appraisal rights are available if, among other things and subject to certain exceptions, such shares were listed on a national securities exchange or such shares were held of record by more than 2,000 holders. | |
| Shareholder Derivative Actions. Any shareholder, with the consent of the majority of the shareholders, can sue on behalf of the corporation, the directors of the corporation for a breach of their duties of care and loyalty to the corporation or a violation of the law, the articles of incorporation or the by-laws. | Stockholder Derivative Actions. Subject to certain requirements that a stockholder make prior demand on the board of directors or have an excuse not to make such demand, a stockholder may bring a derivative action on behalf of the corporation to enforce the rights of the corporation against officers, directors and third parties. An individual may also commence a class action suit on behalf of himself and other similarly-situated stockholders if the requirements for maintaining a class action under the Delaware General Corporation Law have been met. Subject to equitable principles, a three-year period of limitations generally applies to such stockholder suits against officers and directors. | |
| Inspection of Corporate Records. Shareholders representing at least 5% of the issued and outstanding shares of the corporation have the right to require a judge to appoint an independent auditor to examine the corporate accounting books, the background of the company’s incorporation or its operation. | Inspection of Corporate Records. A stockholder may inspect or obtain copies of a corporation’s stockholder list and its other books and records for any purpose reasonably related to a person’s interest as a stockholder. | |
123
Table of Contents
| Panama |
Delaware | |
| Anti-takeover Provisions | ||
| Panamanian corporations may include in their articles of incorporation or by-laws classified board and super-majority provisions. |
Unless Delaware corporations specifically elect otherwise, Delaware corporations may not enter into a “business combination,” including mergers, sales and leases of assets, issuances of securities and similar transactions, with an “interested stockholder,” or one that beneficially owns 15% or more of a corporation’s voting stock, within three years of such person becoming an interested stockholder unless:
(1) the transaction that will cause the person to become an interested stockholder is approved by the board of directors of the target prior to the transactions;
(2) after the completion of the transaction in which the person becomes an interested stockholder, the interested stockholder holds at least 85% of the voting stock of the corporation not including shares owned by persons who are directors and also officers of interested stockholders and shares owned by specified employee benefit plans; or
(3) after the person becomes an interested stockholder, the business combination is approved by the board of directors of the corporation and holders of at least 66.67% of the outstanding voting stock, excluding shares held by the interested stockholder. | |
| Previously Acquired Rights | ||
| In no event can the vote of the majority shareholders deprive the shareholders of a corporation of previously acquired rights. Panamanian jurisprudence and doctrine has established that the majority shareholders cannot amend the articles of incorporation and deprive minority shareholders of previously acquired rights nor impose upon them an agreement that is contrary to those articles of incorporation.
Once a share is issued, the shareholders become entitled to the rights established in the articles of incorporation and such rights cannot be taken away, diminished nor extinguished without the express consent of the shareholders entitled to such rights. If by amending the articles of incorporation, the rights granted to a class of shareholders is somehow altered or modified to their disadvantage, those shareholders will need to approve the amendment unanimously. |
No comparable provisions exist under Delaware law. | |
124
Table of Contents
SHARES ELIGIBLE FOR FUTURE SALE
Prior to this offering, there has been no public market for our ordinary shares, and no predictions can be made about the effect, if any, that market sales of our ordinary shares or the availability of such ordinary shares for sale will have on the market price prevailing from time to time. Nevertheless, the actual sale of, or the perceived potential for the sale of, our ordinary shares in the public market may have an adverse effect on the market price for the ordinary shares and could impair our ability to raise capital through future sales of our securities. See “Risk Factors—Risk factors related to the offering and to our ordinary shares—The substantial number of ordinary shares that will be eligible for sale in the near future may cause the market price of our ordinary shares to decline.”
Sale of Restricted Shares
Upon completion of this offering, we will have an aggregate of ordinary shares outstanding, excluding shares reserved for issuance upon exercise of options that have been granted under our stock option plans ( of which were exercisable at such date). Of these shares, the ordinary shares to be sold in this offering will be freely tradable without restriction or further registration under the Securities Act, except for any shares which may be acquired by any of our “affiliates” as that term is defined in Rule 144 under the Securities Act, which will be subject to the resale limitations of Rule 144. The remaining ordinary shares outstanding will be restricted securities, as that term is defined in Rule 144, and may in the future be sold without restriction under the Securities Act to the extent permitted by Rule 144 or any applicable exemption under the Securities Act.
Lock-up Agreements
We refer you to “Underwriting—Lock-up Agreements.”
125
Table of Contents
MATERIAL U.S. FEDERAL INCOME TAX CONSIDERATIONS
The following is a discussion of the material U.S. federal income tax considerations relevant to an investment decision by a U.S. Holder or a Non-U.S. Holder, as defined below, with respect to the ordinary shares of the Issuer. The following discussion, in so far as it expresses conclusions as to the application of United States federal income tax consequences of the ownership and disposition of ordinary shares of Prestige, is the opinion of Paul, Weiss, Rifkind, Wharton & Garrison LLP. This discussion does not purport to address the tax consequences of owning our ordinary shares to all categories of investors, some of which (such as financial institutions, regulated investment companies, real estate investment trusts, tax-exempt organizations, insurance companies, U.S. expatriates, persons holding our ordinary shares as part of a hedging, integrated, conversion or constructive sale transaction or a straddle, traders in securities that have elected the mark-to-market method of accounting for their securities, persons liable for alternative minimum tax, pass-through entities and investors therein, persons who own, actually or under applicable constructive ownership rules, 10% or more of our ordinary shares, dealers in securities or currencies and U.S. Holders whose functional currency is not the U.S. dollar) may be subject to special rules. This discussion deals only with holders who purchase ordinary shares in connection with this offering and hold the ordinary shares as a capital asset. Moreover, this discussion is based on laws, regulations and other authorities in effect as of the date of this prospectus, all of which are subject to change, possibly with retroactive effect. You are encouraged to consult your own tax advisors concerning the overall tax consequences arising in your own particular situation under U.S. federal, state, local or foreign law of the ownership of our ordinary shares (including consequences arising under U.S. federal estate and gift tax laws and the recently enacted Medicare contribution tax on certain investment income).
For purposes of this discussion, the term “U.S. Holder” means a beneficial owner of our ordinary shares that is, for U.S. federal income tax purposes, (a) an individual who is a citizen or resident of the United States, (b) a domestic corporation, (c) an estate the income of which is subject to U.S. federal income taxation regardless of its source, or (d) a trust if either (1) a court within the United States is able to exercise primary jurisdiction over the administration of the trust and one or more U.S. persons have the authority to control all substantial decisions of the trust, or (2) the trust has a valid election in effect under applicable Treasury Regulations to be treated as a U.S. person. A beneficial owner of our ordinary shares that, for U.S. federal income tax purposes, is an individual, corporation, estate or trust and is not a U.S. holder is referred to below as a “Non-U.S. Holder.”
If a partnership holds ordinary shares, the tax treatment of a partner in such partnership will generally depend on the status of the partner and upon the activities of the partnership. If you are a partner in such a partnership holding our ordinary shares, you are encouraged to consult your tax advisor.
U.S. Federal Income Taxation of U.S. Holders
Subject to the discussion of the “PFIC” rules below:
Distributions
Any distributions made by us with respect to our ordinary shares to a U.S. Holder will generally constitute dividends taxable as ordinary income to the extent of our current or accumulated earnings and profits, as determined under U.S. federal income tax principles. Distributions in excess of those earnings and profits will be treated first as a nontaxable return of capital to the extent of the U.S. Holder’s tax basis in our ordinary shares (determined on a share-by-share basis), and thereafter as capital gain. Because we are not a U.S. corporation, U.S. Holders that are corporations will not be entitled to claim a dividends-received deduction with respect to any distributions they receive from us. So long as our stock is considered readily tradable on an established securities market in the United States, dividends received by certain non-corporate U.S. Holders should, subject to applicable limitations, qualify as “qualified dividend income” eligible for preferential rates.
Amounts taxable as dividends generally will be treated as income from sources outside the United States and will, depending on your circumstances, be “passive” or “general” income which, in either case, is treated
126
Table of Contents
separately from other types of income for purposes of computing the foreign tax credit allowable to you. However, if (a) we are 50% or more owned, by vote or value, by United States persons and (b) at least 10% of our earnings and profits are attributable to sources within the United States, then for foreign tax credit purposes, a portion of our dividends would be treated as derived from sources within the United States. With respect to any dividend paid for any taxable year, the United States source ratio of our dividends for foreign tax credit purposes would be equal to the portion of our earnings and profits from sources within the U.S. for such taxable year, divided by the total amount of our earnings and profits for such taxable year.
Sale, Exchange or Other Disposition of Ordinary Shares
A U.S. Holder generally will recognize capital gain or loss upon a sale, exchange or other taxable disposition of our ordinary shares in an amount equal to the difference between the amount realized by the U.S. Holder from such disposition and the U.S. Holder’s tax basis in such stock. Capital gain of a non-corporate U.S. Holder is generally taxed at a lower rate than ordinary income where the holder has a holding period greater than one year. Such capital gain or loss will generally be treated as U.S. source income or loss, as applicable, for U.S. foreign tax credit purposes. A U.S. Holder’s ability to deduct capital losses is subject to certain limitations.
PFIC Status
The foregoing discussion assumes that we are not and will not become a “passive foreign investment company,” or “PFIC.”
A non-U.S. corporation generally will be a PFIC in any taxable year in which, after applying the relevant look-through rules with respect to the income and assets of its subsidiaries, either 75% or more of its gross income is “passive income” (generally including (without limitation) dividends, interest, annuities and certain royalties and rents not derived in the active conduct of a business) or the average value of its assets that produce passive income or are held for the production of passive income is at least 50% of the total value of its assets. In determining whether we meet the 50% test, cash is considered a passive asset and the total value of our assets generally will be treated as equal to the sum of the aggregate fair market value of our outstanding stock plus our liabilities. If we own at least 25% (by value) of the stock of another corporation, we will be treated, for purposes of the PFIC tests, as owning our proportionate share of the other corporation’s assets and receiving our proportionate share of the other corporation’s income.
Based on our current and currently anticipated method of operation, we believe that we should not be a PFIC for the 2013 taxable year or for the foreseeable future. However, because PFIC status is determined annually and depends on the composition of a company’s income and assets and the fair market value of its assets, there can be no certainty in this regard.
If we were found to be a PFIC for any taxable year in which a U.S. Holder held ordinary shares, certain adverse U.S. federal income tax consequences could apply to such U.S. Holder, including a re-characterization of any capital gain recognized on a sale or other disposition of ordinary shares as ordinary income, ineligibility for any preferential tax rate otherwise applicable to any “qualified dividend income,” a material increase in the amount of tax that such U.S. Holder would owe and the possible imposition of interest charges, an imposition of tax earlier than would otherwise be imposed and additional tax form filing requirements.
A U.S. Holder owning shares in a PFIC (or a corporation that might become a PFIC) might be able to avoid or mitigate the adverse tax consequences of PFIC status by making certain elections, including “qualified electing fund” (a “QEF”) or “mark-to-market” elections, if deemed appropriate based on guidance provided by its own tax advisor. We will use reasonable efforts to provide any information reasonably requested by a U.S. Holder in order to make such elections.
U.S. Federal Income Taxation of Non-U.S. Holders
Non-U.S. Holders generally will not be subject to U.S. federal income tax or withholding tax on dividends received from us on our ordinary shares unless the income is effectively connected income (and, if an applicable
127
Table of Contents
income tax treaty so provides, the dividends are attributable to a permanent establishment maintained by the Non-U.S. Holder in the United States).
Non-U.S. Holders generally will not be subject to U.S. federal income tax or withholding tax on any gain realized upon the sale, exchange or other disposition of our ordinary shares, unless either:
| • | the gain is effectively connected income (and, if an applicable income tax treaty so provides, the gain is attributable to a permanent establishment maintained by the Non-U.S. Holder in the United States); or |
| • | the Non-U.S. Holder is an individual who is present in the U.S. for 183 days or more during the taxable year of disposition and certain other conditions are met, in which case such gain (net of certain U.S. source losses) generally will be taxed at a 30% rate (unless an applicable income tax treaty provides otherwise). |
Effectively connected income will generally be subject to regular U.S. federal income tax in the same manner as discussed in the section above relating to the taxation of U.S. Holders, under an applicable income tax treaty provides otherwise. In addition, earnings and profits of a corporate Non-U.S. Holder that are attributable to effectively connected income, as determined after allowance for certain adjustments, may be subject to an additional branch profits tax at a rate of 30%, or at a lower rate as may be specified by an applicable income tax treaty.
Backup Withholding and Information Reporting
In general, payments of distributions on our ordinary shares to a noncorporate U.S. Holder, and proceeds of a disposition of our ordinary shares by a noncorporate U.S. Holder, will be subject to U.S. federal income tax information reporting requirements. Such amounts may also be subject to U.S. federal backup withholding tax if you are a noncorporate U.S. Holder and you:
| • | fail to provide us with an accurate taxpayer identification number; |
| • | are notified by the IRS that you have become subject to backup withholding because you previously failed to report all interest or dividends required to be shown on your federal income tax returns; or |
| • | fail to comply with applicable certification requirements. |
A Non-U.S. Holder that receives distributions on our ordinary shares, or sells our ordinary shares through the U.S. office of a broker, or a non-U.S. office of a broker with specified connections to the United States, may be subject to backup withholding and related information reporting unless the Non-U.S. Holder certifies that it is a non-U.S. person, under penalties of perjury, or otherwise establishes an exemption. Backup withholding tax is not an additional tax. You generally may obtain a refund of any amounts withheld under backup withholding rules that exceed your income tax liability by timely filing a refund claim with the IRS.
Tax Return Disclosure Requirement
Certain U.S. Holders (and to the extent provided in IRS guidance, certain Non-U.S. Holders) who hold interests in “specified foreign financial assets” (as defined in Section 6038D of the Code) are generally required to file an IRS Form 8938 as part of their U.S. federal income tax returns with information relating to the asset for each taxable year in which the aggregate value of all such assets exceeds $75,000 at any time during the taxable year or $50,000 on the last day of the taxable year (or such higher dollar amount as prescribed by applicable IRS guidance). “Specified foreign financial assets” generally include, among other assets, financial accounts maintained by foreign financial institutions, and our common shares, unless the shares are held through an account maintained with a financial institution. Substantial penalties may apply to any failure to timely file IRS Form 8938. Additionally, in the event an applicable U.S. Holder (and to the extent provided in IRS guidance, a Non-U.S. Holder) that is required to file IRS Form 8938 does not file such form, the statute of limitations on the assessment and collection of U.S. federal income taxes of such holder for the related tax year may not close until three years after the date that the required information is filed. You should consult your own tax advisors regarding your reporting obligations under this new legislation.
128
Table of Contents
CERTAIN PANAMANIAN TAX CONSEQUENCES
Panama’s income tax regime is based on territoriality principles, which define taxable income only as that revenue which is generated from a source within the Republic of Panama, or for services rendered outside of Panama, but which, by their nature, are intended to directly benefit the local commercial activities of individuals or corporations which operate within its territory. Said taxation principles have governed the Panamanian fiscal regime for decades and have been upheld through judicial and administrative precedent.
Although we are a Panamanian corporation, our income is not generated from sources within the Republic of Panama and is exempt from Panamanian income taxes. Payments of dividends by us are also exempt from dividend taxes. No Panamanian capital gain taxes will apply either on the sale or other disposition of the securities. There are no estate, gift or other taxes imposed by the Panamanian government that would affect a holder of the shares, whether such holder were Panamanian or a national of another country. The tax consequences described in this paragraph will apply to the extent we do not generate income from sources within the Republic of Panama.
There is currently no tax treaty between the United States and Panama. The above summary is based upon statutes, regulations, rulings and court decisions as in effect on the date hereof.
129
Table of Contents
Under the terms and subject to the conditions contained in an underwriting agreement dated , 2014, we have agreed to sell to the underwriters named below, for whom is acting as a representative, the following respective numbers of ordinary shares:
| Name |
Number of Shares | |
| Total |
The underwriting agreement provides that the underwriters’ obligation to purchase ordinary shares depends on the satisfaction of the conditions contained in the underwriting agreement including:
| • | the obligation to purchase all of the ordinary shares offered hereby (other than those ordinary shares covered by their option to purchase additional shares as described below), if any of the shares are purchased; |
| • | the representations and warranties made by us to the underwriters are true; |
| • | there is no material change in our business or the financial markets; and |
| • | we deliver customary closing documents to the underwriters. |
Commissions and Expenses
The following table summarizes the underwriting discounts and commissions we will pay to the underwriters. These amounts are shown assuming both no exercise and full exercise of the underwriters’ option to purchase up to an additional shares. The underwriting fee is the difference between the initial price to the public and the amount the underwriters pay to us for the shares.
| Per Share | Total | |||||||
| Without Over- allotment |
With Over- allotment |
Without Over- allotment |
With Over- allotment | |||||
| Underwriting discounts and commissions paid by us |
||||||||
The representative of the underwriters has advised us that the underwriters propose to offer the ordinary shares directly to the public at the public offering price on the cover of this prospectus and to selected dealers, which may include the underwriters, at such offering price less a selling concession not in excess of $ per share. After the offering, the representative may change the offering price and other selling terms.
The expenses of the offering that are payable by us are estimated to be approximately $ (excluding underwriting discounts and commissions).
Option to Purchase Additional Shares
We have granted the underwriters an option exercisable for 30 days after the date of this prospectus, to purchase, from time to time, in whole or in part, up to an aggregate of shares at the public offering price less underwriting discounts and commissions. This option may be exercised if the underwriters sell more than shares in connection with this offering. To the extent the underwriters exercise this option, each underwriter will be committed, so long as the conditions of the underwriting agreement are satisfied, to purchase a number of additional shares proportionate to that underwriter’s initial commitment as indicated in the preceding table, and we will be obligated to sell the additional shares to the underwriters.
130
Table of Contents
Lock-Up Agreements
We, all of our directors and executive officers and our existing significant shareholders, including Apollo, have agreed that, subject to certain exceptions without the prior written consent of the representative, we and they will not directly or indirectly, (1) offer for sale, sell, pledge, or otherwise dispose of (or enter into any transaction or device that is designed to, or could be expected to, result in the disposition by any person at any time in the future of) any ordinary shares (including, without limitation, ordinary shares that may be deemed to be beneficially owned by us or them in accordance with the rules and regulations of the SEC and ordinary shares that may be issued upon exercise of any options or warrants) or securities convertible into or exercisable or exchangeable for ordinary shares, (2) enter into any swap or other derivatives transaction that transfers to another, in whole or in part, any of the economic consequences of ownership of the ordinary shares, (3) make any demand for or exercise any right or file or cause to be filed a registration statement, including any amendments thereto, with respect to the registration of any ordinary shares or securities convertible, exercisable or exchangeable into ordinary shares or any of our other securities, or (4) publicly disclose the intention to do any of the foregoing for a period of days after the date of this prospectus.
The -day restricted period described in the preceding paragraph will be extended if:
| • | during the last 17 days of the -day restricted period we issue an earnings release or material news or a material event relating to us occurs; or |
| • | prior to the expiration of the -day restricted period, we announce that we will release earnings results during the 16-day period beginning on the last day of the -day period, in which case the restrictions described in the preceding paragraph will continue to apply until the expiration of the 18-day period beginning on the issuance of the earnings release or the announcement of the material news or occurrence of a material event, unless such extension is waived in writing by the representative. |
The representative, in its sole discretion, may release the ordinary shares and other securities subject to the lock-up agreements described above in whole or in part at any time with or without notice. When determining whether or not to release ordinary shares and other securities from lock-up agreements, the representative will consider, among other factors, the holder’s reasons for requesting the release, the number of ordinary shares and other securities for which the release is being requested and market conditions at the time.
Offering Price Determination
Prior to this offering, there has been no public market for our ordinary shares. The initial public offering price will be negotiated between the representative and us. In determining the initial public offering price of our ordinary shares, the representative will consider:
| • | the history and prospects for the industry in which we compete; |
| • | our financial information; |
| • | the ability of our management and our business potential and earning prospects; |
| • | the prevailing securities markets at the time of this offering; and |
| • | the recent market prices of, and the demand for, publicly traded shares of generally comparable companies. |
Indemnification
We have agreed to indemnify the underwriters against certain liabilities, including liabilities under the Securities Act, liabilities arising from breaches of the representations and warranties contained in the underwriting agreement and to contribute to payments that the underwriters may be required to make for these liabilities.
131
Table of Contents
Stabilization, Short Positions and Penalty Bids
The underwriters may engage in stabilizing transactions, short sales and purchases to cover positions created by short sales, and penalty bids or purchases for the purpose of pegging, fixing or maintaining the price of our ordinary shares, in accordance with Regulation M under the Exchange Act.
| • | Stabilizing transactions permit bids to purchase the underlying security so long as the stabilizing bids do not exceed a specified maximum. |
| • | A short position involves a sale by the underwriters of shares in excess of the number of shares the underwriters are obligated to purchase in the offering, which creates the syndicate short position. This short position may be either a covered short position or a naked short position. In a covered short position, the number of shares involved in the sales made by the underwriters in excess of the number of shares they are obligated to purchase is not greater than the number of shares that they may purchase by exercising their option to purchase additional shares. In a naked short position, the number of shares involved is greater than the number of shares in their option to purchase additional shares. The underwriters may close out any short position by either exercising their option to purchase additional shares, in whole or in part, and/or purchasing shares in the open market. In determining the source of shares to close out the short position, the underwriters will consider, among other things, the price of shares available for purchase in the open market as compared to the price at which they may purchase shares through their option to purchase additional shares. A naked short position is more likely to be created if the underwriters are concerned that there could be downward pressure on the price of the shares in the open market after pricing that could adversely affect investors who purchase in the offering. |
| • | Syndicate covering transactions involve purchases of the ordinary shares in the open market after the distribution has been completed in order to cover syndicate short positions. |
| • | Penalty bids permit the representative to reclaim a selling concession from a syndicate member when the ordinary shares originally sold by the syndicate member is purchased in a stabilizing or syndicate covering transaction to cover syndicate short positions. |
These stabilizing transactions, syndicate covering transactions and penalty bids may have the effect of raising or maintaining the market price of our ordinary shares or preventing or retarding a decline in the market price of our ordinary shares. As a result, the price of our ordinary shares may be higher than the price that might otherwise exist in the open market. These transactions may be effected on the or otherwise and, if commenced, may be discontinued at any time.
Neither we, nor any of the underwriters make any representation or prediction as to the direction or magnitude of any effect that the transactions described above may have on the price of the ordinary shares. In addition, neither we, nor any of the underwriters make representation that the underwriters will engage in these stabilizing transactions or that any transaction, once commenced, will not be discontinued without notice.
Electronic Distribution
A prospectus in electronic format may be made available on the Internet sites or through other online services maintained by one or more of the underwriters and/or selling group members participating in this offering, or by their affiliates. In those cases, prospective investors may view offering terms online and, depending upon the particular underwriter or selling group member, prospective investors may be allowed to place orders online. The underwriters may agree with us to allocate a specific number of shares for sale to online brokerage account holders. Any such allocation for online distributions will be made by the underwriters on the same basis as other allocations.
Other than the prospectus in electronic format, the information on any underwriter’s or selling group member’s website and any information contained in any other website maintained by an underwriter or selling
132
Table of Contents
group member is not part of the prospectus or the registration statement of which this prospectus forms a part, has not been approved and/or endorsed by us or any underwriter or selling group member in its capacity as underwriter or selling group member and should not be relied upon by investors.
Stock Exchange
We intend to apply to list our ordinary shares on under the symbol “ .”
Discretionary Sales
The underwriters have informed us that they do not intend to confirm sales to discretionary accounts that exceed 5% of the total number of shares offered by them.
Stamp Taxes
Purchasers of the ordinary shares offered in this prospectus may be required to pay stamp taxes and other charges under the laws and practices of the country of purchase, in addition to the offering price listed on the cover page of this prospectus. Accordingly, we urge you to consult a tax advisor with respect to whether you may be required to pay those taxes or charges, as well as any other tax consequences that may arise under the laws of the country of purchase.
Relationships
The underwriters may in the future perform investment banking and advisory services for us from time to time for which they may in the future receive customary fees and expenses.
European Economic Area
In relation to each member state of the European Economic Area that has implemented the Prospectus Directive (each, a relevant member state), with effect from and including the date on which the Prospectus Directive is implemented in that relevant member state (the relevant implementation date), an offer of securities described in this prospectus may not be made to the public in that relevant member state prior to the publication of a prospectus in relation to the securities that has been approved by the competent authority in that relevant member state or, where appropriate, approved in another relevant member state and notified to the competent authority in that relevant member state, all in accordance with the Prospectus Directive, except that, with effect from and including the relevant implementation date, an offer of securities may be offered to the public in that relevant member state at any time:
| • | to any legal entity that is authorized or regulated to operate in the financial markets or, if not so authorized or regulated, whose corporate purpose is solely to invest in securities or |
| • | to any legal entity that has two or more of (1) an average of at least 250 employees during the last financial year; (2) a total balance sheet of more than €43,000,000 and (3) an annual net turnover of more than €50,000,000, as shown in its last annual or consolidated accounts or |
| • | in any other circumstances that do not require the publication of a prospectus pursuant to Article 3 of the Prospectus Directive. |
Each purchaser of securities described in this prospectus located within a relevant member state will be deemed to have represented, acknowledged and agreed that it is a “qualified investor” within the meaning of Article 2(1)(e) of the Prospectus Directive.
For purposes of this provision, the expression an “offer to the public” in any relevant member state means the communication in any form and by any means of sufficient information on the terms of the offer and the securities to be offered so as to enable an investor to decide to purchase or subscribe the securities, as the
133
Table of Contents
expression may be varied in that member state by any measure implementing the Prospectus Directive in that member state, and the expression “Prospectus Directive” means Directive 2003/71/EC and includes any relevant implementing measure in each relevant member state.
The sellers of the securities have not authorized and do not authorize the making of any offer of securities through any financial intermediary on their behalf, other than offers made by the underwriters with a view to the final placement of the securities as contemplated in this prospectus. Accordingly, no purchaser of the securities, other than the underwriters, is authorized to make any further offer of the securities on behalf of the sellers or the underwriters.
United Kingdom
This prospectus is only being distributed to, and is only directed at, persons in the United Kingdom that are qualified investors within the meaning of Article 2(1)(e) of the Prospectus Directive (“Qualified Investors”) that are also (i) investment professionals falling within Article 19(5) of the Financial Services and Markets Act 2000 (Financial Promotion) Order 2005 (the “Order”) or (ii) high net worth entities, and other persons to whom it may lawfully be communicated, falling within Article 49(2)(a) to (d) of the Order (all such persons together being referred to as “relevant persons”). This prospectus and its contents are confidential and should not be distributed, published or reproduced (in whole or in part) or disclosed by recipients to any other persons in the United Kingdom. Any person in the United Kingdom that is not a relevant person should not act or rely on this document or any of its contents.
134
Table of Contents
We are being represented by Paul, Weiss, Rifkind, Wharton & Garrison LLP, New York, New York, with respect to legal matters of United States federal securities and New York State law. The validity of the common shares offered in this offering and certain legal matters as to Panamanian law will be passed upon for us by Arias, Fabrega & Fabrega.
The financial statements as of December 31, 2012 and 2011 and for each of the three years in the period ended December 31, 2012 included in this prospectus have been so included in reliance on the reports of PricewaterhouseCoopers LLP, an independent registered certified public accounting firm, given on the authority of said firm as experts in auditing and accounting.
We have filed with the SEC a registration statement on Form S-1 under the Securities Act with respect to the ordinary shares offered under this prospectus. This prospectus, which is part of the registration statement, does not contain all of the information set forth in the registration statement and the exhibits to the registration statement. For further information with respect to us and this offering, you should refer to the registration statement and the exhibits filed as a part of the registration statement. If we have made references in this prospectus to any contracts, agreements or other documents and also filed any of those contracts, agreements or other documents as exhibits to the registration statement, you should read the relevant exhibit for a more complete understanding of the document or the matter involved.
Prestige Cruises International is subject to the informational requirements of the Exchange Act. We fulfill our obligations with respect to such requirements by filing periodic reports and other information with the SEC. We intend to furnish our shareholders with annual reports containing consolidated financial statements certified by an independent public accounting firm. The other information we file with the SEC is not part of the registration statement of which this prospectus forms a part. Our reports and other information that we have filed, or may in the future file, with the SEC are not incorporated by reference into and do not constitute part of this prospectus.
You may read and copy any document we have or will file with the SEC at the SEC’s internet website (http://www.sec.gov) or at the Public Reference Room of the SEC located at Room 1580, 100 F Street, N.E., Washington, D.C. 20549 at prescribed rates. You can call the SEC at 1-800-SEC-0330 to obtain information on the operation of the Public Reference Room.
You may obtain copies of this information, including the documents referenced in this prospectus and filed as exhibits to the registration statement of which this prospectus is a part, at no charge by writing or telephoning us at the following address and telephone numbers:
Prestige Cruises International, Inc.
8300 NW 33rd Street, Suite 100
Miami, Florida 33122
Investor Relations
(305) 514-2300
We also maintain internet sites at www.PrestigeCruiseHoldings.com, www.rssc.com and www.oceaniacruises.com. Our websites and the information contained therein or connected thereto will not be deemed to be incorporated into this prospectus or the registration statement of which this prospectus forms a part, and you should not rely on any such information in making your decision whether to purchase our ordinary shares.
135
Table of Contents
INDEX TO CONSOLIDATED FINANCIAL STATEMENTS
F-1
Table of Contents
Report of Independent Registered Certified Public Accounting Firm
To the Board of Directors and Stockholders’ of Prestige Cruises International, Inc.:
In our opinion, the accompanying consolidated balance sheets and the related consolidated statements of operations, comprehensive loss, stockholders’ equity (deficit) and of cash flows present fairly, in all material respects, the financial position of Prestige Cruises International, Inc. and its subsidiaries at December 31, 2012 and 2011, and the results of their operations and their cash flows for each of the three years in the period ended December 31, 2012 in conformity with accounting principles generally accepted in the United States of America. In addition, in our opinion, the financial statement schedules listed in the accompanying index present fairly, in all material respects, the information set forth therein when read in conjunction with the related consolidated financial statements. These financial statements are the responsibility of the Company’s management. Our responsibility is to express an opinion on these financial statements based on our audits. We conducted our audits of these statements in accordance with the standards of the Public Company Accounting Oversight Board (United States). Those standards require that we plan and perform the audit to obtain reasonable assurance about whether the financial statements are free of material misstatement. An audit includes examining, on a test basis, evidence supporting the amounts and disclosures in the financial statements, assessing the accounting principles used and significant estimates made by management, and evaluating the overall financial statement presentation. We believe that our audits provide a reasonable basis for our opinion.
/s/PricewaterhouseCoopers LLP
Miami, Florida
March 26, 2013, except for the effects of loss per share discussed in Note 2 to the consolidated financial statements, as to which the date is January 22, 2014
The accompanying notes are an integral part of these consolidated financial statements.
F-2
Table of Contents
Prestige Cruises International, Inc. and Subsidiaries
December 31, 2012 and 2011
| (in thousands, except number of shares and par value) | 2012 | 2011 | ||||||
| Assets |
||||||||
| Current assets |
||||||||
| Cash and cash equivalents |
$ | 139,556 | $ | 147,212 | ||||
| Restricted cash |
— | 9,877 | ||||||
| Trade and other receivables, net |
15,951 | 30,414 | ||||||
| Inventories |
15,080 | 10,285 | ||||||
| Prepaid expenses |
35,030 | 33,426 | ||||||
| Other current assets |
14,091 | 12,060 | ||||||
|
|
|
|
|
|||||
| Total current assets |
219,708 | 243,274 | ||||||
| Property and equipment, net |
2,035,449 | 1,644,971 | ||||||
| Goodwill |
404,858 | 404,858 | ||||||
| Intangible assets, net |
83,556 | 86,120 | ||||||
| Other long-term assets |
128,539 | 100,358 | ||||||
|
|
|
|
|
|||||
| Total assets |
$ | 2,872,110 | $ | 2,479,581 | ||||
|
|
|
|
|
|||||
| Liabilities and Stockholders’ Deficit |
||||||||
| Current liabilities |
||||||||
| Accounts payable |
$ | 14,252 | $ | 10,119 | ||||
| Accrued expenses |
93,651 | 79,325 | ||||||
| Passenger deposits |
355,385 | 323,705 | ||||||
| Derivative liabilities |
6,245 | 80,474 | ||||||
| Current portion of long-term debt |
17,560 | 22,322 | ||||||
|
|
|
|
|
|||||
| Total current liabilities |
487,093 | 515,945 | ||||||
| Long-term debt |
1,695,656 | 1,328,518 | ||||||
| Related party notes payable |
661,304 | 615,143 | ||||||
| Other long-term liabilities |
41,400 | 29,803 | ||||||
|
|
|
|
|
|||||
| Total liabilities |
2,885,453 | 2,489,409 | ||||||
|
|
|
|
|
|||||
| Commitments and contingencies |
||||||||
| Stockholders’ deficit |
||||||||
| Common stock, $0.01 par value. 100,000,000 shares authorized at 2012 and 2011;13,572,515 and 13,571,598 shares issued and outstanding at 2012 and 2011 |
136 | 136 | ||||||
| Additional paid-in capital, net of subscription receivable |
305,642 | 303,505 | ||||||
| Accumulated deficit |
(258,802 | ) | (256,190 | ) | ||||
| Accumulated other comprehensive loss |
(60,319 | ) | (57,279 | ) | ||||
|
|
|
|
|
|||||
| Total stockholders’ deficit |
(13,343 | ) | (9,828 | ) | ||||
|
|
|
|
|
|||||
| Total liabilities and stockholders’ deficit |
$ | 2,872,110 | $ | 2,479,581 | ||||
|
|
|
|
|
|||||
The accompanying notes are an integral part of these consolidated financial statements.
F-3
Table of Contents
Prestige Cruises International, Inc. and Subsidiaries
Consolidated Statements of Operations
Years Ended December 31, 2012, 2011 and 2010
| (in thousands, except shares and per share data) | 2012 | 2011 | 2010 | |||||||||
| Revenues |
||||||||||||
| Passenger ticket |
$ | 947,071 | $ | 834,868 | $ | 642,068 | ||||||
| Onboard and other |
151,213 | 134,270 | 107,025 | |||||||||
| Charter |
13,737 | — | — | |||||||||
|
|
|
|
|
|
|
|||||||
| Total revenue |
1,112,021 | 969,138 | 749,093 | |||||||||
|
|
|
|
|
|
|
|||||||
| Costs and expenses |
||||||||||||
| Cruise operating expenses |
||||||||||||
| Commissions, transportation and other |
331,254 | 271,527 | 192,285 | |||||||||
| Onboard and other |
40,418 | 36,854 | 28,981 | |||||||||
| Payroll, related and food |
168,594 | 153,754 | 122,801 | |||||||||
| Fuel |
101,685 | 92,921 | 57,913 | |||||||||
| Other ship operating |
95,808 | 86,022 | 68,517 | |||||||||
| Other |
21,968 | 26,305 | 16,085 | |||||||||
|
|
|
|
|
|
|
|||||||
| Total cruise operating expenses |
759,727 | 667,383 | 486,582 | |||||||||
| Selling and administrative |
153,747 | 145,802 | 134,676 | |||||||||
| Depreciation and amortization |
93,003 | 79,269 | 56,606 | |||||||||
|
|
|
|
|
|
|
|||||||
| Total operating expenses |
1,006,477 | 892,454 | 677,864 | |||||||||
|
|
|
|
|
|
|
|||||||
| Operating income |
105,544 | 76,684 | 71,229 | |||||||||
|
|
|
|
|
|
|
|||||||
| Non-operating income (expense) |
||||||||||||
| Interest expense, net of capitalized interest |
(131,651 | ) | (101,560 | ) | (91,325 | ) | ||||||
| Interest income |
752 | 670 | 513 | |||||||||
| Other income (expense) |
22,956 | (45,901 | ) | (42,179 | ) | |||||||
|
|
|
|
|
|
|
|||||||
| Total non-operating expense |
(107,943 | ) | (146,791 | ) | (132,991 | ) | ||||||
|
|
|
|
|
|
|
|||||||
| Loss before income taxes |
(2,399 | ) | (70,107 | ) | (61,762 | ) | ||||||
| Income tax (expense) benefit |
(213 | ) | 335 | (358 | ) | |||||||
|
|
|
|
|
|
|
|||||||
| Net loss |
$ | (2,612 | ) | $ | (69,772 | ) | $ | (62,120 | ) | |||
|
|
|
|
|
|
|
|||||||
| Loss per share |
||||||||||||
| Basic and diluted |
$ | (0.19 | ) | $ | (5.14 | ) | $ | (4.60 | ) | |||
|
|
|
|
|
|
|
|||||||
| Weighted-average shares outstanding |
||||||||||||
| Basic and diluted |
13,571,827 | 13,564,766 | 13,501,572 | |||||||||
|
|
|
|
|
|
|
|||||||
The accompanying notes are an integral part of these consolidated financial statements.
F-4
Table of Contents
Prestige Cruises International, Inc. and Subsidiaries
Consolidated Statements of Comprehensive Loss
Years Ended December 31, 2012, 2011 and 2010
| (in thousands) | 2012 | 2011 | 2010 | |||||||||
| Net loss |
$ | (2,612 | ) | $ | (69,772 | ) | $ | (62,120 | ) | |||
| Other comprehensive income (loss) |
||||||||||||
| (Loss) gain on change in derivative fair value |
(4,600 | ) | 33,980 | (14,705 | ) | |||||||
| Cash flow hedge reclassified into earnings |
1,561 | 1,110 | — | |||||||||
|
|
|
|
|
|
|
|||||||
| Total comprehensive loss |
$ | (5,651 | ) | $ | (34,682 | ) | $ | (76,825 | ) | |||
|
|
|
|
|
|
|
|||||||
The accompanying notes are an integral part of these consolidated financial statements.
F-5
Table of Contents
Prestige Cruises International, Inc. and Subsidiaries
Consolidated Statements of Stockholders’ Equity (Deficit)
Years Ended December 31, 2012, 2011 and 2010
| (in thousands) | Common Stock Par Value |
Additional Paid-in Capital |
Accumulated Deficit |
Accumulated Other Comprehensive Loss |
Total Stockholders’ Equity (Deficit) |
|||||||||||||||
| Balances at December 31, 2009 |
$ | 134 | $ | 221,804 | $ | (124,298 | ) | $ | (77,665 | ) | $ | 19,975 | ||||||||
| Net loss |
— | — | (62,120 | ) | — | (62,120 | ) | |||||||||||||
| Other comprehensive loss |
— | — | — | (14,705 | ) | (14,705 | ) | |||||||||||||
| Apollo funded collateral |
— | 25,000 | — | — | 25,000 | |||||||||||||||
| Warrant issuances |
— | 46,522 | — | — | 46,522 | |||||||||||||||
| Issuance of common stock |
2 | 1,999 | — | — | 2,001 | |||||||||||||||
| Stock subscription receivable |
— | 1,171 | — | — | 1,171 | |||||||||||||||
| Modification of liability awards |
— | 178 | — | — | 178 | |||||||||||||||
| Stock-based compensation |
— | 4,320 | — | — | 4,320 | |||||||||||||||
|
|
|
|
|
|
|
|
|
|
|
|||||||||||
| Balances at December 31, 2010 |
136 | 300,994 | (186,418 | ) | (92,370 | ) | 22,342 | |||||||||||||
| Net loss |
— | — | (69,772 | ) | — | (69,772 | ) | |||||||||||||
| Other comprehensive loss |
— | — | — | 35,090 | 35,090 | |||||||||||||||
| Issuance of common stock |
— | 164 | — | — | 164 | |||||||||||||||
| Stock subscription receivable |
— | 195 | — | — | 195 | |||||||||||||||
| Stock-based compensation |
— | 2,153 | — | — | 2,153 | |||||||||||||||
|
|
|
|
|
|
|
|
|
|
|
|||||||||||
| Balances at December 31, 2011 |
136 | 303,506 | (256,190 | ) | (57,280 | ) | (9,828 | ) | ||||||||||||
| Net loss |
— | — | (2,612 | ) | — | (2,612 | ) | |||||||||||||
| Other comprehensive loss |
— | — | — | (3,039 | ) | (3,039 | ) | |||||||||||||
| Issuance of common stock |
— | 7 | — | — | 7 | |||||||||||||||
| Stock-based compensation |
— | 2,129 | — | — | 2,129 | |||||||||||||||
|
|
|
|
|
|
|
|
|
|
|
|||||||||||
| Balances at December 31, 2012 |
$ | 136 | $ | 305,642 | $ | (258,802 | ) | $ | (60,319 | ) | $ | (13,343 | ) | |||||||
|
|
|
|
|
|
|
|
|
|
|
|||||||||||
The accompanying notes are an integral part of these consolidated financial statements.
F-6
Table of Contents
Prestige Cruises International, Inc. and Subsidiaries
Consolidated Statements of Cash Flows
Years Ended December 31, 2012, 2011 and 2010
| (in thousands) | 2012 | 2011 | 2010 | |||||||||
| Cash flows from operating activities |
||||||||||||
| Net loss |
$ | (2,612 | ) | $ | (69,772 | ) | $ | (62,120 | ) | |||
| Adjustments: |
||||||||||||
| Depreciation and amortization |
91,442 | 78,159 | 56,606 | |||||||||
| Amortization of deferred financing costs |
12,679 | 10,131 | 6,393 | |||||||||
| Amortization of related party debt discount |
15,253 | 12,990 | 10,689 | |||||||||
| Accretion of debt discount |
4,722 | 627 | — | |||||||||
| Loss on early extinguishment of debt |
4,487 | 7,502 | — | |||||||||
| Loss on disposal of property and equipment |
689 | 1,174 | — | |||||||||
| Cash flow hedge reclassified into earnings |
1,561 | 1,110 | — | |||||||||
| Other, net |
87 | (18 | ) | (146 | ) | |||||||
| Unrealized (gain) loss on derivative contracts |
(26,707 | ) | 48,774 | 44,209 | ||||||||
| Stock-based compensation |
2,129 | 2,153 | 4,320 | |||||||||
| Interest expense on related party notes |
30,908 | 29,418 | 25,847 | |||||||||
| Changes in operating assets and liabilities: |
||||||||||||
| Trade and other accounts receivables |
14,198 | 10,151 | (19,588 | ) | ||||||||
| Prepaid expenses and other current assets |
(1,227 | ) | (9,794 | ) | (8,042 | ) | ||||||
| Inventories |
(5,351 | ) | (6,294 | ) | (1,437 | ) | ||||||
| Accounts payable and accrued expenses |
16,784 | 25,781 | (11,459 | ) | ||||||||
| Passenger deposits |
29,026 | 44,225 | 44,494 | |||||||||
|
|
|
|
|
|
|
|||||||
| Net cash provided by operating activities |
188,068 | 186,317 | 89,766 | |||||||||
|
|
|
|
|
|
|
|||||||
| Cash flows from investing activities |
||||||||||||
| Purchases of property and equipment |
(478,962 | ) | (535,531 | ) | (158,836 | ) | ||||||
| Proceeds from leasehold reimbursement - capital lease |
251 | 1,716 | — | |||||||||
| Change in restricted cash |
9,477 | (2,401 | ) | (20,337 | ) | |||||||
| Settlement of derivative liability |
(70,267 | ) | (63,074 | ) | — | |||||||
| Acquisition of intangible assets |
— | (4,443 | ) | — | ||||||||
|
|
|
|
|
|
|
|||||||
| Net cash used in investing activities |
(539,501 | ) | (603,733 | ) | (179,173 | ) | ||||||
|
|
|
|
|
|
|
|||||||
| Cash flows from financing activities |
||||||||||||
| Repayment of bank debt |
(443,830 | ) | (265,619 | ) | (47,313 | ) | ||||||
| Debt related costs |
(31,464 | ) | (33,282 | ) | (4,612 | ) | ||||||
| Proceeds from long-term debt |
835,984 | 760,735 | — | |||||||||
| Change in restricted cash - newbuild letter of credit |
(15,000 | ) | (15,000 | ) | — | |||||||
| Issuance of common stock |
7 | 164 | 32 | |||||||||
| Issuance of related party notes |
— | — | 108,271 | |||||||||
| Proceeds from stock subscription |
— | 195 | 1,365 | |||||||||
| Costs associated with the early extinguishment of debt |
(76 | ) | — | — | ||||||||
| Payments on other financing obligations |
(2,000 | ) | — | — | ||||||||
|
|
|
|
|
|
|
|||||||
| Net cash provided by financing activities |
343,621 | 447,193 | 57,743 | |||||||||
|
|
|
|
|
|
|
|||||||
| Effect of exchange rate changes on cash |
156 | (200 | ) | (539 | ) | |||||||
|
|
|
|
|
|
|
|||||||
| Net (decrease) increase in cash and cash equivalents |
(7,656 | ) | 29,577 | (32,203 | ) | |||||||
| Cash and cash equivalents |
||||||||||||
| Beginning of year |
147,212 | 117,635 | 149,838 | |||||||||
|
|
|
|
|
|
|
|||||||
| End of year |
$ | 139,556 | $ | 147,212 | $ | 117,635 | ||||||
|
|
|
|
|
|
|
|||||||
The accompanying notes are an integral part of these consolidated financial statements.
F-7
Table of Contents
Prestige Cruises International, Inc. and Subsidiaries
Notes to Consolidated Financial Statements
| 1. | General |
Description of Business
The accompanying consolidated financial statements include the accounts of Prestige Cruises International, Inc. (“PCI”) and its wholly owned subsidiaries, Prestige Cruise Holdings, Inc. (“PCH”), Oceania Cruises, Inc. and subsidiaries (“OCI”), and Seven Seas Cruises S. DE R.L. and its subsidiaries (“SSC”), which operate cruise ships with destinations to Scandinavia, Russia, Alaska, the Caribbean, Panama Canal, South America, Europe, the Mediterranean, the Greek Isles, Africa, India, Asia, Canada and New England, Tahiti and the South Pacific, Australia and New Zealand. We are controlled by funds affiliated with Apollo Global Management, LLC (“Apollo”).
Basis for Preparation of Consolidated Financial Statements
Our consolidated financial statements are prepared in accordance with generally accepted accounting principles in the United States of America (“GAAP”). All intercompany balances and transactions have been eliminated in consolidation.
2008 Reorganization
PCI was incorporated in Panama on January 30, 2008 as the new holding company of our business. Prior to the incorporation of PCI, PCH, which was incorporated on June 12, 2002, was the holding company for our business. On January 31, 2008, PCI entered into a transaction that resulted in the shareholders of PCH exchanging their preferred and ordinary shares in PCH for PCI promissory notes, warrants, and ordinary shares, as well as contributing funds of $529 million in exchange for ordinary stock and promissory notes (“2008 Reorganization”). The contribution received from the shareholders was used by PCI to acquire ordinary shares in PCH, and as a result, PCI became the owner of all the capital stock of PCH. The funds contributed to PCH were used to acquire SSC in 2008.
| 2. | Summary of Significant Accounting Policies |
Accounting Policies
We follow accounting standards established by the Financial Accounting Standards Board (“FASB”) in our reporting of financial condition, results of operation, and cash flows. References to GAAP in these footnotes are to the FASB Accounting Standards Codification, sometimes referred to as the Codification or ASC.
Use of Estimates
The preparation of the consolidated financial statements requires management to make a number of estimates and assumptions relating to the reported amount of assets and liabilities and the disclosure of contingent assets and liabilities at the date of the consolidated financial statements and the reported amounts of revenues and expenses during the reporting period. Significant items subject to such estimates and assumptions include the carrying amount of property and equipment, accrued liabilities, intangible assets, goodwill, warrants, derivatives, and stock-based compensation. Actual results could differ from those estimates.
Cash Equivalents
We consider all highly liquid investments with maturities of three months or less when purchased to be cash equivalents.
F-8
Table of Contents
Prestige Cruises International, Inc. and Subsidiaries
Notes to Consolidated Financial Statements
Restricted Cash
As of December 31, 2012 and 2011, restricted cash was $63.7 million and $58.1 million, respectively, of which $63.7 million and $48.3 million, respectively, is classified within other long-term assets. In 2012 and 2011, the balance consisted of $30.0 million and $15.0 million, respectively, of cash collateral for letters of credit issued for the OCI newbuild financing agreements, which will remain in place until the related debt facilities are repaid. The remaining $33.7 million and $33.3 million in 2012 and 2011, respectively, relate to required collateral to secure obligations under the Federal Maritime Commission (“FMC”), certain credit card processing agreements and surety bonds for our sales office located in the United Kingdom. In 2011, current restricted cash of $9.8 million included $5.1 million related to agreements with our credit card service providers that require us to escrow a certain percentage of our passenger deposits and $4.7 million in escrow related to certain passenger deposits made in the United Kingdom.
During 2011, we entered into an agreement with a new credit card service provider. Under the terms of this new agreement, we are required to escrow a certain percentage of our passenger deposits if PCH exceeds certain specified ratios relating to liquidity, long-term debt to EBITDA (as defined in our credit agreement) and fixed coverage charges. As of December 31, 2012 and 2011, we had no funds in escrow under this agreement.
As of December 31, 2012 and 2011, we had outstanding and undrawn letters of credit of $50.0 million and $35.0 million, respectively. These agreements are collateralized by restricted cash and automatically renew each year.
Trade and Other Receivables, Net
As of December 31, 2012 and 2011, trade receivables of $12.4 million and $27.2 million, respectively, consisted of processed credit card transactions in transit of $7.4 million and $8.0 million, respectively, and onboard receivables from concessionaires and passengers of $5.0 million and $5.4 million, respectively. As of December 31, 2011 trade receivables also included owner’s supply receivables of $13.8 million, as described below.
In connection with our previous newbuild agreements, OCI had a provision for certain items for the ships through a separate budget for owner’s supplies as contained in the shipbuilding contracts. A significant portion of the owner’s supply items were ordered in close proximity to the delivery of the ship. The costs of such supplies were included within the overall contract price of the ships, which is included in property and equipment, net. During 2010, we entered into a contract with a third party vendor to act as our representative for the ordering and procurement of certain owner’s supplies. We funded the third party the necessary amount to assist us with the procurement of the owner’s supply items for the ships in 2011 and 2012. The third party obtained reimbursement from the shipyard for our funding of the owner’s supply items and then in turn reimbursed us. As of December 31, 2012 there is no outstanding balance of pre-fundings yet to be reimbursed by the shipyard through our representative. As of December 31, 2011, the outstanding balance of $13.8 million was for the procurement of supplies for our ship, the Riviera, which was delivered in April 2012. The total balance of $13.8 million related to the Riviera was collected in full during 2012.
As of December 31, 2012 and 2011, other receivables totaled $3.8 million and $3.2 million, respectively. The 2012 balance consisted primarily of insurance receivables and warranty claims related to ship repairs made on the Regatta and on the Marina. The 2011 balance consisted primarily of insurance receivables related to ship repairs made on the Regatta and on the Insignia. Also, as of December 31, 2012 and 2011, the allowance for bad debt, which is netted against trade receivables in the consolidated balance sheets, totaled $0.2 million and $0.0 million, respectively.
F-9
Table of Contents
Prestige Cruises International, Inc. and Subsidiaries
Notes to Consolidated Financial Statements
Inventories
Inventories consist of hotel consumables, medical supplies, deck and engine supplies and fuel and oil onboard the vessels and are carried at the lower of cost or market. Cost is determined using the first-in, first-out (“FIFO”) method.
Property and Equipment
Property and equipment are stated at cost less accumulated depreciation. Improvement costs that add value to our ships are capitalized as additions to the ship and depreciated over the lesser of the ships’ remaining service lives or the improvements’ estimated useful lives. The remaining estimated cost and accumulated depreciation (i.e. book value) of replaced or refurbished ship components are written off and any resulting losses are recognized in the consolidated statements of operations.
Depreciation of the ships is computed net of projected residual values ranging from 10-15% using the straight-line method over their original estimated service lives ranging from 20 to 30 years. Depreciation of property and equipment not associated with the ships is computed using the straight-line method over their estimated useful lives of three to five years. Leasehold improvements are depreciated using the straight-line method over the shorter of the lease term or estimated useful life of the asset. Improvement costs that add value to the ships and have a useful life greater than one year are capitalized as additions to the ships and are depreciated over the lesser of the ships’ remaining service lives or the improvements’ estimated useful life. Spare parts for the ships are classified as property and equipment in the consolidated balance sheets. Property under capital lease is initially recorded at the lower of the present value of minimum lease payments or fair value. Depreciation expense attributed to property under capital leases is included within depreciation and amortization expense in the consolidated statements of operations.
Drydock costs are scheduled maintenance activities that require the ships to be taken out of service and are expensed as incurred. Drydocks are required to maintain each vessel’s Class certification and are necessary for our ships to be flagged in a specific country, obtain liability insurance and legally operate as passenger cruise ships. Typical drydock costs include drydock fees and wharfage services provided by the drydock facility, hull inspection and certification related activities, external hull cleaning and painting below the waterline including pressure cleaning and scraping, additional below the waterline work such as maintenance and repairs on propellers and replacement of seals, cleaning and maintenance on holding tanks and sanitary discharge systems, related outside contractor services including travel and related expenses and freight and logistics costs related to drydock activities. Repair and maintenance activities are charged to expense as incurred.
Debt Issuance Costs
Debt issuance costs, primarily loan origination and related fees, are deferred and amortized over the term of the related debt. We recorded $30.5 million, $31.5 million and $4.8 million in debt issuance costs for the years ended December 31, 2012, 2011 and 2010. Debt issuance costs related to ships under construction are not amortized until there is a drawdown on the newbuild debt facility, which coincides with the delivery of the new ship. Drawdowns on these newbuild debt facilities occurred in January 2011 for the Marina and in April 2012 for the Riviera, in conjunction with the delivery of each new ship.
During 2012, in connection with the refinancing of SSC’s first lien credit agreement SSC wrote off $4.4 million in previously recorded deferred financing costs. Approximately $6.1 million of previously recorded deferred financing costs were written off in 2011 in connection with the repayment of the outstanding SSC second lien term loan. These costs are included within other income (expense) in the consolidated statements operations. Refer to Note 5: Debt.
F-10
Table of Contents
Prestige Cruises International, Inc. and Subsidiaries
Notes to Consolidated Financial Statements
Deferred debt issuance costs are amortized to income using the effective interest method and are included net of amortization within other current assets and other long-term assets in the consolidated balance sheets. Amortization expenses related to the deferred debt issuance costs amounted to $12.7 million, $10.2 million and $6.4 million for the years ended December 31, 2012, 2011 and 2010, respectively, and are included in interest expense, net of capitalized interest, in the consolidated statements of operations.
Goodwill
We record goodwill as the excess of the purchase price over the estimated fair value of net assets acquired, including identifiable intangible assets. Goodwill associated with the SSC is attributable to numerous factors, including providing us with entry into the luxury cruise line business with a developed workforce that had knowledge of the luxury cruise business, a fully developed travel agent distribution network, positive past passenger experiences and a developed business plan with proven performance. We assess goodwill for impairment at the “reporting unit level” (“Reporting Unit”) at least annually, and more frequently when events or circumstances dictate.
In 2012, we adopted new authoritative accounting guidance that allows us to first assess qualitative factors to determine whether it is necessary to perform the two-step quantitative goodwill impairment test. We would perform the two-step test if our qualitative assessment determined it is more-likely-than-not that a Reporting Unit’s fair value is less than its carrying amount. We may also elect to bypass the qualitative assessment and proceed directly to step one of the quantitative test. The impairment review for goodwill consists of a two-step process of first determining the fair value of the Reporting Unit and comparing it to the carrying value of the net assets allocated to the Reporting Unit. If the fair value of the Reporting Unit exceeds the carrying value, no further analysis or write-down of goodwill is required. If the fair value of the Reporting Unit is less than the carrying value of its net assets, the implied fair value of the Reporting Unit is allocated to all its underlying assets and liabilities, including both recognized and unrecognized intangible assets, based on their fair value. If necessary, goodwill is then written down to its implied fair value.
Identifiable Intangible Assets
SSC acquired certain intangible assets of which value has been assigned to them based on our estimates. Intangible assets that have an indefinite life are not amortized, but are subject to an annual impairment test, or more frequently, when events or circumstances change.
In 2012, we adopted new authoritative accounting guidance that allows us to first assess qualitative factors to determine whether it is necessary to perform a qualitative analysis prior to the quantitative impairment test for indefinite-lived intangible assets, other than goodwill. If this analysis does not result in a more likely than not conclusion that impairment exists, then no further action is required. The indefinite-life intangible asset quantitative impairment test consists of a comparison of the fair value of the indefinite-life intangible asset with its carrying amount. If the carrying amount exceeds its fair value, an impairment loss is recognized in an amount equal to that excess. If the fair value exceeds its carrying amount, the indefinite-life intangible asset is not considered impaired.
Other intangible assets assigned finite useful lives are amortized on a straight-line basis over their estimated useful lives or based on the assets pattern of cash flows. These assets are reviewed for impairment whenever events or changes in circumstances indicate that the carrying amount of an asset may not be recoverable based on market and operational factors.
F-11
Table of Contents
Prestige Cruises International, Inc. and Subsidiaries
Notes to Consolidated Financial Statements
Derivative and Hedging Activities
We enter into various hedge contracts to manage and limit our exposure to fluctuations in foreign currency exchange rates, interest rates and fuel prices. We record our derivatives as assets and liabilities and recognize these hedges at estimated fair market value. If the derivative does not qualify as a hedge under these guidelines or is not designated as a hedge, changes in the fair market value of the derivative are recognized in other income (expense) in the consolidated statements of operations.
We designate at inception those derivatives which qualify for hedge accounting. The derivative instruments that hedge the variability of cash flows related to forecast transactions are designated as cash flow hedges. For these derivatives, the effective portion of the changes in the fair market value of the hedges are recognized as a component of accumulated other comprehensive loss in the stockholders’ equity section of the consolidated balance sheets and are subsequently reclassified into the same line item as the forecast transaction when it is settled. Any ineffective portion of the changes in the fair market value of the hedge is recognized as a component of other income (expense) in the consolidated statements of operations.
Cash flows for the hedging instruments are classified in the same category as the cash flow from the hedged items. If for any reason hedge accounting is discontinued, then any cash flow subsequent to the date of discontinuance will be classified consistent with the nature of the instrument. To qualify for hedge accounting, the hedging relationship between the hedging instruments and hedged items must be highly effective over a period of time in achieving the offset of changes in cash flows attributable to the hedged risk at the inception date. On an ongoing basis, we assess whether the derivative used in the hedging transactions is highly effective in offsetting changes in cash flow of the hedge item. If it is determined that a derivative is no longer highly effective as a hedge, the change in fair value of the derivative is recognized in earnings immediately and reported in other income (expense) in the consolidated statements of operations.
We review contracts and agreements on a regular basis to determine if embedded derivatives are included in the host contract. Embedded derivatives that meet the criteria for bifurcation are measured at fair value at inception and remeasured each reporting period. The changes in fair value are recognized in earnings and recorded in other income (expense) in the consolidated statements of operations.
Warrants
We account for our warrants in accordance with ASC Topic 480, Distinguishing Liabilities from Equity (“ASC 480”), which requires detachable warrants to be classified as permanent equity, temporary equity, or as assets or liabilities. In general, warrants that either require net-cash settlement or are presumed to require net-cash settlement are recorded as assets and liabilities at fair value and warrants that require settlement in shares are recorded as equity instruments. All of our warrants require settlement in shares and are accounted for as permanent equity. The warrants are recorded at fair value on the issuance date. The fair value of the warrant is determined using a Black-Scholes option pricing model, and is affected by changes in inputs to that model including our stock price, expected stock price, volatility, and contractual term.
Revenue and Expense Recognition
Passenger ticket revenue consists of gross revenue recognized from the sale of passenger tickets net of dilutions, such as shipboard credits and certain included passenger shipboard event costs. Also included is gross revenue for air and related ground transportation.
Onboard and other revenue consists of revenue derived from the sale of goods and services rendered onboard the ships (net of related concessionaire costs), travel insurance (net of related costs), and
F-12
Table of Contents
Prestige Cruises International, Inc. and Subsidiaries
Notes to Consolidated Financial Statements
cancellation fees. Concessionary fees are recognized based on the contractual terms of the various concession agreements. Also included are gross revenues from pre- and post-cruise hotel accommodations, shore excursions, land packages, and related ground transportation.
Certain of our sales include free unlimited shore excursions (“FUSE”) or a free hotel stay or free land package, which have no revenues attributable to them. The costs for FUSE, free hotel stays and free land packages are included in commissions, transportation and other expenses in the consolidated statements of operations.
Charter revenue consists of charter hire fees, net of commissions, to bareboat charter our ship Insignia, to an unrelated party for a period of two years commencing on April 9, 2012. The charter agreement constitutes an operating lease and charter revenue is recognized on a straight-line basis over the charter term.
Cash collected in advance for future cruises is recorded as passenger deposit liabilities. Deposits for sailings traveling more than 12 months in the future are classified as long-term liabilities and included in other long-term liabilities in the consolidated balance sheets. We recognize the revenue associated with these cash collections in the period the sailing occurs. For cruises that occur over multiple periods, the revenue is prorated and recognized ratably in each period based on the overall length of the cruise. Cancellation fee revenues, along with associated commission expenses and travel insurance, if any, are recognized at the time the cancellation occurs when it is both earned and realized.
Other ship operating expense includes port, deck and engine, certain entertainment-related expenses, and hotel consumable expenses. Other expense consists primarily of dry-dock and ship insurance costs.
During 2012, we incurred costs related to unplanned repairs on two of our ships. In connection with these incidents, approximately $1.1 million of insurance recoveries were netted against related costs recorded in other ship operating expense in the consolidated statements of operations. There were no revenues in 2012 related to these incidents as the losses exceeded the insurance recoverable.
During 2011, we incurred costs related to unplanned repairs on two of our ships. In connection with the incidents, approximately $2.0 million of insurance recoveries were netted against related costs recorded in other ship operating expense in the consolidated statements of operations. There were no revenues in 2011 related to this incident as the losses exceeded the insurance recoverable.
Advertising Costs
Advertising costs are expensed as incurred and included in selling and administrative expense in the consolidated statements of operations. Advertising expense amounted to $55.2 million, $58.2 million and $43.2 million for the years ended December 31, 2012, 2011 and 2010, respectively.
F-13
Table of Contents
Prestige Cruises International, Inc. and Subsidiaries
Notes to Consolidated Financial Statements
Loss Per Share
Basic earnings per share is computed by dividing net income by the weighted-average number of shares outstanding during each period. Diluted earnings per share incorporates the incremental shares issuable upon conversion of potentially dilutive shares. A reconciliation between basic and diluted earnings per share was:
| Year ended December 31, | ||||||||||||
| (in thousands, except per share data) | 2012 | 2011 | 2010 | |||||||||
| Net loss |
$ | (2,612 | ) | $ | (69,772 | ) | $ | (62,120 | ) | |||
| Basic and diluted weighted-average shares outstanding |
13,571,827 | 13,564,766 | 13,501,572 | |||||||||
| Basic and diluted loss per share |
$ | (0.19 | ) | $ | (5.14 | ) | $ | (4.60 | ) | |||
There is a year-to-date loss for the years ended December 31, 2012, 2011 and 2010, all potential common shares have been excluded from computation of diluted EPS, because to do so would be antidilutive.
Impairment of Long-Lived Assets
Long-lived assets are reviewed for impairment whenever events or changes in circumstances indicate that the carrying amount of an asset may not be recoverable. The assessment of possible impairment is based on our ability to recover the carrying value of these assets based on our estimate of their undiscounted future cash flows. If estimated future cash flows are less than the carrying value of an asset, an impairment charge is recognized for the difference between the asset’s estimated fair value and its carrying value. We perform our ship impairment reviews on an individual ship basis utilizing an undiscounted cash flow analysis. The principle assumptions used in the undiscounted cash model are projected operating results, including net per diems, net cruise costs, projected occupancy, available passenger days, and projected growth. During 2012, 2011 and 2010 there has been no impairment charges recorded on our long-lived assets.
We believe our estimates and judgments with respect to our ships are reasonable. However, should certain factors or circumstances cause us to revise our estimates of ship service lives, projected residual value or the lives of major improvements, depreciation expense could be materially higher or lower. If circumstances cause us to change our assumptions in making determinations as to whether ship improvements should be capitalized, the amount we expense each year as repair and maintenance costs could increase, partially offset by a decrease in depreciation expense.
Income Taxes
We use the liability method of accounting for income taxes. Under the liability method, deferred tax assets and liabilities are recognized for the estimated future tax consequences attributable to differences between the financial statement carrying amounts of existing assets and liabilities and their respective tax bases. Deferred tax assets and liabilities are measured using enacted tax rates expected to be applied to taxable income in the years in which those temporary differences are expected to be recovered or settled. The effect on deferred tax assets and liabilities of a change in tax rates is recognized in income in the period that includes the enactment date.
Foreign Currency Transactions
Foreign currency transaction gains and losses are recognized upon settlement of foreign currency transactions within other income (expense) in the consolidated statements of operations. In addition, for unsettled foreign currency transactions, gains and losses are recognized for changes between the transaction
F-14
Table of Contents
Prestige Cruises International, Inc. and Subsidiaries
Notes to Consolidated Financial Statements
exchange rates and month-end exchange rates. We recorded net foreign currency transaction losses of $3.6 million, $0.6 million and $0.7 million for the years ended December 31, 2012, 2011 and 2010, respectively.
Stock-Based Employee Compensation
Stock-based compensation expense is measured and recognized at fair value of employee stock option awards. We recognize compensation expense for all share-based compensation awards using the fair value method. Compensation expense for awards is recognized over the awards’ vesting periods.
For liability classified awards we re-measure the fair value of the options at each reporting period until the award is settled. We also estimate the amount of expected forfeitures when calculating compensation cost. If the actual forfeitures that occur are significantly different from the estimate, then we revise our estimates.
The fair value of each stock option grant is estimated on the date of grant using the Black-Scholes option pricing model. The estimated fair value of stock options, less estimated forfeitures, is amortized over the vesting period using the graded-vesting method. The expected volatility is based on a combination of historical volatility for peer companies. The risk-free interest rate is based on U.S. Treasury securities with a remaining term equal to the expected option’s life assumed at the date of grant. The expected term is based on the average of contractual life, vested period of the options, and expected employee exercise behavior. The estimated forfeiture rate represents an estimate which will be revised in subsequent periods if actual forfeitures differ from those estimates.
Segment Reporting
We operate two cruise brands, Oceania Cruises and Regent Seven Seas Cruises. The brands have been aggregated as a single reportable segment based on the similarity of their economic characteristics as well as products and services provided.
Foreign revenues for our cruise brands represent sales generated from outside the U.S. primarily by foreign tour operators and foreign travel agencies. Substantially all of our long-lived assets are located outside of the U.S. and consist principally of our ships.
Passenger ticket revenues for the year ended December 31, which are based on where the reservation originates, were as follows:
| 2012 | 2011 | 2010 | ||||||||||
| United States |
74.7 | % | 76.0 | % | 79.8 | % | ||||||
| Canada |
10.8 | % | 10.8 | % | 9.6 | % | ||||||
| All other countries |
14.5 | % | 13.2 | % | 10.6 | % | ||||||
Contingencies—Litigation
On an ongoing basis, we assess the potential liabilities related to any lawsuits or claims brought against us. While it is typically very difficult to determine, we use our best judgment to determine if it is probable that we will incur an expense related to the settlement or final adjudication of such matters and whether a reasonable estimation of such probable loss, if any, can be made. In assessing probable losses, we take into consideration estimates of the amount of insurance recoveries, if any. We accrue a liability when we believe a loss is probable and the amount of loss can be reasonably estimated. Due to the inherent uncertainties related to the eventual outcome of litigation and potential insurance recoveries, it is possible that certain matters may be resolved for amounts materially different from any provisions or disclosures that we have previously made.
F-15
Table of Contents
Prestige Cruises International, Inc. and Subsidiaries
Notes to Consolidated Financial Statements
Recently Issued Accounting Pronouncements
As of January 1, 2012, we adopted Financial Accounting Standards Board ASU 2011-08, Intangibles—Goodwill and Other (Topic 350). This updated standard allows a company to perform a qualitative analysis prior to its two step impairment test for goodwill. If this analysis does not result in a more likely than not conclusion that impairment exists, then performing the two step impairment test is no longer required. Refer to Note 4: Goodwill and Identifiable Intangible Assets.
As of January 1, 2012, we adopted Financial Accounting Standards Board ASU 2011-05, Presentation of Comprehensive Income (Topic 220). This updated standard has changed the presentation of our financial statements as it required presentation of comprehensive income in either a single continuous statement of comprehensive income or in two separate, but consecutive statements. We have elected to present this information in a separate statement. The adoption did not materially impact our consolidated financial statements.
As of January 1, 2012 we adopted Financial Accounting Standards Board ASU 2011-04, Fair Value Measurement (Topic 820). This standard increased the disclosure requirements for each class of assets and liabilities that is not measured at fair value in the balance sheet, but for which fair value is disclosed within the notes to the financial statements. The adoption did not materially impact our consolidated financial statements. Refer to Note 7: Derivative Instruments, Hedging Activities and Fair value Measurements.
As of January 1, 2012 we adopted Financial Accounting Standards Board ASU 2011-12, Deferral of the Effective Date for Amendments to the Presentation of Reclassification of Items Out of Accumulated Other Comprehensive Income in ASU 2011-05. This standard delays the presentation requirements for reclassifying items out of accumulated other comprehensive income (loss) as noted in Financial Accounting Standards Board ASU 2011-12. The adoption did not materially impact our consolidated financial statements.
In December 2011, the Financial Accounting Standards Board issued ASU 2011-11, Disclosures about Offsetting Assets and Liabilities. It requires an entity to disclose information about offsetting and related arrangements to enable users of its financial statements to understand the effect of those arrangements on its financial position. It will be effective for financial statements issued for fiscal periods beginning on or after January 1, 2013. In 2013, this pronouncement was enhanced by ASU 2013-1. This Update clarifies that ordinary receivables are not within the scope of ASU 2011-11 and it applies only to derivatives, repurchase agreements, reverse purchase agreements and other securities lending transactions. The adoption will not materially impact our consolidated financial statements. Refer to Note 7: Derivative Instruments, Hedging Activities and Fair Value Measurements.
There are no other recently issued accounting pronouncements not yet adopted that we expect to have a material effect on the presentation or disclosure of our future consolidated operating results, cash flows or financial position.
F-16
Table of Contents
Prestige Cruises International, Inc. and Subsidiaries
Notes to Consolidated Financial Statements
| 3. | Property and Equipment, Net |
Property and equipment consists of the following:
| December 31, | ||||||||
| (in thousands) | 2012 | 2011 | ||||||
| Ships |
$ | 2,339,984 | $ | 1,746,353 | ||||
| Ships under construction |
— | 122,794 | ||||||
| Furniture, equipment and other |
17,241 | 15,436 | ||||||
| Less: Accumulated depreciation and amortization |
(321,776 | ) | (239,612 | ) | ||||
|
|
|
|
|
|||||
| Property and equipment, net |
$ | 2,035,449 | $ | 1,644,971 | ||||
|
|
|
|
|
|||||
The decrease in ships under construction and increase in ships assets was due to the delivery of Riviera in April 2012. In addition, for the year ended December 31, 2012, there were approximately $30.8 million of capitalized costs, including ship improvements and refurbishments. Approximately $0.8 million of property and equipment was written-off as disposals. We capitalized interest costs of $1.2 million, $2.8 million, and $7.4 million during 2012, 2011 and 2010, respectively.
In 2012 the delivery of Riviera was delayed. In accordance with our contract, we received liquidating damages of $8.1 million. Of the monies received, $7.8 million was recorded as a reduction of the basis of the ship as there was no identifiable benefit in exchange for the payment. The remainder of the payment was used to reduce actual expenses incurred as a result of the delay.
Depreciation and amortization expense on assets in service amounted to $88.3 million, $75.3 million and $53.8 million for the years ended December 31, 2012, 2011 and 2010, respectively. Repair and maintenance expenses, excluding drydock expenses, were $24.7 million, $20.6 million and $20.7 million for the years ended December 31, 2012, 2011 and 2010, respectively, and are recorded in other ship operating expenses in the consolidated statements of operations. Drydock expenses, recorded within other expenses in the consolidated statements of operations, were $6.8 million, $12.0 million and $6.0 million for the years ended December 31, 2012, 2011 and 2010, respectively.
| 4. | Goodwill and Identifiable Intangible Assets |
Goodwill
In 2012 and 2011, we completed our annual goodwill impairment test and determined there was no impairment. We performed our annual impairment testing as of September 30, 2012. We elected not to perform a qualitative assessment and instead performed the two-step quantitative goodwill impairment test. Based on the discounted cash flow model, we determined that the fair value of the Reporting Unit exceeded the carrying value and is therefore not impaired. The principal assumptions used in our cash flow model related to forecasting future operating results, includes discount rate, net revenue yields, net cruise costs including fuel prices, capacity changes, weighted-average cost of capital for comparable publicly-traded companies and terminal values, which are all considered Level 3 inputs. Cash flows were calculated using our 2012 projected operating results as a base. To that base we added projected future years’ cash flows, considering the macro-economic factors and internal occupancy level projections, cost structure and other variables. We discounted the projected future years’ cash flows using a rate equivalent to our weighted-average cost of capital.
The estimation of fair value utilizing discounted expected future cash flows includes numerous uncertainties which require significant judgments when making assumptions of expected revenues, operating costs,
F-17
Table of Contents
Prestige Cruises International, Inc. and Subsidiaries
Notes to Consolidated Financial Statements
selling and administrative expenses, capital expenditures, as well as assumptions regarding the cruise vacation industry competition and business conditions, among other factors. It is reasonably possible that changes in our assumptions and projected operating results above could lead to impairment of our goodwill. There were no triggering events that occurred between our impairment testing date and reporting date.
Identifiable Intangible Assets
In 2008, SSC recorded identifiable intangible assets consisting of trade names, customer relationships, noncompetition agreements, backlog and customer database. The trade names we acquired in our 2008 acquisition of SSC, “Seven Seas Cruises” and “Luxury Goes Exploring,” were determined to have indefinite lives.
In 2011, SSC amended its agreement with Regent Hospitality Worldwide, which granted it exclusive and perpetual licensing rights to use the “Regent” trade name and trademarks (“Regent licensing rights”) in conjunction with cruises, subject to the terms and conditions stated in the agreement. The original 10 year license agreement to use the “Regent” trade name and trademarks was originally accounted for as an operating lease and is exclusive from the acquired trade names of “Seven Seas Cruises” and “Luxury Goes Exploring.”
The Regent licensing rights required an immediate payment of $5.1 million and deferred payments of $4.0 million over two years. The immediate payment of $5.1 million included payment for accrued royalty fees under the previous agreement. The payment was applied first to the liability for previously owed royalty fees with the remainder applied to the intangible asset and legal fees for $4.5 million. The $4.0 million deferred payments have been recorded net of a discount of $0.6 million relating to the present value of the deferred payments associated with the amended license agreement and are being accreted through February 2013. The resulting $7.9 million intangible asset is being amortized over an estimated useful life of 40 years. The amendment and subsequent capitalization of the Regent licensing rights had no impact on the acquired trade names. As of December 31, 2012, the outstanding balance was $2.0 million, which was paid in February 2013. This liability is recorded in accrued expenses in the accompanying consolidated balance sheets.
Our identifiable intangible assets, except the trade names acquired in the 2008, are subject to amortization over their estimated lives and are reviewed for impairment whenever events or changes in circumstances indicate that the carrying amount of an asset may not be recoverable based on market factors and operational considerations. Identifiable intangible assets not subject to amortization, such as trade names, are reviewed for impairment whenever events or circumstances indicate, but at least annually, by comparing the estimated fair value of the intangible asset with its carrying value.
We elected not to perform a qualitative assessment and instead performed the annual quantitative impairment test of our trade names as of September 30, 2012 using the relief-from-royalty method. The royalty rate used is based on comparable royalty agreements in the tourism and hospitality industry, which was applied to the projected revenue to estimate the royalty savings and discounted to derive the fair value at September 30, 2012. The discount rate used was the same rate used in our goodwill impairment test. Based on the discounted cash flow model, we determined the fair value of our trade names exceeded their carrying value and are therefore not impaired. The estimation of fair value utilizing discounted expected future cash flows includes numerous uncertainties that require significant judgments when developing assumptions of expected revenues, operating costs, selling and administrative expenses, capital expenditures and future impact of competitive forces. It is reasonably possible that changes in our assumptions and projected operating results used in our cash flow model could lead to an impairment of our trade names.
F-18
Table of Contents
Prestige Cruises International, Inc. and Subsidiaries
Notes to Consolidated Financial Statements
As of December 31, 2012 and 2011, the net balance of identifiable intangible assets was $83.6 million and $86.1 million, respectively. The following tables provide information on the gross carrying amounts, accumulated amortization, and net balances of these identifiable intangible assets as of December 31, 2012 and 2011.
| 2012 | ||||||||||||
| (in thousands) | Gross Carrying Amount |
Accumulated Amortization |
Net | |||||||||
| Regent licensing rights |
$ | 7,892 | $ | (361 | ) | $ | 7,531 | |||||
| Customer relationships |
14,205 | (11,640 | ) | 2,565 | ||||||||
|
|
|
|
|
|
|
|||||||
| 22,097 | (12,001 | ) | 10,096 | |||||||||
| Intangible assets not subject to amortization |
||||||||||||
| Trade names |
73,460 | — | 73,460 | |||||||||
|
|
|
|
|
|
|
|||||||
| $ | 95,557 | $ | (12,001 | ) | $ | 83,556 | ||||||
|
|
|
|
|
|
|
|||||||
| 2011 | ||||||||||||
| (in thousands) | Gross Carrying Amount |
Accumulated Amortization |
Net | |||||||||
| Regent licensing rights |
$ | 7,892 | $ | (164 | ) | $ | 7,728 | |||||
| Customer relationships |
14,205 | (9,273 | ) | 4,932 | ||||||||
|
|
|
|
|
|
|
|||||||
| 22,097 | (9,437 | ) | 12,660 | |||||||||
| Intangible assets not subject to amortization |
||||||||||||
| Trade names |
73,460 | — | 73,460 | |||||||||
|
|
|
|
|
|
|
|||||||
| $ | 95,557 | $ | (9,437 | ) | $ | 86,120 | ||||||
|
|
|
|
|
|
|
|||||||
Intangible amortization expense for the years ended December 31, 2012, 2011 and 2010 was $2.6 million, $2.5 million and $2.4 million, respectively. The following table provides information about the future estimated amortization expense over the next five years for the identifiable intangible assets:
| (in thousands) | ||||
| Years Ending December 31, |
||||
| 2013 |
$ | 2,565 | ||
| 2014 |
395 | |||
| 2015 |
197 | |||
| 2016 |
197 | |||
| 2017 |
197 | |||
|
|
|
|||
| $ | 3,551 | |||
|
|
|
|||
F-19
Table of Contents
Prestige Cruises International, Inc. and Subsidiaries
Notes to Consolidated Financial Statements
| 5. | Debt |
Long-term bank debt and senior secured notes consist of the following:
| December 31, | ||||||||
| (in thousands) | 2012 | 2011 | ||||||
| OCI term loan, first lien, due 2013 |
$ | — | $ | 34,562 | ||||
| OCI term loan, first lien, due 2015 |
231,688 | 231,688 | ||||||
| OCI term loan, second lien, due 2014 |
4,843 | 75,000 | ||||||
| OCI term loan, second lien, due 2015 |
70,157 | — | ||||||
| OCI Marina newbuild debt, due through 2023 |
446,445 | 491,090 | ||||||
| OCI Riviera newbuild debt, due through 2024 |
471,611 | — | ||||||
| SSC term loan, first lien, due 2014 |
— | 293,500 | ||||||
| SSC term loan, first lien, due through 2018 |
296,250 | — | ||||||
| SSC senior secured notes, due 2019 |
225,000 | 225,000 | ||||||
|
|
|
|
|
|||||
| Total debt |
1,745,994 | 1,350,840 | ||||||
| Less: Debt discount |
(32,778 | ) | — | |||||
|
|
|
|
|
|||||
| Carrying value of debt |
1,713,216 | 1,350,840 | ||||||
| Less: Current portion of long-term debt |
(22,322 | ) | (22,322 | ) | ||||
| Plus: Current portion of debt discount |
4,762 | — | ||||||
|
|
|
|
|
|||||
| Long-term portion |
$ | 1,695,656 | $ | 1,328,518 | ||||
|
|
|
|
|
|||||
OCI First Lien Term Loan
During 2012 and 2011, OCI’s first lien term loan had an outstanding principal loan balance of $266.3 million. In March 2011, OCI’s first lien term loan credit agreement was amended. After the amendment, $34.6 million of the outstanding principal balance was due to mature in April 2013 at a rate of LIBOR plus a margin of 2.25% and $231.7 million of the outstanding principal balance was due to mature in April 2015 at a rate of LIBOR plus a margin of 4.75%. The amendment was treated as a modification in accordance with the guidance in ASC 470: Debt, as the terms of the term loan was substantially the same before and after the amendment. Prior existing debt issuance costs and the new debt issuance costs associated with the amendment are being amortized over the life of the new term loan. The next scheduled principal payment for each of the term loans is at maturity. In December 2012, the outstanding term loan principal balance of $34.6 million maturing in April 2013 was repaid. As such, OCI wrote off the entire loan balance and the associated deferred financing costs of $0.1 million, net of accumulated amortization of $0.7 million.
OCI Second Lien Term Loan
In October 2012, OCI’s second lien term loan credit agreement was amended. Of the $75.0 million outstanding principal loan balance due to mature in April 2014, $70.2 million was extended 12 months, to mature in April 2015, at an increased rate of LIBOR plus a margin of 8.75%. The terms governing the remaining outstanding portion of the second lien term loan in the amount of $4.8 million did not change, and it will mature in April 2014 at a rate of LIBOR plus a margin of 5.75%. The next scheduled principal payment for both the amended and nonamended portions of the second lien term loan is at maturity. The amendment was treated as a modification in accordance with the guidance in ASC 470: Debt, as the terms of the term loan were substantially the same before and after the amendment. Prior existing debt issuance costs and the new debt issuance costs are being amortized over the life of the new term loan. If the second lien
F-20
Table of Contents
Prestige Cruises International, Inc. and Subsidiaries
Notes to Consolidated Financial Statements
term loan outstanding principal loan balance is greater than $25.0 million on January 26, 2015, then the total outstanding principal loan balance of the Oceania first lien term loan and the revolving credit facility will become immediately due and payable on that date.
OCI Revolving Credit Facility
OCI’s revolving credit facility of $35.0 million has a rate of LIBOR plus a margin of 4.75% and matures in April 2015. OCI is required to pay a quarterly commitment fee of 0.5% on the aggregate unused and uncanceled commitments under the revolving credit facility. At December 31, 2012 and 2011, the total undrawn amount available under the revolving credit facility was $35.0 million.
In December 2011, the outstanding balance of $12.7 million for the converted revolver fixed term loan maturing in April 2012 was repaid. This was recorded as an extinguishment of debt and the entire liability and the associated unamortized deferred financing costs of $0.1 million were written off.
OCI Newbuild Financing
On April 27, 2012, OCI took delivery of Riviera and financed $539.0 million. This loan facility included funds to cover 80% of the price of the ship, the settlement of the associated euro foreign currency hedges and the balance of the export credit agency fee. The newbuild loan facility is 95% guaranteed by Servizi Assicurativi del Commercio Estero (“SACE”), the official export credit agency of Italy. OCI is required to make 24 semi-annual principal payments on the loan commencing six months subsequent to the draw-down date of April 27, 2012. The loan facility is based on six-month LIBOR plus a margin of 0.55%. However, if a market disruption event occurs as defined by the lender, the floating interest rate can be amended to include an adjusted spread. As of December 31, 2012 the all-in interest rate, including an adjusted spread, was 1.47%. The annual effective interest rate was 2.46%. In December 2012, OCI prepaid $44.9 million for the principal payments due in April and October 2013. The outstanding balance as of December 31, 2012 was $471.6 million. Associated with the Riviera newbuild loan facility, PCI issued a $15.0 million Letter of Credit in 2012, which was issued for the benefit of the lenders and automatically renews each year. PCH guarantees this financing arrangement.
During 2012, the floating interest rate on the Riviera newbuild loan facility was amended to include an adjusted spread calculation that references the USD/EUR basis swap index and the IBOXX Euro Average, which is capped at 1%. In accordance with ASC 815-15-20, we evaluated the characteristics of the adjusted spread and determined that it met the criteria of an embedded derivative as defined by the codification. We determined that this embedded derivative feature required bifurcation from its host contract in accordance with ASC 815, Derivatives and Hedging. At inception, the bifurcation of the embedded derivative from the loan agreement resulted in a discount to the face value of the loan agreement of approximately $17.5 million, which is being amortized to interest expense over the life of the loan agreement under the effective interest method. The fair value of the embedded derivative as of December 31, 2012 is $10.5 million. Debt discount accretion was $1.7 million for the year ended December 31, 2012.
On January 19, 2011, OCI took delivery of Marina and financed $535.7 million. Similar to the newbuild loan facility in place for Riviera, this loan facility included funds to cover 80% of the price of the ship, the settlement of the euro foreign currency hedges and the balance of the export credit agency fee. The newbuild loan facility is 95% guaranteed by SACE. OCI is required to make 24 semi-annual principal payments on the loan commencing six months subsequent to the draw-down date of January 19, 2011. The loan facility is based on six-month LIBOR plus a margin of 0.55%. However, if a market disruption event occurs as defined by the lender, the floating interest rate can be amended to include an adjusted spread. As of December 31, 2012 the all-in interest rate, including an adjusted spread, was 1.97%. The annual effective
F-21
Table of Contents
Prestige Cruises International, Inc. and Subsidiaries
Notes to Consolidated Financial Statements
interest rate was 4.06%. In December 2012, we prepaid $22.3 million for the principal payment due in January 2013. The outstanding balance as of December 31, 2012 and 2011 was $446.4 million and $491.1 million, respectively. Associated with the Marina newbuild loan facility, PCI issued a $15.0 million Letter of Credit in 2011, which was issued for the benefit of the lenders and automatically renews each year. PCH guarantees this financing arrangement.
During 2012, the floating interest rate on the Marina newbuild loan facility was amended to include an adjusted spread calculation that references the USD/EUR basis swap index and the IBOXX Euro Average and is capped at 1%. In accordance with ASC 815-15-20, we evaluated the characteristics of the adjusted spread and determined that it met the criteria of an embedded derivative as defined by the codification. We determined that this embedded derivative feature required bifurcation from its host contract in accordance with ASC 815, Derivatives and Hedging. At inception, the bifurcation of the embedded derivative from the loan agreement resulted in a discount to the face value of the loan agreement of approximately $16.6 million, which is being amortized to interest expense over the life of the loan agreement under the effective interest method. The fair value of the embedded derivative as of December 31, 2012 is $8.6 million. Debt discount accretion was $2.5 million for the year ended December 31, 2012.
SSC Term Loans
In August of 2012, SSC terminated its previously existing $465.0 million credit facility, consisting of both a $425.0 million term loan and a $40.0 million revolving credit facility, with a syndicate of financial institutions. SSC repaid the outstanding loan balance of $293.5 million, accrued interest of $1.0 million and third party fees of $0.1 million. SSC also wrote off approximately $4.4 million of previously recorded deferred financing costs associated with the terminated credit facility. The repayment of the debt met the liability derecognition criteria in ASC Topic 405, Extinguishment of Liabilities, and as such, a loss of $4.5 million on early extinguishment of debt was recorded and is included in other income (expense) in our consolidated statements of operations and within operating activities in our consolidated statements of cash flows.
Concurrent with the termination of the previously existing credit facility, SSC entered into a $340.0 million credit agreement consisting of a $300.0 million term loan and a $40.0 million revolving credit facility with an unrelated syndicate of financial institutions. Borrowings under the term loan and revolving credit facility bear interest at LIBOR with a floor of 1.25% and an applicable margin of either 4.75% or 5.0% based on the Total Senior Secured Bank Leverage Ratio. The margin is currently 5.0%. In addition, SSC is required to pay a commitment fee of either 0.375% or 0.5% based on a loan-to-value ratio and upon the aggregate unused and uncancelled commitments under the revolving credit facility. The current commitment fee is 0.5%. The term loan matures on December 21, 2018, at which time all outstanding amounts under the term loan will be due and payable. The revolving credit facility matures on August 21, 2017, at which time all outstanding amounts under the revolving credit facility will be due and payable. The proceeds from the credit agreement were used to repay the first lien term loan, as discussed above.
The $340.0 million credit agreement included an original issue debt discount of $3.0 million. This amount is recorded as a reduction to the gross debt and is being accreted over the agreement term using the effective interest method. We have presented the debt, net of the original debt discount in our consolidated balance sheets. The discount is not considered an asset separable from the debt and we have allocated the discount to noncurrent long-term debt. Additionally, SSC recorded $6.8 million in debt issuance costs. Deferred debt issuance costs are amortized to income using the effective interest method and are included net of amortization within other current assets and other assets in the accompanying consolidated balance sheets. At December 31, 2012 and 2011, the total undrawn amount available under the revolving credit facility was $40.0 million.
F-22
Table of Contents
Prestige Cruises International, Inc. and Subsidiaries
Notes to Consolidated Financial Statements
SSC Senior Secured Notes
In May 2011, SSC issued $225.0 million of senior secured notes (the “Notes”) at a rate of 9.125% through a private placement with registration rights. The Notes are due on May 15, 2019, with interest payments due semi-annually beginning in November 2011. The net proceeds from the Notes after the initial purchasers’ discount and estimated fees and expenses of $7.4 million, were approximately $217.6 million. SSC used $140.7 million of the proceeds from the offering to repay the second lien term loan, $29.0 million to pay down its first lien term loan and the remainder as unrestricted cash. SSC registered the Notes with the U.S. Securities and Exchange Commission in May 2012. SSC has the ability to redeem the Notes prior to the due date.
Debt Covenants
Our credit agreements contain a number of covenants that impose operating and financial restrictions on us, including requirements under our senior secured credit facilities requiring that we maintain certain liquidity, leverage, coverage, maximum loan-to-value, a minimum interest coverage ratio (applicable only to the SSC revolving credit facility) and similar ratios and restrictions on our and our subsidiaries’ ability to, among other things, pay dividends on or make distributions in respect of our capital stock and sell certain key assets, principally our ships. All debt is collateralized by our ships. As of December 31, 2012, SSC, OCI and PCH are in compliance with all financial covenants.
The newbuild loan facilities contain financial covenants, including a requirement to maintain a total debt to EBITDA ratio not to exceed a maximum amount on the last day of the calendar year. Specifically, as of December 31, 2012, OCI’s total debt to EBITDA (as such terms are defined in the newbuild loan agreement) may not exceed 10 to 1 and PCH’s total debt to EBITDA may not exceed 9.5 to 1. At December 31, 2012, OCI’s total debt to EBITDA ratio was 8.86 to 1 and PCH’s total debt to EBITDA ratio was 7.74 to 1. EBITDA, as defined in the newbuild loan agreement, includes certain adjustments for purposes of calculating the ratio. PCH is a guarantor on these newbuild loan facilities.
If OCI and PCH total debt to EBITDA ratio exceeds the maximum amount allowed, we have the ability to provide cash capital contributions to our subsidiary. The effect of such an infusion, in order to pay down debt, would reduce the total debt to EBITDA ratio for the applicable twelve-month period. We believe that based on our cash on hand and expected future operating cash inflows, we will have sufficient cash flows to fund operations, meet our debt service requirements and have our subsidiaries maintain compliance with the total debt to EBITDA requirement and other financial covenants under our debt agreements over the next twelve-month period.
The following schedule represents the annual maturities of third-party long-term debt:
| (in thousands) | ||||
| Years Ending December 31, |
||||
| 2013 |
$ | 22,322 | ||
| 2014 |
97,402 | |||
| 2015 |
394,405 | |||
| 2016 |
92,560 | |||
| 2017 |
92,560 | |||
| Thereafter |
1,046,745 | |||
|
|
|
|||
| $ | 1,745,994 | |||
|
|
|
|||
F-23
Table of Contents
Prestige Cruises International, Inc. and Subsidiaries
Notes to Consolidated Financial Statements
Interest expense on third-party debt, including interest rate swaps, was $65.9 million (net of capitalized interest of $1.2 million), $46.3 million (net of capitalized interest of $2.8 million) and $48.4 million (net of capitalized interest of $7.4 million) for the years ended December 31, 2012, 2011 and 2010, respectively.
| 6. | Related Party Notes Payable and Warrants |
Initial Issuance
In connection with the 2008 Reorganization, we issued eleven promissory notes to Apollo totaling $512.4 million. The promissory notes are subordinate to all third-party nontrading debt. Eight of the promissory notes for a total of $325.0 million (“5% Notes”), bear interest at a rate of 5% per annum, cumulative, compounding semi-annually. The principal and interest are due upon note maturity. The other three promissory notes for a total of $187.4 million, are non-interest bearing. The eleven promissory notes mature at the earlier of a qualified public offering, the sale of PCI, or on the 10th anniversary of the issue date of the promissory notes. Immediately prior to a sale of PCI or a qualified public offering, some of the accumulated accrued interest on the 5% Notes is subject to cancellation based upon the achievement of specific EBITDA target levels of one of our subsidiaries from 2007 to 2012. The interest cancellation feature is considered an embedded derivative subject to bifurcation and separate accounting in accordance with GAAP. We have not met the EBITDA targets for any of the years and none of the interest has been canceled. Therefore, the value of the interest cancellation feature is immaterial to the consolidated financial statements.
Also in 2008, PCI granted 8.1 million warrants to Apollo to purchase ordinary shares bearing a 5% payment-in-kind (“PIK”) dividend rate per annum, with dividends being cumulative, compounding semi-annually, and payable in additional warrants (“5% Dividend”). An additional 4.7 million non-dividend paying warrants were also granted to Apollo on January 31, 2008. All warrants granted on January 31, 2008 have an exercise price of $40.02355, are immediately exercisable, and expire at the earlier of a qualified public offering, the sale of PCI, or on the 10th anniversary of the issue date of the warrant agreement.
The warrants have been accounted for as equity, as an increase to additional paid-in capital, in accordance with ASC 480. As there were multiple classes of instruments (promissory notes, warrants, and ordinary shares) issued during 2008, the proceeds were allocated to each type of instrument at the investor level based on the relative fair values on the issuance date in accordance with ASC 470 resulting in a discount to the promissory notes.
The value assigned at inception to the promissory notes, warrants, and ordinary shares was $408.1 million, $215.4 million, and $234.7 million, respectively. The discount to the face value of the note was approximately $116.5 million, which is being amortized to interest expense over the ten-year period of the promissory note under the effective interest method. The annual effective interest rates range from 4.19% to 6.75%.
2010 and 2009 Issuances
During 2010 and 2009, we issued promissory notes totaling approximately $83.6 million and $99.2 million, which occurred in conjunction with grants of 5% Dividend warrants to purchase ordinary shares. Each issuance in 2010 and 2009 contain the same terms. The promissory notes are subordinate to all third-party nontrading debt and bear interest at a rate of 5% per annum, cumulative, compounding semi-annually. The principal and interest are due upon note maturity; there is no interest cancellation feature on these promissory notes. The promissory notes mature at the earlier of a qualified public offering, the sale of PCI or on the 10th anniversary of the effective date of the promissory note. All warrants issued in 2010 and 2009 have an exercise price of $9.25, are immediately exercisable and expire at the earlier of a qualified public offering, the sale of PCI or on the 10th anniversary of the effective date of the warrant agreement.
F-24
Table of Contents
Prestige Cruises International, Inc. and Subsidiaries
Notes to Consolidated Financial Statements
The warrants have been accounted for as equity in accordance with ASC 480 and the proceeds were allocated to promissory notes and warrants based on their relative fair values on the issuance date in accordance with ASC 470. The value assigned to each respective warrant issuance was initially recorded as a discount to the face value of the corresponding note with an offsetting increase to additional paid-in capital. The debt discounts are being amortized to interest expense over the ten-year period of the promissory notes under the effective interest method. The annual effective interest rates range from 12.15% to 15.30% in 2012 and 2011. There were no issuances of promissory notes or warrants during 2011 or 2012.
Related party notes payable, including accrued interest, consist of the following:
| December 31, | ||||||||
| (in thousands) | 2012 | 2011 | ||||||
| Apollo term notes, 5% interest, due April 27, 2017 |
$ | 364,081 | $ | 346,538 | ||||
| Apollo term notes, 5% interest, due June 19, 2017 |
65,714 | 62,547 | ||||||
| Apollo term notes, non-interest bearing, due January 31, 2018 |
187,431 | 187,431 | ||||||
| Apollo term notes, 5% interest, due May 18, 2019 |
59,789 | 56,908 | ||||||
| Non Apollo term notes, 5% interest, due August 1, 2019 |
15,697 | 14,941 | ||||||
| Apollo term notes, 5% interest, due December 24, 2019 |
29,020 | 27,622 | ||||||
| Non Apollo term notes, 5% interest, due December 31, 2019 |
12,711 | 12,098 | ||||||
| Apollo term notes, 5% interest, due May 6, 2020 |
59,172 | 56,320 | ||||||
| Apollo term notes, 5% interest, due October 26, 2020 |
25,764 | 24,523 | ||||||
| Non Apollo term notes, 5% interest, due November 19, 2020 |
9,480 | 9,024 | ||||||
|
|
|
|
|
|||||
| 828,859 | 797,952 | |||||||
| Less: Unamortized discount on related party notes payable |
167,555 | 182,809 | ||||||
|
|
|
|
|
|||||
| Long-term portion |
$ | 661,304 | $ | 615,143 | ||||
|
|
|
|
|
|||||
The annual maturities of related party notes payable are due beginning in 2017 and through 2020. There are no financial covenants associated with PCI related party debt.
Interest expense on related party notes was $30.9 million, $29.4 million and $25.8 million in the years ended December 31, 2012, 2011 and 2010, respectively, and has been added to long-term related party notes payable in the accompanying consolidated balance sheets. Debt discount accretion of $15.3 million, $13.0 million and $10.7 million for the years ended December 31, 2012, 2011 and 2010, respectively, is included in interest expense, net in the consolidated statements of operations.
| 7. | Derivative Instruments, Hedging Activities and Fair Value Measurements |
We are exposed to market risks attributable to changes in interest rates, foreign currency exchange rates and fuel prices. We manage these risks through a combination of our normal operating and financing activities and through the use of derivative financial instruments pursuant to our hedging practices and policies as described below. The financial impacts of these hedging instruments are primarily offset by corresponding changes in the underlying exposures being hedged. We achieve this by closely matching the amount, term and conditions of the derivative instrument with the underlying risk being hedged. We do not hold or issue derivative financial instruments for trading or other speculative purposes. Our maximum exposure to counter parties for nonperformance is limited to our mark-to-market exposure.
We monitor our derivative positions using techniques including market valuations and sensitivity analyses. The turbulence in the credit and capital markets has increased the volatility associated with interest rates, foreign currency exchange rates and fuel prices. However, we have taken steps to mitigate these risks such as the interest rate swap agreements, foreign currency swaps/collars, and fuel hedge swap agreements described below.
F-25
Table of Contents
Prestige Cruises International, Inc. and Subsidiaries
Notes to Consolidated Financial Statements
Interest Rate Risk
Our exposure to market risk for changes in interest rates relates to our long-term debt obligations including future interest payments. We use interest rate swap agreements to modify our exposure to interest rate fluctuations and to manage our interest expense.
In July 2011, OCI entered into three forward starting interest rate swap agreements to hedge the variability of the interest payments related to the outstanding variable-rate debt associated with Marina newbuild financing. The first swap, with an amortizing notional amount of $450.0 million at inception, was effective beginning January 19, 2012 and matured on January 19, 2013. The second swap, with an amortizing notional amount of $405.4 million became effective on January 19, 2013 and matures on January 19, 2014. The third swap, with an amortizing notional amount of $360.8 million becomes effective January 19, 2014 and matures on January 19, 2015. All three interest rate swaps are designated as cash-flow hedges and qualify for hedge accounting treatment. The changes in fair value of the effective portion of the interest rate swaps are recorded as a component of accumulated other comprehensive loss on our consolidated balance sheets. There was no ineffectiveness recorded for the year ended December 31, 2012.
During 2008, SSC entered into an interest rate swap agreement with a notional amount of $400.0 million to limit the interest rate exposure related to its long-term debt. This interest rate swap, which matured on February 14, 2011, was designated as a cash flow hedge and the change in fair value of the effective portion of the interest rate swap was recorded as a component of accumulated other comprehensive loss in the accompanying consolidated balance sheets. SSC had no interest rate swaps outstanding as of December 31, 2012 and 2011.
Foreign Currency Exchange Risk
During 2012 and 2011, SSC entered into foreign currency swaps with an aggregate notional amount of €1.8 million ($2.3 million) and €3.9 million ($5.2 million), respectively. During 2012 and 2011, OCI entered into foreign currency swaps with an aggregate notional amount of €1.0 million ($1.3 million) and €23.9 million ($33.7 million), respectively. These foreign currency swaps were used to limit the exposure to foreign currency exchange rates, for euro denominated payments related to a third party shipyard, payments related to OCI newbuild ships, payments related to vessel drydock expenses and other operational expenses. The foreign currency swaps do not qualify for hedge accounting; therefore, the changes in fair values of these foreign currency derivatives are recorded in other income (expense) in the accompanying consolidated statements of operations. There were no outstanding foreign currency swap agreements as of December 31, 2012. The total aggregate notional amount of outstanding foreign currency swap agreements as of December 31, 2011 was €7.6 million ($10.0 million).
During 2008, in connection with the construction of new ships, OCI entered into two foreign currency collars with notional amounts totaling €328.0 million each ($437.5 million each at December 31, 2010) to limit its exposure to foreign currency exchange rates for euro denominated payments due at ship delivery. One collar matured in October 2010 and the second collar matured in August 2011. These instruments were designated as cash flow hedges at inception of the hedge. The change in fair value of the effective portion of the instruments were recorded as a component of accumulated other comprehensive loss in the accompanying consolidated balance sheets. There was no ineffectiveness recorded. The original foreign currency collars relating to Marina and Riviera matured in 2010 and 2011, respectively, and are being reclassified into depreciation expense in the consolidated statements of operations over the estimate useful lives of the ships.
During 2010 and 2011, the delivery dates of OCI’s two newbuild ships were delayed from their original due dates to January 2011 and April 2012, respectively. To effectively hedge OCI’s exposure under the original
F-26
Table of Contents
Prestige Cruises International, Inc. and Subsidiaries
Notes to Consolidated Financial Statements
foreign exchange collars set to mature on the original delivery dates, OCI entered into two foreign currency puts with a maturity at the original delivery dates with notional amounts of €328.0 million each ($437.5 million each at December 31, 2010). During October 2010 and August 2011, the puts matured concurrent with the maturity of the original collars mentioned above. To effectively hedge the foreign currency exposure of the euro denominated payments due at the new delivery dates, OCI entered into two new foreign currency collars with maturity dates in line with the new delivery dates for the Marina and Riviera having notional amounts of €328.0 million each ($424.7 million at December 31, 2011). There was a non-cash loss of approximately $30.0 million at the inception of the new puts and collars as the fair value of the derivatives was not zero at inception. These instruments did not qualify for hedge accounting; therefore, the changes in fair value of these instruments are recorded in other income (expense) in the accompanying consolidated statements of operations. The collars relating to Marina and Riviera matured in 2011 and 2012, respectively. These collars were settled upon delivery of the ships and included in our total newbuild debt. Refer to Note 5, Debt.
Fuel Price Risk
Our exposure to market risk for changes in fuel prices relates primarily to the consumption of fuel on our vessels. We use fuel derivative swap agreements to mitigate the financial impact of fluctuations in fuel prices. As of December 31, 2012, we entered into fuel related swap agreements for 528,975 and 224,550 barrels to be purchased in 2013 and 2014, respectively. The fuel swaps do not qualify for hedge accounting; therefore, the changes in fair value of these instruments are recorded in other income (expense) in the accompanying consolidated statements of operations.
We have certain fuel derivative contracts that are subject to margin requirements. For these specific fuel derivative contracts, on any business day, we may be required to post collateral if the mark-to-market exposure exceeds $3.0 million. The amount of collateral required to be posted is an amount equal to the difference between the mark-to-market exposure and $3.0 million. As of December 31, 2012 and 2011, we were not required to post any collateral for our fuel derivative instruments. As of December 31, 2012, our exposure was $0.3 million. Therefore, we would have had to incur an additional mark-to-market exposure of $2.7 million on our outstanding fuel derivative contracts in order for us to be required to post collateral.
At December 31, 2012 and 2011 the fair values and line item captions of derivative instruments designated as hedging instruments under FASB ASC 815-20 were:
| Fair Value at December 31, | ||||||||||
| (in thousands) | Balance Sheet Location | 2012 | 2011 | |||||||
| Interest rate swaps |
Other current assets | $ | — | $ | 199 | |||||
| Interest rate swaps |
Other long-term assets | — | 261 | |||||||
|
|
|
|
|
|||||||
| Total assets |
$ | — | $ | 460 | ||||||
|
|
|
|
|
|||||||
| Interest rate swaps |
Current liabilities - derivative liabilities | $ | 2,206 | $ | — | |||||
| Interest rate swaps |
Other long-term liabilities | 8,730 | 6,786 | |||||||
|
|
|
|
|
|||||||
| Total liabilities |
$ | 10,936 | $ | 6,786 | ||||||
|
|
|
|
|
|||||||
F-27
Table of Contents
Prestige Cruises International, Inc. and Subsidiaries
Notes to Consolidated Financial Statements
At December 31, 2012 and 2011, the fair values and line item captions of derivative instruments not designated as hedging instruments under FASB ASC 815-20 were:
| Fair Value at December 31, | ||||||||||
| (in thousands) | Balance Sheet Location | 2012 | 2011 | |||||||
| Fuel hedges |
Other current assets | $ | 1,179 | $ | 1,007 | |||||
| Fuel hedges |
Other long-term assets | 1,608 | — | |||||||
|
|
|
|
|
|||||||
| Total derivatives assets |
$ | 2,787 | $ | 1,007 | ||||||
|
|
|
|
|
|||||||
| Foreign currency collars |
Current liabilities - derivative liabilities | $ | — | $ | 80,362 | |||||
| Foreign currency swap |
Current liabilities -derivative liabilities | — | 112 | |||||||
| Fuel hedges |
Current liabilities -derivative liabilities | 278 | — | |||||||
| Embedded derivatives |
Current liabilities -derivative liabilities | 3,760 | — | |||||||
| Embedded derivatives |
Other long-term liabilities | 15,330 | — | |||||||
|
|
|
|
|
|||||||
| Total derivatives liabilities |
$ | 19,368 | $ | 80,474 | ||||||
|
|
|
|
|
|||||||
The effect of derivative instruments qualifying and designated as hedging instruments on the consolidated financial statements for the year ended December 31, 2012 was as follows:
| (in thousands) | Amount of Gain (Loss) Recognized in OCI on Derivative (Effective Portion) |
Location of Gain (Loss) Reclassified From Accumulated OCI Into Income (Effective Portion) |
Amount of Gain (Loss) Reclassified From Accumulated OCI Into Income (Effective Portion) |
Location of Gain (Loss) Recognized in Income on Derivative (Ineffective Portion Excluded From Effectiveness Testing) |
Amount of Gain (Loss) Recognized in Income on Derivative (Ineffective Portion Excluded From Effectiveness Testing) |
|||||||||||||
| Interest rate swaps |
$ | (4,600 | ) | N/A | $ | — | N/A | $ | — | |||||||||
| Foreign currency collars |
— | Depreciation and amortization expense |
(1,561 | ) | N/A | — | ||||||||||||
|
|
|
|
|
|
|
|||||||||||||
| $ | (4,600 | ) | $ | (1,561 | ) | $ | — | |||||||||||
|
|
|
|
|
|
|
|||||||||||||
The effect of derivative instruments qualifying and designated as hedging instruments on the consolidated financial statements for the year ended December 31, 2011 was as follows:
| (in thousands) | Amount of Gain (Loss) Recognized in OCI on Derivative (Effective Portion) |
Location of Gain (Loss) Reclassified From Accumulated OCI Into Income (Effective Portion) |
Amount of Gain (Loss) Reclassified From Accumulated OCI Into Income (Effective Portion) |
Location of Gain (Loss) Recognized in Income on Derivative (Ineffective Portion Excluded From Effectiveness Testing) |
Amount of Gain (Loss) Recognized in Income on Derivative (Ineffective Portion Excluded From Effectiveness Testing) |
|||||||||||||
| Interest rate swaps |
$ | (3,524 | ) | Interest expense, net | $ | (2,814 | ) | N/A | $ | — | ||||||||
| Foreign currency collars |
37,504 | Depreciation and amortization expense | (1,110 | ) | N/A | — | ||||||||||||
|
|
|
|
|
|
|
|
|
|||||||||||
| $ | 33,980 | $ | (3,924 | ) | $ | — | ||||||||||||
|
|
|
|
|
|
|
|||||||||||||
F-28
Table of Contents
Prestige Cruises International, Inc. and Subsidiaries
Notes to Consolidated Financial Statements
The effect of derivative instruments qualifying and designated as hedging instruments on the consolidated financial statements for the year ended December 31, 2010 was as follows:
| (in thousands) | Amount of Gain (Loss) Recognized in OCI on Derivative Effective Portion) |
Location of Gain (Loss) Reclassified From Accumulated OCI Into Income Effective Portion) |
Amount of Gain (Loss) Reclassified From Accumulated OCI Into Income Effective Portion) |
Location of Gain (Loss) Recognized in Income on Derivative (Ineffective Portion Excluded From Effectiveness Testing) |
Amount of Gain (Loss) Recognized in Income on (Ineffective Portion Excluded From Effectiveness Testing) |
|||||||||||||
| Interest rate swaps |
$ | 15,219 | Interest expense, net | $ | (15,219 | ) | N/A | $ | — | |||||||||
| Foreign currency collars |
(29,924 | ) | N/A | — | N/A | — | ||||||||||||
|
|
|
|
|
|
|
|||||||||||||
| $ | (14,705 | ) | $ | (15,219 | ) | $ | — | |||||||||||
|
|
|
|
|
|
|
|||||||||||||
The effect of derivative instruments not designated as hedging instruments on the consolidated financial statements for the years ended December 31, 2012, 2011, and 2010 was:
|
Location of Gain (Loss) Instruments |
Amount of Gain (Loss) Recognized in Income on Derivative Instruments |
|||||||||||||
| (in thousands) | 2012 | 2011 | 2010 | |||||||||||
| Foreign currency swaps |
Other income (expense) | $ | (165 | ) | $ | 87 | $ | — | ||||||
| Foreign currency swaps |
Other ship operating | — | — | (1,092 | ) | |||||||||
| Foreign currency collars |
Other income (expense) | 10,035 | (47,193 | ) | (43,347 | ) | ||||||||
| Embedded derivatives |
Other income (expense) | 15,008 | — | — | ||||||||||
| Fuel hedges |
Other income (expense) | 6,283 | 9,198 | 1,095 | ||||||||||
|
|
|
|
|
|
|
|||||||||
| $ | 31,161 | $ | (37,908 | ) | $ | (43,344 | ) | |||||||
|
|
|
|
|
|
|
|||||||||
Fair Value Measurements
GAAP establishes a hierarchy for inputs used in measuring fair value that maximizes the use of observable inputs and minimizes the use of unobservable inputs by requiring that the most observable inputs be used when available. Observable inputs are inputs that market participants would use in pricing the asset or liability based on market data obtained from independent sources. Unobservable inputs are inputs that reflect our assumptions which market participants would use in pricing the asset or liability based on the best available information under the circumstances. The hierarchy is broken down into three levels based on the reliability of the inputs as follows:
| Level 1 | Inputs Quoted prices (unadjusted) in active markets for identical assets or liabilities that the Company has the ability to access. |
| Level 2 | Inputs Inputs other than quoted prices included within Level 1 that are observable for the asset and liability, either directly or indirectly. |
| Level 3 | Inputs Inputs that are unobservable for the asset or liability. |
F-29
Table of Contents
Prestige Cruises International, Inc. and Subsidiaries
Notes to Consolidated Financial Statements
Fair Value of Financial Instruments
We use quoted prices in active markets when available to determine the fair value of our financial instruments. The fair value of our financial instruments that are not measured at fair value on a recurring basis are:
| Carrying Value at December 31, |
Fair Value at December 31, | |||||||||||||||
| (in thousands) | 2012 | 2011 | 2012 | 2011 | ||||||||||||
| Long-term bank debt (a) |
$ | 1,488,216 | $ | 1,125,840 | $ | 1,459,232 | $ | 1,009,226 | ||||||||
| Senior secured notes |
225,000 | 225,000 | 239,063 | 226,133 | ||||||||||||
| Long-term related party notes payable |
661,304 | 615,143 | 632,724 | 598,072 | ||||||||||||
|
|
|
|
|
|
|
|
|
|||||||||
| $ | 2,374,520 | $ | 1,965,983 | $ | 2,331,019 | $ | 1,833,431 | |||||||||
|
|
|
|
|
|
|
|
|
|||||||||
| (a) | 2012 carrying value is net of $32.8 million of debt discount. |
Long-term Bank Debt
Level 2 inputs were used to calculate the fair value of our long-term debt, which was estimated using the present value of expected future cash flows, which incorporates our risk profile. The valuation also takes into account debt maturity and interest rate based on the contract terms.
Senior Secured Notes
Level 1 inputs were used to calculate the fair value of our Notes, which was estimated using quoted market prices.
Long-Term Related Party Notes Payable
Level 2 and 3 inputs are utilized to derive the fair value of our long-term related party notes payable. As described in Note 6, there are multiple classes of instruments (promissory notes, warrants and ordinary shares) that are issued. Therefore, we have utilized an option pricing methodology to determine fair value. Level 2 inputs used in this methodology are risk-free rates and volatility, which are identical to our assumptions used to calculate our fair value equity awards in Note 8. Level 3 inputs include our aggregate equity value, time to liquidity event date, dividend yields and breakpoints, which consider the rights, privileges and preferences of the various classes of the instruments. Our aggregate equity value was estimated using a weighted average of income and market approach method. Also, our dividend yield used was 0% as we do not anticipate paying dividends in the foreseeable future. There have been no issuances or repayments of the related party notes during 2012 and 2011. Also, there were no movements of financial instruments in or out of Level 3 during 2012 and 2011.
Other Financial Instruments
Due to their short-term maturities and no interest rate, currency or price risk, the carrying amounts of cash and cash equivalents, passenger deposits, accrued interest, and accrued expenses approximate their fair values. We consider these inputs to be Level 1 as all are observable and require no judgment for valuation.
F-30
Table of Contents
Prestige Cruises International, Inc. and Subsidiaries
Notes to Consolidated Financial Statements
The following table presents information about our financial instrument assets and liabilities that are measured at fair value on a recurring basis:
| (in thousands) | ||||||||||||||||||||||||||||||||
| December 31, 2012 | December 31, 2011 | |||||||||||||||||||||||||||||||
| Description | Level 1 | Level 2 | Level 3 | Total | Level 1 | Level 2 | Level 3 | Total | ||||||||||||||||||||||||
| Assets |
||||||||||||||||||||||||||||||||
| Derivative financial instruments (a) |
$ | — | $ | 2,787 | $ | — | $ | 2,787 | $ | — | $ | 1,467 | $ | — | $ | 1,467 | ||||||||||||||||
|
|
|
|
|
|
|
|
|
|
|
|
|
|
|
|
|
|||||||||||||||||
| Total assets |
$ | — | $ | 2,787 | $ | — | $ | 2,787 | $ | — | $ | 1,467 | $ | — | $ | 1,467 | ||||||||||||||||
|
|
|
|
|
|
|
|
|
|
|
|
|
|
|
|
|
|||||||||||||||||
| Liabilities |
||||||||||||||||||||||||||||||||
| Derivative financial instruments (b) |
$ | — | $ | 30,304 | $ | — | $ | 30,304 | $ | — | $ | 87,260 | $ | — | $ | 87,260 | ||||||||||||||||
|
|
|
|
|
|
|
|
|
|
|
|
|
|
|
|
|
|||||||||||||||||
| Total liabilities |
$ | — | $ | 30,304 | $ | — | 30,304 | $ | — | $ | 87,260 | $ | — | $ | 87,260 | |||||||||||||||||
|
|
|
|
|
|
|
|
|
|
|
|
|
|
|
|
|
|||||||||||||||||
| (a) | As of December 31, 2012, derivative financial instruments of $1.2 million and $1.6 million are classified as other current assets and other long-term assets, respectively, in the consolidated balance sheets. As of December 31, 2011, $1.2 million was classified as other current assets and $0.3 million was classified in other long-term assets. |
| (b) | As of December 31, 2012, derivative financial instruments of $6.2 million and $24.1 million are classified as derivative liabilities and other long-term liabilities, respectively, in the consolidated balance sheets. As of December 31, 2011, derivative financial instruments of $80.5 million and $6.8 million are classified as derivative liabilities and other long-term liabilities, respectively, in the consolidated balance sheets. |
Our derivative financial instruments consist of interest rate swaps, foreign currency exchange contracts, and fuel hedge swaps. Fair value is derived using the valuation models that utilize the income value approach. These valuation models take into account the contract terms such as maturity, and inputs such as forward interest rates, forward fuel prices, discount rates, creditworthiness of the counter party and us, as well as other data points. The data sources utilized in these valuation models that are significant to the fair value measurement are classified as Level 2 sources in the fair value input level hierarchy.
Our derivative financial instruments also consist of embedded derivatives. Fair value is derived using the valuation models that utilize the income value approach. These valuation models take into account the contract terms such as maturity, and inputs such as forward interest rates, discount rates, IBOXX Euro Average, USD/EUR basis index, creditworthiness of the counter party and us, as well as other data points. The data sources utilized in these valuation models that are significant to the fair value measurement are classified as Level 2 sources in the fair value input level hierarchy.
Nonrecurring Measurements of Nonfinancial Assets
Goodwill and indefinite-lived intangible assets not subject to amortization are reviewed for impairment on an annual basis or earlier if there is an event or change in circumstances that would indicate that the carrying value of these assets could not be fully recovered. For goodwill, if the carrying amount of the Reporting Unit exceeds the estimated discounted future cash flows, we measure the amount of the impairment by comparing the carrying amount of the Reporting Unit to its fair value. For indefinite-lived intangible assets, if the carrying amount of the asset exceeds the estimated discounted future cash flows, we measure the amount of the impairment by comparing the carrying amount of the asset to its fair value.
Other long-lived assets, such as our ships, are reviewed for impairment whenever events or changes in circumstances indicate its carrying amount may not be recoverable. If the carrying amount exceeds the
F-31
Table of Contents
Prestige Cruises International, Inc. and Subsidiaries
Notes to Consolidated Financial Statements
estimated expected undiscounted future cash flows, we measure the amount of the impairment by comparing its carrying amount to its fair value. The estimation of fair value measured by undiscounted or discounted expected future cash flows would be considered Level 3 inputs.
During the second quarter of 2012, the Seven Seas Navigator underwent a drydock, in which improvements were made. Due to the increase in its carrying value, we performed an impairment review utilizing an undiscounted cash flow analysis. The principle assumptions used in the undiscounted cash model were projected operating results, including net per diems, net cruise costs, projected occupancy, available passenger days and projected growth. As a result of our impairment review, we determined the revised carrying amount is recoverable and not impaired. There was no impairment of our nonfinancial assets mentioned above as of December 31, 2012 or 2011.
| 8. | Share-Based Employee Compensation |
In 2008, PCI adopted the 2008 Stock Option Plan (“Plan”) whereby its board of directors may grant stock options to officers, key employees, consultants and directors. The Plan authorized grants of options of up to 4,720,000 and 4,500,000 ordinary shares in 2012 and 2011, respectively. Options granted primarily vest proportionally over 3 years, 50% based on performance conditions and 50% based on employee service conditions. The contractual term of options granted during the years ended December 31, 2012, 2011 and 2010 is eight years.
On December 31, 2012, we modified approximately 489,000 performance based stock options of equity classified awards, including those options modified in December 2011. The modification was due to the change in expectation from improbable to probable that we would meet the performance condition. No other terms of the options were changed. We revalued these awards and recorded the full expense as of December 31, 2012.
During April 2012, the Chief Operating Officer of Prestige Cruise Holdings was granted 600,000 options to purchase PCI shares according to his employment contract. These options are time based and vest over three years on his employment anniversary date. The contractual term of these options is eight years. Total compensation expense for these options was calculated at the PCI level. The fair value was estimated on the grant date using the Black-Scholes model which includes the fair value of PCI ordinary shares determined at the approximate grant date. The estimated fair value of these stock options totaled $1.4 million and is amortized over the vesting period using the graded-vesting method.
In December 2011, the Board of Directors modified approximately 344,000 performance based stock options recorded as equity classified awards. These equity classified awards would have been forfeited due to failure to achieve the specified performance condition. The Board of Directors modified the performance conditions of these options to allow the options to vest provided that performance targets are met in 2012. This modification was accounted for as a cancellation and a replacement grant. The replacement grant was treated as a new issuance and the fair value was remeasured at the date of modification.
During June 2009, a special award of 1,000,000 options with a grant date fair value of $3.4 million was granted to our Chief Executive Officer and Chairman of the Board. These options vest over a four year period, 50% after the first 24 months, 25% after 36 months and 25% after 48 months. The contractual term of the special award options is eight years.
To determine fair value of our ordinary shares, we used a weighted average of the market and income valuation approaches. Weightings were assigned to the income approach and market approaches, which produced an indication of the invested capital value on a freely tradable basis at the valuation dates. These
F-32
Table of Contents
Prestige Cruises International, Inc. and Subsidiaries
Notes to Consolidated Financial Statements
weightings were based on (i) a minority investor placing considerable weight on the Income Approach value because it relies directly on our forecasted operating results and market-derived rates of return and (ii) to a lesser extent, the Market Approach, because it reflects current market pricing and earnings and relies on an analysis of our direct competitors, which are considered to be alternative investments to an investment in us.
For the market approach, we analyzed comparable publiclytraded companies (the “Peer Group”). The data obtained from the Peer Group was converted to various standard valuation multiples. We used the enterprise value/revenue multiple and enterprise value/EBITDA multiple for the Peer Group. We considered these metrics to be the best indicators of free cash flows and the standard multiples used in a market valuation approach. These multiples were applied to our revenue and EBITDA, with equal weighting, to derive an enterprise value.
For the income approach, we used the discounted cash flow model to calculate the value of our total invested capital (debt and equity). An estimated cash flow growth rate was determined to reflect our estimate of our long-term prospects, to which we further applied a discount rate ranging from 12.5% to 14.3% in 2012, 2011 and 2010.
In order to compute our discount rate for the cash flow model, a weighted-average cost of capital (“WACC”) was determined. Our WACC is based on our capital structure consisting of both equity and debt. Our debt-to-capital ratio is projected to be 50% based on the expected long-term capital structure. The WACC was therefore weighted evenly between the cost of capital for debt and equity. The cost of debt capital was determined by considering a range of market rates for S&P BB and BBB rated corporate bonds with similar terms. The remaining component of WACC, the cost of equity, is based on:
Risk-free rate of return—The risk-free rate is based on the yield of a 20-year treasury bond (the range was between 2.5% and 4.1%);
Equity risk premium—The equity risk premium is based on a compilation of equity risk premiums as compiled by various sources, such as Ibbotson & Associates, Pratt Range, Fama & French, etc. (5.75% was used throughout 2012 and 2011);
Industry Beta—Industry Beta is based on comparable companies to us (the range was between x2.21 and x2.56); and
Size premium—Size premium is based on our market capitalization (the range was between 1.7% and 1.9%).
The differences between the rights, restrictions and preferences of the holders of ordinary shares, warrants, and notes may result in potentially different future outcomes for each class. Therefore, to estimate the value of the ordinary shares, it is necessary to allocate our enterprise value among the various classes of warrants, notes and ordinary shares. To perform this allocation among the various instruments, we utilized the Black-Scholes option pricing model. From the value of the ordinary shares derived from the Black-Scholes option pricing model, we added a further discount for lack of marketability (“DLOM”) of our ordinary shares. We based the DLOM on the likelihood, timing and size of an initial public offering, forecasted dividends, and potential for industry consolidation. The DLOM used was 15% for 2012, 2011 and 2010.
The fair value of each stock option grant is estimated on the date of grant using the Black-Scholes model which includes the fair value of our ordinary shares determined at the approximate grant date. The estimated fair value of stock options, less estimated forfeitures, is amortized over the vesting period using the
F-33
Table of Contents
Prestige Cruises International, Inc. and Subsidiaries
Notes to Consolidated Financial Statements
graded-vesting method. Total compensation expense recognized for employee stock options was $2.1 million, $2.2 million and $4.3 million for the years ended December 31, 2012, 2011 and 2010, respectively, which is included within selling and administrative expense in the consolidated statements of operations. The total unrecognized compensation cost related to nonvested awards is $1.0 million for the year ended December 31, 2012. The weighted average period over which it is expected to be recognized is 1.5 years.
The assumptions used in the Black-Scholes model to fair value equity awards are as follows:
| 2012 | 2011 | 2010 | ||||||||||
| Expected dividend yield |
0% | 0% | 0% | |||||||||
| Expected stock price volatility |
36.37% - 61.66% | 40.0% - 54.6% | 52.7% - 61.7% | |||||||||
| Risk-free interest rate |
0.25% - 1.03% | 0.12% - 1.28% | 0.7% -1.53% | |||||||||
| Expected option life |
2 - 5 years | 1 - 3 years | 2-3 years | |||||||||
Since our ordinary shares is not publicly traded, it is not practical to estimate the expected volatility of our share price. Therefore, the expected volatility is based on a combination of historical volatility for peer companies. The risk-free interest rate is based on U.S. Treasury securities with a remaining term equal to the expected option’s life assumed at the date of grant. The expected term is based on the average of contractual life, vested period of the options and expected employee exercise behavior. The estimated forfeiture rate represents an estimate which will be revised in subsequent periods if actual forfeitures differ from those estimates. The weighted average fair value of stock options granted during 2012, 2011 and 2010 was approximately $1.77 per share, $1.64 per share and $3.90, respectively.
Stock option activity is summarized in the following table:
| Number of Options |
Weighted Average Exercise Price ($) |
Weighted Average Remaining Contractual Term (in Years) |
||||||||||
| Outstanding at January 1, 2012 |
3,712,103 | $ | 16.25 | 5.34 | ||||||||
| Granted |
1,352,071 | 6.39 | ||||||||||
| Exercised |
(917 | ) | 8.14 | |||||||||
| Forfeited or expired |
(910,903 | ) | 15.13 | |||||||||
|
|
|
|||||||||||
| Outstanding at December 31, 2012 |
4,152,354 | 13.28 | 5.08 | |||||||||
|
|
|
|||||||||||
| Vested and expected to vest at December 31, 2012 |
4,151,214 | 13.30 | 5.08 | |||||||||
| Options exercisable at December 31, 2012 |
3,298,448 | 15.18 | 4.74 | |||||||||
The total fair value of shares vested during the years ended December 31, 2012, 2011 and 2010 was $2.3 million, $3.3 million and $3.3 million, respectively. At December 31, 2012, 2011 and 2010, the aggregate intrinsic value of options vested and expected to vest is $0.8 million, $0.0 million and $2.5 million, respectively. The aggregate intrinsic value of options exercisable at December 31, 2012, 2011 and 2010, is $0.3 million $0.0 million and $0.7 million, respectively. There were no exercises of options that resulted in a material amount of cash received in 2012, 2011 or 2010.
| 9. | Stockholders’ Equity |
Ordinary Shares
Our authorized ordinary shares as of December 31, 2012 and 2011 consisted of 100 million ordinary shares with a par value of $0.01 per share. We had 13.6 million ordinary shares issued and outstanding as of December 31, 2012 and 2011.
F-34
Table of Contents
Prestige Cruises International, Inc. and Subsidiaries
Notes to Consolidated Financial Statements
The holders of ordinary shares are entitled to one vote per share and participate equally in all dividends payable or distributions. Upon liquidation, dissolution, or winding up of PCI, ordinary shareholders are entitled to receive a ratable share of the available net assets of PCI after payment of all debts and other liabilities. The ordinary shares have no preemptive, subscription, redemption or conversion rights.
In 2010, we issued shares to a vendor in lieu of payment relating to $2.0 million of expenses incurred in 2009. Refer to Note 8: Share-Based Employee Compensation for description of how the fair value of ordinary shares was derived.
Accumulated Other Comprehensive Loss
Accumulated other comprehensive loss as of December 31, 2012, 2011 and 2010 was $60.3 million, $57.3 million and $92.4 million, respectively, which is primarily comprised of changes in derivative fair value of cash flow hedges for OCI’s new build ships. Since the cash flow hedges involve the purchase of fixed assets, they are considered forecasted transactions. As such, the gain or loss on the fixed asset cash flow hedges that are deferred in and classified as other comprehensive loss will be reclassified into earnings as the ships are depreciated over their estimated year useful lives.
OCI’s foreign currency collar associated with Riviera newbuild matured in August 2011. Riviera was delivered in April 2012 and as such, $15.7 million related to the collar will remain in other comprehensive loss and will be recognized within depreciation expense over the ship’s useful life. OCI’s foreign currency collar associated with Marina matured in October 2010. Marina was delivered in January 2011 and as such, $36.3 million related to the collar will remain in other comprehensive loss and will be recognized within depreciation expense over the ship’s useful life. For the years ended December 31, 2012, 2011 and 2010, $1.6 million, $1.1 million and $0.0 million, respectively, was reclassified from accumulated other comprehensive loss to depreciation and amortization expense in the consolidated statements of operations.
| 10. | Related Party Transactions |
OCI incurred Apollo management fees of $0.9 million in both 2012 and 2011 and $0.8 million in 2010. These expenses are included in selling and administrative expenses in the accompanying consolidated statements of operations.
During April 2011, our Chief Executive Officer was released from providing a limited personal guarantee to one of our credit card processors for SSC in the event of default.
| 11. | Income Taxes |
We had income tax expense for the years ended December 31, 2012 and 2010 of $0.2 million and $0.4 million, respectively. We had an income tax benefit for the year ended December 31, 2011 of $0.3 million.
The tax effects of temporary differences that give rise to significant portions of the deferred tax assets and deferred tax liabilities as of December 31, 2012 and 2011 relate primarily to net operating losses, depreciable assets, and book expenses not currently deductible for tax purposes. At December 31, 2012 and 2011, we had recorded deferred tax assets of approximately $23.9 million and $15.8 million, respectively, for which a full valuation allowance has been recorded. The increase in the valuation reserve is primarily due to net operating loss carryforwards generated in 2012.
In addition, we have recorded deferred tax liabilities of $1.7 million and $1.9 million for 2011 and 2010, respectively, which are recorded in other long-term liabilities in the accompanying consolidated balance sheets.
F-35
Table of Contents
Prestige Cruises International, Inc. and Subsidiaries
Notes to Consolidated Financial Statements
As of December 31, 2012, we have federal, state, and foreign net operating loss carryforwards of approximately $60.9 million, $0.7 million, and $0.2 million, respectively. The federal and state net operating loss carryforwards at December 31, 2012 expire between 2023 and 2032 and the foreign net operating loss carryforwards have no expiration.
In assessing the realization of deferred tax assets, management considers whether it is more likely than not that some portion or all of the deferred tax assets will not be realized. The ultimate realization of deferred tax assets is dependent upon the generation of future taxable income during the periods in which those temporary differences become deductible. Management considers the scheduled reversal of deferred tax liabilities, projected future taxable income, and tax planning strategies in making this assessment. Based upon the level of historical taxable income and projections for future taxable income over the periods in which the deferred tax assets are deductible, we have recorded a full valuation allowance on our deferred tax assets.
We have analyzed our filing positions in all of the jurisdictions where we are required to file income tax returns, as well as all open tax years in these jurisdictions. We have identified tax returns in France, the United Kingdom, and the United States as “major” tax jurisdictions, as defined. The only periods subject to examination for our returns are the 2010 and 2011 tax years for France, 2010 through 2012 tax years for the United Kingdom and 2007 through 2012 tax years for the United States. The U.S. Internal Revenue Service is currently examining OCI’s 2007 and 2008 tax returns. We believe that our income tax filing positions and deductions will be sustained on audit and do not anticipate any material adjustments that will result in a material change to our financial position. Therefore, no reserves for uncertain income tax positions have been recorded.
United States Federal Income Tax
We derive our income from the international operation of ships. Under Section 883 of the Code (“Section 883”), certain foreign corporations, though engaged in the conduct of a trade or business within the United States, are exempt from U.S. federal income and branch profit taxes on gross income derived from or incidental to the international operation of ships. Applicable U.S. Treasury regulations provide that a foreign corporation will qualify for the benefits of Section 883 if, in relevant part, (i) the foreign country in which the corporation is organized grants an equivalent exemption for income from the operation of ships of sufficiently broad scope to corporations organized in the U.S., and (ii) the foreign corporation is a controlled foreign corporation (a “CFC”) for more than half of the taxable year, and more than 50% of its stock is owned by qualified U.S. persons for more than half of the taxable year (the “CFC test”). Our 2011 tax returns were filed with tax authorities under Section 883 and our 2012 tax returns will also be filed under Section 883.
For U.S. federal income tax purposes, SSC and its non-U.S. subsidiaries are disregarded as entities separate from us and OCI is treated as a corporation. Both OCI and SSC rely on our ability as their parent corporation to meet the requirements necessary to qualify for the benefits of Section 883. We are organized as a company in Panama, which grants an equivalent tax exemption to U.S. corporations, and is thus classified as a qualified foreign country for purposes of Section 883. We are currently classified as a CFC and we believe we meet the ownership and substantiation requirements of the CFC test under the regulations. Therefore, we believe most of our income and the income of our ship-owning subsidiaries, which is derived from or incidental to the international operation of ships, is exempt from U.S. federal income taxation under Section 883. In 2005, final regulations became effective under Section 883, which, among other things, narrow somewhat the scope of activities that are considered by the Internal Revenue Service to be incidental to the international operation of ships. The activities listed in the regulations as not
F-36
Table of Contents
Prestige Cruises International, Inc. and Subsidiaries
Notes to Consolidated Financial Statements
being incidental to the international operation of ships include income from the sale of air and land transportation, shore excursions, and pre- and post-cruise tours. To the extent the income from these activities is earned from sources within the United States that income is subject to U.S. taxation.
United Kingdom Corporation Tax
The Seven Seas Navigator and Seven Seas Voyager are operated by companies that are strategically and commercially managed in the United Kingdom (UK), which have elected to enter the UK tonnage tax regime. Companies to which the tonnage tax regime applies pay corporation tax on a notional profit by reference to the net tonnage of qualifying ships. Normal UK corporate income tax is not chargeable on these companies’ relevant shipping income. The requirements for a company to qualify for the UK tonnage tax regime include being subject to UK corporate income tax, operating qualifying ships that are strategically and commercially managed in the UK, and fulfilling a seafarer training requirement. Our UK income from non-shipping activities that does not qualify under the UK tonnage tax regime remains subject to normal UK corporation tax.
Corporate tax rate reductions from 25% to 24%, effective April 1, 2012 and from 24% to 23%, effective April 1, 2013, were enacted in the United Kingdom on July 17, 2012. The effect of tax rate changes on existing deferred tax balances is recorded in the period in which the tax rate change law is enacted. The effect of these tax rate changes was the recognition of a deferred tax benefit of $0.2 million for the year ended December 31, 2012.
Individual State Income Taxes
We are subject to various U.S. state income taxes generally imposed on each state’s portion of the U.S. source income subject to federal income taxes. However, the state of Alaska imposes an income tax on its allocated portion of the total income of companies doing business in Alaska.
Panamanian and Other Foreign Income Taxes
Under Panamanian law, we are exempt from income tax on income from international transportation and should also be exempt from income tax in the other jurisdictions where the ships call if a tax treaty exists or when Panama grants a reciprocal exemption to countries who grant a reciprocal exemption to Panama. However, not all of the countries in which our ships call have income tax treaties or reciprocal exemption agreements with Panama. Accordingly, we may be subject to income tax in various countries depending on the tax laws of the specific countries upon which ports the ships call. In addition to or in place of income taxes, virtually all jurisdictions where our ships call impose taxes based on passenger counts, ship tonnage or some other measure. These taxes are recorded as other ship operating expenses in the accompanying consolidated statements of operations.
| 12. | Concentration Risk |
We contract with a single vendor to provide many of our hotel and restaurant services including both food and labor costs. We incurred expenses of $109.6 million, $101.2 million and $81.1 million for the years ended December 31, 2012, 2011 and 2010, respectively, which are recorded in payroll, related and food in our consolidated statements of operations.
| 13. | Capital Lease Obligations |
During 2011, we entered into an office lease for the combined headquarters of our subsidiaries, which extends through 2022. The lease was accounted for as capital leases under ASC-840: Leases.
F-37
Table of Contents
Prestige Cruises International, Inc. and Subsidiaries
Notes to Consolidated Financial Statements
As of December 31, 2012 and 2011, the capital lease asset was $4.9 million and $5.7 million, respectively, net of accumulated amortization of $0.7 million and $0.2 million, respectively, and is included in property and equipment, net in the consolidated balance sheet. As of December 31, 2012 and 2011, the capital lease liability totaled $7.3 million and $7.5 million, respectively, including $5.8 million and $6.3 million, respectively, and is included in other long-term liabilities in the accompanying consolidated balance sheet. Interest expense for the years ended December 31, 2012, 2011 and 2010 was $0.8 million, $0.6 million and $0.6 million, respectively. Amortization expense for the years ended December 31, 2012, 2011 and 2010 was $0.4 million, $0.2 million and $0.2 million, respectively, and is included in depreciation and amortization expense in the accompanying statements of income and comprehensive income.
The following schedule represents the future minimum lease payments under our capital lease obligations:
| (in thousands) | ||||
| Twelve Months Ending December 31, |
||||
| 2013 |
$ | 1,122 | ||
| 2014 |
1,150 | |||
| 2015 |
1,179 | |||
| 2016 |
1,209 | |||
| 2017 |
1,239 | |||
| Thereafter |
6,556 | |||
|
|
|
|||
| Total minimum lease payments |
12,455 | |||
| Less: Amount representing interest (a) |
5,159 | |||
|
|
|
|||
| Present value of total minimum lease payments |
$ | 7,296 | ||
|
|
|
|||
| (a) | Amount necessary to reduce total minimum lease payments to present value calculated at the Company’s incremental borrowing rate at lease inception. |
| 14. | Commitments and Contingencies |
Operating Leases
We have several non-cancelable operating leases, primarily for office space, that expire at various times through 2012 and 2015. Rental expense for operating leases amounted to approximately $1.6 million, $2.9 million and $2.9 million for the years ended December 31, 2012, 2011 and 2010, respectively.
During 2011 we entered into an office lease for combined headquarters of our subsidiaries. Refer to Note 13: Capital Lease Obligations. As a result, we exited our leased facility in Fort Lauderdale, which was under a non-cancelable lease. This lease terminated in December 2012. As of December 31, 2011, we recorded $0.5 million in accrued expenses relating to early termination costs in our consolidated balance sheets for the remaining portion of the lease.
F-38
Table of Contents
Prestige Cruises International, Inc. and Subsidiaries
Notes to Consolidated Financial Statements
The following schedule represents our lease contractual obligations as of December 31, 2012:
| (in thousands) | ||||
| Years Ending December 31, |
||||
| 2013 |
$ | 820 | ||
| 2014 |
673 | |||
| 2015 |
233 | |||
| 2016 |
32 | |||
| 2017 |
— | |||
| Thereafter |
— | |||
|
|
|
|||
| $ | 1,758 | |||
|
|
|
|||
Employment Agreements
We have entered into employee agreements with certain of our executive officers and key employees. These agreements provide for minimum salary levels, and in most cases, performance based bonuses that are payable if specified goals are attained. Some executive officers and key employees are also entitled to severance benefits upon termination or nonrenewal of their contracts under certain circumstances. Additionally, if there is a change in control, some executive officers and key employees’ outstanding options will generally become fully vested and exercisable.
As of December 31, 2012, the approximate future minimum requirements under employment agreements, excluding discretionary and performance bonuses, are as follows:
| (in thousands) | ||||
| Years Ending December 31, |
||||
| 2013 |
$ | 10,933 | ||
| 2014 |
2,825 | |||
| 2015 |
475 | |||
|
|
|
|||
| $ | 14,233 | |||
|
|
|
|||
Equipment—Maintenance and Purchases
During March 2012, management signed a 5-year maintenance agreement with a vendor. The cost of future maintenance contract obligations under this agreement as of December 31, 2012 is approximately $22.0 million. The contract consists of multiple cost components. Monthly variable maintenance fees are based on engine usage over the contract term. Monthly fixed fees are based on a per vessel basis. We are also required to purchase a certain amount of capital equipment and spare parts. Equipment will be recorded as property and equipment upon receipt and maintenance fees are recorded as repair and maintenance expenses. As of December 31, 2012 we incurred expenses of $4.0 million relating to this agreement, which is recorded in other ship operating expenses.
In October 2012, we entered into a software license agreement with a third party vendor. This agreement grants us a nonexclusive, perpetual, royalty-free license to use software. The total license fee is $2.3 million, of which $0.7 million was paid in 2012. As of December 31, 2012, the future contract obligation relating to our third party software purchase is $1.6 million.
F-39
Table of Contents
Prestige Cruises International, Inc. and Subsidiaries
Notes to Consolidated Financial Statements
As of December 31, 2012, the approximate future minimum requirements under these agreements are as follows:
| (in thousands) | ||||
| Years Ending December 31, |
||||
| 2013 |
$ | 6,453 | ||
| 2014 |
4,803 | |||
| 2015 |
5,636 | |||
| 2016 |
5,803 | |||
| 2017 |
967 | |||
| Thereafter |
— | |||
|
|
|
|||
| $ | 23,662 | |||
|
|
|
|||
Litigation
On an ongoing basis, we assess the potential liabilities related to any lawsuits or claims brought against us. While it is typically very difficult to determine the timing and ultimate outcome of such actions, we use our judgment to determine if it is probable that we will incur an expense related to the settlement or final adjudication of such matters and whether a reasonable estimation of such probable loss can be made. In assessing probable losses, we take into consideration estimates of the amount of insurance recoveries, if any. We accrue a liability when we believe a loss is probable and the amount of loss can be reasonably estimated. The majority of claims are covered by insurance and we believe the outcome of such claims, net of estimated insurance recoveries, will not have a material adverse impact on our financial condition or results of operations and cash flows.
Other
As mandated by the FMC for sailings from a U.S. port, the availability of passenger deposits received for future sailings is restricted until the completion of the related sailing in accordance with FMC regulations. We have met this obligation by posting two $15 million surety bonds.
As required by Package Travel, Package Holiday and Package Tours Regulations, we maintain surety bonds for cruise businesses originating in the United Kingdom of £5.2 million ($8.4 million).
On September 26, 2012, we agreed with the President of SSC that he would step down from his role as President as of January 31, 2013 and become a consultant to SSC for a two year period. In connection with these arrangements, on November 9, 2012, we entered into a Separation Agreement and an Independent Contractor Agreement with the President. The President received amounts he was entitled to pursuant to his then existing employment agreement. As of December 31, 2012, we have accrued $0.7 million in connection with this separation agreement.
One of our credit card service providers has a third mortgage on three of OCI’s ships, Regatta, Insignia and Nautica as collateral for credit card payments processed. The value of the mortgage is $48.7 million.
| 15. | Supplemental Cash Flow Information |
For the years ended December 31, 2012, 2011 and 2010, we paid interest expense and related fees of $59.5 million, $48.4 million, and $54.9 million, respectively. We also accrued related party interest of $30.9 million, $29.4 million and $25.8 million for the years ended 2012, 2011 and 2010, respectively, which was added to the outstanding balance of the related party notes payable.
F-40
Table of Contents
Prestige Cruises International, Inc. and Subsidiaries
Notes to Consolidated Financial Statements
For the year ended December 31, 2012 we had non-cash investing activities related to the acquisition of property and equipment totaling $4.4 million. For the year ended December 31, 2011, we had non-cash investing activities related to the acquisition of property and equipment totaling $8.2 million, of which $5.7 million relates to our capital lease. For the year ended December 31, 2010, we had non-cash investing activities related to the acquisition of property and equipment totaling $13.9 million.
For the year ended December 31, 2012 and 2011, we had noncash investing activities related to acquisition of intangible assets of $2.0 million and $3.4 million, respectively. There were no similar transactions in 2010.
For the year ended December 31, 2012 and 2011, we had non-cash financing activities of $0.1 million and $7.5 million relating to our capital lease, respectively. For the year ended December 31, 2012 and 2011, we had non-cash financing activities of $0.6 million and $0.4 million, respectively, related to deferred financing costs. For the year ended December 31, 2010, we had non-cash financing activities in connection with an issuance of ordinary shares to a vendor in exchange for the release of our $2.0 million liability. There was no similar transaction in 2011 or 2012.
We recorded discount on related party notes payable of $46.5 million for the year ended 2010. We also recorded accretion related to the discount on related party notes payable of $15.3 million and $13.0 million for the years ended 2011 and 2010, respectively. In conjunction with the issuance of related party notes payable, we issued $46.5 million of ordinary shares warrants for the year ended 2010 (See Note 6).
| 16. | Subsequent Events |
On February 1, 2013, SSC amended its previously existing $340 million credit agreement, consisting of both a $300.0 million term loan and a $40.0 million revolving credit facility. In conjunction with this amendment, the outstanding balance on the term loan of $296.3 million was repriced with a margin of 3.5% compared to either 4.75% or 5.0% based on a leverage ratio in the original term loan. There was no change to the $40.0 million revolving credit facility or the maturity date of the term loan. There was also no impact on covenants, liquidity or debt capacity. We are evaluating the appropriate accounting treatment for this transaction.
On February 4, 2013, Seven Seas Voyager and Seven Seas Navigator exited the UK tonnage tax regime and will no longer be required to abide by certain UK specific regulations. As a result of the exit, we expect to incur a tax charge of approximately $0.1 million in 2013.
In March 2013, OCI entered into two forward starting interest rate swap agreements to hedge the variability of the interest payments related to the outstanding variable-rate debt associated with the Riviera newbuild loan facility. The first swap has an amortizing notional amount of $422.4 million, becomes effective on October 28, 2013 and matures on October 27, 2014. The second swap has an amortizing notional amount of $377.6 million and will become effective on October 27, 2014, maturing on October 27, 2015. Also, OCI entered into another forward starting interest rate swap agreement to hedge the variability of the floating interest payments associated with the Marina newbuild debt. This swap has an amortizing notional amount of $300.0 million and will become effective on January 20, 2015, maturing on January 19, 2016. The interest rate swaps qualify for hedge accounting and will be designated as cash-flow hedges.
F-41
Table of Contents
FINANCIAL INFORMATION
Financial Statements
PRESTIGE CRUISES INTERNATIONAL, INC.
CONSOLIDATED BALANCE SHEETS
(unaudited, in thousands)
| September 30, 2013 |
December 31, 2012 |
|||||||
| Assets |
||||||||
| Current assets |
||||||||
| Cash and cash equivalents |
$ | 263,781 | $ | 139,556 | ||||
| Restricted cash |
39,075 | — | ||||||
| Trade and other receivables, net |
14,895 | 15,951 | ||||||
| Inventories |
14,984 | 15,080 | ||||||
| Prepaid expenses |
52,686 | 35,030 | ||||||
| Other current assets |
14,168 | 14,091 | ||||||
|
|
|
|
|
|||||
| Total current assets |
399,589 | 219,708 | ||||||
| Property and equipment, net |
2,016,783 | 2,035,449 | ||||||
| Goodwill |
404,858 | 404,858 | ||||||
| Intangible assets, net |
82,042 | 83,556 | ||||||
| Other long-term assets |
79,813 | 128,539 | ||||||
|
|
|
|
|
|||||
| Total assets |
$ | 2,983,085 | $ | 2,872,110 | ||||
|
|
|
|
|
|||||
| Liabilities and Stockholders’ Equity (Deficit) |
||||||||
| Current liabilities |
||||||||
| Accounts payable |
$ | 7,087 | $ | 14,252 | ||||
| Accrued expenses |
99,700 | 93,651 | ||||||
| Passenger deposits |
410,262 | 355,385 | ||||||
| Derivative liabilities |
7,779 | 6,245 | ||||||
| Current portion of long-term debt |
67,355 | 17,560 | ||||||
|
|
|
|
|
|||||
| Total current liabilities |
592,183 | 487,093 | ||||||
| Long-term debt |
1,618,585 | 1,695,656 | ||||||
| Related party notes payable |
698,985 | 661,304 | ||||||
| Other long-term liabilities |
36,755 | 41,400 | ||||||
|
|
|
|
|
|||||
| Total liabilities |
2,946,508 | 2,885,453 | ||||||
| Stockholders’ equity (deficit) |
||||||||
| Common Stock, $0.01 par value. 100,000,000 shares authorized at 2013 and 2012; 13,566,765 and 13,572,515 shares issued and outstanding at 2013 and 2012 |
136 | 136 | ||||||
| Additional paid-in capital |
306,651 | 305,642 | ||||||
| Accumulated deficit |
(211,201 | ) | (258,802 | ) | ||||
| Accumulated other comprehensive loss |
(59,009 | ) | (60,319 | ) | ||||
|
|
|
|
|
|||||
| Total stockholders’ equity (deficit) |
36,577 | (13,343 | ) | |||||
|
|
|
|
|
|||||
| Total liabilities and stockholders’ equity (deficit) |
$ | 2,983,085 | $ | 2,872,110 | ||||
|
|
|
|
|
|||||
The accompanying notes are an integral part of these consolidated financial statements.
F-42
Table of Contents
PRESTIGE CRUISES INTERNATIONAL, INC.
CONSOLIDATED STATEMENTS OF OPERATIONS
(unaudited, in thousands, except per share data)
| Nine Months Ended September 30, |
||||||||
| 2013 | 2012 | |||||||
| Revenues |
||||||||
| Passenger ticket |
$ | 779,309 | $ | 731,629 | ||||
| Onboard and other |
124,007 | 114,023 | ||||||
| Charter |
14,046 | 9,004 | ||||||
|
|
|
|
|
|||||
| Total revenue |
917,362 | 854,656 | ||||||
|
|
|
|
|
|||||
| Expenses |
||||||||
| Cruise operating expenses |
||||||||
| Commissions, transportation and other |
247,248 | 252,801 | ||||||
| Onboard and other |
33,732 | 31,085 | ||||||
| Payroll, related and food |
133,918 | 124,693 | ||||||
| Fuel |
77,978 | 75,272 | ||||||
| Other ship operating |
74,694 | 70,538 | ||||||
| Other |
8,368 | 16,310 | ||||||
|
|
|
|
|
|||||
| Total cruise operating expenses |
575,938 | 570,699 | ||||||
| Selling and administrative |
131,871 | 114,985 | ||||||
| Depreciation and amortization |
62,683 | 67,955 | ||||||
|
|
|
|
|
|||||
| Total operating expenses |
770,492 | 753,639 | ||||||
|
|
|
|
|
|||||
| Operating income |
146,870 | 101,017 | ||||||
|
|
|
|
|
|||||
| Non-operating income (expense) |
||||||||
| Interest income |
367 | 567 | ||||||
| Interest expense, net of capitalized interest |
(106,470 | ) | (95,347 | ) | ||||
| Other income |
6,651 | 20,274 | ||||||
|
|
|
|
|
|||||
| Total non-operating expense |
(99,452 | ) | (74,506 | ) | ||||
|
|
|
|
|
|||||
| Income before income taxes |
47,418 | 26,511 | ||||||
| Income tax benefit (expense) |
183 | (211 | ) | |||||
|
|
|
|
|
|||||
| Net income |
47,601 | 26,300 | ||||||
|
|
|
|
|
|||||
| Earnings per share |
||||||||
| Basic |
$ | 3.51 | $ | 1.94 | ||||
|
|
|
|
|
|||||
| Diluted |
$ | 2.45 | $ | 1.94 | ||||
|
|
|
|
|
|||||
| Weighted-average shares outstanding |
||||||||
| Basic |
13,571,078 | 13,571,827 | ||||||
|
|
|
|
|
|||||
| Diluted |
19,439,522 | 13,571,827 | ||||||
|
|
|
|
|
|||||
The accompanying notes are an integral part of these consolidated financial statements.
F-43
Table of Contents
PRESTIGE CRUISES INTERNATIONAL, INC.
CONSOLIDATED STATEMENTS OF COMPREHENSIVE INCOME
(unaudited, in thousands)
| Nine Months Ended September 30, |
||||||||
| 2013 | 2012 | |||||||
| Net income |
$ | 47,601 | $ | 26,300 | ||||
| Other comprehensive income: |
||||||||
| Gain (loss) on change in derivative fair value |
728 | (4,367 | ) | |||||
| Loss on foreign exchange collar |
(719 | ) | — | |||||
| Cash flow hedge reclassified into earnings |
1,301 | 1,127 | ||||||
|
|
|
|
|
|||||
| Total comprehensive income |
$ | 48,911 | $ | 23,060 | ||||
|
|
|
|
|
|||||
The accompanying notes are an integral part of these consolidated financial statements.
F-44
Table of Contents
PRESTIGE CRUISES INTERNATIONAL, INC.
CONSOLIDATED STATEMENTS OF CASH FLOWS
(unaudited, in thousands)
| Nine Months Ended September 30, |
||||||||
| 2013 | 2012 | |||||||
| Cash flows from operating activities |
||||||||
| Net income |
$ | 47,601 | $ | 26,300 | ||||
| Adjustments: |
||||||||
| Depreciation and amortization |
62,682 | 67,955 | ||||||
| Amortization of deferred financing costs |
9,549 | 9,283 | ||||||
| Amortization of debt and related party notes payable discount |
17,813 | 14,873 | ||||||
| Loss on early extinguishment of debt |
1,895 | 4,487 | ||||||
| Write-off of deferred financing costs and debt discount |
2,501 | — | ||||||
| Prepayment penalty, excluded from loss on early extinguishment |
(2,093 | ) | — | |||||
| Stock-based compensation |
1,084 | 1,353 | ||||||
| Unrealized gain on derivative contracts |
(12,096 | ) | (24,194 | ) | ||||
| Interest on related party notes |
24,300 | 23,129 | ||||||
| Other, net |
471 | 231 | ||||||
| Changes in operating assets and liabilities: |
||||||||
| Trade and other receivable |
1,056 | 13,256 | ||||||
| Prepaid expenses and other current assets |
(16,624 | ) | (7,185 | ) | ||||
| Inventories |
96 | (5,477 | ) | |||||
| Accounts payable and accrued expenses |
(861 | ) | 15,194 | |||||
| Passenger deposits |
62,935 | 27,987 | ||||||
|
|
|
|
|
|||||
| Net cash provided by operating activities |
200,309 | 167,192 | ||||||
|
|
|
|
|
|||||
| Cash flows from investing activities |
||||||||
| Purchases of property and equipment |
(38,814 | ) | (471,436 | ) | ||||
| Settlement of derivative liability |
— | (70,267 | ) | |||||
| Proceeds from leasehold reimbursement |
245 | 7 | ||||||
| Change in restricted cash |
12,000 | (7,420 | ) | |||||
| Acquisition of non-compete |
(165 | ) | — | |||||
|
|
|
|
|
|||||
| Net cash used in investing activities |
(26,734 | ) | (549,116 | ) | ||||
|
|
|
|
|
|||||
| Cash flows from financing activities |
||||||||
| Proceeds from debt issuance |
300,000 | 838,984 | ||||||
| Debt related costs |
(14,512 | ) | (30,249 | ) | ||||
| Payments on other financing obligations |
(2,805 | ) | (2,000 | ) | ||||
| Original issue discount |
(3,000 | ) | (3,000 | ) | ||||
| Payments on long-term debt |
(329,010 | ) | (315,822 | ) | ||||
| Issuance of common stock |
1 | 7 | ||||||
| Acquisition of treasury stock |
(55 | ) | — | |||||
|
|
|
|
|
|||||
| Net cash (used in) provided by financing activities |
(49,381 | ) | 487,920 | |||||
|
|
|
|
|
|||||
| Effect of exchange rate changes on cash |
31 | 95 | ||||||
|
|
|
|
|
|||||
| Net increase in cash and cash equivalents |
124,225 | 106,091 | ||||||
| Cash and cash equivalents |
||||||||
| Beginning of period |
139,556 | 147,212 | ||||||
|
|
|
|
|
|||||
| End of period |
$ | 263,781 | $ | 253,303 | ||||
|
|
|
|
|
|||||
The accompanying notes are an integral part of these consolidated financial statements.
F-45
Table of Contents
NOTES TO CONSOLIDATED FINANCIAL STATEMENTS
(unaudited)
Note 1. General
Basis of Presentation
The accompanying consolidated financial statements include the accounts of Prestige Cruises International, Inc. (“PCI” or “we” or “us”) and its wholly owned subsidiaries, Prestige Cruise Holdings, Inc. (“PCH”), Oceania Cruises, Inc. and its subsidiaries (“OCI”), and Seven Seas Cruises S. DE R.L. and its subsidiaries (“SSC”), which operate cruise ships with destinations to Scandinavia, Russia, Alaska, the Caribbean, Panama Canal, South America, Europe, the Mediterranean, the Greek Isles, Africa, India, Asia, Canada and New England, Tahiti and the South Pacific, Australia and New Zealand. We are controlled by funds affiliated with Apollo Global Management, LLC (“Apollo”).
The accompanying interim consolidated financial statements include the accounts of PCI and its 100%-owned subsidiaries and have been prepared in accordance with generally accepted accounting principles in the United States. Certain information and footnote disclosures normally included in financial statements prepared in accordance with U.S. generally accepted accounting principles (“GAAP”) have been condensed or omitted pursuant to such rules and regulations. However, we believe that the disclosures herein are adequate to ensure the information presented is not misleading. These unaudited interim consolidated financial statements should be read in conjunction with the audited financial statements and the notes thereto for the year ended December 31, 2012.
Due to the seasonality of our business, our results of operations for the interim periods presented are not necessarily indicative of the operating results to be expected for any subsequent interim period or for our year ended December 31, 2012 reported in our consolidated financial statements or notes thereto. There have been no significant changes in our financial position or results of operations and cash flows as a result of the adoption of new accounting pronouncements or to our significant accounting policies that were disclosed in our audited financial statements for the year ended December 31, 2012.
The accompanying consolidated balance sheet at September 30, 2013, the consolidated statements of operations for the nine months ended September 30, 2013 and 2012, consolidated statements of comprehensive income for the nine months ended September 30, 2013 and 2012, and consolidated statements of cash flows for the nine months ended September 30, 2013 and 2012 are unaudited, and, in the opinion of management, contain all adjustments, consisting of only normal recurring adjustments, necessary for fair presentation.
Significant Accounting Policies
Property and Equipment
As of January 1, 2013 we changed our estimate for all our ships’ projected residual values. The change was triggered as we obtained recent sales information for luxury cruise ships that occurred in the three month period ended March 31, 2013. This new information, in conjunction with other comparable sale data points, was used in our analysis, which includes our consideration of anticipated technological changes, long-term cruise and vacation market conditions and replacement cost of similarly built vessels. As a result, we increased each ship’s projected residual value from 10% and 15% to 30%. The change in estimate has been applied prospectively as of January 1, 2013. The effect of the change on both operating income and net income for the nine month period ended September 30, 2013 is approximately $12.3 million of reduced depreciation expense. The estimated impact of this change for full year 2013 is a reduction of depreciation expense of approximately $16.4 million. We periodically review and evaluate these estimates and judgments based on historical experiences and new factors and circumstances. As part our ongoing reviews, our estimates may change in the future. If such changes are necessary, depreciation expense could be materially higher or lower.
F-46
Table of Contents
Earnings Per Share
Basic earnings per share is computed by dividing net income by the weighted-average number of shares outstanding during each period. Diluted earnings per share incorporates the incremental shares issuable upon conversion of potentially dilutive shares. A reconciliation between basic and diluted earnings per share for the nine month periods ended September 30 was:
| (in thousands, except per share data) | 2013 | 2012 | ||||||
| Net income |
$ | 47,601 | $ | 26,300 | ||||
| Basic weighted-average shares outstanding |
13,571,078 | 13,571,827 | ||||||
| Diluted weighted-average shares outstanding |
19,439,522 | 13,571,827 | ||||||
| Basic earnings per share |
$ | 3.51 | $ | 1.94 | ||||
| Diluted earnings per share |
2.45 | 1.94 | ||||||
New Accounting Pronouncements
As of January 1, 2013, we adopted Financial Accounting Standards Board ASU 2011-11, Disclosures about Offsetting Assets and Liabilities. It requires an entity to disclose information about offsetting and related arrangements to enable users of its financial statements to understand the effect of those arrangements on its financial position. In 2013, this pronouncement was enhanced by ASU 2013-1, Balance Sheet Offsetting. This update clarifies that ordinary receivables are not within the scope of ASU 2011-11 and it applies only to derivatives, repurchase agreements, reverse purchase agreements and other securities lending transactions. The adoption did not materially impact our consolidated financial statements.
In February 2013, the Financial Accounting Standards Board issued ASU 2013-02, Comprehensive Income (Topic 220): Reporting of Amounts Reclassified Out of Accumulated Other Comprehensive Income. It requires an entity to present the effects on the line items of net income of significant amounts reclassified out of accumulated other comprehensive income, but only if the item reclassified is required under GAAP to be reclassified to net income in its entirety in the same reporting period. Entities must also cross-reference to other disclosures currently required under GAAP for other reclassification items to be reclassified directly to net income in their entirety in the same reporting period. This standard was effective beginning January 1, 2013. Refer to Note 6. Accumulated Other Comprehensive Income for impact.
In July 2013, the Financial Accounting Standards Board issued ASU 2013-10, Inclusion of the Federal Funds Effective Swap Rate as a benchmark interest rate for hedge accounting purposes. This guidance is effective prospectively for qualifying new or redesignated hedging relationships entered into on or after July 17, 2013. We adopted this guidance as of July 17, 2013, and it did not have a material impact on our consolidated financial statements.
There are no other recently issued accounting pronouncements not yet adopted or recently issued pronouncements that we expect to have a material effect on the presentation or disclosure of our future consolidated operating results, cash flows or financial position.
F-47
Table of Contents
Note 2. Property and Equipment, net
During the nine months ended September 30, 2013, property and equipment, net decreased $18.7 million. Depreciation expense was $59.3 million and $64.9 million for the nine months ended September 30, 2013 and 2012, respectively. Capital expenditures totaled $39.8 million and $478.7 million for the nine months ended September 30, 2013 and 2012, respectively. Included in capital expenditures is a progress payment of approximately $22.0 million to the shipyard for Seven Seas Explorer (see footnote 7. Commitments and Contingencies—Other for additional information) for the nine months end September 30, 2013.
Note 3. Debt
Long-term bank debt and senior secured notes consist of the following:
| (in thousands) | September 30, 2013 |
December 31, 2012 |
||||||
| OCI term loan, first lien, due 2015 |
$ | — | $ | 231,688 | ||||
| OCI term loan, first lien, due through 2020 |
300,000 | — | ||||||
| OCI term loan, second lien, due 2014 |
— | 4,843 | ||||||
| OCI term loan, second lien, due 2015 |
— | 70,157 | ||||||
| OCI Marina newbuild debt, due through 2023 |
424,123 | 446,445 | ||||||
| OCI Riviera newbuild debt, due through 2024 |
471,611 | 471,611 | ||||||
| SSC term loan, first lien, due through 2018 |
296,250 | 296,250 | ||||||
| SSC senior secured notes, due 2019 |
225,000 | 225,000 | ||||||
|
|
|
|
|
|||||
| Total debt |
1,716,984 | 1,745,994 | ||||||
| Less: Debt discount |
(31,044 | ) | (32,778 | ) | ||||
|
|
|
|
|
|||||
| Carrying value of debt |
1,685,940 | 1,713,216 | ||||||
| Less: Current portion of long-term debt |
(72,352 | ) | (22,322 | ) | ||||
| Plus: Current portion of debt discount |
4,997 | 4,762 | ||||||
|
|
|
|
|
|||||
| Long-term portion |
$ | 1,618,585 | $ | 1,695,656 | ||||
|
|
|
|
|
|||||
Interest expense on third-party debt, including interest rate swaps, was $53.3 million (net of capitalized interest of $0.3 million) and $47.8 million (net of capitalized interest of $1.2 million) for the nine months ended September 30, 2013 and 2012, respectively.
SSC Term Loans
On February 1, 2013, SSC amended its previously existing $340.0 million credit agreement, consisting of a $300.0 million term loan and $40.0 million revolving credit facility. Interest on this term loan is calculated based upon LIBOR, with a floor of 1.25%, plus an applicable margin. In conjunction with this amendment, the applicable margin on the outstanding balance of $296.3 million was repriced to 3.5% from either 4.75% or 5.0% based on a leverage ratio in the original term loan. SSC paid $3.7 million of accrued interest, $3.0 million for a prepayment penalty, $1.3 million in arranger fees and $0.2 million in legal fees. There was no change to the terms of the revolving credit facility or the maturity date of the term loan. There was also no impact on financial covenants, liquidity or debt capacity.
We applied ASC 470-50 Debt—Modifications and Extinguishments to this transaction. After evaluating the criteria as applicable to syndicated loans, the re-pricing resulted in an extinguishment of debt for certain creditors whose balances were entirely re-paid. This repricing resulted in a debt modification for certain creditors whose terms were not substantially different before and after the amendment. The new fees paid and previously existing deferred financing costs were proportionally allocated between modification and extinguishment. Of the $4.4 million in fees, $3.1 million of the amendment fees were capitalized and are being amortized over the remaining term of the debt. New fees and previously existing deferred financing costs allocated to the extinguishment were included in the calculation of gain or loss on early extinguishment of debt, which resulted in a loss of $3.7 million and was recorded within other income (expense) in the consolidated statement operations for the nine months ended September 30, 2013.
F-48
Table of Contents
On July 31, 2013, SSC entered into a loan agreement providing for borrowings of up to $440.0 million with a syndicate of financial institutions to finance 80% of the contract cost of Seven Seas Explorer plus the export credit agency premium. Borrowings under this loan agreement will bear interest, at SSC’s election, at either (i) a fixed rate of 3.43% per year, or (ii) LIBOR plus 2.8% per year. SSC’s commitment fee is 1.1% per year on the undrawn loan amount. Guarantees under this loan agreement are provided by SSC and PCH. The twelve year fully amortizing loan requires semi-annual principal and interest payments commencing six months following the draw-down date.
OCI Term Loan
On July 2, 2013, OCI repaid its outstanding $231.7 million first lien term loan and $75.0 million second lien term loan. As part of this financing transaction, OCI entered into a new $375.0 million first lien credit facility consisting of a $300.0 million first lien term loan, which has a rate of LIBOR with a floor of 1% plus a margin of 5.75%, and includes an original issue discount of 1%. This transaction also included a new revolving credit facility of $75.0 million replacing its previous revolving credit facility of $35.0 million. We applied ASC 470-50 Debt—Modifications and Extinguishments to this transaction. After evaluating the criteria as applicable to syndicated loans, the refinancing resulted in both an extinguishment of debt for certain creditors whose balances were entirely re-paid, and a debt modification for certain creditors whose terms were not substantially different before and after the amendment. The new fees paid and previously existing deferred financing costs were proportionally allocated between modification and extinguishment. Of the $5.4 million in fees, $4.7 million were capitalized and are being amortized over the remaining term of the debt. New fees and previously existing deferred financing costs allocated to the extinguishment were included in the calculation of loss on early extinguishment of debt, which resulted in a loss of $1.9 million and was recorded within other income (expense) in the consolidated statement operations for the nine months ended September 30, 2013.
Our credit agreement contains a number of covenants that impose operating and financial restrictions, including restrictions on us and our subsidiaries’ ability to, among other things, incur additional indebtedness, pay dividends on or make distributions with respect to our capital stock, restrict certain transactions with affiliates, and sell certain key assets, primarily our ships. All of our debt is collateralized by our vessels. We believe that based on our cash on hand and expected future operating cash inflows, we will have sufficient cash flow to fund operations, meet our debt service requirements, and maintain compliance with the financial covenants under our credit agreements over the next twelve-month period.
The following schedule represents the maturities of long-term debt (in thousands):
| For the twelve months ending September 30, |
| |||
| 2014 |
$ | 72,352 | ||
| 2015 |
93,310 | |||
| 2016 |
95,560 | |||
| 2017 |
95,560 | |||
| 2018 |
95,560 | |||
| Thereafter |
1,264,642 | |||
|
|
|
|||
| $ | 1,716,984 | |||
|
|
|
|||
F-49
Table of Contents
Note 4. Related Party Notes Payable
Related party notes payable, including accrued interest, consists of the following:
| (in thousands) | September 30, 2013 |
December 31, 2012 |
||||||
| Apollo term notes, 5% interest, due April 27, 2017 |
$ | 377,858 | $ | 364,081 | ||||
| Apollo term notes, 5% interest, due June 19, 2017 |
68,206 | 65,714 | ||||||
| Apollo term notes, non-interest bearing, due January 31, 2018 |
187,431 | 187,431 | ||||||
| Apollo term notes, 5% interest, due May 18, 2019 |
62,062 | 59,789 | ||||||
| Non Apollo term notes, 5% interest, due August 1, 2019 |
16,286 | 15,697 | ||||||
| Apollo term notes, 5% interest, due December 24, 2019 |
30,122 | 29,020 | ||||||
| Non Apollo term notes, 5% interest, due December 31, 2019 |
13,195 | 12,711 | ||||||
| Apollo term notes, 5% interest, due May 6, 2020 |
61,420 | 59,172 | ||||||
| Apollo term notes, 5% interest, due October 26, 2020 |
26,739 | 25,764 | ||||||
| Non Apollo term notes, 5% interest, due November 19, 2020 |
9,840 | 9,480 | ||||||
|
|
|
|
|
|||||
| 853,159 | 828,859 | |||||||
| Less: Unamortized discount on related party notes payable |
(154,174 | ) | (167,555 | ) | ||||
|
|
|
|
|
|||||
| Long-term portion |
$ | 698,985 | $ | 661,304 | ||||
|
|
|
|
|
|||||
Interest expense on related party notes was $24.3 million and $23.1 million in the nine months ended September 30, 2013 and 2012, respectively, and has been added to long-term related party notes payable in the accompanying consolidated balance sheets. Debt discount accretion of $13.4 million and $11.4 million for the nine months ended September 30, 2013 and 2012, respectively, is included in interest expense, net in the consolidated statements of operations.
Note 5. Derivative Instruments, Hedging Activities and Fair Value Measurements
We are exposed to market risks attributable to changes in interest rates, foreign currency exchange rates and fuel prices. We manage these risks through a combination of our normal operating and financing activities and through the use of derivative financial instruments pursuant to our hedging practices and policies as described below. The financial impacts of these hedging instruments are primarily offset by corresponding changes in the underlying exposures being hedged. We achieve this by closely matching the amount, term and conditions of the derivative instrument with the underlying risk being hedged. We do not hold or issue derivative financial instruments for trading or other speculative purposes. We monitor our derivative positions using techniques including market valuations and sensitivity analyses.
F-50
Table of Contents
Fuel Price Risk
Our exposure to market risk for changes in fuel prices relates primarily to the consumption of fuel on our vessels. We use fuel derivative swap agreements to mitigate the financial impact of fluctuations in fuel prices. The fuel swaps do not qualify for hedge accounting; therefore, the changes in fair value of these fuel derivatives are recorded in other income (expense) in the accompanying consolidated statements of operations. As of September 30, 2013, we have hedged the variability in future cash flows for forecast fuel consumption through December 2015. As of September 30, 2013 and December 31, 2012, we have entered into the following fuel swap agreements:
| Fuel Swap Agreements | ||||||||
| As of September 30, 2013 | As of December 31, 2012 | |||||||
| (in barrels) | ||||||||
| 2013 |
170,100 | 528,975 | ||||||
| 2014 |
400,800 | 224,550 | ||||||
| 2015 |
101,100 | — | ||||||
| Fuel Swap Agreements | ||||||||
| As of September 30, 2013 | As of December 31, 2012 | |||||||
| (% hedged - estimated consumption) | ||||||||
| 2013 |
75 | % | 56 | % | ||||
| 2014 |
40 | % | 24 | % | ||||
| 2015 |
10 | % | — | |||||
We have certain fuel derivative contracts that are subject to margin requirements. For these specific fuel derivative contracts, we may be required to post collateral if the mark-to-market exposure exceeds $3.0 million. On any business day, the amount of collateral required to be posted is an amount equal to the difference between the mark-to-market exposure and $3.0 million. At September 30, 2013, we were not in a liability position related to this counterparty and therefore, we were not required to post any collateral for our fuel derivative instruments.
Interest Rate Risk
Our exposure to market risk for changes in interest rates relates to our long-term debt obligations including future interest payments. We use interest rate swap agreements to modify our exposure to interest rate fluctuations and to manage our interest expense.
In 2011, OCI entered into three forward starting interest rate swap agreements to hedge the variability of the interest payments related to the outstanding variable-rate debt associated with the Marina newbuild financing. The first swap, with an amortizing notional amount of $450.0 million at inception, was effective beginning January 19, 2012 and matured on January 19, 2013. The second swap, with an amortizing notional amount of $405.4 million became effective on January 19, 2013 and matures on January 19, 2014. The third swap, with an amortizing notional amount of $360.8 million becomes effective January 19, 2014 and matures on January 19, 2015. All three interest rate swaps are designated as cash flow hedges and qualify for hedge accounting treatment. The changes in fair value of the effective portion of the interest rate swaps are recorded as a component of accumulated other comprehensive loss on our consolidated balance sheets. There was no ineffectiveness recorded for the nine months ended September 30, 2013 and 2012.
In March 2013, OCI entered into two forward starting interest rate swap agreements to hedge the variability of the interest payments related to the outstanding variable-rate debt associated with the Riviera newbuild debt loan facility. The first swap has an amortizing notional amount of $422.4 million, became effective on October 28, 2013 and matures on October 27, 2014. The second swap has an amortizing notional amount of
F-51
Table of Contents
$377.6 million and will become effective on October 28, 2014, maturing on October 27, 2015. In addition to the two interest rate swap agreements mentioned above, OCI entered into another forward starting interest rate swap agreement to hedge the variability of the floating interest payments associated with the Marina newbuild debt. This swap has an amortizing notional amount of $300.0 million and will become effective on January 19, 2015, maturing on January 19, 2016. The interest rate swaps are designated as cash flow hedges and qualify for hedge accounting treatment. The changes in fair value of the effective portion of the interest rate swaps are recorded as a component of accumulated other comprehensive loss on our consolidated balance sheets. There was no ineffectiveness recorded for the nine month periods ended September 30, 2013 and 2012.
Foreign Currency Exchange Risk
Our exposure to foreign currency exchange risk is for changes in foreign exchange rates relating to our transactions denominated in currencies other than the U.S. dollar.
During 2012, we entered into foreign currency swaps with an aggregate notional amount of €2.8 million ($3.6 million as of December 31, 2012). These foreign currency swaps were used to limit the exposure to foreign currency exchange rates for payments related to vessel drydock and other operational expenses. The foreign currency swaps do not qualify for hedge accounting; therefore, the changes in fair values of these foreign currency derivatives are recorded in other income (expense) in the accompanying consolidated statements of operations. There were no outstanding foreign currency swap agreements as of September 30, 2013 and December 31, 2012.
During August 2013, SSC entered into a foreign currency collar option with an aggregate notional amount of €274.4 million ($365.8 million as of September 30, 2013), to hedge a portion of our foreign currency exposure related to the construction contract for Seven Seas Explorer. This foreign currency collar option was designated as a cash flow hedge at the inception of the instrument and will mature in June 2016. The change in fair value of the effective portion of the derivative was recorded as a component of accumulated other comprehensive income in the accompanying consolidated balance sheets. Ineffective portions of future changes in fair value of the instrument will be recognized in other income (expense) in the statement of operations. There was no ineffectiveness recorded as of September 30, 2013.
At September 30, 2013 and December 31, 2012 the fair values and line item captions of derivative instruments qualifying and designated as hedging instruments under FASB ASC 815-20 were:
| Fair Value as of | ||||||||||
| (in thousands) | Balance Sheet Location | September 30, 2013 | December 31, 2012 | |||||||
| Interest rate swaps |
Current liabilities - derivative liabilities | $ | 6,431 | $ | 2,206 | |||||
| Interest rate swaps |
Other long-term liabilities | 3,778 | 8,730 | |||||||
| Foreign currency collar |
Other long-term liabilities | 719 | — | |||||||
|
|
|
|
|
|||||||
| Total liabilities | $ | 10,928 | $ | 10,936 | ||||||
|
|
|
|
|
|||||||
F-52
Table of Contents
At September 30, 2013 and December 31, 2012, the fair values and line item captions of derivative instruments not designated as hedging instruments under FASB ASC 815-20 were:
| Fair Value as of | ||||||||||
| (in thousands) | Balance Sheet Location | September 30, 2013 | December 31, 2012 | |||||||
| Fuel hedges |
Other current assets | $ | 1,497 | $ | 1,179 | |||||
| Fuel hedges |
Other long-term assets | 150 | 1,608 | |||||||
|
|
|
|
|
|||||||
| Total derivative assets | $ | 1,647 | $ | 2,787 | ||||||
|
|
|
|
|
|||||||
| Fuel hedges |
Current liabilities - derivative liabilities | $ | — | $ | 278 | |||||
| Embedded derivatives |
Current liabilities - derivative liabilities | 1,348 | 3,760 | |||||||
| Embedded derivatives |
Other long-term liabilities | 4,745 | 15,330 | |||||||
| Fuel hedges |
Other long-term liabilities | 39 | — | |||||||
|
|
|
|
|
|||||||
| Total derivative liabilities | $ | 6,132 | $ | 19,368 | ||||||
|
|
|
|
|
|||||||
The effect of derivative instruments qualifying and designated as hedging instruments on the consolidated statements of operations for the nine months ended September 30, 2013 was:
| (in thousands) | Amount of Gain (Loss) Recognized in OCI on Derivative (Effective Portion) |
Location of Gain (Loss) From Accumulated
OCI Portion) |
Amount of Gain (Loss) Reclassified From Accumulated OCI Into Income (Effective Portion) |
Location of Gain (Loss) Recognized in Income on Derivative (Ineffective Portion Excluded From Effectiveness Testing) |
Amount of Gain Recognized in |
|||||||||||||
| Interest rate swap |
$ | 728 | N/A | $ | — | N/A | $ | — | ||||||||||
| Foreign currency collars |
(719 | ) | Depreciation and amortization expense |
(1,301 | ) | N/A | — | |||||||||||
|
|
|
|
|
|
|
|||||||||||||
| Total |
$ | 9 | $ | (1,301 | ) | — | ||||||||||||
|
|
|
|
|
|
|
|||||||||||||
The effect of derivative instruments qualifying and designated as hedging instruments on the consolidated statements of operations for the nine months ended September 30, 2012 was:
| (in thousands) | Amount of Gain (Loss) Recognized in OCI on Derivative (Effective Portion) |
Location of Gain (Loss) Reclassified From Accumulated OCI Into Income (Effective Portion) |
Amount of Gain (Loss) Reclassified From Accumulated OCI Into Income (Effective Portion) |
Location of Gain (Loss) Recognized in Income on Derivative (Ineffective Portion Excluded From Effectiveness Testing) |
Amount of Gain (Loss) Recognized in Income on Derivative (Ineffective Portion Excluded From Effectiveness Testing) |
|||||||||||||
| Interest rate swap |
$ | (4,367 | ) | N/A | $ | — | N/A | $ | — | |||||||||
| Foreign currency collars |
— | Depreciation and amortization expense |
(1,127 | ) | N/A | — | ||||||||||||
|
|
|
|
|
|
|
|||||||||||||
| Total |
$ | (4,367 | ) | $ | (1,127 | ) | $ | — | ||||||||||
|
|
|
|
|
|
|
|||||||||||||
F-53
Table of Contents
The effects of derivative instruments not designated as hedging instruments on the consolidated statements of operations for the nine months ended September 30, 2013 and September 30, 2012 were:
|
Location of Gain (Loss) |
Amount of Gain (Loss) Recognized in Income on Derivative Instruments |
|||||||||
| For the Nine Months Ended September 30, | ||||||||||
| (in thousands) | 2013 | 2012 | ||||||||
| Foreign currency swap |
Other income (expense) | $ | — | $ | (165 | ) | ||||
| Foreign currency collars |
Other income (expense) | — | 10,027 | |||||||
| Embedded derivatives |
Other income (expense) | 12,996 | 10,134 | |||||||
| Fuel hedges |
Other income (expense) | (474 | ) | 8,209 | ||||||
|
|
|
|
|
|||||||
| Total |
$ | 12,522 | $ | 28,205 | ||||||
|
|
|
|
|
|||||||
Fair Value Measurements
GAAP establishes a hierarchy for inputs used in measuring fair value that maximizes the use of observable inputs and minimizes the use of unobservable inputs by requiring that the most observable inputs be used when available. Observable inputs are inputs that market participants would use in pricing the asset or liability based on market data obtained from independent sources. Unobservable inputs are inputs that reflect our assumptions and that market participants would use in pricing the asset or liability based on the best available information under the circumstances. The hierarchy is broken down into three levels based on the reliability of the inputs as follows:
| • | Level 1 Inputs—Quoted prices (unadjusted) in active markets for identical assets or liabilities that the Company has the ability to access. |
| • | Level 2 Inputs—Inputs other than quoted prices included within Level 1 that are observable for the asset and liability, either directly or indirectly. |
| • | Level 3 Inputs—Inputs that are unobservable for the asset or liability. |
Fair Value of Financial Instruments
We use quoted prices in active markets when available to determine the fair value of our financial instruments. The fair value of our financial instruments that are not measured at fair value on a recurring basis are:
| (in thousands) | Carrying Value as of | Fair Value as of | ||||||||||||||
| September 30, 2013 |
December 31, 2012 |
September 30, 2013 |
December 31, 2012 |
|||||||||||||
| Long-term bank debt (a) |
$ | 1,460,940 | $ | 1,488,216 | $ | 1,415,769 | $ | 1,459,232 | ||||||||
| Senior secured notes |
225,000 | 225,000 | 245,025 | 239,063 | ||||||||||||
| Long-term related party payables |
698,985 | 661,304 | 884,380 | 632,724 | ||||||||||||
|
|
|
|
|
|
|
|
|
|||||||||
| Total |
$ | 2,384,925 | $ | 2,374,520 | $ | 2,545,174 | $ | 2,331,019 | ||||||||
|
|
|
|
|
|
|
|
|
|||||||||
| (a) | The carrying value of the long-term bank debt is net of $31.0 million and $32.8 million of debt discount as of September 30, 2013 and December 31, 2012, respectively. |
Long-term bank debt: Level 2 inputs were used to calculate the fair value of our long-term debt which was estimated using the present value of expected future cash flows which incorporates our risk profile. The valuation also takes into account debt maturity and interest rate based on the contract terms.
F-54
Table of Contents
Senior secured notes: Level 1 inputs were used to calculate the fair value of our Notes, which was estimated using quoted market prices.
Long-term related party notes payable: Level 2 and 3 inputs are utilized to derive the fair value of the our long-term related party notes payable. As described in Note 4, there are multiple classes of instruments (promissory notes, warrants and ordinary shares) that are issued. Therefore, we have utilized an option pricing methodology to determine fair value. Level 2 inputs used in this methodology are risk-free rates and volatility, which are identical to our assumptions used to calculate our fair value equity awards. Level 3 inputs include our aggregate equity value, time to liquidity event date, dividend yields and breakpoints, which consider the rights, privileges and preferences of the various classes of the instruments. Our aggregate equity value was estimated using a weighted average of income and market approach method. Also, our dividend yield used was 0% as we do not anticipate paying dividends in the foreseeable future. There have been no issuances or repayments of the related party notes during the nine months ended September 30, 2013. Also, there were no movements of financial instruments in or out of Level 3 during the nine months ended September 30, 2013 and 2012.
Other financial instruments: Due to their short-term maturities and no interest rate, currency or price risk, the carrying amounts of cash and cash equivalents, passenger deposits, accrued interest, and accrued expenses approximate their fair values as of September 30, 2013 and December 31, 2012. We consider these inputs to be Level 1 as all are observable and require no judgment for valuation.
The following table presents information about our financial instrument assets and liabilities that are measured at fair value on a recurring basis:
| (in thousands) | As of September 30, 2013 | As of December 31, 2012 | ||||||||||||||||||||||||||||||
| Description | Total | Level 1 | Level 2 | Level 3 | Total | Level 1 | Level 2 | Level 3 | ||||||||||||||||||||||||
| Assets |
||||||||||||||||||||||||||||||||
| Derivative financial instruments (a) |
$ | 1,647 | $ | — | $ | 1,647 | $ | — | $ | 2,787 | $ | — | $ | 2,787 | $ | — | ||||||||||||||||
|
|
|
|
|
|
|
|
|
|
|
|
|
|
|
|
|
|||||||||||||||||
| Total assets |
$ | 1,647 | $ | — | $ | 1,647 | $ | — | $ | 2,787 | $ | — | $ | 2,787 | $ | — | ||||||||||||||||
|
|
|
|
|
|
|
|
|
|
|
|
|
|
|
|
|
|||||||||||||||||
| Liabilities |
||||||||||||||||||||||||||||||||
| Derivative financial instruments (b) |
$ | 17,060 | $ | — | $ | 17,060 | $ | — | $ | 30,304 | $ | — | $ | 30,304 | $ | — | ||||||||||||||||
|
|
|
|
|
|
|
|
|
|
|
|
|
|
|
|
|
|||||||||||||||||
| Total liabilities |
$ | 17,060 | $ | — | $ | 17,060 | $ | — | $ | 30,304 | $ | — | $ | 30,304 | $ | — | ||||||||||||||||
|
|
|
|
|
|
|
|
|
|
|
|
|
|
|
|
|
|||||||||||||||||
| (a) | As of September 30, 2013, derivative financial instruments of $1.5 million are classified as other current assets and $0.1 million are classified as other long-term assets in the consolidated balance sheets. As of December 31, 2012, $1.2 million was classified as other current assets and $1.6 million was classified in other long-term assets. |
| (b) | As of September 30, 2013, derivative financial instruments of $7.8 million are classified as derivative liabilities and $9.3 million are classified as other long-term liabilities in the consolidated balance sheets. As of December 31, 2012, $6.2 million was classified as derivative liabilities and $24.1 million was classified in other long-term liabilities. |
Our derivative financial instruments consist of interest rate swaps, foreign currency exchange contracts, and fuel hedge swaps. Fair value is derived using the valuation models that utilize the income value approach. These valuation models take into account the contract terms such as maturity, and inputs such as forward interest rates, forward fuel prices, discount rates, creditworthiness of the counter party and us, as well as other data points. The data sources utilized in these valuation models that are significant to the fair value measurement are classified as Level 2 sources in the fair value input level hierarchy.
Our derivative financial instruments also consist of embedded derivatives. Fair value is derived using the valuation models that utilize the income value approach. These valuation models take into account contract terms such as maturity, and inputs such as forward interest rates, discount rates, IBOXX Euro Average, USD/EUR
F-55
Table of Contents
basis index, creditworthiness of the counter party and us, as well as other data points. The data sources utilized in these valuation models that are significant to the fair value measurement are classified as Level 2 sources in the fair value input level hierarchy.
Non-recurring Measurements of Non-financial Assets
Goodwill and indefinite-lived intangible assets not subject to amortization are reviewed for impairment on an annual basis or earlier if there is an event or change in circumstances that would indicate that the carrying value of these assets could not be fully recovered. If the carrying amount of the reporting unit exceeds the estimated discounted future cash flows, we measure the amount of the impairment by comparing the reporting unit of the asset to its fair value.
Other long-lived assets, such as our vessels, are reviewed for impairment whenever events or changes in circumstances indicate the carrying amount of an asset may not be recoverable. If the carrying amount of the asset exceeds the estimated expected undiscounted future cash flows, we measure the amount of the impairment by comparing the carrying amount of the asset to its fair value. The estimation of fair value measured by undiscounted or discounted expected future cash flows would be considered Level 3 inputs.
We performed our annual goodwill impairment test as of September 30, 2013. We bypassed the qualitative assessment and performed the two-step goodwill impairment test comparing estimated fair value to the carrying value of allocated net assets. Based on the discounted cash flow model, we determined that estimated fair value of the reporting unit exceeded the carrying value and, therefore, we did not proceed to step two of the impairment test. The fair value exceeded its carrying value by 62% as of September 30, 2013. The principal assumptions used in our cash flow model related to forecasting future operating results include discount rate, net revenue yields, net cruise costs including fuel prices, capacity changes, weighted-average cost of capital for comparable publicly-traded companies and terminal values, which are all considered level 3 inputs. Cash flows were calculated using our 2013 projected operating results as a base. To that base we added projected future years’ cash flows, considering the macro-economic factors and internal occupancy level projections, cost structure and other variables. We discounted the projected future years’ cash flows using a rate equivalent to our weighted-average cost of capital.
We performed our annual indefinite-lived intangible assets impairment test on our trade name as of September 30, 2013 using the relief-from-royalty method. We bypassed the qualitative assessment and performed the quantitative impairment test comparing the asset’s estimated fair value to its carrying value. The royalty rate used is based on comparable royalty agreements in the tourism and hospitality industry, which was applied to the projected revenue to estimate the royalty savings and discounted to fair value. The discount rate used was identical to the rate used in our goodwill quantitative test. Based on the results of the discounted cash flow model, we determined that estimated fair value of our trade name exceeded its carrying value by 86% as of September 30, 2013 and therefore we did not proceed to step two of the impairment test.
The estimation of fair value utilizing discounted expected future cash flows includes numerous uncertainties that require significant judgments when developing assumptions of expected revenues, operating costs, selling and administrative expenses, capital expenditures and future impact of competitive forces. It is reasonably possible that changes in our assumptions and projected operating results used in our cash flow model could lead to an impairment of goodwill and or trade name.
F-56
Table of Contents
Note 6. Accumulated Other Comprehensive Loss
The following schedule represents the changes in accumulated other comprehensive loss by component for the nine months ended September 30, 2013 (in thousands):
| Beginning Balance |
$ | (60,319 | ) | |
|
|
|
|||
| Other comprehensive income before reclassifications |
9 | |||
| Amount reclassified from accumulated other comprehensive income |
1,301 | |||
|
|
|
|||
| Net current-period other comprehensive income |
1,310 | |||
|
|
|
|||
| Ending balance |
$ | (59,009 | ) | |
|
|
|
The amount reclassified from accumulated other comprehensive income was recorded in depreciation and amortization expense in the statement of operations. The amount estimated to be reclassified from accumulated other comprehensive income for the twelve months ended September 30, 2014 is $1.7 million.
Note 7. Commitments and Contingencies
Contingencies —Litigation
On an ongoing basis, we assess the potential liabilities related to any lawsuits or claims brought against us. While it is typically very difficult to determine the timing and ultimate outcome of such actions, we use our judgment to determine if it is probable that we will incur an expense related to the settlement or final adjudication of such matters and whether a reasonable estimation of such probable loss can be made. In assessing probable losses, we take into consideration estimates of the amount of insurance recoveries, if any. We accrue a liability when we believe a loss is probable and the amount of loss can be reasonably estimated. The majority of claims are covered by insurance and we believe the outcome of such claims, net of estimated insurance recoveries, will not have a material adverse impact on our financial condition or results of operations and cash flows.
Other
As mandated by the Federal Maritime Commission for sailings from U.S. ports, the availability of passenger deposits received for future sailings is restricted until the completion of the related sailing. OCI and SSC each meet this obligation by separately posting a $15.0 million surety bond.
On January 31, 2013 SSC’s former President stepped down from his role and became a consultant to SSC. We entered into a Separation Agreement and a Independent Contractor Agreement with our former president. Severance of $0.7 million was paid pursuant to his employment agreement. The Independent Contractor Agreement has a term of 24 months and has been treated as an intangible asset. At inception, the non-compete clause within the agreement was valued at $0.6 million and represents an intangible asset in accordance with ASC 350—Intangibles. The intangible asset has a finite useful life and is being amortized over the term of the agreement. For the nine months ended September 30, 2013, SSC paid $0.2 million under this agreement. SSC’s estimated amortization expense is $0.3 million for each year for the periods ended December 31, 2013 and 2014.
On March 22, 2013, our Chairman and Chief Executive Officer agreed to amend and extend his executive employment agreement with PCI through December 31, 2016. The amendment modifies certain terms of his existing employment agreement.
On July 5, 2013, SSC entered into a definitive contract with Italy’s Fincantieri shipyard to build a luxury cruise ship to be named the Seven Seas Explorer. Under the terms of the contract, SSC will pay approximately $450.0 million to Fincantieri for the new vessel. During July 2013, SSC made a payment of approximately $22.0 million to Fincantieri for the initial installment payment for Seven Seas Explorer.
F-57
Table of Contents
Note 8. Subsequent Events
In October 2013, our lender notified us that the adjusted spread being applied to the margin on the Oceania newbuild loan agreements would cease to apply as of the next interest period rate reset for each respective agreement. For the Riviera Loan, the floating interest rate becomes based on six-month LIBOR plus a margin of 0.55% as of October 27, 2013. For the Marina Loan, the floating interest rate becomes based on six-month LIBOR plus a margin of 0.55% as of January 19, 2014. All other provisions of the loan agreements remain in full force and effect.
F-58
Table of Contents
SCHEDULE I
Condensed Financial Information of Parent Company
BASIS OF PRESENTATION
The Parent Company follows the accounting policies as described in the consolidated financial statements of Prestige Cruises International, Inc. and subsidiaries (“PCI”) with the exception of its investment in its subsidiary for which the Parent Company uses the equity method of accounting. For further information, reference should be made to the notes to the audited consolidated financial statements of PCI.
Our operating companies credit agreements include various restrictions on the ability to make dividends and distributions to their parent entities and ultimately to us. The following are restricted net assets of our subsidiary at September 30, 2013, December 31, 2012 and December 31, 2011, respectively: $576.4 million, $458.6 million and $442.9 million.
Condensed Unaudited Balance Sheets
(in thousands, except par value)
| As of September 30, | As of December 31, | |||||||||||
| 2013 | 2012 | 2011 | ||||||||||
| Assets |
||||||||||||
| Cash and cash equivalents |
$ | 28,407 | $ | 28,391 | $ | 43,301 | ||||||
| Restricted Cash |
30,000 | — | — | |||||||||
|
|
|
|
|
|
|
|||||||
| Total current assets |
58,407 | 28,391 | 43,301 | |||||||||
| Other assets |
— | 30,000 | 15,000 | |||||||||
| Investment in subsidiary |
677,156 | 589,570 | 547,014 | |||||||||
|
|
|
|
|
|
|
|||||||
| Total assets |
$ | 735,563 | $ | 647,961 | $ | 605,315 | ||||||
|
|
|
|
|
|
|
|||||||
| Liabilities and Stockholders’ Equity (Deficit) |
||||||||||||
| Long-term debt |
$ | 698,985 | $ | 661,304 | $ | 615,143 | ||||||
|
|
|
|
|
|
|
|||||||
| Total liabilities |
698,985 | 661,304 | 615,143 | |||||||||
| Stockholders’ equity (deficit) |
||||||||||||
| Ordinary shares, $0.01 par value |
136 | 136 | 136 | |||||||||
| Additional paid-in capital |
306,651 | 305,642 | 303,506 | |||||||||
| Accumulated deficit |
(211,200 | ) | (258,802 | ) | (256,190 | ) | ||||||
| Accumulated other comprehensive loss |
(59,009 | ) | (60,319 | ) | (57,280 | ) | ||||||
|
|
|
|
|
|
|
|||||||
| Total stockholders’ equity (deficit) |
36,578 | (13,343 | ) | (9,828 | ) | |||||||
|
|
|
|
|
|
|
|||||||
| Total liabilities and stockholders’ equity (deficit) |
$ | 735,563 | $ | 647,961 | $ | 605,315 | ||||||
|
|
|
|
|
|
|
|||||||
F-59
Table of Contents
Condensed Unaudited Statement of Income (Loss) and Comprehensive Income (Loss)
(in thousands, except per share data)
| For the Nine Months Ended September 30, |
For the Years Ended December 31, | |||||||||||||||||||
| 2013 | 2012 | 2012 | 2011 | 2010 | ||||||||||||||||
| Expenses |
||||||||||||||||||||
| Selling and administrative |
$ | 13 | $ | 23 | $ | 33 | $ | 33 | $ | 23 | ||||||||||
|
|
|
|
|
|
|
|
|
|
|
|||||||||||
| Total operating expenses |
13 | 23 | 33 | 33 | 23 | |||||||||||||||
| Non-operating income (expense) |
||||||||||||||||||||
| Interest expense |
(37,679 | ) | (34,569 | ) | (46,161 | ) | (42,409 | ) | (36,534 | ) | ||||||||||
| Interest income |
82 | 87 | 116 | 229 | 204 | |||||||||||||||
|
|
|
|
|
|
|
|
|
|
|
|||||||||||
| Total non-operating expense |
(37,597 | ) | (34,482 | ) | (46,045 | ) | (42,180 | ) | (36,330 | ) | ||||||||||
|
|
|
|
|
|
|
|
|
|
|
|||||||||||
| Loss before equity in net income (loss) of subsidiary |
(37,610 | ) | (34,505 | ) | (46,078 | ) | (42,213 | ) | (36,354 | ) | ||||||||||
| Equity in net income (loss) of subsidiary |
85,211 | 60,805 | 43,466 | (27,559 | ) | (25,767 | ) | |||||||||||||
|
|
|
|
|
|
|
|
|
|
|
|||||||||||
| Net income (loss) and comprehensive income (loss) |
$ | 47,601 | $ | 26,300 | $ | (2,612 | ) | $ | (69,772 | ) | $ | (62,120 | ) | |||||||
|
|
|
|
|
|
|
|
|
|
|
|||||||||||
| Earnings (loss) per share: |
||||||||||||||||||||
| Basic |
$ | 3.51 | $ | 1.94 | $ | (0.19 | ) | $ | (5.14 | ) | $ | (4.60 | ) | |||||||
| Diluted |
$ | 2.45 | $ | 1.94 | $ | (0.19 | ) | $ | (5.14 | ) | $ | (4.60 | ) | |||||||
| Weighted average number of share outstanding |
||||||||||||||||||||
| Basic |
13,571,078 | 13,571,827 | 13,571,827 | 13,564,766 | 13,501,572 | |||||||||||||||
|
|
|
|
|
|
|
|
|
|
|
|||||||||||
| Diluted |
19,439,522 | 13,571,827 | 13,571,827 | 13,564,766 | 13,501,572 | |||||||||||||||
|
|
|
|
|
|
|
|
|
|
|
|||||||||||
F-60
Table of Contents
Condensed Unaudited Statement of Cash Flows
(in thousands)
| Nine Months Ended September 30, |
Year Ended December 31, | |||||||||||||||||||
| 2013 | 2012 | 2012 | 2011 | 2010 | ||||||||||||||||
| Cash flows from operating activities |
| |||||||||||||||||||
| Net income (loss) |
$ | 47,601 | $ | 26,300 | $ | (2,612 | ) | $ | (69,772 | ) | $ | (62,120 | ) | |||||||
| Adjustments to reconcile net loss to net cash provided by operating activities: |
||||||||||||||||||||
| Amortization of related party debt discount |
13,380 | 11,440 | 15,253 | 12,990 | 10,689 | |||||||||||||||
| Interest on related party notes |
24,300 | 23,128 | 30,908 | 29,418 | 25,847 | |||||||||||||||
| Equity in earnings of subsidiary |
(85,211 | ) | (60,805 | ) | (43,466 | ) | 27,559 | 25,767 | ||||||||||||
|
|
|
|
|
|
|
|
|
|
|
|||||||||||
| Net cash provided by operating activities |
70 | 63 | 83 | 195 | 183 | |||||||||||||||
|
|
|
|
|
|
|
|
|
|
|
|||||||||||
| Cash flows from investing activities |
||||||||||||||||||||
| Capital contribution |
— | — | — | — | (100,064 | ) | ||||||||||||||
| Change in restricted cash |
— | — | — | 20,057 | (20,057 | ) | ||||||||||||||
|
|
|
|
|
|
|
|
|
|
|
|||||||||||
| Net cash provided by (used in) investing activities |
— | — | — | 20,057 | (120,121 | ) | ||||||||||||||
|
|
|
|
|
|
|
|
|
|
|
|||||||||||
| Cash flows from financing activities |
||||||||||||||||||||
| Proceeds from issuance of related party notes payable |
— | — | — | — | 108,271 | |||||||||||||||
| Change in restricted cash—newbuild letter of credit |
— | (15,000 | ) | (15,000 | ) | (15,000 | ) | — | ||||||||||||
| Proceeds from stock subscription |
— | — | — | 195 | 1,366 | |||||||||||||||
| Issuance of common stock |
1 | 7 | 7 | 164 | 32 | |||||||||||||||
| Acquisition of treasury stock |
(55 | ) | — | — | — | — | ||||||||||||||
|
|
|
|
|
|
|
|
|
|
|
|||||||||||
| Net cash (used in) provided by financing activities |
(54 | ) | (14,993 | ) | (14,993 | ) | (14,641 | ) | 109,669 | |||||||||||
|
|
|
|
|
|
|
|
|
|
|
|||||||||||
| Net increase (decrease) in cash and cash equivalents |
$ | 16 | $ | (14,930 | ) | $ | (14,910 | ) | $ | 5,611 | $ | (10,269 | ) | |||||||
|
|
|
|
|
|
|
|
|
|
|
|||||||||||
| Cash and cash equivalents |
||||||||||||||||||||
| Beginning of period |
$ | 28,391 | $ | 43,301 | $ | 43,301 | $ | 37,690 | $ | 47,959 | ||||||||||
| End of period |
28,407 | 28,371 | 28,391 | 43,301 | 37,690 | |||||||||||||||
|
|
|
|
|
|
|
|
|
|
|
|||||||||||
| Net increase (decrease) in cash and cash equivalents |
$ | 16 | $ | (14,930 | ) | $ | (14,910 | ) | $ | 5,611 | $ | (10,269 | ) | |||||||
|
|
|
|
|
|
|
|
|
|
|
|||||||||||
| Non-cash Supplemental Cash Flow Information: | ||||||||||||||||||||
| Investing activities |
||||||||||||||||||||
| Increase (decrease) in investment in subsidiary |
$ | 2,553 | $ | (638 | ) | $ | (910 | ) | $ | 37,243 | $ | (8,238 | ) | |||||||
| Financing activities |
||||||||||||||||||||
| Issuance of common stock warrants |
— | — | — | — | 46,522 | |||||||||||||||
| Discount on related party notes payable |
— | — | — | — | (46,522 | ) | ||||||||||||||
| Issuance of common stock in lieu of vendor payment |
— | — | — | — | 1,969 | |||||||||||||||
| Issuance of related party notes payable/stock subscription receivable |
— | — | — | — | 195 | |||||||||||||||
F-61
Table of Contents
The following table represents Prestige Cruises International, Inc. valuation and qualifying account activity for the year-ended December 31, 2010, 2011 and 2012 (in thousands):
| Description |
Balance at beginning of period 1/1/2010 |
Charged to costs and expenses |
Deductions | Balance at end of period 12/31/2010 |
||||||||||||
| Allowance for doubtful accounts |
$ | (100 | ) | $ | (52 | ) | $ | 75 | $ | (77 | ) | |||||
| Reserve for obsolescence—spare parts |
— | (449 | ) | — | (449 | ) | ||||||||||
|
|
|
|
|
|
|
|
|
|||||||||
| $ | (100 | ) | $ | (501 | ) | $ | 75 | $ | (526 | ) | ||||||
|
|
|
|
|
|
|
|
|
|||||||||
| Description |
1/1/2011 | Charged to costs and expenses |
Deductions | 12/31/2011 | ||||||||||||
| Allowance for doubtful accounts |
$ | (77 | ) | $ | — | $ | 48 | $ | (29 | ) | ||||||
| Reserve for obsolescence—spare parts |
(449 | ) | (377 | ) | 435 | (391 | ) | |||||||||
|
|
|
|
|
|
|
|
|
|||||||||
| $ | (526 | ) | $ | (377 | ) | $ | 483 | $ | (420 | ) | ||||||
|
|
|
|
|
|
|
|
|
|||||||||
| Description |
1/1/2012 | Charged to costs and expenses |
Deductions | 12/31/2012 | ||||||||||||
| Allowance for doubtful accounts |
$ | (29 | ) | $ | (320 | ) | $ | 160 | $ | (189 | ) | |||||
| Reserve for obsolescence—spare parts |
(391 | ) | (545 | ) | 57 | (879 | ) | |||||||||
|
|
|
|
|
|
|
|
|
|||||||||
| $ | (420 | ) | $ | (865 | ) | $ | 217 | $ | (1,068 | ) | ||||||
|
|
|
|
|
|
|
|
|
|||||||||
F-62
Table of Contents
Table of Contents
Part II
Information Not Required in Prospectus
Item 13. Other Expenses of Issuance and Distribution.
The following sets forth the estimated expenses and costs (other than underwriting discounts and commissions) expected to be incurred in connection with the issuance and distribution of the common stock registered hereby:
| SEC registration fee |
$ | 32,200 | ||
| FINRA filing fee |
* | |||
| Exchange listing fees |
* | |||
| Printing and engraving expenses |
* | |||
| Accounting fees and expenses |
* | |||
| Legal fees and expenses |
* | |||
| Blue Sky fees and expenses |
* | |||
| Transfer agent fees and expenses |
* | |||
| Miscellaneous |
* | |||
|
|
|
|||
| Total |
$ | * | ||
|
|
|
| * | To be provided by amendment. |
Item 14. Indemnification of Directors and Officers.
According to our Articles of Incorporation, to the fullest extent permitted by the applicable laws of the Republic of Panama, a director of our company shall not be personally liable to us or our subsidiaries for monetary damages or breach of a fiduciary duty as a director. We shall indemnify to the fullest extent permitted by law any person made or threatened to be made a party to an action or proceeding, whether criminal, civil, administrative, or investigative, by reason of the fact that he or she or his or her testator or intestate is or was a director of us or any of our subsidiaries, or serves or served at any other enterprise as director at our request, or acted at the direction of any such director against all expense, liability and loss actually and reasonably incurred or suffered by such person in connection therewith. We may enter into indemnity agreements with any director, officer, employee or agent of our company providing indemnification to the full extent permitted by the law and to purchase insurance for the benefit of the directors.
Item 15. Recent Sales of Unregistered Securities.
The following is a summary of our transactions since December 15, 2010 involving sales of our securities that were not registered under the Securities Act.
On January 31, 2013, we granted Mark S. Conroy, the former President of Regent, an option to purchase 100,000 ordinary shares under our 2008 Stock Option Plan at a price per share of the greater of $8.85 or Fair Market Value (as defined in the 2008 Stock Option Plan), in connection with his entry into a Separation Agreement and an Independent Contractor Agreement.
The sale and issuance of securities described in paragraph 1 above was made in reliance on Section 4(2) of the Securities Act in transactions by an issuer not involving a public offering where the purchasers were accredited investors within the meaning of Rule 501(a) under the Securities Act or were otherwise sophisticated, where the securities contained appropriate legends and transfer restrictions reflecting an intention not to purchase the securities with a view to any distribution, and where the purchasers received or had access to adequate information about us. The sale and issuance of securities described in paragraph 2 was made in reliance on Rule 701 promulgated under the Securities Act in that such securities were offered and sold pursuant to a written compensatory benefit plan.
II-1
Table of Contents
Item 16. Exhibits
| (a) | See the Exhibit Index immediately following the signature pages included in this Registration Statement. |
| (b) | Financial Statement Schedules: |
Schedules for the years ended December 31, 2012, 2011 and 2010 and for the nine months ended September 30, 2013 and 2012 are as follows:
Schedule I—Condensed Financial Information of Parent Company
Schedule II—Valuation and Qualifying Accounts
Item 17. Undertakings
The undersigned registrant hereby undertakes to provide to the underwriter at the closing specified in the underwriting agreements, certificates in such denominations and registered in such names as required by the underwriter to permit prompt delivery to each purchaser.
Insofar as indemnification for liabilities arising under the Securities Act of 1933 may be permitted to directors, officers and controlling persons of the registrant pursuant to the foregoing provisions, or otherwise, the registrant has been advised that in the opinion of the Securities and Exchange Commission such indemnification is against public policy as expressed in the Act and is, therefore, unenforceable. In the event that a claim for indemnification against such liabilities (other than the payment by the registrant of expenses incurred or paid by a director, officer or controlling person of the registrant in the successful defense of any action, suit or proceeding) is asserted by such director, officer or controlling person in connection with the securities being registered, the registrant will, unless in the opinion of its counsel the matter has been settled by controlling precedent, submit to a court of appropriate jurisdiction the question whether such indemnification by it is against public policy as expressed in the Act and will be governed by the final adjudication of such issue.
The undersigned registrant hereby undertakes that:
| (1) | For purposes of determining any liability under the Securities Act of 1933, the information omitted from the form of prospectus filed as part of this registration statement in reliance upon Rule 430A and contained in a form of prospectus filed by the registrant pursuant to Rule 424(b)(1) or (4) or 497(h) under the Securities Act shall be deemed to be part of this registration statement as of the time it was declared effective. |
| (2) | For the purpose of determining any liability under the Securities Act of 1933, each post-effective amendment that contains a form of prospectus shall be deemed to be a new registration statement relating to the securities offered therein, and the offering of such securities at that time shall be deemed to be the initial bona fide offering thereof. |
II-2
Table of Contents
SIGNATURES
Pursuant to the requirements of the Securities Act of 1933, the registrant has duly caused this registration statement to be signed on its behalf by the undersigned, thereunto duly authorized, in the City of Miami, State of Florida, on January 22, 2014.
| Prestige Cruises International, Inc. | ||
| By: | /s/ Jason M. Montague | |
| Name: Jason M. Montague Title: Chief Financial Officer | ||
Pursuant to the requirements of the Securities Act of 1933, this registration statement has been signed below by the following persons in the following capacities on January 22, 2014.
| Signature |
Title | |
| * Frank J. Del Rio |
Chief Executive Officer and Chairman of the Board of Directors (Principal Executive Officer) | |
| /s/ Jason M. Montague Jason M. Montague |
Chief Financial Officer (Principal Financial and Accounting Officer) | |
| * Adam M. Aron |
Director | |
| * Kevin E. Crowe |
Director | |
| * Russell W. Galbut |
Director | |
| * Daniel M. Holtz |
Director | |
| * Steve Martinez |
Director | |
| * Eric L. Press |
Director | |
| *By: | /s/ Jason M. Montague | |
| Jason M. Montague Attorney-in-fact | ||
II-3
Table of Contents
EXHIBIT INDEX
| Exhibit Number |
Description | |
| 1.1* | Form of Underwriting Agreement. | |
| 3.1* | Form of Amended and Restated Certificate of Incorporation of Prestige Cruises International, Inc. | |
| 3.2* | Form of Amended and Restated Bylaws of Prestige Cruises International, Inc. | |
| 4.1* | Form of Specimen Common Stock Certificate of Prestige Cruises, International, Inc. | |
| 5.1* | Legal Opinion of Arias, Fabrega & Fabrega. | |
| 10.1* | Stockholders’ Agreement, dated May 18, 2009. | |
| 10.2** | 2008 Stock Option Plan of Prestige Cruises International, Inc. (Incorporated by reference to the exhibit to Seven Seas Cruises S. DE R.L.’s Registration Statement on Form S-4/A filed March 1, 2012) | |
| 10.3** | Form Incentive Stock Option Agreement of Prestige Cruises International, Inc. (Incorporated by reference to the exhibit to Seven Seas Cruises S. DE R.L.’s Registration Statement on Form S-4/A filed March 1, 2012) | |
| 10.4** | Employment Agreement, dated March 22, 2013, between Prestige Cruises International, Inc. and Frank J. Del Rio (Incorporated by reference to the exhibit to Seven Seas Cruises S. DE R.L.’s Quarterly Report on Form 10-Q filed May 10, 2013). | |
| 10.5* | Employment Agreement, dated January 1, 2013, between Prestige Cruises Services, LLC and Jason M. Montague. | |
| 10.6* | Employment Agreement, dated January 1, 2014, between Prestige Cruises Services, LLC and Robert J. Binder. | |
| 10.7** | Employment Agreement, dated June 17, 2011, between Prestige Cruise Holdings, Inc., Oceania Cruises, Inc. and Kunal S. Kamlani. (Incorporated by reference to the exhibit to Seven Seas Cruises S. DE R.L.’s Registration Statement on Form S-4/A filed March 1, 2012) | |
| 10.8* | Employment Agreement, dated January 1, 2012, between Prestige Cruises Services, LLC and T. Robin Lindsay. | |
| 10.9** | Credit Agreement, dated as of August 21, 2012, among Classic Cruises, LLC and Classic Cruises II, LLC, Seven Seas Cruises S. DE R.L. and SSC Finance Corp., as Borrowers, the lenders party thereto, Deutsche Bank AG, New York Branch, as Administrative Agent and as Collateral Agent, Barclays Bank PLC, as Syndication Agent, Crédit Agricole Corporate and Investment Bank, as Co-Manager, Deutsche Bank Securities Inc., Barclays Bank PLC, HSBC Securities (USA) Inc. and J.P. Morgan Securities, LLC, as Joint Bookrunners, and Deutsche Bank Securities Inc. and Barclays Bank PLC, as Co-Lead Arrangers. (Incorporated by reference to the exhibit to Seven Seas Cruises S. DE R.L.’s Quarterly Report on Form 10-Q filed November 8, 2012) | |
| 10.10** | Amendment No. 1 to Credit Agreement, dated as of February 1, 2013, among Classic Cruises, LLC and Classic Cruises II, LLC, Seven Seas Cruises S. DE R.L. and SSC Finance Corp., as Borrowers and Deutsche Bank Securities AG, New York Branch, as the Administrative Agent, Collateral Agent and Term B-1 Lender to the Credit Agreement, dated as of August 21, 2012. (Incorporated by reference to the exhibit to Seven Seas Cruises S. DE R.L.’s Annual Report on Form 10-K filed March 8, 2013) | |
Table of Contents
| Exhibit Number |
Description | |
| 10.11* | Credit Agreement, dated as of July 2, 2013, among Oceania Cruises, Inc. and OCI Finance Corp., as Borrowers, the lenders party thereto, Deutsche Bank AG, New York Branch, as Administrative Agent, Collateral Agent and as Mortgage Trustee, Barclays Bank plc and UBS Securities LLC, as Co-Syndication Agents, HSBC Securities (USA) Inc. and Crédit Agricole Corporate and Investment Bank, as Co-Documentation Agents, Deutsche Bank Securities Inc., Barclays Bank plc, UBS Securities LLC, HSBC Securities (USA) Inc. and Crédit Agricole Corporate and Investment Bank, as Joint Bookrunners, and Deutsche Bank Securities Inc., Barclays Bank plc and UBS Securities LLC, as Joint Lead Arrangers. | |
| 10.12** | Indenture, dated as of May 19, 2011, among Seven Seas Cruises S. DE R.L., as Issuer, Celtic Pacific (UK) Two Limited, Supplystill Limited, Regent Seven Seas Cruises UK Limited, Celtic Pacific (UK) Limited, SSC (France) LLC and Mariner, LLC, as Subsidiary Guarantors and Wilmington Trust FSB, as Trustee and Collateral Agent. (Incorporated by reference to the exhibit to Seven Seas Cruises S. DE R.L.’s Registration Statement on Form S-4 filed November 30, 2011) | |
| 10.13* | Loan Agreement, dated July 18, 2008, among Marina New Build, LLC, as Borrower, the banks and financial institutions listed in Schedule 1 as Lenders, Calyon and Société Générale, as Mandated Lead Arrangers and Calyon, as Agent and SACE Agent. | |
| 10.14* | Loan Agreement, dated July 18, 2008, among Riviera New Build, LLC, as Borrower, the banks and financial institutions listed in Schedule 1 as Lenders, Calyon and Société Générale, as Mandated Lead Arrangers and Calyon, as Agent and SACE Agent. | |
| 10.15** | Loan Agreement, dated July 31, 2013, among Explorer New Build, LLC, the banks and financial institutions listed in Schedule 1 as Lenders, Crédit Agricole Corporate and Investment Bank, Société Générale, HSBC Bank plc and KFW IPEX-Bank GmbH, as Joint Mandated Lead Arrangers and Crédit Agricole Corporate and Investment Bank, as Agent, SACE Agent and Security Trustee. (Incorporated by reference to the exhibit to Seven Seas Cruises S. DE R.L.’s Quarterly Report on Form 10-Q filed November 8, 2013) | |
| 10.16** | Shipbuilding Contract, dated June 5, 2013, between Fincantieri Cantieri Navali Italiani SpA and Explorer New Build, LLC. (Incorporated by reference to the exhibit to Seven Seas Cruises S. DE R.L.’s Quarterly Report on Form 10-Q filed November 8, 2013) | |
| 21.1 | Subsidiaries of Prestige Cruises International, Inc. | |
| 23.1 | Consent of PricewaterhouseCoopers LLP. | |
| 23.2* | Consent of Arias, Fabrega & Fabrega (included in Exhibit 5.1). | |
| 24.1 | Power of Attorney (included on signature page herein). | |
| * | To be filed by amendment |
| ** | Incorporated by reference. |