Attached files
| file | filename |
|---|---|
| 8-K - 8-K - Starwood Waypoint Homes | a14-3983_18k.htm |
| EX-99.1 - EX-99.1 - Starwood Waypoint Homes | a14-3983_1ex99d1.htm |
Exhibit 99.2
|
|
Starwood Waypoint Residential Trust Investor Presentation | January 2014 |
|
|
Forward-Looking Statements This presentation contains certain “forward looking statements” that are subject to risks and uncertainties. These forward looking statements include information about possible or assumed future results of our business, financial condition, liquidity, results of operations, plans and objectives. When we use the words “believe,” “expect,” “anticipate,” “estimate,” “plan,” “continue,” “intend,” “should,” “may” or similar expressions, we intend to identify forward looking statements. Forward looking statements are based on certain assumptions, discuss future expectations, describe future plans and strategies, contain financial and operating projections or state other forward looking information. Our ability to predict results or the actual effect of future events, actions, plans or strategies is inherently uncertain. Although we believe that the expectations reflected in such forward looking statements are based on reasonable assumptions, our actual results and performance could differ materially from those set forth in, or implied by, the forward looking statements. Factors that could materially and adversely affect our business, financial condition, liquidity, results of operations and prospects, as well as our ability to make distributions to our shareholders, include, but are not limited to: the factors referenced in the information statement exhibit to our Form 10 (the “Information Statement”), including those set forth under the section captioned “Risk Factors”; expectations regarding the timing of generating additional revenues; changes in our business and growth strategies; volatility in the real estate industry, interest rates and spreads, the debt or equity markets, the economy generally or the rental home market specifically, whether the result of market events or otherwise; events or circumstances which undermine confidence in the financial markets or otherwise have a broad impact on financial markets, such as the sudden instability or collapse of large financial institutions or other significant corporations, terrorist attacks, natural or man-made disasters or threatened or actual armed conflicts; declines in the value of homes, and macroeconomic shifts in demand for, and competition in the supply of, rental homes; the availability of attractive investment opportunities in homes that satisfy our investment objective and business and growth strategies; the impact of changes to the supply of, value of and the returns on distressed and non-performing residential mortgage loans; our ability to convert the homes and distressed and non-performing residential mortgage loans we acquire into rental homes generating attractive returns; our ability to successfully modify or otherwise resolve distressed and non-performing residential mortgage loans; our ability to lease or re-lease our rental homes to qualified residents on attractive terms or at all; the failure of residents to pay rent when due or otherwise perform their lease obligations; our ability to manage our portfolio of rental homes; the concentration of credit risks to which we are exposed; the availability, terms and deployment of short-term and long-term capital; the adequacy of our cash reserves and working capital; the proposed internalization of our manager; our relationships with Starwood Capital Group and our Manager, and their ability to retain qualified personnel; potential conflicts of interest with Starwood Capital Group, including our manager, Starwood Property Trust, our parent company prior to the separation, the Waypoint manager and the Waypoint legacy funds; the timing of cash flows, if any, from our investments; unanticipated increases in financing and other costs, including a rise in interest rates; our expected leverage; effects of derivative and hedging transactions; actions and initiatives of the U.S. government and changes to U.S. government policies; changes in governmental regulations, tax laws (including changes to laws governing the taxation of real estate investment trusts (“REITs”)) and rates, and similar matters; limitations imposed on our business and our ability to satisfy complex rules in order for us and, if applicable, certain of our subsidiaries to qualify as a REIT for U.S. federal income tax purposes and the ability of certain of our subsidiaries to qualify as taxable REIT subsidiaries for U.S. federal income tax purposes, and our ability and the ability of our subsidiaries to operate effectively within the limitations imposed by these rules; and estimates relating to our ability to make distributions to our shareholders in the future. When considering forward looking statements, you should keep in mind the risk factors and other cautionary statements in Information Statement. Readers are cautioned not to place undue reliance on any of these forward looking statements. The matters summarized under “Summary,” “Risk Factors,” “Management’s Discussion and Analysis of Financial Condition and Results of Operations,” “Business” and elsewhere in the Information Statement could cause our actual results and performance to differ materially from those set forth in, or implied by, our forward looking statements. Accordingly, we cannot guarantee future results or performance. |
|
|
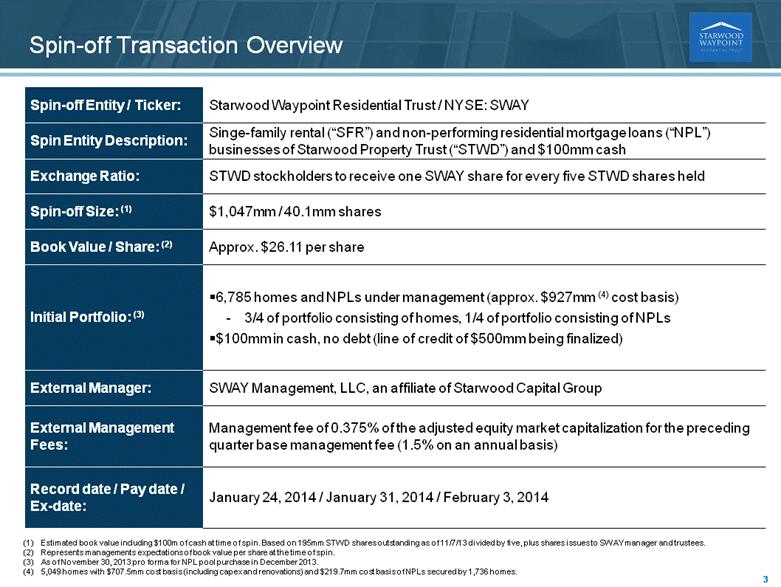
Spin-off Entity / Ticker: Starwood Waypoint Residential Trust / NYSE: SWAY Spin Entity Description: Singe-family rental (“SFR”) and non-performing residential mortgage loans (“NPL”) businesses of Starwood Property Trust (“STWD”) and $100mm cash Exchange Ratio: STWD stockholders to receive one SWAY share for every five STWD shares held Spin-off Size: (1) $1,047mm / 40.1mm shares Book Value / Share: (2) Approx. $26.11 per share Initial Portfolio: (3) 6,785 homes and NPLs under management (approx. $927mm (4) cost basis)-3/4 of portfolio consisting of homes, 1/4 of portfolio consisting of NPLs $100mm in cash, no debt (line of credit of $500mm being finalized) External Manager: SWAY Management, LLC, an affiliate of Starwood Capital Group External Management Fees: Management fee of 0.375% of the adjusted equity market capitalization for the preceding quarter base management fee (1.5% on an annual basis) Record date / Pay date / Ex-date: January 24, 2014 / January 31, 2014 / February 3, 2014 Spin-off Transaction Overview (1) Estimated book value including $100m of cash at time of spin. Based on 195mm STWD shares outstanding as of 11/7/13 divided by five, plus shares issues to SWAY manager and trustees. (2) Represents managements expectations of book value per share at the time of spin. (3) As of November 30, 2013 pro forma for NPL pool purchase in December 2013. (4) 5,049 homes with $707.5mm cost basis (including capex and renovations) and $219.7mm cost basis of NPLs secured by 1,736 homes. |
|
|
SWAY Investment Highlights Diversified $1bn portfolio of SFR / NPLs with FMV exceeding book value by $2.25 - $2.75 per share (1) Leading vertically integrated SFR operating platform and consumer brand Rigorous investment process supported by proprietary technologies NPL strategy allows for properties to be acquired at even more attractive values, enhancing shareholder returns (1) Based on third-party BPOs for retail values for marketed sales of approximately 70% of SWAY’s homes (randomly sampled) as of September 2013 as compared to the accounting basis for such homes as of June 30, 2013. This range is an estimate of to date appreciation and actual results upon any sales may vary materially. NPLs based on independent valuation by a third party money center bank . Ability to pay consistent dividends with growth potential Best in class real estate management team |
|
|
Significant Competitive Advantages Starwood – Waypoint combination Leading commercial / residential real estate investor with over $32bn of assets under management Extensive knowledge of US real estate market Unparalleled track record of growing de novo strategies in the public markets Proven access to capital with over $16bn of capital raised since 2009 Sizeable portfolio of single-family homes and non-performing residential mortgage loans Expertise in sourcing and managing residential NPL portfolios History of successful single-family rental investing since 2009 Significant operations infrastructure and experience Leading proprietary technology platform Expertise in sourcing and managing single family residential homes Strong single-family rental consumer brand ~550 dedicated employees nationwide Waypoint’s 90-day+ rent ready portfolio is 98.1% leased evidencing industry-leading capabilities Starwood Capital Group Waypoint Real Estate Group The combination of Starwood Capital Group and Waypoint Real Estate Group creates a leading Single-Family Rental company with a strong platform for future growth |
|
|
Barry Sternlicht Chairman Starwood Capital Group (Chairman & CEO), Starwood Property Trust (Chairman & CEO), Société du Louvre (Chairman of the Board), Starwood Hotels & Resorts Worldwide, Inc. (former Chairman & CEO) Brown University (BA with honors, magna cum laude), Harvard Business School (MBA with distinction) Gary Beasley Co-Chief Executive Officer Geolo Capital (Partner), Joie de vivre Hotels (CEO), GreenVolts (President & CEO), ZipRealty (President & CFO), LaSalle Partners and Security Capital Group, KSL Resorts (VP of Acquisitions) Northwestern University (BA), Stanford Graduate School of Business (MBA) Doug Brien Co-Chief Executive Officer Waypoint Homes (Co-Founder), Redwood Capital Management Group (Managing Partner); 15 years of real estate investing experience 12 years as NFL place kicker, 49ers Super Bowl Champion, Saints Team Captain, USOC Ethics Committee UC Berkeley (BA), Tulane University (MBA) Colin Wiel Chief Investment Officer Waypoint Homes (Co-Founder), Milo (Founder of e-commerce software engineering firm); 21 years of investment and real estate experience UC Berkeley (BS in Mechanical Engineering) Nina Tran Chief Financial Officer Prologis, Inc. (Chief Global Process Officer), AMB Property Corporation (Chief Accounting Officer), PricewaterhouseCoopers (Senior Associate), Certified Public Accountant UC Davis and California State University, Hayward (BA), Stanford Executive Program Scott Gable Chief Operating Officer Wells Fargo (EVP of Home & Consumer Finance Group), Hercules Technology Growth Capital (COO), United Commercial Bank (Head of Bank Operations), Booz Allen Hamilton (Consultant) Stanford (AB), Harvard Business School (MBA) Ali Nazar Chief Technology Officer SalesTeamLive (Co-found, VP of Product Development), Digital Island/Cable & Wireless (Director of Product Management) UC Davis (BS) Tamra Browne Chief Legal Officer AMB Property Corporation (SVP, General Counsel & Corporate Secretary), Morrison & Foerster LLP (corporate & securities attorney), Reid & Priest (corporate finance attorney) Middlebury College (BA), Stanford Law School (JD) Charles Young Division Vice President - West Mesa Development (EVP), Goldman Sachs; 17 years of real estate development, investment and management experience Stanford University (AB and MBA) David Zanaty Division Vice President - East AIG Global Real Estate (VP of Development) CB Richard Ellis; 15 years of real estate investment and development experience Emory (BA), Georgia Tech (MS), Northwestern (MBA) Seasoned Executive Management Team |

|
|
Significant and Developing Asset Class Residential housing is the largest real estate asset class in the U.S. with over 130mm units worth approximately $18.6tn As outlined below, many single-family homes are potential rental properties including existing vacant homes, existing single-family rentals and non-performing loans with negative equity Due to the financial crisis, many former homeowners are now renters Total U.S. Housing Inventory: 132.8mm (118.9mm Occupied) Potential single-family rentals: 6% 8.4mm Current one unit rentals: 11% 14.4mm Vacant: 14.0mm Historical average vacant: 12.7mm Above historical average vacant: 1.3 mm Renter occupied: 41.3mm 10+ units: 12.7mm Manuf. home, boats: 1.9mm 2 – 9 units: 12.3mm 1 unit: 14.4mm Positive equity: 45.1mm No mortgage: 25.4mm Owner occupied: 77.6mm Source: John Burns Real Estate Consulting ("JBREC"), November 2013. |
|
|
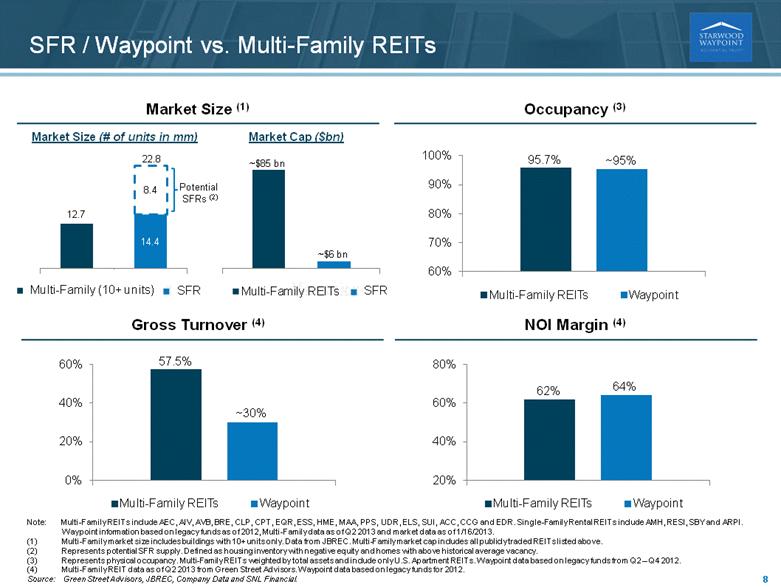
Market Size (1) SFR / Waypoint vs. Multi-Family REITs Occupancy (3) Gross Turnover (4) NOI Margin (4) Note: Multi-Family REITs include AEC, AIV, AVB, BRE, CLP, CPT, EQR, ESS, HME, MAA, PPS, UDR, ELS, SUI, ACC, CCG and EDR. Single-Family Rental REITs include AMH, RESI, SBY and ARPI. Waypoint information based on legacy funds as of 2012, Multi-Family data as of Q2 2013 and market data as of 1/16/2013. (1) Multi-Family market size includes buildings with 10+ units only. Data from JBREC. Multi-Family market cap includes all publicly traded REITs listed above. (2) Represents potential SFR supply. Defined as housing inventory with negative equity and homes with above historical average vacancy. (3) Represents physical occupancy. Multi-Family REITs weighted by total assets and include only U.S. Apartment REITs. Waypoint data based on legacy funds from Q2 – Q4 2012. (4) Multi-Family REIT data as of Q2 2013 from Green Street Advisors. Waypoint data based on legacy funds for 2012. Source: Green Street Advisors, JBREC, Company Data and SNL Financial. Market Cap ($bn) Market Size (# of units in mm) 22.8 SFR SFR Multi-Family (10+ units) Potential SFRs (2) 95.7% ~95% 60% 70% 80% 90% 100% Market Cap Multi - Family REITs Waypoint 95.7% ~95% 60% 70% 80% 90% 100% Market Cap Multi - Family REITs Waypoint 95.7% ~95% 60% 70% 80% 90% 100% Market Cap Multi - Family REITs Waypoint |
|
|
SWAY’s Multiple Channels of Originations MLS Listings Regional & Local Strategic Exclusive Relationships SWAY can acquire properties through multiple channels and is willing to modulate among those channels based on the best risk-return characteristics Individual Home Acquisitions Foreclosure Auctions Short Sales Consolidation Opportunities Non-performing Loans Money Center Banks Other Banks / Financial Institutions Conversion to rental pool Acquisitions of other SFR companies / operators Bolt-on acquisitions from small private investors Government Agencies |
|
|
Market Pricing Remains Attractive in Targeted Markets Historic opportunity to capitalize on attractive value(1) Total home price appreciation - projected 2013-2017(1)(2) (1) As of November 2013. (2) Reflects total forecasted appreciation compounded over the five year period. Source: JBREC Dallas, TX Denotes key SWAY markets that represent more than 5% of initial portfolio Carefully selected MSAs based on local economic data and HPA potential |
|
|
0 86 150 226 226 226 0 150 255 255 226 155 217 157 0 127 127 127 I. MSA II. Neighborhood III. House Rental yields Expected job and economic growth Projected HPA Opportunity to achieve scale and concentration Median income School quality Crime level Proprietary “livability” analysis Accurate rent and capex underwriting Meets required yield for MSA / neighborhood Discount to FMV Proprietary “livability” analysis Local expertise How We Select Houses |
|
|
Waypoint’s Technology Advantage Architecture designed for vertical integration Real-time oversight Iterative improvements Customized cloud and mobile platforms Predictive analytics Enables sharing of best practices company wide Waypoint Advantages Compass Property Management Platform Revenue Management System 1.0 Resident Underwriting Algorithm 1.0 Compass Platforms for Buying and Construction Neighborhood Algorithm 2.0 & Electronic Leases Neighborhood Algorithm 1.0 Compass Leasing Platform Culture of Innovation Maintenance Resource Optimization Algorithm 1.0 Q4 2009 Q2 2010 Q4 2010 Q1 2011 Q1 2012 Q3 2012 Q1 2013 Q3 2013 |
|
|
Proprietary Neighborhood Algorithm |
|
|
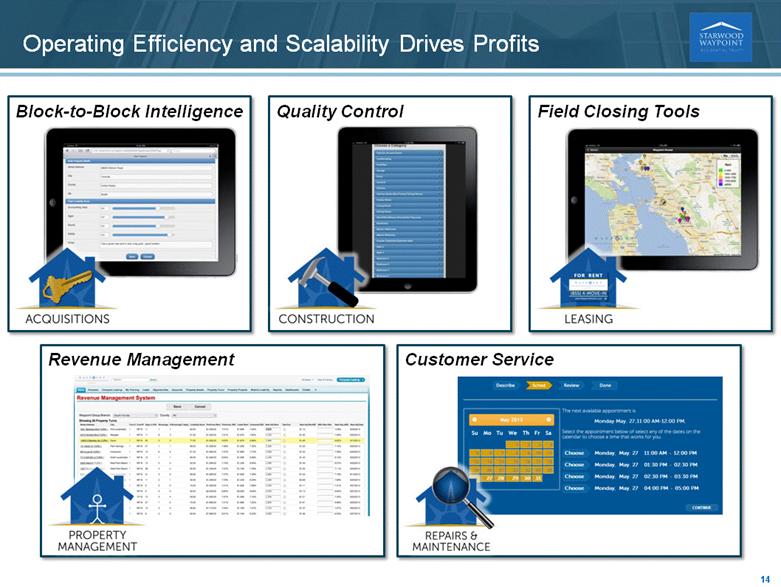
Operating Efficiency and Scalability Drives Profits Block-to-Block Intelligence Quality Control Field Closing Tools Customer Service Revenue Management |
|
|
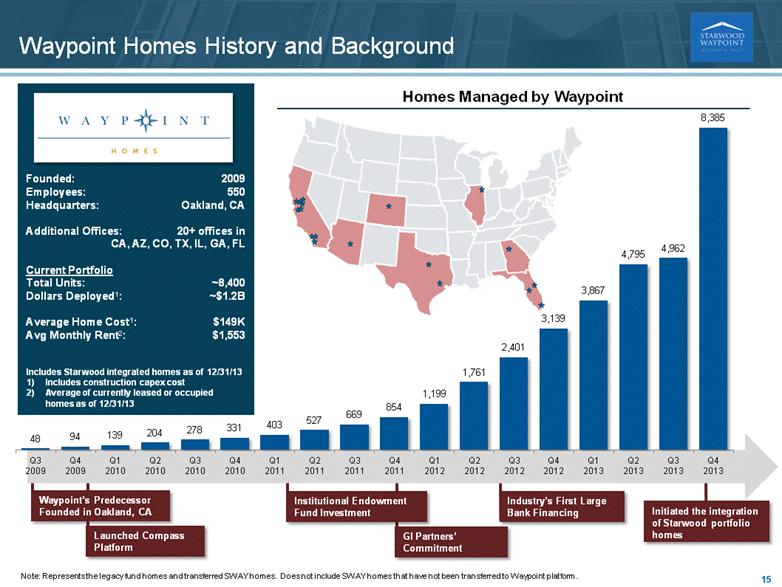
Waypoint Homes History and Background 0 86 150 217 157 0 226 226 226 0 150 255 255 226 155 127 127 127 Institutional Endowment Fund Investment Industry’s First Large Bank Financing Waypoint’s Predecessor Founded in Oakland, CA GI Partners’ Commitment Launched Compass Platform Founded: 2009 Employees: 550 Headquarters: Oakland, CA Additional Offices: 20+ offices in CA, AZ, CO, TX, IL, GA, FL Current Portfolio Total Units: ~8,400 Dollars Deployed1: ~$1.2B Average Home Cost1: $149K Avg Monthly Rent2: $1,553 Includes Starwood integrated homes as of 12/31/13 Includes construction capex cost Average of currently leased or occupied homes as of 12/31/13 Initiated the integration of Starwood portfolio homes Homes Managed by Waypoint Note: Represents the legacy fund homes and transferred SWAY homes. Does not include SWAY homes that have not been transferred to Waypoint platform. |
|
|
Leading Capabilities Throughout the SFR Lifecycle Local in-house buying team compensated based on asset performance Sharpshooter approach: only buy 1 - 2% of all homes that meet investment criteria Proprietary “top-down” and “bottom-up” underwriting approach National purchasing discount; 10% – 15% savings expected in 2014 Superintendents own projects 30 days into occupancy to ensure quality Quality first generation improvements Valuable second generation capex lessons learned Entire construction workflow in Compass In-house leasing team; strong performance with 98.1% of 90+ days rent ready homes that are leased Trademarked two year LPR program Electronic leases 70% pay electronically Waypoint screening algorithm informed by 5 years of data 44% leads online Self-manage portfolio Resident Service Centers establish a local presence and help create stronger resident relationships Low turnover 20% resident referrals In-house team handles over 3/4 of all work orders Regular tune-ups create efficiencies by consolidating work orders Optimize for cost, resident experience and future cap ex $50 service fee reduced work order volume by approximately half Acquisition Construction Leasing Resident Services Homes Services |
|
|
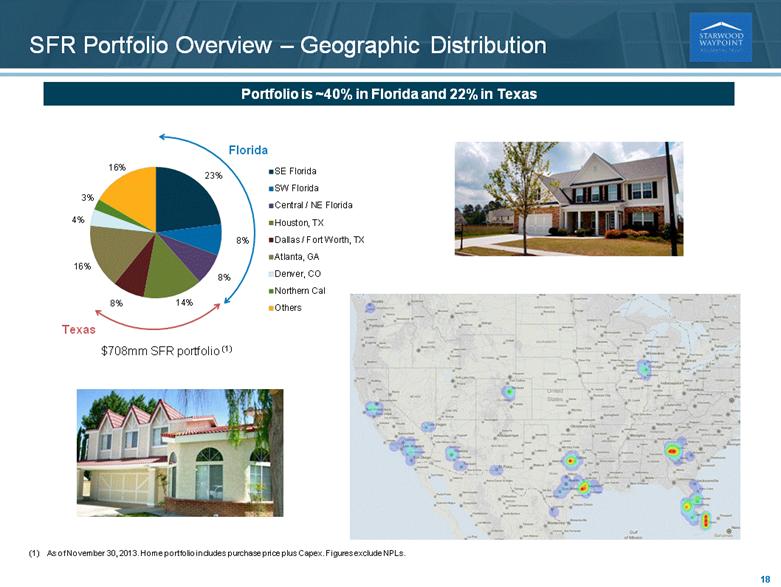
SFR Portfolio Overview (1) As of November 30, 2013. Home portfolio includes purchase price plus capex. Figures exclude NPLs. (2) Forward looking estimate based on leases in place and management’s estimates, including estimates of capital costs, management and other expenses and turnover frequency, in each case based on Starwood Capital Group’s and Waypoint’s experience. This range is a forward looking run-rate estimate and actual results may vary materially. (3) Based on third-party BPOs for retail values for marketed sales of approximately 70% of SWAY’s homes (randomly sampled) as of September 2013 as compared to the accounting basis for such homes as of June 30, 2013. This range is an estimate of to date appreciation and actual results upon any sales may vary materially. Total Number of Homes 5,049 Aggregate Investment (in mm) $707.5 Average Estimated Total Investment per Home $140,119 Average Estimated Renovation Cost per Home $17,942 Average Acquisition Cost Per Home $122,117 Average Discount to Replacement Cost 29% Average Underwritten Rent $1,459 Stabilized Unlevered Net Yield (2) 6% - 7% Estimated Unlevered NAV Appreciation per Share (3) $1.50 - $2.00 Key Metrics (1) |
|
|
$708mm SFR portfolio (1) Texas Florida SFR Portfolio Overview – Geographic Distribution (1) As of November 30, 2013. Home portfolio includes purchase price plus Capex. Figures exclude NPLs. Portfolio is ~40% in Florida and 22% in Texas 23% 8% 8% 14% 8% 16% 4% 3% 16% SE Florida SW Florida Central / NE Florida Houston, TX Dallas / Fort Worth, TX Atlanta, GA Denver, CO Northern Cal Others |
|
|
Detailed SFR Portfolio Overview (11/30/2013) Location No of homes Aggregate investment (US$m) Average investment per home(1) (US$) Average monthly rent per leased home(2) (US$) Percent of 90+ days rent ready homes that are leased(3) (%) Miami-Fort Lauderdale, FL CMSA 1,024 $163.2 $159,397 $1,625 96.0% Atlanta, GA MSA 976 111.8 114,579 1,099 85.1 Houston-Galveston-Brazoria, TX CMSA 775 103.6 133,636 1,431 94.4 Tampa-St. Petersburg-Clearwater, FL MSA 477 56.2 117,801 1,208 85.0 Dallas-Fort Worth, TX CMSA 419 55.8 133,241 1,327 94.8 West Palm Beach-Boca Raton, FL MSA 346 54.2 156,656 1,503 96.0 Orlando, FL MSA 175 25.1 143,449 1,307 62.5 Denver-Boulder-Greeley, CO CMSA 141 28.9 205,234 1,705 100.0 Chicago-Gary-Kenosha, IL-IN-WI CMSA 134 18.3 136,811 1,568 100.0 San Francisco-Oakland-San Jose, CA CMSA 94 19.0 202,168 1,589 100.0 Other 488 71.2 145,982 1,301 97.5 Total 5,049 $707.5 $140,119 $1,395 92.9 Includes acquisition costs and actual and budgeted upfront renovation costs. As of November 30, 2013, acquisition costs (a) included, among other things, fees, which averaged approximately 3.5% of the purchase price per home, paid to third parties that assisted with sourcing acquisitions and (b) excluded an aggregate of US$2.0mm of overhead expenses reimbursed to such third parties. As of November 30, 2013, based upon the homes we have already renovated, as well as our budgets for homes for which renovation has not been completed, we expect our upfront renovation costs to average approximately US$16,300 per home acquired as of November 30, 2013. Actual renovation costs may exceed budgeted renovation costs, and we may acquire homes in the future with different characteristics that result in higher renovation costs. Represents average monthly contractual cash rent. Average monthly cash rent is presented before rent concessions and WaypointsTM. To date, rent concessions and WaypointsTM have been utilized on a limited basis and have not had a significant impact on our average monthly rent. If the use of rent concessions and WaypointsTM or other leasing incentives increases in the future, they may have a greater impact by reducing the average monthly rent we receive from leased homes. Based on available data representing the leased or occupied percentage of homes that have passed the PTM clean date by more than 90 days as of 11/30/13. |
|
|
Successful NPL Purchase History – Over $500mm UPB Closed Asset Count Total Purchase Price ($ mm) Total UPB ($ mm) Purchase Price as a Percentage of UPB Current BPO ($ mm) Purchase Price as a Percentage of Current BPO 1 Nov 2012 485 $68.9 $149.9 46.0% $125.4 55.0% 2 Mar 2013 833 104.1 212.8 48.9 158.2 65.8 3 Apr 2013 302 28.8 65.2 44.2 49.8 57.9 4 Aug 2013 142 20.2 40.6 49.8 28.8 70.2 5 Dec 2013 261 33.2 58.7 56.5 51.8 64.0 Total 2,023 $255.3 $527.0 48.4% $413.9 61.7% As of 12/31 we had 1,385 non-rental NPLs with collateral market value of $295mm, purchased for $178mm representing $117mm in potential profits Note: Represents total purchases not current NPL portfolio. Represents pools bought because of overweight Florida exposure Represents pools that were bought off market |
|
|
Benefits of PrimeStar Model Vs Traditional Model Servicer Investor PrimeStar Asset Management Third Party Servicers Servicer receives monthly and workout fees No incentives for expeditious outcomes or superior returns, no penalty for poor cost controls Lack of business skills and training Workouts may not be the most beneficial to the investor Conventional Loan Servicer Arrangement SWAY Asset Management & Servicing Arrangement PrimeStar employs asset managers (“AMs”) with business backgrounds Servicers defer to AMs for all major business decisions Intensive asset management by PrimeStar – 100 assets per asset manager AM is responsible for the entire life of asset from boarding to REO transfer or liquidation Review of all servicing notes, audit of all expenditures Alignment of incentives ensures the most economically beneficial outcomes are obtained |
|
|
NPL Strategy Generates Strong Returns Targeted Total Return Avg. Timing ~ 1.25 – 1.40x 5 – 9 months 7 – 15 months Modifications (1) (~ 5-10% of loans) ~ 1.25 – 1.35x Note: Projections assume HPA at 5% per annum. Management estimates are not a guarantee of future results. (1) Assumes mortgage is held until refinance at 95% of value. (2) Average pool timeline (individual states vary from 3 – 30 months). SWAY works with PrimeStar to analyze NPL pools and determine bid values NPL acquisitions Short Payoffs (~ 5-10% of loans) 12 – 21 months ~ 1.20 – 1.30x Foreclosures / Deeds-in-Lieu (2) (~ 80-85% of loans) PrimeStar determines the best work-out strategy for each NPL based on guidance and criteria received from SWAY |
|
|
Detailed NPL Portfolio Overview Location Asset Count Total Purchase Price ($ mm) Total UPB ($ mm) Total BPO ($ mm) Weighted Average LTV(1) Purchase Price as a Percentage of UPB Purchase Price as a Percentage of BPO Florida 670 $77.7 $169.6 $118.0 143.8% 45.8% 65.8% New Jersey 130 15.1 39.3 31.4 125.1 38.3 48.0 New York 127 23.0 50.8 44.2 114.8 45.3 51.9 Maryland 85 13.8 27.0 21.1 127.6 51.3 65.4 California 70 16.7 30.7 26.0 118.1 54.3 64.1 Illinois 67 7.5 17.6 13.3 132.4 42.4 56.2 North Carolina 60 7.0 10.8 10.6 102.2 64.4 65.8 Pennsylvania 57 4.6 9.0 7.9 113.6 51.0 57.9 Georgia 54 7.6 13.0 11.5 112.6 58.5 65.9 Tennessee 37 3.3 5.2 4.9 105.4 64.0 67.5 Other (2) 379 43.5 79.1 69.6 113.6 55.0 62.5 Total 1,736 $219.7 $452.1 $358.7 126.0% 48.6% 61.3% Note: Balance as of 11/30/2013, pro forma for an NPL pool acquisition on 12/4/2013. (1) Weighted average LTV is based on the ratio of UPB to BPO weighted by UPB for each state as of the respective acquisition dates. (2) Includes 35 other states and Washington, D.C. |
|
|
(US$bn) Total residential mortgages US$ PD 90 days + nonaccrual % PD 90 days + nonaccrual $359.7 $46.4 12.9% 348.7 38.1 10.9 209.6 22.2 10.6 131.5 10.0 7.6 74.3 5.2 7.0 53.6 4.3 8.0 50.6 6.1 12.1 44.9 1.4 3.1 43.2 1.4 3.2 38.3 1.4 3.7 $1,354.4 $136.5 10.1% Attractive Supply of Single Family Home NPLs Top 10 Banks by Residential Mortgage Exposure(1) GSEs Other Government Entities (1) As of Q3-13. Based on regulatory filings |
|
|
Operational Focus Revenue management and premium rents Leveraging existing management infrastructure Known and scalable operating expenses Continued efficiencies in operating model to drive performance Net Operating Margin(1) Based on weighted average stabilized homes for all of Waypoint Legacy Funds’ portfolio homes that were owned for at least 6 months as of 12/31/2012. This information does not represent the operating performance of any particular home within Waypoint Legacy Funds’ portfolio homes, nor does it represent the operating performance Starwood Waypoint Residential Trust may achieve with respect to its portfolio. The actual operating performance of Starwood Waypoint Residential Trust’s portfolio will be subject to a variety of risks and uncertainties. Please see the “Forward-Looking Statements” section of this presentation Other includes vehicle leases, utilities, resident services center rent and Homeowners’ Association fees Note: Waypoint Homes will not be part of SWAY and past Waypoint performance is not necessarily indicative of SWAY performance. Illustrative Unit Economics – Waypoint Legacy Funds 2012 (Inc. turn 2) 100% (11)% (6)% (12)% (7)% 64% 0% 20% 40% 60% 80% 100% 120% Net rent Taxes and insurance Property management/leasing Repairs and maintenance Other(2) NOI margin |
|
|
Transaction highlights 2013-SFR is the first ever securitization of single family rental properties in the US Securitization has provided 75% loan-to-value leverage at LIBOR +167 Structure summary Securitization Case Study The loan is secured by (a) 59 mortgages (backed by 3,207 properties) and (b) an equity pledge from the borrower entity The transaction was rated by Moody’s, Kroll and Morningstar The transaction priced on November 5, 2013 Class Class size Credit enhancement Loan-to-value Ratings (KBRA/Moody’s/ Morningstar) Maturity date WAL (yrs) Fully extended maturity date WAL (yrs) Pricing (LIBOR + spread) A $278,700,000 41.83% 43.63% AAA(sf)/Aaa(sf)/AAA 2.0 4.9 +115 B 34,300,000 34.67% 48.99% AA(sf)/Aa2(sf)/AA 2.1 5.1 +135 C 47,100,000 24.84% 56.37% A(sf)/A2(sf)/A 2.1 5.1 +185 D 31,500,000 18.27% 61.30% BBB(sf)/Baa2(sf)/BBB+ 2.1 5.1 +215 E 46,010,000 8.67% 68.50% BBB-(sf)/NR/BBB 2.1 5.1 +265 F 41,527,000 0.00% 75.00% BB(sf)/NR/NR 2.1 5.1 +365 Total $479,137,000 75.00% 2.0 5.0 +167 |
|
|
[LOGO] |