Attached files
| file | filename |
|---|---|
| 8-K - CURRENT REPORT - RCS Capital Corp | v365557_8k.htm |
| EX-99.2 - PRESS RELEASE - RCS Capital Corp | v365557_ex99-2.htm |
1 January 16, 2014 RCS Capital to Acquire Cetera Financial Group
2 2 Forward - Looking Statements Certain statements made in this presentation are forward - looking statements. Those statements include statements regarding the intent, belief or current expectations of RCS Capital Corporation (“RCS Capital”) and members of its management team, as well as the assumptions on which such statements are based, and generally are identified by the use of words such as “may,” “will,” “seeks,” “anticipates,” “believes,” “estimates,” “expects,” “plans,” “intends,” “should” or similar expressions. Actual results may differ materially from those contemplated by such forward - looking statements. Further, forward - looking statements speak only as of the date they are made, and we undertake no obligation to update or revise forward - looking statements to reflect changed assumptions, the occurrence of unanticipated events or changes to future operating results over time, unless required by law. The following are some of the possible risks and uncertainties, although not all risks and uncertainties, that could cause our actual results to differ materially from those presented in our forward - looking statements : adverse developments in the direct investment program industry; deterioration in the business environment in the specific sectors of the economy in which RCS Capital focuses or a decline in the market for securities of companies within these sectors; substantial fluctuations in RCS Capital’s financial results; RCS Capital’s ability to retain senior professionals; pricing and other competitive pressures ; changes in laws and regulations and industry practices that adversely affect RCS Capital’s sales and trading business ; (Continued on next page)
3 2 Cautionary Note Regarding Forward - Looking Statements (Continued from prior page) incurrence of losses in the future; the singular nature of RCS Capital’s capital markets and strategic advisory engagements; competition from larger firms; larger and more frequent capital commitments in RCS Capital’s wholesale broker - dealer and investment banking businesses; limitations on RCS Capital’s access to capital; malfunctioning or failure in RCS Capital’s operations and infrastructure; strategic investments or acquisitions and joint ventures or RCS Capital’s entry into new business areas ; the effects of RCS Capital’s substantial level of indebtedness, and limitations on certain activities pursuant to restrictive covenants in the documentation evidencing such indebtedness; failure to achieve and maintain effective internal controls ; and RCS Capital’s ability to make, on a timely or cost effective basis, the changes necessary to operate as an independent company.
4 RCS Capital Acquisition of Cetera – Transaction Highlights
5 2 Transaction Highlights While the acquisition of Cetera Financial Group (“Cetera”) by RCS Capital Corp (NYSE: RCAP) is transformational, it also accelerates RCAP’s strategic growth plan to become the leading diversified financial services firm. Highlights of the transaction include: • Combination Creates 2 nd Largest Independent Financial Advisor Network In the U.S. (1) : A dvisor count increases to nearly 8,900 reps, underscoring RCAP’s commitment to become the leading independent broker dealer network. • Acquisition Adds $1.3 Billion To RCAP’s Revenues In 2014: Six - fold increase in RCAP retail advice revenues expected. • Assets Under Administration (“AUA”) Grow To $191 Billion on RCAP and RCAP Holdings’ Combined Retail Advice Platform, including First Allied Holdings (“First Allied”): Cetera adds $145 billion in Assets Under Administration and approximately 2 million new clients. • Cetera’s Leading Management Team and Growth Engine Augments RCAP and RCAP Holdings’ Platform: P roven track record, highlighted by 75% increase in advisors, 87% growth in net revenues, and approximately 300% increase in adjusted EBITDA from 2010 to 2013E. • Combined Enterprise Results In Significant Operating Efficiencies: Acquisition synergies result primarily from enhanced revenue opportunities and cost savings. • Combined Enterprise Further Diversifies Client Base: Expands RCAP’s reach to a broader range of clients, including those served by tax and accounting professionals, as well as banks and credit unions. (1) Based on number of advisors, and per Financial Planning Magazine’s “FA’s 2013 IBD Ranking”; RCAP includes Cetera Financial Group, Investor’s Capital Holdings, and Summit Brokerage Services. Note : Acquisitions of Hatteras, Summit Brokerage Services, and Investors Capital Holdings are pending; First Allied is currently owned by RCAP Holdings, LLC and not part of RCS Capital Corp.
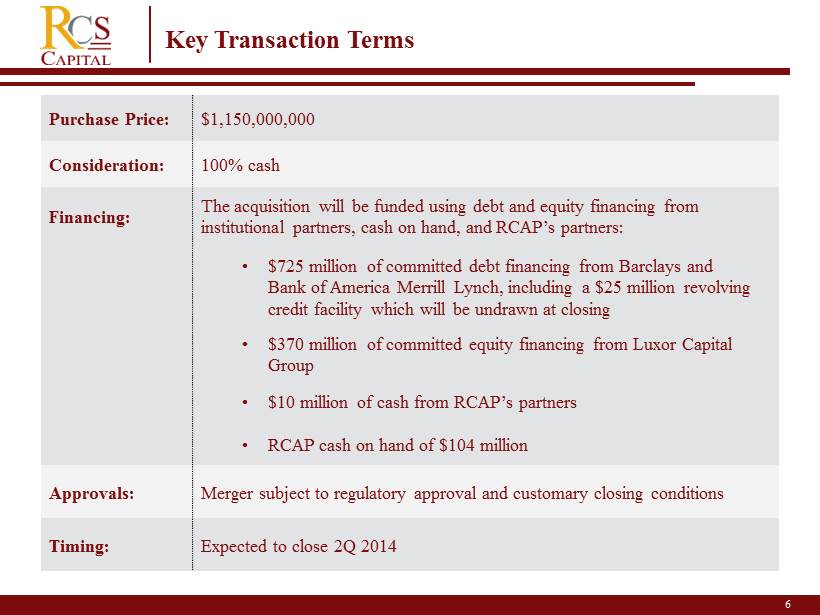
6 Key Transaction Terms Purchase Price: $1,150,000,000 Consideration: 100% cash Financing: The acquisition will be funded using debt and equity financing from institutional partners, cash on hand, and RCAP’s partners: • $725 million of committed debt financing from Barclays and Bank of America Merrill Lynch, i ncluding a $25 million revolving credit facility which will be undrawn at closing • $370 million of committed equity financing from Luxor Capital Group • $10 million of cash from RCAP’s partners • RCAP cash on hand of $104 million Approvals: Merger subject to regulatory approval and customary closing conditions Timing: Expected to close 2Q 2014
The Value of RCS Capital • Powerful Capital Accumulation Machine : The combination of Cetera with RCAP and RCAP Holdings’ other retail broker dealers, including First Allied, Investors Capital Holdings (“ICH”) and Summit Brokerage Services (“Summit”), solidifies RCAP’s retail advice platform and creates one of the most powerful capital accumulation machines on the globe . • Power of Distribution : The power of this distribution platform, in both scale and reach, along with RCAP’s continuing drive to create value for shareholders, partners and employees, financial advisors and client households, will attract the best and brightest financial advisors, who in turn will enjoy greater access to a broader array of investment solutions . • The Next Evolution of the Financial Services Industry : Joining the acumen of Wall Street with the values of Main Street . The union of Cetera with RCS Capital creates the first full - service financial services and national distribution network equally skilled in advising on and distributing a full range of financial services focused on the individual investor. 7 Note : Acquisitions of Hatteras, Summit Brokerage Services, and Investors Capital Holdings are pending; First Allied is currently owned by RCAP Holdings, LLC and not part of RCS Capital Corp.
The Value of RCS Capital • Unmatched Leadership : Cetera and RCAP have each demonstrated the ability to build their businesses rapidly and profitably . The continuity of management, with Valerie Brown remaining as Cetera’s President and Chief Executive Officer, operating within the RCS Capital organization, ensures the stability of the business while creating substantial operating and revenue synergies . • Growth and Diversification of Revenue : The combination of Cetera with RCAP both grows and diversifies the company’s revenue base substantially, capturing revenue from equity sales, investment banking and capital markets fees, investment management, transaction management and transfer agency activities . • Large Market and Growth Potential : The size of RCAP’s target market is enormous, with Mass Affluent investors holding more than $ 7 . 5 trillion of investable assets and increasingly seeking the counsel of independent advisors to guide them to financial stability and security . 8
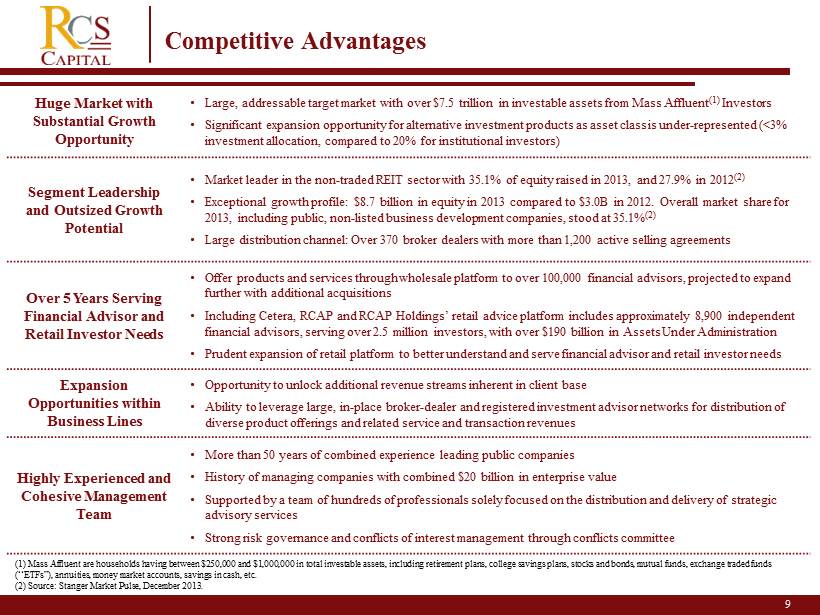
9 2 Huge Market with Substantial Growth Opportunity • Large, addressable target market with over $7.5 trillion in investable assets from Mass Affluent ( 1) Investors • Significant expansion opportunity for alternative investment products as asset class is under - represented (<3% investment allocation, compared to 20% for institutional investors) Segment Leadership and Outsized Growth Potential • Market leader in the non - traded REIT sector with 35.1% of equity raised in 2013, and 27.9% in 2012 (2) • Exceptional growth profile: $8.7 billion in equity in 2013 compared to $3.0B in 2012. Overall market share for 2013, including public, non - listed business development companies, stood at 35.1% (2) • Large distribution channel: Over 370 broker dealers with more than 1,200 active selling agreements Over 5 Years Serving Financial Advisor and Retail Investor Needs • Offer products and services through wholesale platform to over 100,000 financial advisors, projected to expand further with additional acquisitions • Including Cetera, RCAP and RCAP Holdings’ retail advice platform includes approximately 8,900 independent financial advisors, serving over 2.5 million investors, with over $190 billion in Assets Under Administration • Prudent expansion of retail platform to better understand and serve financial advisor and retail investor needs E xpansion Opportunities within Business Lines • Opportunity to unlock additional revenue streams inherent in client base • Ability to leverage large, in - place broker - dealer and registered investment advisor networks for distribution of diverse product offerings and related service and transaction revenues Highly Experienced and Cohesive Management Team • More than 50 years of combined experience leading public companies • History of managing companies with combined $20 billion in enterprise value • Supported by a team of hundreds of professionals solely focused on the distribution and delivery of strategic advisory services • Strong risk governance and conflicts of interest management through conflicts committee (1) Mass Affluent are households having between $250,000 and $1,000,000 in total investable assets, including retirement plans, college savings plans, stocks and bonds , mutual funds, exchange traded funds (“ETFs”), annuities, money market accounts, savings in cash, etc. (2) Source: Stanger Market Pulse, December 2013. Competitive Advantages
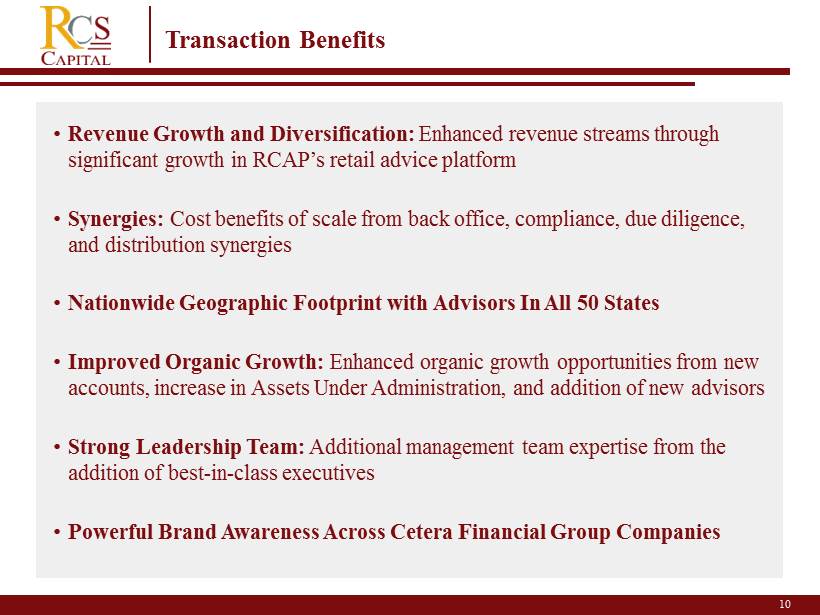
Transaction Benefits 10 • Revenue Growth and Diversification: Enhanced revenue streams through significant growth in RCAP’s retail advice platform • Synergies: Cost benefits of scale from back office, compliance, due diligence, and distribution synergies • Nationwide Geographic Footprint with Advisors In All 50 States • Improved Organic Growth: Enhanced organic growth opportunities from new accounts, increase in Assets Under Administration , and addition of new advisors • Strong Leadership Team: Additional management team expertise from the addition of best - in - class executives • Powerful Brand Awareness Across Cetera Financial Group Companies

11 Institutional Financing Sources 2 Committed debt financing from Bank of America Merrill Lynch • With over $ 2 . 2 trillion in total assets, including its parent company, Bank of America Merrill Lynch is a leading multinational banking and financial services company headquartered in New York City . • The firm functions as the corporate and investment banking division of Bank of America, providing services in mergers and acquisitions, equity and debt capital markets, lending, and trading, among others . • Awarded “Most Innovative Investment Bank” in 2013 by The Banker . Committed debt financing from Barclays • Barclays is a major global financial services provider engaged in personal banking, credit cards, corporate and investment banking and wealth and investment management with an extensive international presence in Europe, the Americas, Africa and Asia . • With over 300 years of history and expertise in banking, Barclays operates in over 50 countries and employs approximately 140 , 000 people . Barclays moves, lends, invests and protects money for customers and clients worldwide . • At the end of 2012 , Barclays had total assets of $ 2 . 42 trillion . Committed equity financing from Luxor Capital Group • Founded in April 2002 and headquartered in New York City . • The firm’s investment strategy is event - driven across equity and credit markets . Its funds invest globally, although investments are generally made in developed markets in North America and Europe .

12 RCS Capital Overview
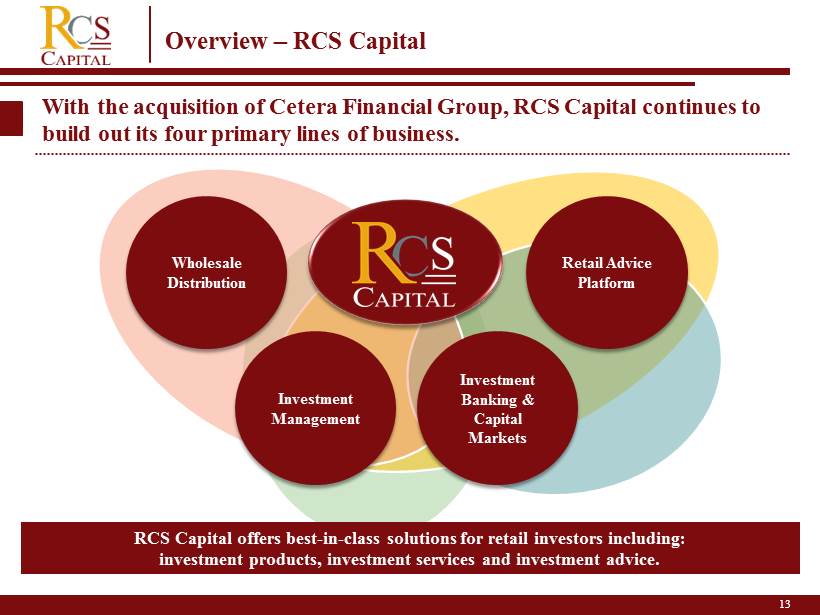
13 13 2 Overview – RCS Capital With the acquisition of Cetera Financial Group, RCS Capital continues to build out its four primary lines of business. Wholesale Distribution Investment Banking & Capital Markets Retail Advice Platform Investment Management RCS Capital offers best - in - class solutions for retail investors including: investment products, investment services and investment advice.

14 Diversified, Complementary Operating Model 2 Four Lines of Business Provide a Full Scope of Financial Services to Retail Investors Wholesale Distribution Investment Management Investment Banking & Capital Markets Retail Advice Platform z Note: Acquisitions of Hatteras, Summit Brokerage Services, and Investors Capital Holdings are pending; First Allied is curren tly owned by RCAP Holdings, LLC and not part of RCS Capital Corp. The Legend Group is a subsidiary of First Allied. This chart assumes the consolidation of First Allied into RCS Capital Corp in connection with the acquisition of Cetera Finan cia l Group.
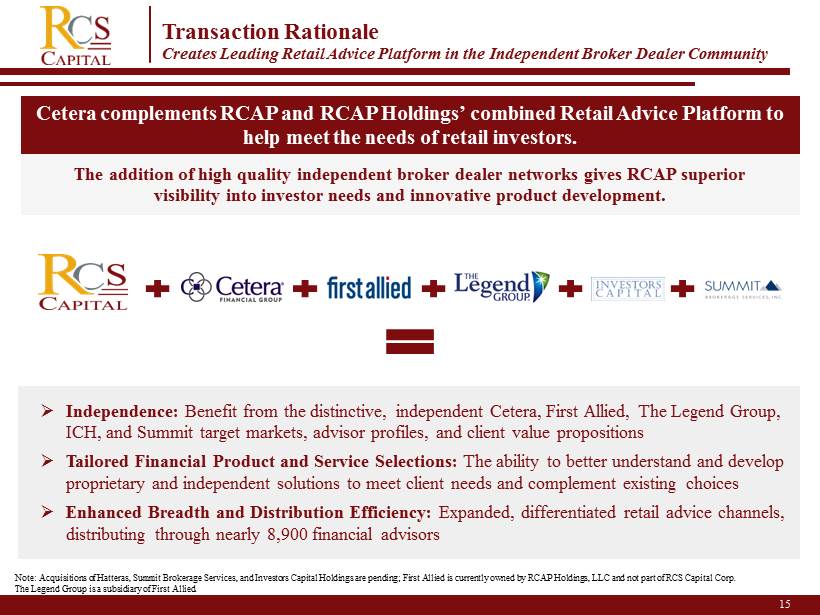
Transaction Rationale Creates Leading Retail Advice Platform in the Independent Broker Dealer Community Cetera complements RCAP and RCAP Holdings’ c ombined Retail Advice Platform to help meet the needs of retail investors. 15 The addition of high quality independent broker dealer networks gives RCAP superior visibility into investor needs and innovative product development. » Independence: Benefit from the distinctive, independent Cetera , First Allied, The Legend Group, ICH, and Summit target markets, advisor profiles, and client value propositions » Tailored Financial Product and Service Selections: The ability to better understand and develop proprietary and independent solutions to meet client needs and complement existing choices » Enhanced Breadth and Distribution Efficiency: Expanded, differentiated retail advice channels, distributing through nearly 8,900 financial advisors Note: Acquisitions of Hatteras, Summit Brokerage Services, and Investors Capital Holdings are pending; First Allied is curren tly owned by RCAP Holdings, LLC and not part of RCS Capital Corp. The Legend Group is a subsidiary of First Allied.

16 Cetera Financial Group Overview

17 Overview of Cetera Unique, Independent Financial Advisor Network • Created in February 2010, following the sale of three ING broker - dealers to funds affiliated with Lightyear Capital, LLC • Provides wealth management support services to financial advisors, financial institutions, and tax and accounting professionals, through four distinct, customized platforms: • Cetera Advisor Networks (formerly Financial Networks, founded 1983) • Cetera Advisors (formerly Multi - Financial, founded 1981) • Cetera Financial Institutions (formerly PrimeVest, founded 1984) • Cetera Financial Specialists (formerly Genworth Financial, founded 1981) Large, Scalable Business in a Growing Industry • Cetera advisors serve Mass Affluent America, focusing on clients with between $100,000 and over $1 million in investable assets • $1,141 million of revenues in 2013E when normalized for acquisitions; approximately 60% of which is recurring • Approximately 2 million clients served by 6,660 advisors (1) • $145 billion Assets Under Administration (1) Strong Growth Driven Organically and by Acquisitions • In 2012, Cetera completed the acquisition of Genworth Financial Investment Services • In September 2013, Cetera completed the acquisition of Tower Square Securities and Walnut Street Securities from MetLife • Cetera’s advisors grew their businesses by an average of 15% in 2013E • Producing advisors increased by 1,057 (19%) in 2013E, generating approximately $23 billion in new AUA from organic and acquisitive growth (1) November 30, 2013 .
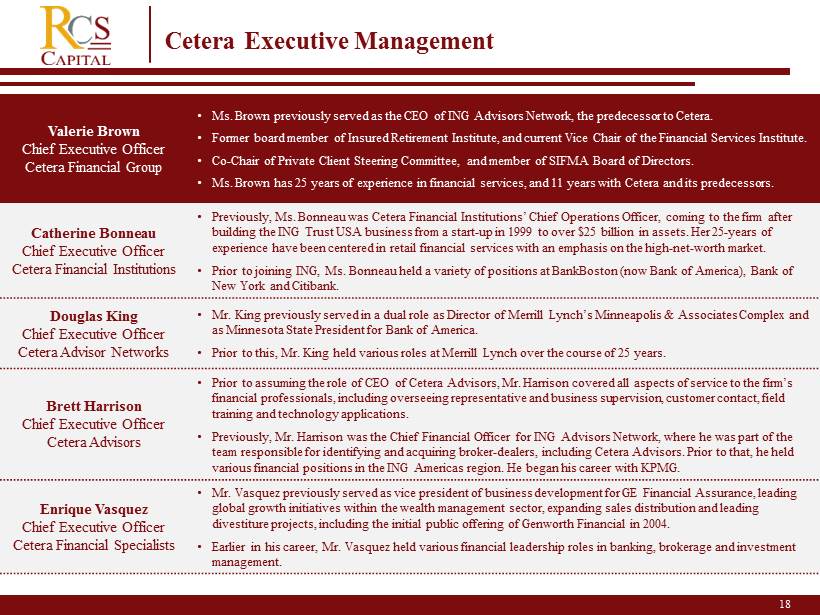
18 Cetera Executive Management 2 Valerie Brown Chief Executive Officer Cetera Financial Group • Ms. Brown previously served as the CEO of ING Advisors Network, the predecessor to Cetera. • Former board member of Insured Retirement Institute, and current Vice Chair of the Financial Services Institute. • Co - Chair of Private Client Steering Committee, and member of SIFMA Board of Directors. • Ms. Brown has 25 years of experience in financial services, and 11 years with Cetera and its predecessors. Catherine Bonneau Chief Executive Officer Cetera Financial Institutions • Previously, Ms. Bonneau was Cetera Financial Institutions’ C hief Operations Officer, coming to the firm after building the ING Trust USA business from a start - up in 1999 to over $25 billion in assets. Her 25 - years of experience have been centered in retail financial services with an emphasis on the high - net - worth market. • Prior to joining ING, Ms. Bonneau held a variety of positions at BankBoston (now Bank of America), Bank of New York and Citibank. Douglas King Chief Executive Officer Cetera Advisor Networks • Mr. King p reviously served in a dual role as Director of Merrill Lynch’s Minneapolis & Associates Complex and as Minnesota State President for Bank of America. • Prior to this, Mr. King held various roles at Merrill Lynch over the course of 25 years. Brett Harrison Chief Executive Officer Cetera Advisors • Prior to assuming the role of CEO of Cetera Advisors, Mr. Harrison covered all aspects of service to the firm’s financial professionals, including overseeing representative and business supervision, customer contact, field training and technology applications. • Previously, Mr. Harrison was the Chief Financial Officer for ING Advisors Network, where he was part of the team responsible for identifying and acquiring broker - dealers, including Cetera Advisors. Prior to that, he held various financial positions in the ING Americas region. He began his career with KPMG. Enrique Vasquez Chief Executive Officer Cetera Financial Specialists • Mr. Vasquez previously served as vice president of business development for GE Financial Assurance, leading global growth initiatives within the wealth management sector, expanding sales distribution and leading divestiture projects, including the initial public offering of Genworth Financial in 2004. • Earlier in his career, Mr. Vasquez held various financial leadership roles in banking, brokerage and investment management.
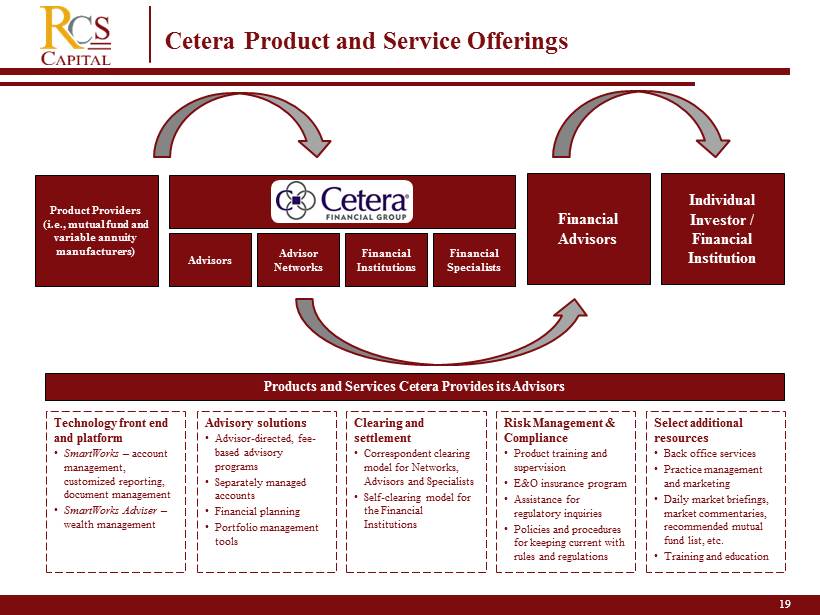
19 Cetera Provides Critical Services to its Financial Advisor Clients Individual Investor / Financial Institution Financial Advisors Product Providers (i.e., mutual fund and variable annuity manufacturers) Advisors Advisor Networks Financial Institutions Financial Specialists Products and Services Cetera Provides its Advisors Cetera Product and Service Offerings 19 Technology front end and platform • SmartWorks – account management, customized reporting , document management • SmartWorks Adviser – wealth management Advisory solutions • Advisor - directed, fee - based advisory programs • Separately managed accounts • Financial planning • Portfolio management tools Clearing and settlement • Correspondent clearing model for Networks, Advisors and Specialists • Self - clearing model for the Financial Institutions Select additional resources • Back office services • Practice management and marketing • Daily market briefings, market commentaries, recommended mutual fund list, etc. • Training and education Risk Management & Compliance • Product training and supervision • E&O insurance program • Assistance for regulatory inquiries • Policies and procedures for keeping current with rules and regulations
20 RCAP and Cetera Financial Group The Retail Advice Platform
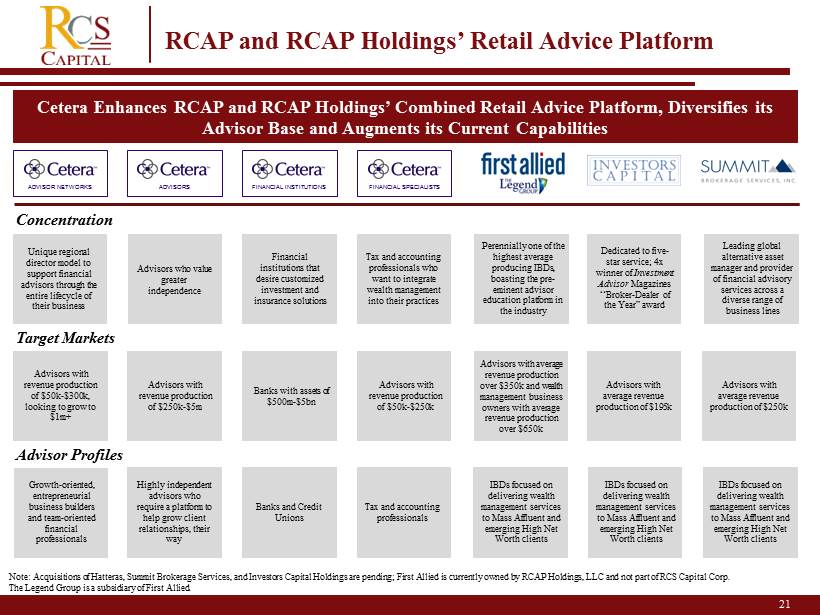
21 RCAP and RCAP Holdings’ Retail Advice Platform Cetera Enhances RCAP and RCAP Holdings’ Combined Retail Advice Platform, Diversifies its Advisor B ase and Augments its Current Capabilities Advisor Profiles Concentration Target Markets Banks and Credit Unions Tax and accounting professionals Advisors with revenue production of $250k - $5m Advisors with revenue production of $50k - $300k, looking to grow to $1m+ Banks with assets of $500m - $5bn Advisors with revenue production of $50k - $250k Unique regional director model to support financial advisors through the entire lifecycle of their business Advisors who value greater independence Financial institutions that desire customized investment and insurance solutions Tax and accounting professionals who want to integrate wealth management into their practices Growth - oriented, entrepreneurial business builders and team - oriented financial professionals Highly independent advisors who require a platform to help grow client relationships, their way ADVISOR NETWORKS ADVISORS FINANCIAL INSTITUTIONS FINANCIAL SPECIALISTS IBDs focused on delivering wealth management services to Mass Affluent and emerging High Net Worth clients Advisors with average revenue production over $350k and wealth management business owners with average revenue production over $650k Perennially one of the highest average producing IBDs, boasting the pre - eminent advisor education platform in the industry Advisors with average revenue production of $195k Dedicated to five - star service; 4x winner of Investment Advisor Magazines “Broker - Dealer of the Year” award IBDs focused on delivering wealth management services to Mass Affluent and emerging High Net Worth clients Advisors with average revenue production of $ 250k Leading global alternative asset manager and provider of financial advisory services across a diverse range of business lines IBDs focused on delivering wealth management services to Mass Affluent and emerging High Net Worth clients Note: Acquisitions of Hatteras, Summit Brokerage Services, and Investors Capital Holdings are pending; First Allied is curren tly owned by RCAP Holdings, LLC and not part of RCS Capital Corp. The Legend Group is a subsidiary of First Allied.
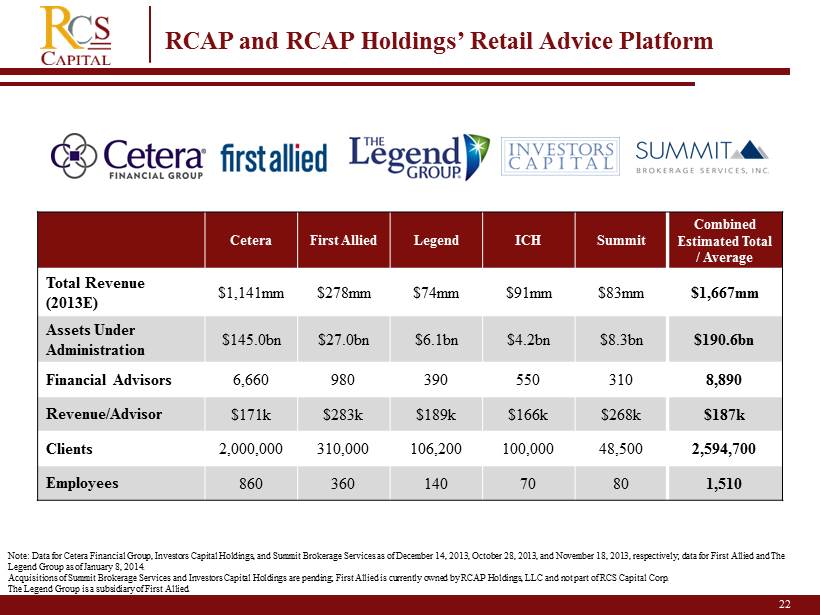
22 2 RCAP and RCAP Holdings’ Retail Advice Platform Cetera First Allied Legend ICH Summit Combined Estimated Total / Average Total Revenue (2013E) $1,141mm $278mm $74mm $91mm $83mm $1,667mm Assets Under Administration $ 145.0bn $ 27.0bn $ 6.1bn $ 4.2bn $ 8.3bn $190.6bn Financial Advisors 6,660 980 390 550 310 8,890 Revenue/ Advisor $171k $283k $ 189k $166k $ 268k $ 187k Clients 2,000,000 310,000 106,200 100,000 48,500 2,594,700 Employees 860 360 140 70 80 1,510 Note: Data for Cetera Financial Group, Investors Capital Holdings, and Summit Brokerage Services as of December 14, 2013, October 28, 2013, and November 18, 2013, respectively; data for First Allied and The Legend Group as of January 8, 2014. Acquisitions of Summit Brokerage Services and Investors Capital Holdings are pending; First Allied is currently owned by RCAP Holdings, LLC and not part of RCS Capital Corp. The Legend Group is a subsidiary of First Allied.
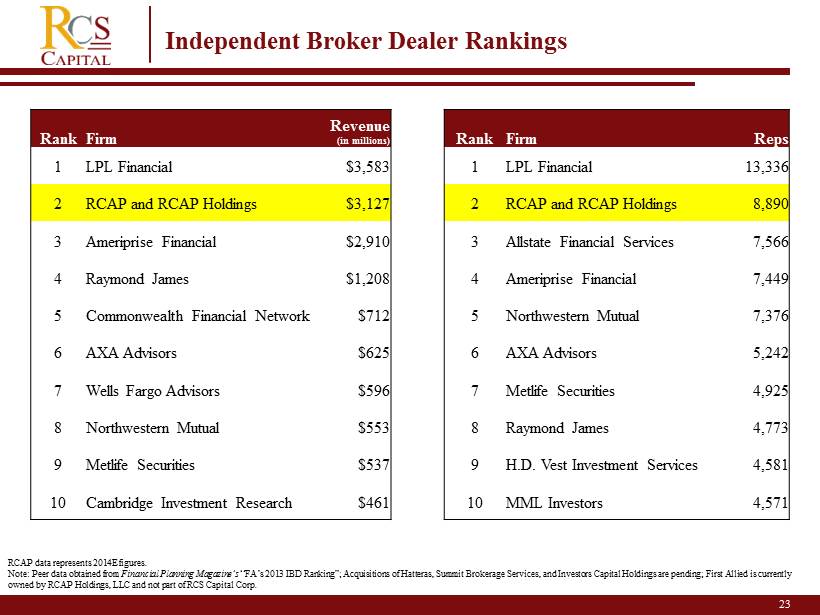
23 2 Independent Broker Dealer Rankings Rank Firm Revenue (in millions) Rank Firm Reps 1 LPL Financial $3,583 1 LPL Financial 13,336 2 RCAP and RCAP Holdings $3,127 2 RCAP and RCAP Holdings 8,890 3 Ameriprise Financial $2,910 3 Allstate Financial Services 7,566 4 Raymond James $1,208 4 Ameriprise Financial 7,449 5 Commonwealth Financial Network $712 5 Northwestern Mutual 7,376 6 AXA Advisors $625 6 AXA Advisors 5,242 7 Wells Fargo Advisors $596 7 Metlife Securities 4,925 8 Northwestern Mutual $553 8 Raymond James 4,773 9 Metlife Securities $537 9 H.D. Vest Investment Services 4,581 10 Cambridge Investment Research $461 10 MML Investors 4,571 RCAP data represents 2014E figures. Note: Peer data obtained from Financial Planning Magazine’s “FA’s 2013 IBD Ranking”; Acquisitions of Hatteras, Summit Brokerage Services , and Investors Capital Holdings are pending; First Allied is currently owned by RCAP Holdings, LLC and not part of RCS Capital Corp.
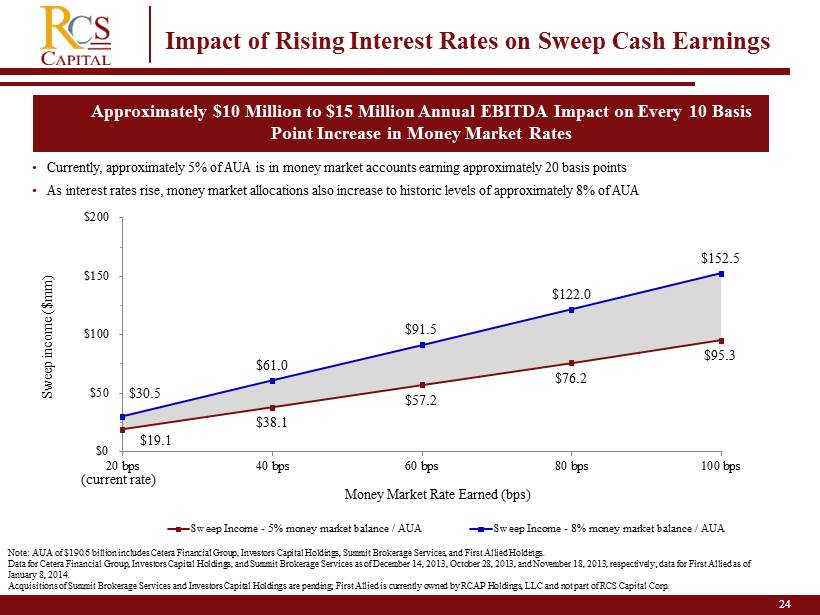
24 24 2 Impact of Rising Interest Rates on Sweep Cash Earnings Note: AUA of $ 190.6 billion includes Cetera Financial Group, Investors Capital Holdings, Summit Brokerage Services, and First Allied Holdings. Data for Cetera Financial Group, Investors Capital Holdings, and Summit Brokerage Services as of December 14, 2013, October 28, 20 13, and November 18, 2013, respectively; data for First Allied as of January 8, 2014. Acquisitions of Summit Brokerage Services and Investors Capital Holdings are pending; First Allied is currently owned by RCAP Ho ldings, LLC and not part of RCS Capital Corp. Approximately $10 Million to $15 Million Annual EBITDA Impact on Every 10 Basis Point Increase in Money Market Rates • Currently, approximately 5% of AUA is in money market accounts earning approximately 20 basis points • As interest rates rise, money market allocations also increase to historic levels of approximately 8% of AUA $19.1 $38.1 $57.2 $76.2 $95.3 $30.5 $61.0 $91.5 $122.0 $152.5 $0 $50 $100 $150 $200 20 bps 40 bps 60 bps 80 bps 100 bps Area 1 Area 2 Sweep Income - 5% money market balance / AUA Sweep Income - 8% money market balance / AUA Money Market Rate Earned (bps) Sweep income ($mm) (current rate)

25 Realty Capital Securities Wholesale Distribution Overview
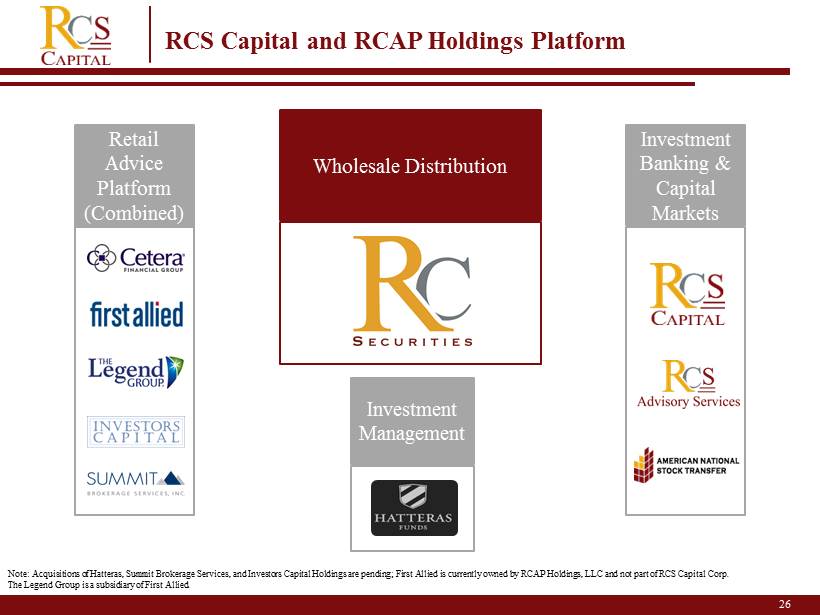
26 RCS Capital and RCAP Holdings Platform 2 Note: A cquisitions of Hatteras, Summit Brokerage Services, and Investors Capital Holdings are pending; First Allied is currently own ed by RCAP Holdings, LLC and not part of RCS Capital Corp. The Legend Group is a subsidiary of First Allied. Wholesale Distribution Retail Advice Platform (Combined) Investment Banking & Capital Markets Investment Management
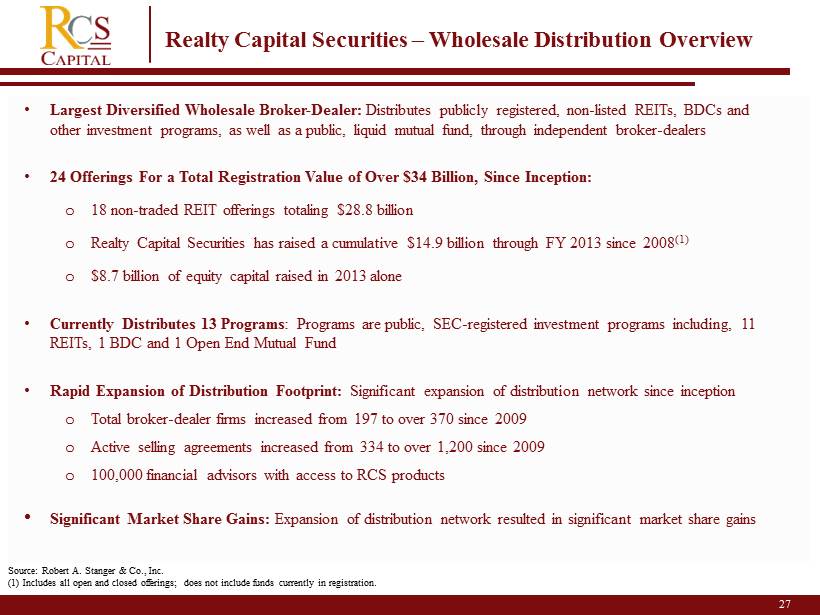
27 2 Source: Robert A. Stanger & Co., Inc . (1) Includes all open and closed offerings; does not include funds currently in registration. • Largest Diversified Wholesale Broker - Dealer: Distributes publicly registered, non - listed REITs, BDCs and other investment programs, as well as a public, liquid mutual fund, through independent broker - dealers • 24 Offerings For a Total Registration Value of Over $ 34 Billion , Since Inception : o 18 non - traded REIT offerings totaling $ 28.8 billion o Realty Capital Securities has raised a cumulative $14.9 billion through FY 2013 since 2008 (1 ) o $8.7 billion of equity capital raised in 2013 alone • Currently Distributes 13 Programs : Programs are public, SEC - registered investment programs including , 11 REITs, 1 BDC and 1 Open End Mutual Fund • Rapid Expansion of Distribution Footprint : Significant expansion of distribution network since inception o Total broker - dealer firms increased from 197 to over 370 since 2009 o Active selling agreements increased from 334 to over 1,200 since 2009 o 100,000 financial advisors with access to RCS products • Significant Market Share Gains: Expansion of distribution network resulted in significant market share gains Realty Capital Securities – Wholesale Distribution Overview
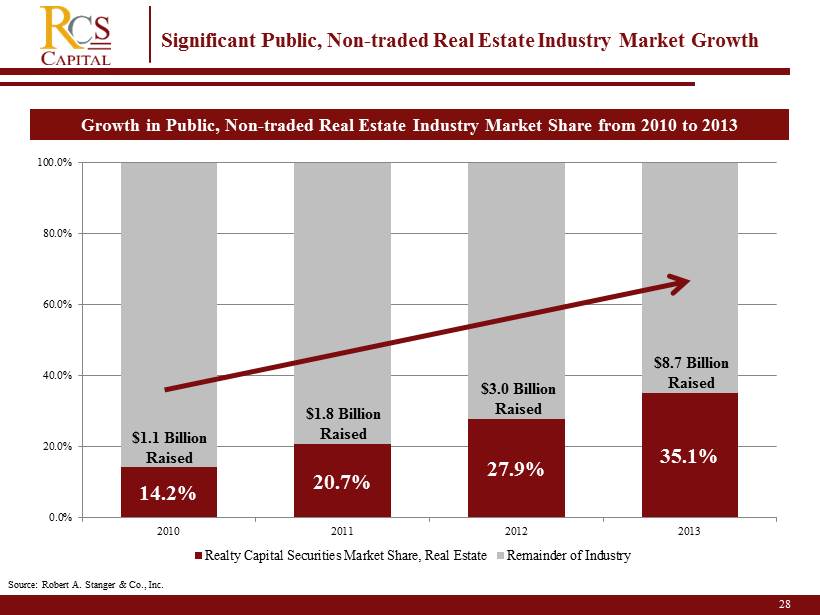
14.2% 20.7% 27.9% 35.1% 0.0% 20.0% 40.0% 60.0% 80.0% 100.0% 2010 2011 2012 2013 Realty Capital Securities Market Share, Real Estate Remainder of Industry 28 2 Source: Robert A. Stanger & Co., Inc. Significant Public, Non - traded Real Estate Industry Market Growth Growth in Public, Non - traded Real Estate Industry Market Share from 2010 to 2013 $1.1 Billion Raised $1.8 Billion Raised $3.0 Billion Raised $8.7 Billion Raised
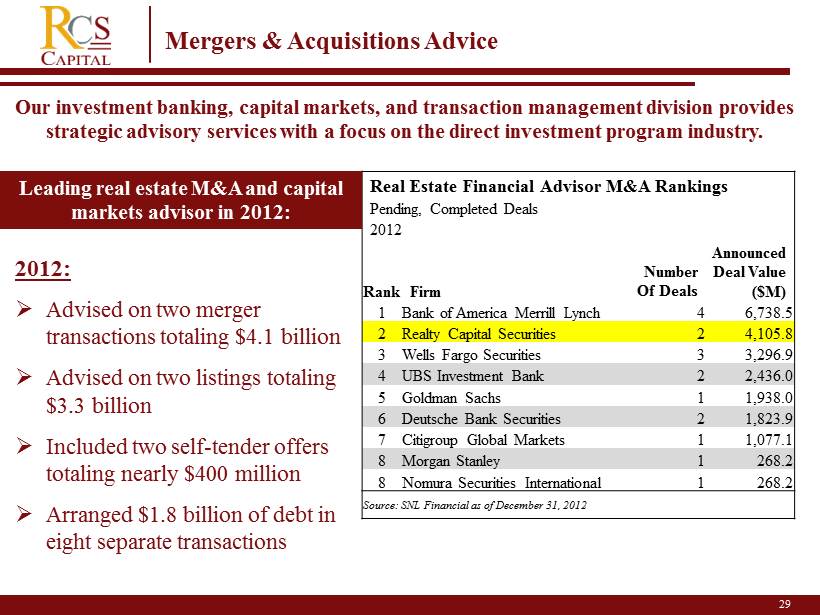
29 Mergers & Acquisitions Advice Real Estate Financial Advisor M&A Rankings Pending, Completed Deals 2012 Rank Firm Number Of Deals Announced Deal Value ($ M) 1 Bank of America Merrill Lynch 4 6,738.5 2 Realty Capital Securities 2 4,105.8 3 Wells Fargo Securities 3 3,296.9 4 UBS Investment Bank 2 2,436.0 5 Goldman Sachs 1 1,938.0 6 Deutsche Bank Securities 2 1,823.9 7 Citigroup Global Markets 1 1,077.1 8 Morgan Stanley 1 268.2 8 Nomura Securities International 1 268.2 Source: SNL Financial as of December 31, 2012 2012: » Advised on two merger transactions totaling $4.1 billion » Advised on two listings totaling $3.3 billion » Included two self - tender offers totaling nearly $400 million » Arranged $1.8 billion of debt in eight separate transactions Leading real estate M&A and capital markets advisor in 2012: Our investment banking, capital markets, and transaction management division provides strategic advisory services with a focus on the direct investment program industry.
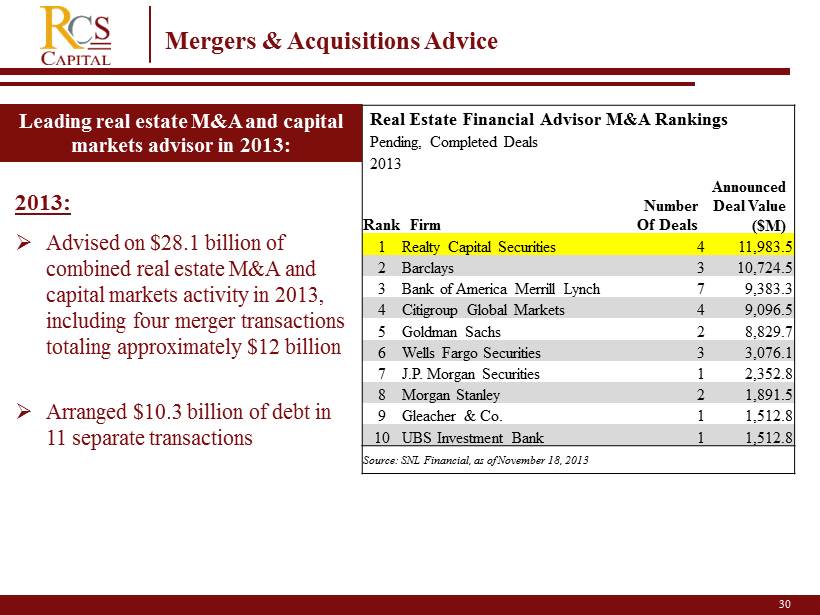
30 2 Mergers & Acquisitions Advice Real Estate Financial Advisor M&A Rankings Pending, Completed Deals 2013 Rank Firm Number Of Deals Announced Deal Value ($ M) 1 Realty Capital Securities 4 11,983.5 2 Barclays 3 10,724.5 3 Bank of America Merrill Lynch 7 9,383.3 4 Citigroup Global Markets 4 9,096.5 5 Goldman Sachs 2 8,829.7 6 Wells Fargo Securities 3 3,076.1 7 J.P. Morgan Securities 1 2,352.8 8 Morgan Stanley 2 1,891.5 9 Gleacher & Co . 1 1,512.8 10 UBS Investment Bank 1 1,512.8 Source: SNL Financial, as of November 18, 2013 2013: » Advised on $28.1 billion of combined real estate M&A and capital markets activity in 2013, including four merger transactions totaling approximately $12 billion » Arranged $10.3 billion of debt in 11 separate transactions Leading real estate M&A and capital markets advisor in 2013:

31 Appendix Market Trends
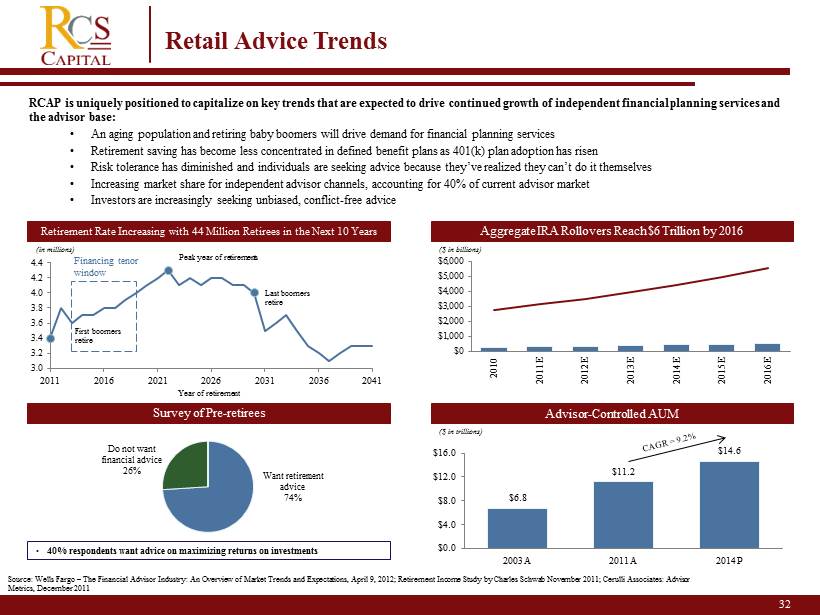
32 2 Retail Advice Trends Retirement Rate Increasing with 44 Million Retirees in the Next 10 Years Survey of Pre - retirees Aggregate IRA Rollovers Reach $6 Trillion by 2016 3.0 3.2 3.4 3.6 3.8 4.0 4.2 4.4 2011 2016 2021 2026 2031 2036 2041 (in millions) First boomers retire Peak year of retirements Last boomers retire Year of retirement Financing tenor window ($ in billions) Want retirement advice 74% Do not want financial advice 26% • 40% respondents want advice on maximizing returns on investments $6.8 $11.2 $14.6 $0.0 $4.0 $8.0 $12.0 $16.0 2003A 2011A 2014P Advisor - Controlled AUM ($ in trillions) Source: Wells Fargo – The Financial Advisor Industry: An Overview of Market Trends and Expectations, April 9, 2012; Retirement Income Study by Charles Schwab November 2011; Cerulli Associates: Advisor Metrics, December 2011 RCAP is uniquely positioned to capitalize on key trends that are expected to drive continued growth of independent financial planning services and the advisor base: • An aging population and retiring baby boomers will drive demand for financial planning services • Retirement saving has become less concentrated in defined benefit plans as 401(k) plan adoption has risen • Risk tolerance has diminished and individuals are seeking advice because they’ve realized they can’t do it themselves • Increasing market share for independent advisor channels, accounting for 40% of current advisor market • Investors are increasingly seeking unbiased, conflict - free advice $0 $1,000 $2,000 $3,000 $4,000 $5,000 $6,000 2010 2011E 2012E 2013E 2014E 2015E 2016E
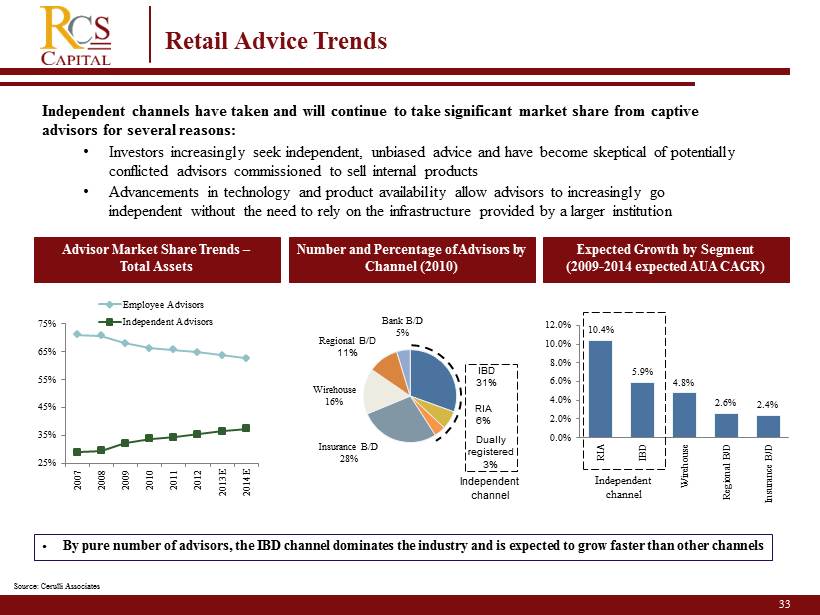
33 2 Retail Advice Trends • By pure number of advisors, the IBD channel dominates the industry and is expected to grow faster than other channels Expected Growth by Segment (2009 - 2014 expected AUA CAGR) Number and Percentage of Advisors by Channel (2010) IBD 31% Insurance B/D 28% Wirehouse 16% Regional B/D 11% RIA 6% Bank B/D 5% Dually registered 3% Independent channel Advisor Market Share Trends – Total Assets 25% 35% 45% 55% 65% 75% 2007 2008 2009 2010 2011 2012 2013E 2014E Employee Advisors Independent Advisors 10.4% 5.9% 4.8% 2.6% 2.4% 0.0% 2.0% 4.0% 6.0% 8.0% 10.0% 12.0% RIA IBD Wirehouse Regional B/D Insurance B/D Independent channel Source: Cerulli Associates Independent channels have taken and will continue to take significant market share from captive advisors for several reasons: • Investors increasingly seek independent, unbiased advice and have become skeptical of potentially conflicted advisors commissioned to sell internal products • Advancements in technology and product availability allow advisors to increasingly go independent without the need to rely on the infrastructure provided by a larger institution
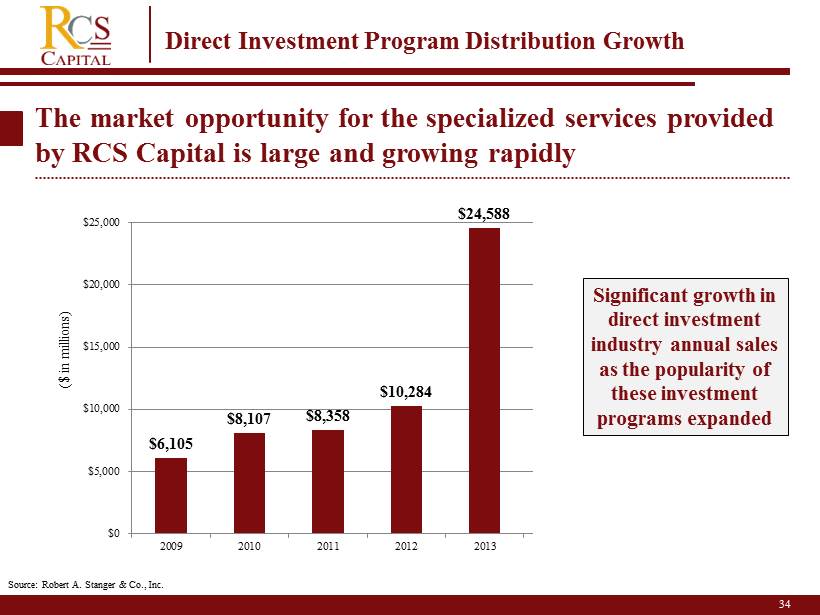
34 2 The market opportunity for the specialized services provided by RCS Capital is large and growing rapidly Source: Robert A. Stanger & Co., Inc. $6,105 $8,107 $8,358 $10,284 $24,588 $0 $5,000 $10,000 $15,000 $20,000 $25,000 2009 2010 2011 2012 2013 ($ in millions) Significant growth in direct investment industry annual sales as the popularity of these investment programs expanded Direct Investment Program Distribution Growth
35 Appendix Investment Banking & Capital Markets
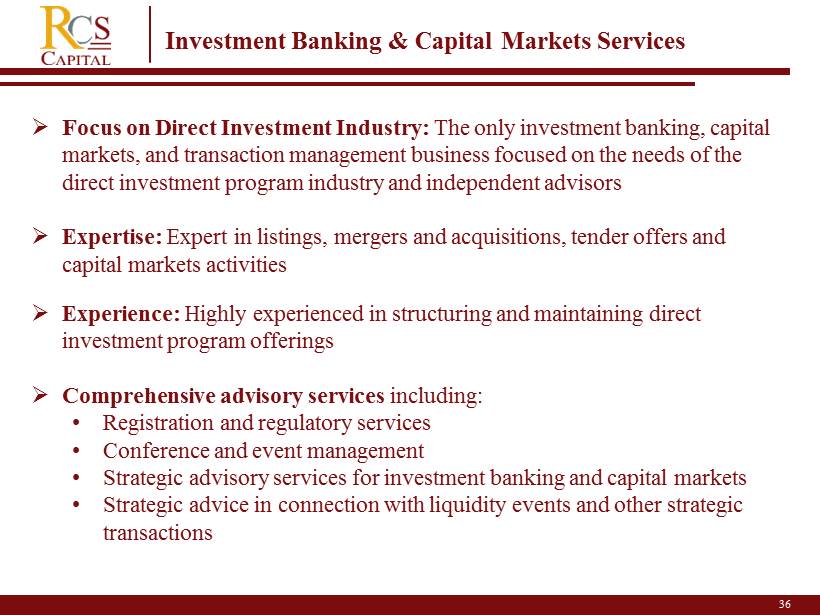
36 2 Investment Banking & Capital Markets Services » Focus on Direct Investment Industry: The only investment banking, capital markets, and transaction management business focused on the needs of the direct investment program industry and independent advisors » Expertise: Expert in listings , mergers and acquisitions, tender offers and capital markets activities » Experience: Highly experienced in structuring and maintaining direct investment program offerings » Comprehensive advisory services including: • Registration and regulatory services • Conference and event management • Strategic advisory services for investment banking and capital markets • Strategic advice in connection with liquidity events and other strategic transactions
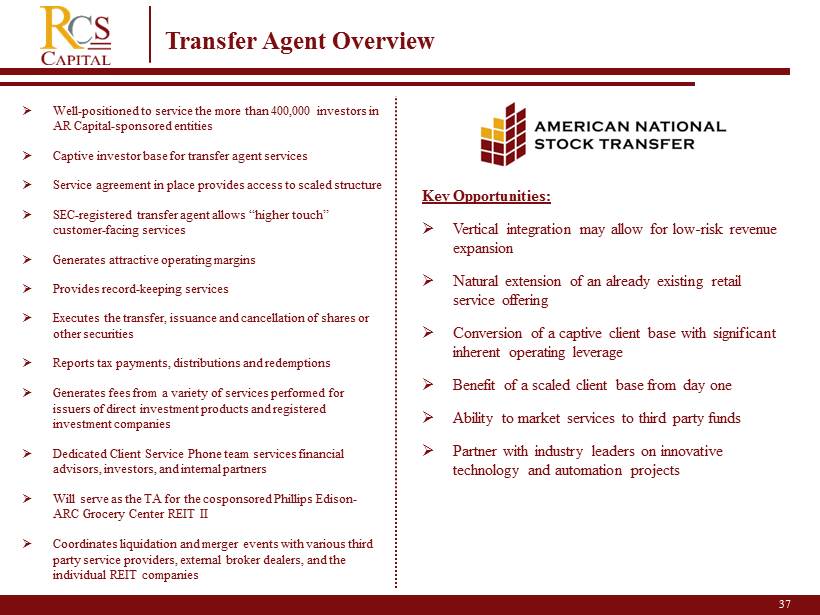
37 2 » W ell - positioned to service the more than 400,000 investors in AR Capital - sponsored entities » Captive investor base for transfer agent services » Service agreement in place provides access to scaled structure » SEC - registered transfer agent allows “higher touch” customer - facing services » Generates attractive operating margins » Provides record - keeping services » Executes the transfer, issuance and cancellation of shares or other securities » Reports tax payments, distributions and redemptions » Generates fees from a variety of services performed for issuers of direct investment products and registered investment companies » Dedicated Client Service Phone team services financial advisors, investors, and internal partners » Will serve as the TA for the cosponsored Phillips Edison - ARC Grocery Center REIT II » Coordinates liquidation and merger events with various third party service providers, external broker dealers, and the individual REIT companies Key Opportunities: » Vertical integration may allow for low - risk revenue expansion » Natural extension of an already existing retail service offering » Conversion of a captive client base with significant inherent operating leverage » Benefit of a scaled client base from day one » Ability to market services to third party funds » Partner with industry leaders on innovative technology and automation projects Transfer Agent Overview
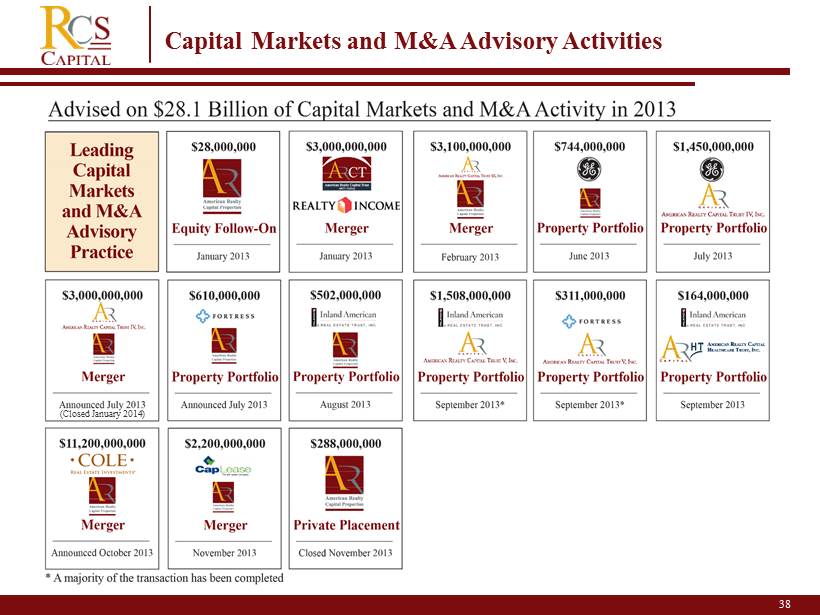
38 2 Capital Markets and M&A Advisory Activities (Closed January 2014)
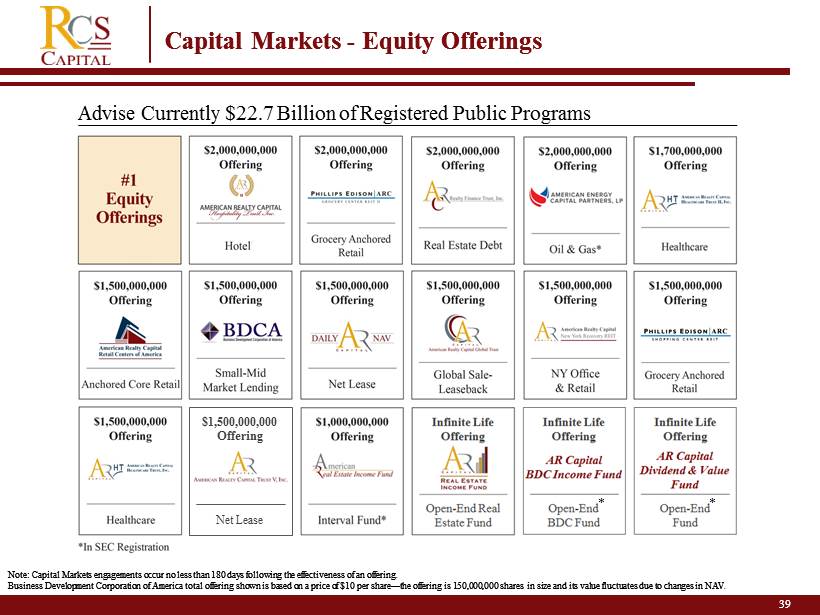
39 2 Capital Markets - Equity Offerings Note: Capital Markets engagements occur no less than 180 days following the effectiveness of an offering Business Development Corporation of America total offering shown is based on a price of $10 per share — the offering is 150,000,00 0 shares in size and its value fluctuates due to changes in NAV 39 2 Capital Markets - Equity Offerings Note: Capital Markets engagements occur no less than 180 days following the effectiveness of an offering. Business Development Corporation of America total offering shown is based on a price of $10 per share — the offering is 150,000,00 0 shares in size and its value fluctuates due to changes in NAV. Infinite Life Offering Open - End Real Estate Fund Advise Currently $22.7 Billion of Registered Public Programs Net Lease $1,500,000,000 Offering * *
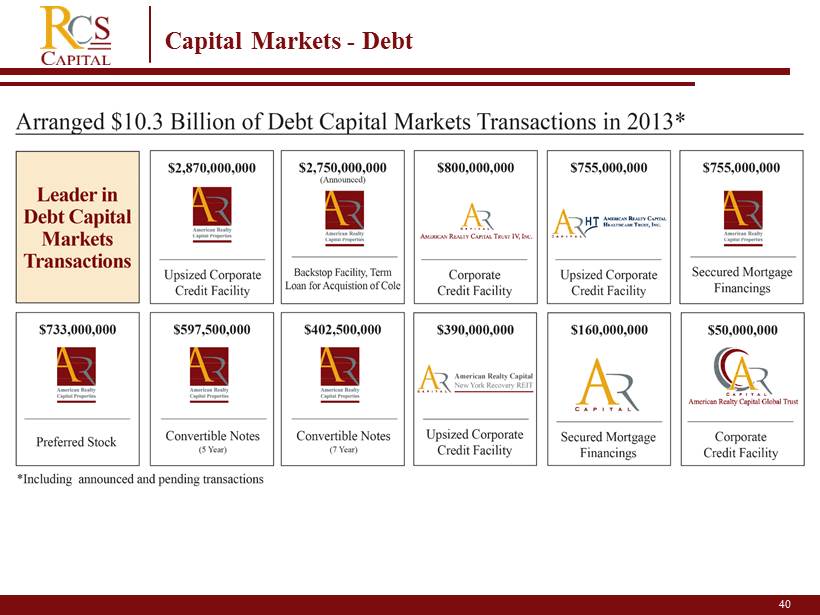
40 2 Capital Markets - Debt
41 Appendix Investment Management
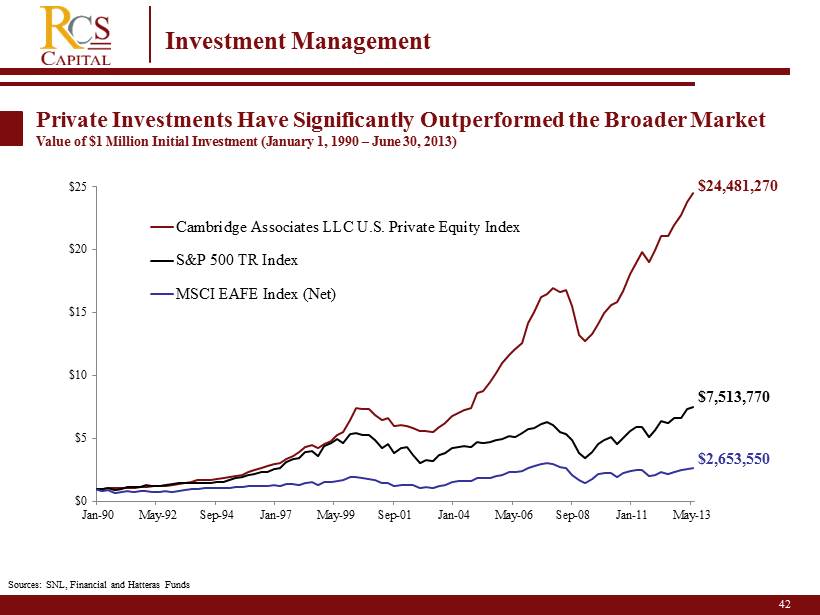
Investment Management Private Investments Have Significantly Outperformed the Broader Market Value of $1 Million Initial Investment (January 1, 1990 – June 30, 2013) $0 $5 $10 $15 $20 $25 Jan-90 May-92 Sep-94 Jan-97 May-99 Sep-01 Jan-04 May-06 Sep-08 Jan-11 May-13 Cambridge Associates LLC U.S. Private Equity Index S&P 500 TR Index MSCI EAFE Index (Net) $24,481,270 $7,513,770 $2,653,550 42 Sources: SNL, Financial and Hatteras Funds
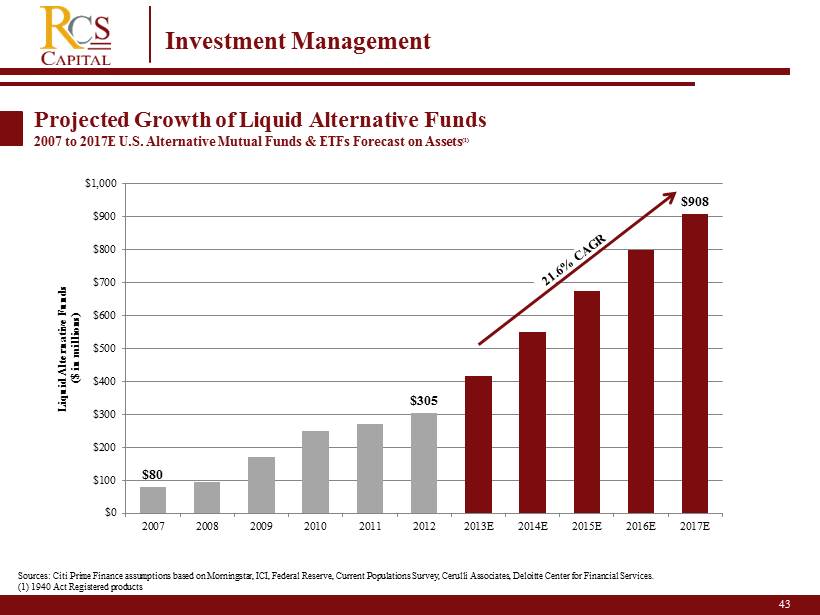
43 2 Projected Growth of Liquid Alternative Funds 2007 to 2017E U.S. Alternative Mutual Funds & ETFs Forecast on Assets (1) Investment Management $80 $305 $908 $0 $100 $200 $300 $400 $500 $600 $700 $800 $900 $1,000 2007 2008 2009 2010 2011 2012 2013E 2014E 2015E 2016E 2017E Liquid Alternative Funds ($ in millions) Sources: Citi Prime Finance assumptions based on Morningstar, ICI, Federal Reserve, Current Populations Survey, Cerulli Assoc iat es, Deloitte Center for Financial Services. (1) 1940 Act Registered products
44 Mutual Fund Advisory and Distribution Overview National Broker - Dealers Registered Investment Advisors Regional Broker - Dealers Independent Broker - Dealers Note: Many of these are associated with Hatteras Funds, acquisition pending

45 45 Appendix Executive Management
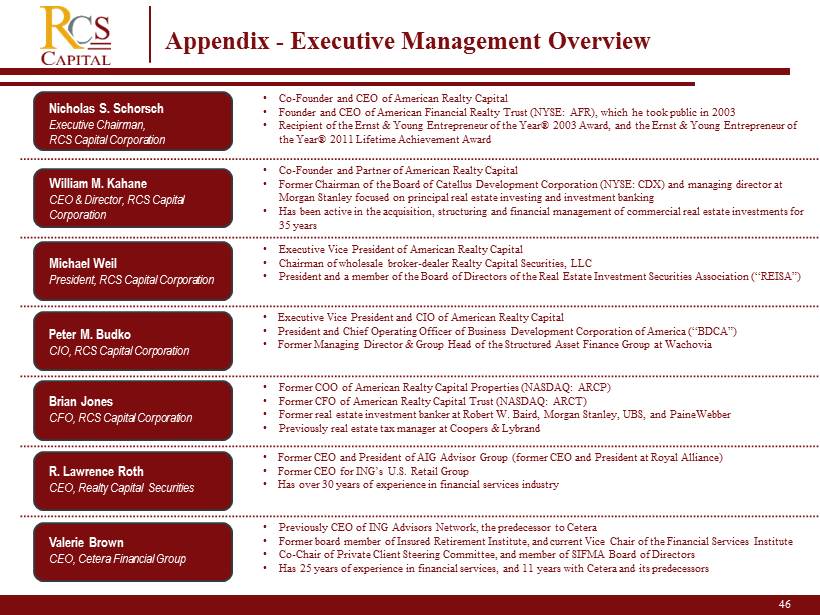
46 2 • Co - Founder and CEO of American Realty Capital • Founder and CEO of American Financial Realty Trust (NYSE: AFR), which he took public in 2003 • Recipient of the Ernst & Young Entrepreneur of the Year® 2003 Award, and the Ernst & Young Entrepreneur of the Year® 2011 Lifetime Achievement Award • Co - Founder and Partner of American Realty Capital • Former Chairman of the Board of Catellus Development Corporation (NYSE: CDX) and managing director at Morgan Stanley focused on principal real estate investing and investment banking • Has been active in the acquisition, structuring and financial management of commercial real estate investments for 35 years • Executive Vice President of American Realty Capital • Chairman of wholesale broker - dealer Realty Capital Securities, LLC • President and a member of the Board of Directors of the Real Estate Investment Securities Association (“REISA”) • Executive Vice President and CIO of American Realty Capital • President and Chief Operating Officer of Business Development Corporation of America (“BDCA”) • Former Managing Director & Group Head of the Structured Asset Finance Group at Wachovia • Former COO of American Realty Capital Properties (NASDAQ: ARCP) • Former CFO of American Realty Capital Trust (NASDAQ: ARCT) • Former real estate investment banker at Robert W. Baird, Morgan Stanley, UBS, and PaineWebber • Previously real estate tax manager at Coopers & Lybrand • Former CEO and President of AIG Advisor Group (former CEO and President at Royal Alliance) • Former CEO for ING’s U.S. Retail Group • Has over 30 years of experience in financial services industry • Previously CEO of ING Advisors Network, the predecessor to Cetera • Former board member of Insured Retirement Institute, and current Vice Chair of the Financial Services Institute • Co - Chair of Private Client Steering Committee, and member of SIFMA Board of Directors • Has 25 years of experience in financial services, and 11 years with Cetera and its predecessors Nicholas S. Schorsch Executive Chairman, RCS Capital Corporation William M. Kahane CEO & Director, RCS Capital Corporation Michael Weil President, RCS Capital Corporation Peter M. Budko CIO, RCS Capital Corporation Brian Jones CFO, RCS Capital Corporation R. Lawrence Roth CEO, Realty Capital Securities Appendix - Executive Management Overview Valerie Brown CEO, Cetera Financial Group