Attached files
| file | filename |
|---|---|
| 8-K - FORM 8-K - NewPage Holdings Inc. | d659471d8k.htm |
 January
15
th
,
2014
Lenders
Presentation
–
Public
$350,000,000 Senior Secured Asset-Based Loan Revolving Credit Facility
$750,000,000 Senior Secured First Lien Term Loan Facility
Exhibit 99.1 |
 Forward-Looking Statements
Certain statements contained in this communication may constitute
“forward-looking statements” within the meaning of the Private
Securities Litigation Reform Act of 1995. These statements include, but are
not limited to, statements regarding the expected timing of the completion of the
merger, the benefits of the merger, including future financial and operating
results, the combined company’s plans, objectives, expectations and
other statements that are not historical facts. Such statements are based on
the views and assumptions of the management of Verso and NewPage and are
subject to significant risks and uncertainties. Actual future events or results may differ
materially from these statements. Such differences may result from the following
factors: the ability to close the transaction on the proposed terms and
within the anticipated time period, or at all, which is dependent on the
parties’ ability to satisfy certain closing conditions, including the
receipt of governmental approvals; the risk that the benefits of
the transaction, including cost
savings and other synergies, may not be fully realized or may take longer to
realize than expected; the impact of the transaction on third-party
relationships; the outcome of government investigations
and
third-party
litigation
involving
both
Verso
and
NewPage;
actions
taken
by
either
of the companies; changes in regulatory, social and political conditions; and
general economic conditions. Additional risks and factors that may affect
results are set forth in Verso’s and
NewPage’s respective filings with the Securities and Exchange Commission,
including Verso’s annual report on Form 10-K for the year ending
December 31, 2012, and NewPage’s registration statement on Form 10. The
forward-looking statements speak only as of the date of this
communication. Neither Verso nor NewPage undertakes any obligation to update these
statements.
1 |
 Participants
2
George F. Martin, Chief Executive Officer
Jay A. Epstein, Chief Financial Officer
David J. Paterson, Chief Executive Officer
Robert P. Mundy, Chief Financial Officer
Malcolm K. Price, Managing Director
Carly A. Baxter, Managing Director |
 3
Table of Contents
1
Executive Summary
2
Pro Forma Combination Rationale
4
NewPage Overview
3
Industry Update
5
Financial Information
6
Syndication Overview |
 4
1.
Executive Summary |
 Executive Summary
On
January
6,
2013,
NewPage
Holdings
Inc.
(“NewPage”
or
the
“Company”)
announced
a
definitive
agreement
to
be
acquired by Verso Paper Holdings LLC (“Verso”) in a transaction valued at
approximately $1.4 billion (the “Transaction”) –
The
Transaction
represents
a
5.2x
enterprise
purchase
multiple
of
NewPage’s
2013E
Adj.
EBITDA
(1)
of
$270m
(or
6.2x
adjusting
for
NewPage’s
current
pension
&
OPEB
liability
)
–
NewPage operating company survives the Merger as a non-guarantor restricted
subsidiary of Verso (with a standalone capital structure)
–
The combination is expected to generate $175m in synergies for Verso and NewPage
(the "Combined Company") –
The Merger is subject to successful completion of the Verso exchange offer,
regulatory approvals and other customary closing conditions
In
connection
with
the
Merger,
NewPage
is
seeking
to
raise
a
new
$750m
First
Lien
Term
Loan
(the
“Term
Loan”)
and
a
$350m ABL Revolver (the “Revolver”) that will be portable and close
before Merger consummation –
Proceeds
will
be
used
to
repay
the
existing
$495m
Term
Loan,
and
fund
a
special
cash
payment
of
$250m
to
NewPage’s existing equityholders in satisfaction of the merger
agreement requirements for the transaction
–
Pro forma for the proposed financing, NewPage will have net leverage of 2.7x 2013E
Adj. EBITDA –
NewPage Moody’s corporate rating is B1, and S&P corporate rating is
expected to be B+ NewPage is the largest coated paper manufacturer in North
America based on production capacity, operating 8 mills in the
U.S.
The
combination
with
Verso
will
make
it
the
4
th
largest
coated
paper
producer
globally
–
NewPage expects 2013E revenue of $3,071m and Adj. EBITDA of $270m (margin:
8.8%) –
For
LTM
9/30/2013,
the
pro
forma
Combined
Company
had
revenue
of
$4.5bn
and
Adj.
EBITDA
of
$583m
(3)
(margin: 13.1%)
5
(2)
(1)
Adj. EBITDA refers to “Consolidated Adjusted EBITDA” as defined by the Credit
Agreement. (2)
Includes ~$271m in 2013E Pension & OPEB liability.
(3)
For LTM 9/30/2013, Verso and NewPage had revenues of $1,401m and $3,065m, respectively, and Adj. EBITDA of $155m and $253m, respectively; the combined company Adj. EBITDA includes
100% of synergies. Verso Adj. EBITDA is pro forma for the effects of cost savings
program. |
 Transaction Overview
6
New $750m NewPage First Lien Term Loan (the
proposed “Term Loan”)
New $350m NewPage ABL Revolver (the proposed
“Revolver”)
Portable financing that will be in place prior to
regulatory approval and Merger close
NewPage Sources & Uses
$495m existing NewPage Term Loan refinancing
~$250m special cash payment to
NWP Equityholders
$650m of new Verso 1L Sr. Sec. “Seller”
Notes issued to NWP Equityholders
Shares of Verso common stock to NWP
Equityholders
(4)
Total
Enterprise
Value
of
~$1.4bn
/
~$1.7bn
(5)
EV
/
2013E
Adj.
EBITDA
of
5.2x
/
6.2x
(5,6)
NewPage
Financing
(3)
$900m
Equity
Purchase
Price
($ in millions)
Sources
Uses
New NWP $350m ABL
–
Refi Existing NWP 1L Term Loan
$495
New NWP 1L Term Loan
750
Equity Purchase Price
900
New VRS Seller Notes
650
Term Loan Prepayment Penalty
10
Cash from NWP Balance Sheet
70
Illustrative Fees & Expenses
(1)
65
Total Sources
$1,470
Total Uses
$1,470
Enterprise Purchase Consideration for NWP
(1)
Includes financing and M&A fees; subject to change.
(2)
Assumes $350m ABL less NewPage’s current LOCs of $33m.
(3)
As a condition to the Merger, Verso has agreed to retire a portion of existing Verso
Junior Notes through an Exchange Offer. (4)
Shares represent 20% (subject to potential adjustment up to 25% under certain
circumstances) of the outstanding shares immediately prior to closing.
(5)
Includes ~$271m in 2013E Pension & OPEB liability.
(6)
Multiples do not include expected cost synergies.
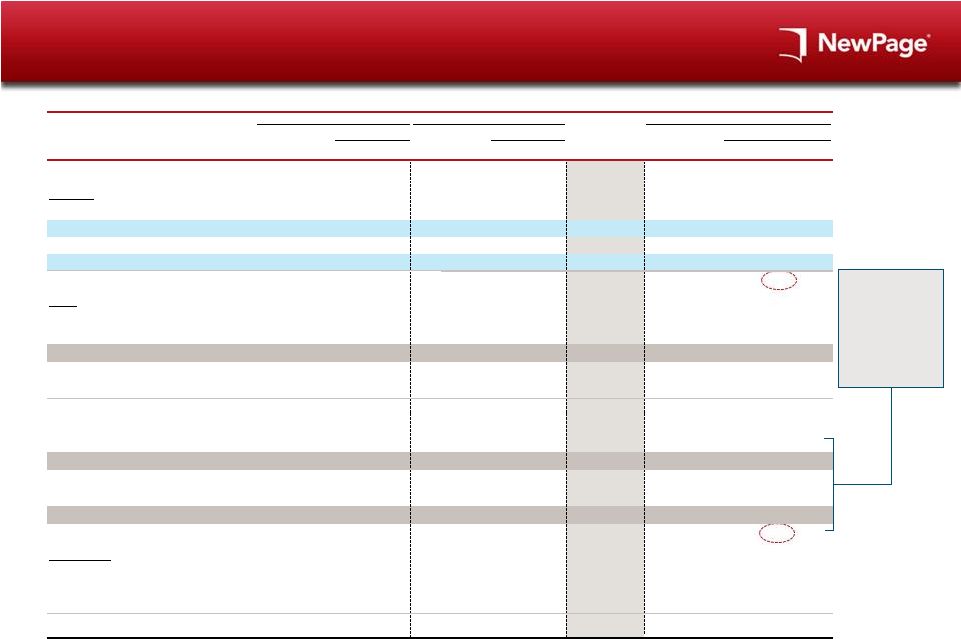
NewPage Pro Forma Capitalization
(2)
($ in millions)
Current
Pro forma
Net cum. mult.
Pro forma
Net cum. mult.
Year-end
2013E
EBITDA
2013E
EBITDA
Cash & Cash Equivalents
Existing $350m ABL
New $350m ABL
Existing 1L Term Loan
New 1L Term Loan
Total 1L Debt
LTM 12/31/13E
NewPage Adj. EBITDA
Liquidity
$83
–
–
495
–
$495
1.5x
$270
$13
–
–
–
750
$750
2.7x
$270
$330 |
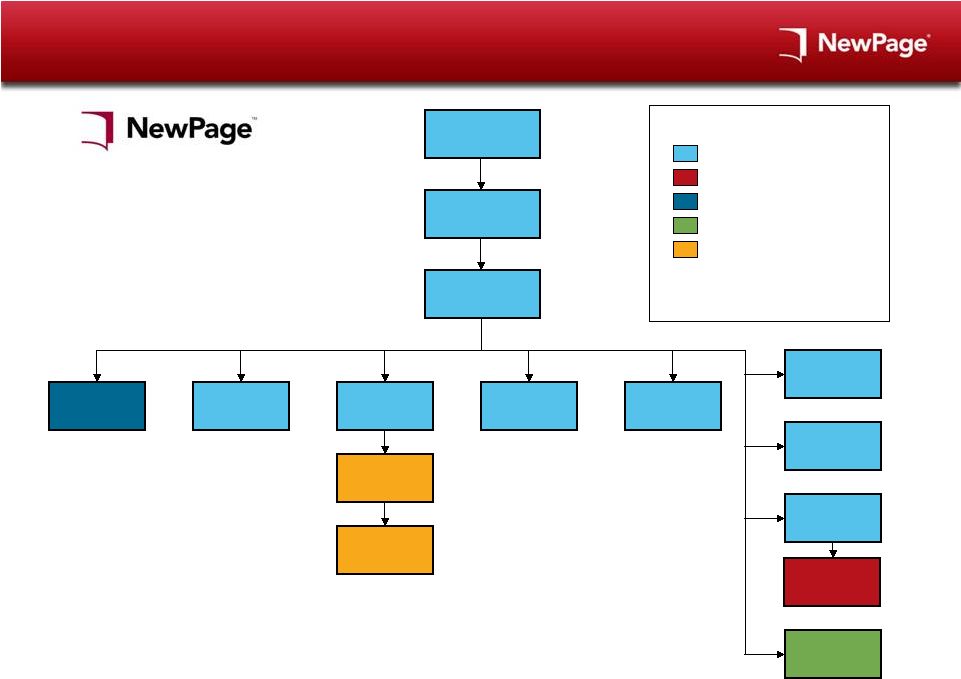
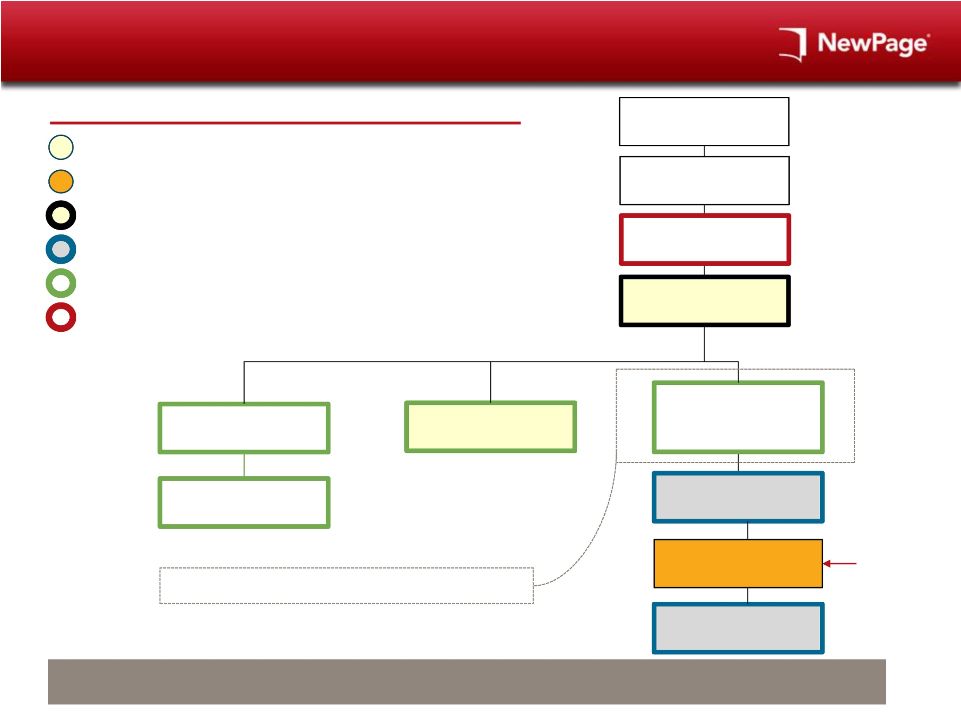 Post-Merger Pro Forma Combined Structure
7
Co-issuer of existing First Lien Notes, 1.5 Lien Notes, non-consenting
Second Lien Notes, non-consenting
Senior
Subordinated
Notes,
new
First
Lien
“Seller”
Notes,
new
Second
Lien
Notes and new Senior Subordinated Notes
NewPage ABL and Term Loan borrower
Verso ABL and Cash Flow borrower
Guarantor of NewPage ABL and Term Loan
Guarantor/co-issuer of Verso ABL and Cash Flow facilities, Verso First Lien
Notes, 1.5 Lien Notes, First Lien “Seller notes”, Second Lien
Notes, Senior Subordinated Notes, other than as noted below
Guarantor of Verso ABL and Cash Flow facilities
Note:
NewPage standalone organizational chart in the Appendix.
Legend
Verso Paper Corp.
Verso Paper Finance
Holdings One LLC
Verso Paper Finance
Holdings LLC
Verso Paper Holdings,
LLC
NewPage Holdings, Inc.
(Survivor of Merger with
Verso Paper Merger
Subsidiary)
NewPage Investment
Company LLC
NewPage Corporation
NewPage Subsidiaries
Verso Paper Inc.
Verso Paper LLC
Verso Subsidiaries
Guarantees all Verso debt except for Non-consenting Second Lien Notes
Or Non-consenting Senior Subordinated Notes
The NewPage Operating Company Will Be a Non-Guarantor Restricted Subsidiary for
Verso’s Notes with a Standalone Capital Structure
Borrower of
facilities
offered hereby |
 8
2.
Pro Forma Combination Rationale |
 9
9
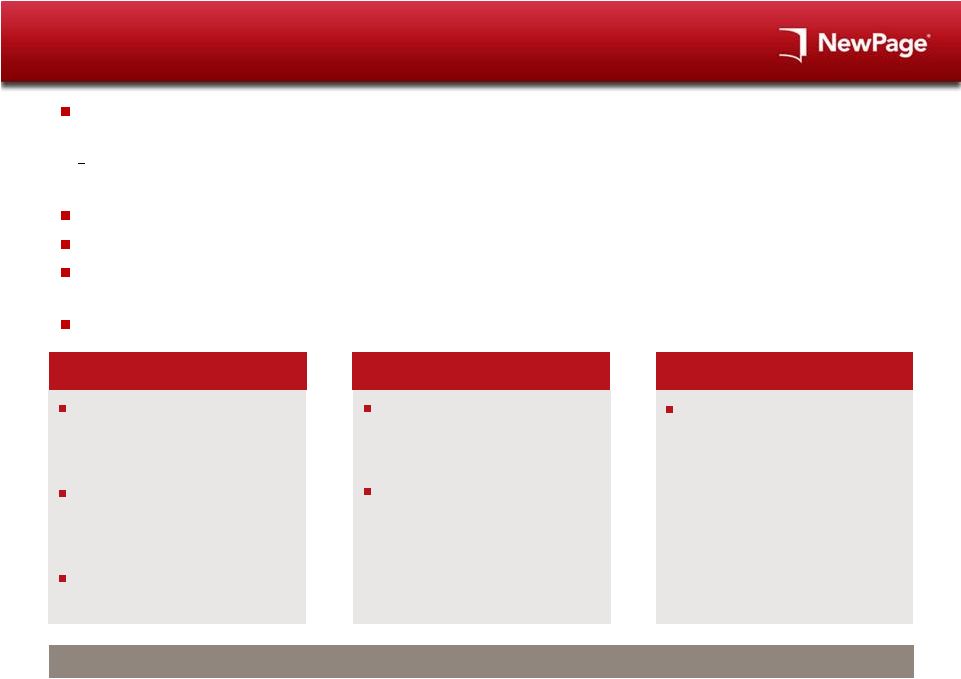
Creates a Combined Company with the Scale Necessary to Reduce Operating Costs,
Generate Greater Economies of Scale and Provide a Higher Level of Customer
Service The Combined Entity Will Be a Strong,
Stable Coated Paper Producer
Will
be
the
largest
coated
paper
producer
in
North
America,
and
become
4
th
largest
globally
–
Pro
forma
combined
LTM
9/30/2013
revenue
and
Adj.
EBITDA
of
$4.5bn
and
$583m
(1)
,
respectively
(margin: 13.1%)
Combined company generates strong free cash flow for debt repayment
Leverages Verso’s operating expertise (R-Gap program) across a larger
company Anticipated annual cost synergies conservatively estimated at
$175m –
Production cost savings and efficiencies due to improved utilization, longer runs
and less grade changing –
Purchasing synergies
–
Reduction of redundant product and supply inventory
–
Reduction of overhead and administrative cost
(1)
For LTM 9/30/2013, Verso and NewPage had revenues of $1,401m and $3,065m, respectively, and Adj. EBITDA
of $155m and $253m, respectively; the combined company Adj. EBITDA
includes 100% of synergies. Verso Adj. EBITDA is pro forma for the effects of cost savings program. |
 A Combination Will
Result in the Largest Coated Paper Producer in N. America & #4 Globally
10
(Tons in millions)
Global Coated Paper Capacity
Well-Located Mills
Verso Mills:
Androscoggin, ME
Capacity: 635k tons
Products: CGW, CFS
Quinnesec, MI
Capacity: 425k tons
Products: CFS
Bucksport, ME
Capacity: 405k tons
Products: LW CGW
NewPage
Verso
Duluth
Wisconsin Rapids
Biron
Stevens Point
Escanaba
Quinnesec
Adroscoggin
Luke
Bucksport
Wickliffe
Rumford
Biron, WI
Capacity: 370k tons
Products: LW CGW
Duluth, MN
Capacity: 270k tons
Products: SC
Escanaba, MI
Capacity: 785k tons
Products: CFS, CGW,
specialty, uncoated
Luke, MD
Capacity: 480k tons
Products: CFS,
specialty
Wickliffe, KY
Capacity: 285k tons
Products: CFS, UFS,
specialty
Rumford, ME
Capacity: 565k tons
Products: CFS, CGW,
specialty
Stevens Point, WI
Capacity: 185k tons
Products: specialty
Wisconsin
Rapids,
WI
Capacity: 560k tons
Products: CFS,
specialty
NewPage Mills:
#4 Coated Paper
Producer Globally
5.4
5.1
5.0
4.2
3.0
2.4
2.1
1.8
Asia Pulp
& Paper
UPM
Sappi
Verso /
NewPage
Stora
Burgo
Oji Paper
Nippon
CFS
CGW
Source:
NewPage
and
Verso
Annual
Reports,
NewPage
and
Verso
websites
and
RISI.
Note: Figures represent capacity as of December
31, 2012. |
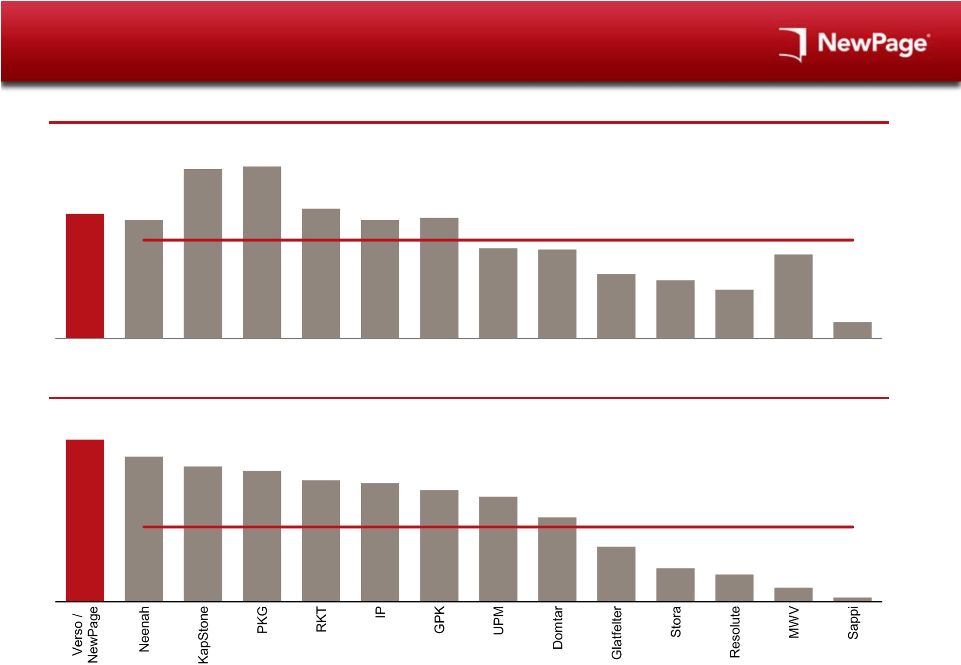 The
Combined Company Would Have Consistent Top Quartile FCF Metrics
11
Source:
FactSet, IBES consensus estimates and Wall Street Research.
Note:
FCF defined as EBITDA, less capex; FCF conversion defined as EBITDA, less capex as a
percent of EBITDA. Verso / NewPage represents LTM 9/30/13 financials, and
includes 100% of synergies. Comparable companies shown on a CY2013E basis
using IBES research estimates. Avg: 58%
Avg: 8%
14%
FCF Conversion
FCF as a % of Sales
10%
10%
14%
14%
11%
10%
10%
7%
7%
5%
5%
4%
7%
1%
79%
75%
72%
71%
69%
68%
67%
65%
60%
53%
48%
46%
43% |
 Significant Opportunity
to Leverage Verso’s Operating Expertise
12
NewPage Avg: 7.7%
Verso Avg: 9.5%
VRS adv: 180bps
Systematic
Review of
Each Process
& Component
Apparent Gap
Adjustment
Realizable Gap
Opportunity
Implement and
Track
Manage
Facility Plan
Improvement
Tactics
R-GAP is Verso’s highly successful continuous cost
improvement program
The program compares existing manufacturing processes to
the theoretical “best-in-class”
benchmarks
Hundreds of efficiency projects on-going at any given time
Requires minimal capex
NewPage Avg: $71
Verso Avg: $78
VRS adv: +11%
EBITDA Benefit From
Closing Gap: $55m
=
PF 2013E EBITDA:
$325m vs $270m
EBITDA Benefit From
Closing Gap: $25m
=
PF 2013E EBITDA:
$295m vs $270m
(1)
(1)
(1)
(1)
Source:
Company Filings and Management.
(1)
Illustrative calculation because Verso and NewPage differ with regards to product mix and
end-markets. Adj. LTM EBITDA Margin –
Last 4 Quarters
Adj. LTM EBITDA per Ton –
Last 4 Quarters
Verso’s R-GAP Program will complement NewPage’s
Lean Six Sigma (LSS) Cost Saving Initiatives
9.6%
9.6%
9.4%
9.5%
8.2%
7.3%
7.5%
7.6%
3Q13
2Q13
1Q13
4Q12
NewPage
Verso
$79
$79
$77
$78
$76
$68
$69
$71
3Q13
2Q13
1Q13
4Q12
Verso’s Average Annual Savings >$45 Million Last 4 Years |
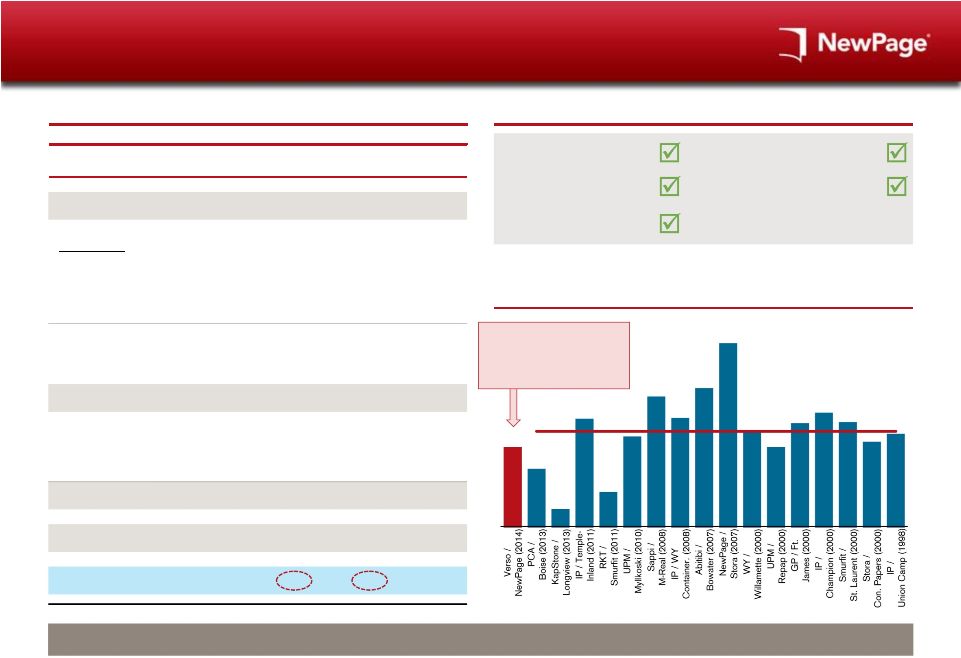 Cost
Synergies are Conservative and Achievable Source:
Verso Management, Company Annual Reports, Company websites, CapIQ, and Wall Street
Research. Restructuring costs related to implementation of synergies is
estimated by Verso Management to cost $80m. (1)
Net of expected cost savings already reflected in 2014E NewPage Adj. EBITDA from
NewPage’s optimization program, Lean Six Sigma (LSS). (2)
Transactions listed using the following format: Acquirer / Target (date of
transaction). Estimated
Synergies
are
Conservative
and
in
line
Compared
to
Precedent
Paper
Transactions
13
Good Strategic Fit
Improves Core Business
Significant Synergies
Low Integration Risk
Quality Assets
($ in millions)
% of
$ per
Amount
NWP Sales
Ton
Distribution Expense
$9
0.3%
$2
Direct Costs
Fiber
$19
0.6%
$4
Purchased pulp
5
0.1%
1
Energy
3
0.1%
1
Raw materials
42
1.3%
8
Total Direct Costs
$68
2.2%
$13
Indirect Costs
$5
0.2%
$1
Direct / Indirect Cost Synergies
$73
2.3%
$14
Corporate Overhead Costs
$57
1.8%
$11
IT Expenses
$6
0.2%
$1
Total SG&A Synergies
$63
2.0%
$12
Net First Year RGAP Savings
(1)
$30
1.0%
$6
Synergies Achieved in 18 Months
$175
5.6%
$34
Cost Synergy Summary
Synergy Assessment
Synergies as % of Sales in Precedent Transactions
(2)
5.6%
4.0%
1.2%
2.4%
7.6%
6.4%
9.2%
7.7%
10%
13.1%
6.8%
5.6%
7.3%
8.1%
7.4%
6.0%
6.6%
Avg: 6.8%
Verso / NewPage synergy
estimate below average
synergy estimates for
similar paper transactions |
 14
3.
Industry Update |
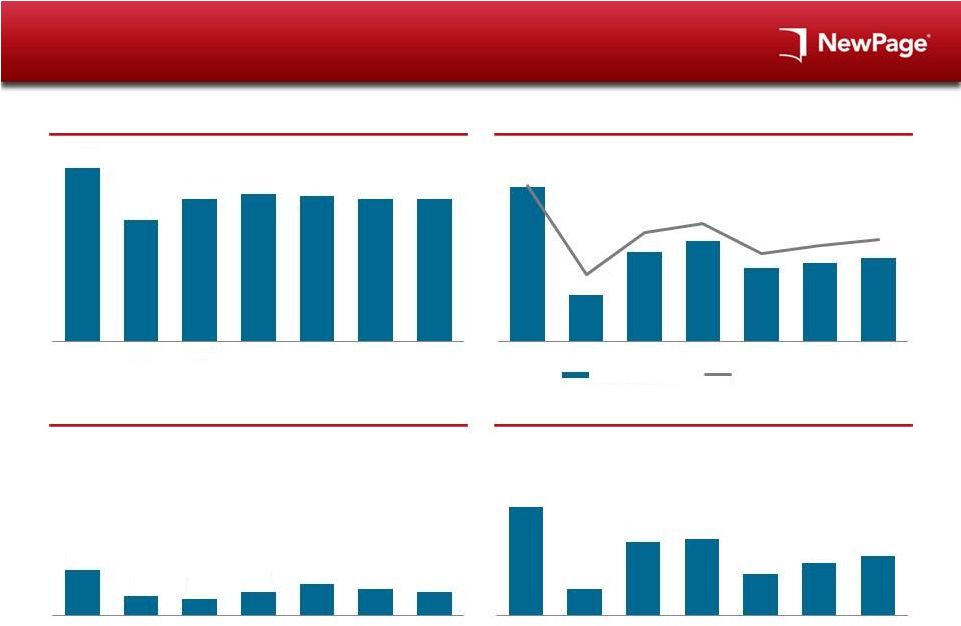
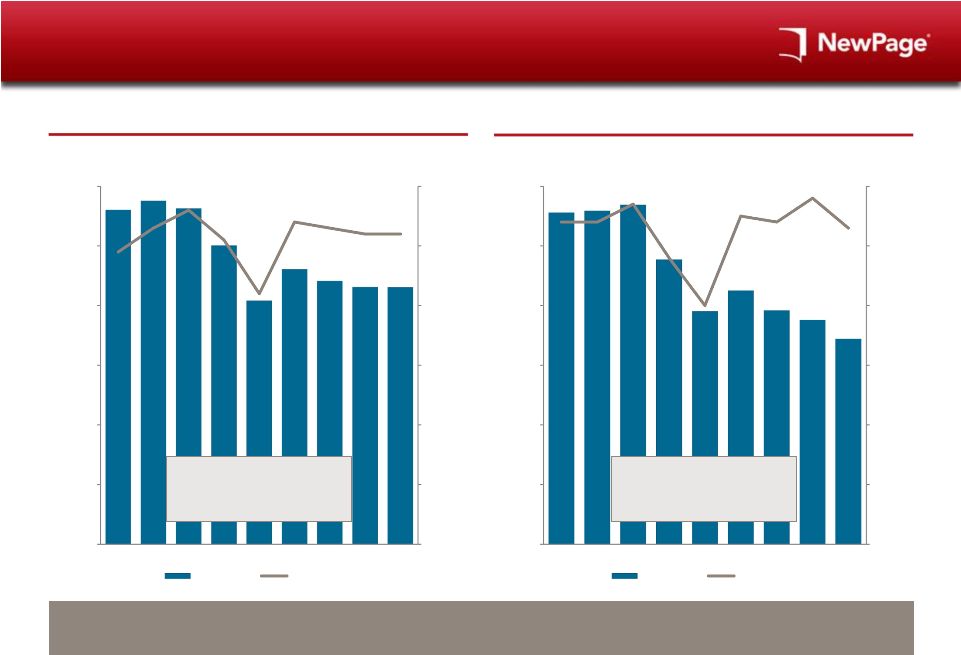 Industry Maintains Substantial Utilization Rates
15
Tons in '000s
% Utilization
Tons in '000s
% Utilization
North American Coated Paper has Witnessed a Decrease in Demand; However, Substantial
Utilization Rates have Remained
Source:
RISI historical for actuals, November 2013 RISI for forecast.
CGW Shipments: 2005A-2013F
Decline of ($2,117k) Tons,
(6%) Decline P.A.
CFS Shipments: 2005A-2013F
Decline of ($1,298k) Tons,
(3%) Decline P.A.
Relatively
Flat
Coated Freesheet –
Shipments and Utilization
Coated Groundwood –
Shipments and Utilization
6,000
5,000
4,000
3,000
2,000
1,000
–
6,000
5,000
4,000
3,000
2,000
1,000
–
2005A
2006A
2007A
2008A
2009A
2010A
2011A
2012A
2013F
2005A
2006A
2007A
2008A
2009A
2010A
2011A
2012A
2013F
Shipments
Utilization
Shipments
Utilization
5,606
5,756
5,628
5,008
4,084
4,609
4,413
4,312
4,308
94%
93%
92%
92%
5,560
5,590
5,689
4,774
3,907
4,253
89%
93%
96%
91%
82%
3,920
3,763
3,443
100%
90%
80%
70%
60%
50%
40%
100%
90%
80%
70%
60%
50%
40%
95%
94%
98%
93%
94%
94%
97%
88%
80% |
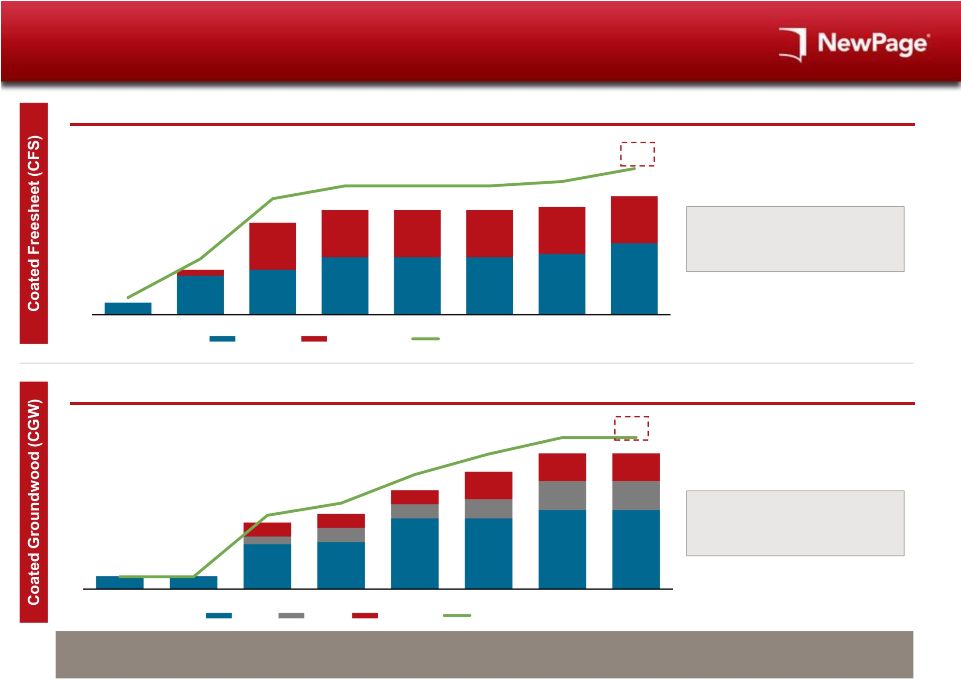 Competitive Forces Have Resulted in the Closure of High-
Cost Mills Over the Last Several Years as Demand Declined
16
Source:
RISI historical for actuals.
(1)
Beginning capacity based on 2005.
Industry Has Reduced Capacity in the Face of Demand Declines which has Resulted in
the Removal of High Cost Capacity
(1)
(1)
Other
NewPage
Other
Verso
NewPage
Cumulative Capacity Reduction (‘000s Tons)
Cumulative Capacity Reduction (‘000s Tons)
CGW Shipments: 2005A-2013F
Demand Decline of ($2,117k) Tons,
(6%) Decline Per Annum
CFS Shipments: 2005A-2013F
Demand Decline of ($1,298k) Tons,
(3%) Decline Per Annum
4%
13%
27%
30%
30%
30%
31%
34%
210
776
1,591
1,812
1,812
1,812
1,867
2,052
210
100
676
776
815
815
997
815
997
815
997
815
1,052
815
1,237
2006
2007
2008
2009
2010
2011
2012
2013
2006
2007
2008
2009
2010
2011
2012
2013
234
234
1,208
1,365
1,796
2,133
2,463
2,463
234
234
254
140
814
853
258
254
1,284
258
254
1,284
348
501
1,434
528
501
1,434
528
501
3%
3%
18%
21%
28%
33%
37%
37%
% of Beginning Capacity
% of Beginning Capacity |
 17
4.
NewPage Overview |
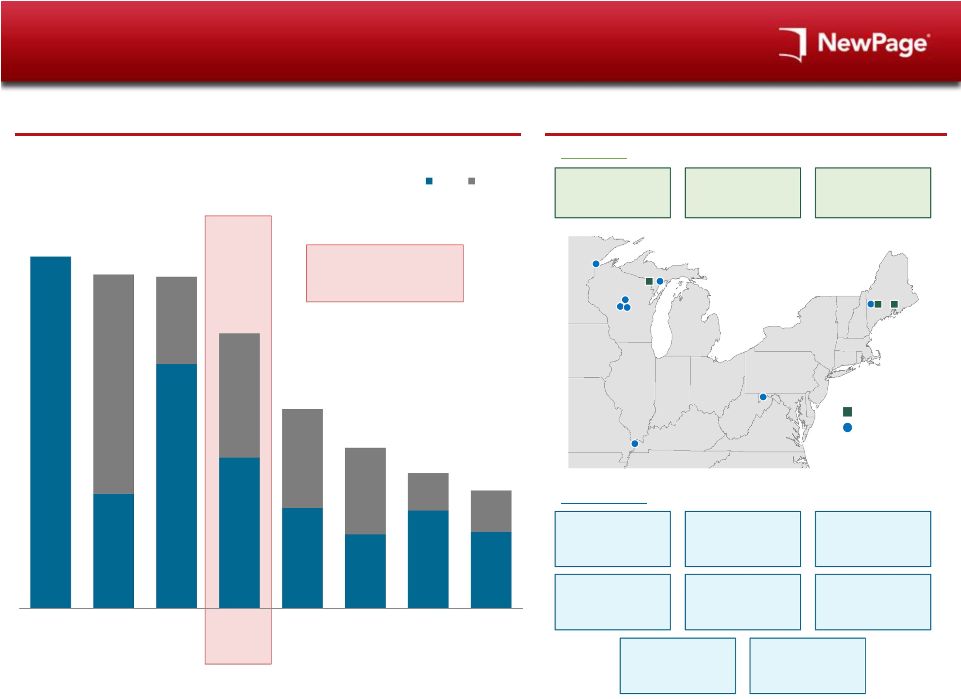
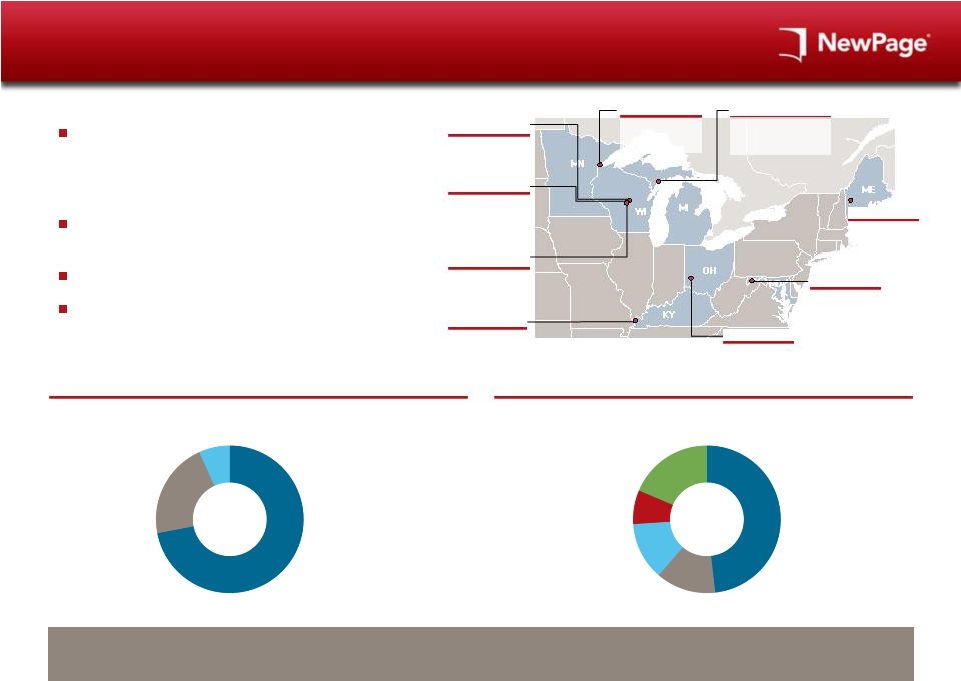 18
NewPage has Well-Located Mills Supplying
Diversified End-Markets
3.5 million tons of capacity across 8 mills
–
2.9 million tons of coated paper
–
400,000 tons of uncoated paper
–
200,000 tons of specialty paper
The Company has 2 major distribution facilities
in addition to its 8 paper mills
Headquartered in Miamisburg, Ohio
Approximately 5,600 employees
2012 NewPage Revenue by Product
2012 NewPage Revenue by End-Market
Source:
Company data.
Combination with Verso will Maintain Focus on Coated Paper Products, and Diversify
the Combined Company’s End-Markets
Rumford, Maine
Escanaba, Michigan
Biron, Wisconsin
Wisconsin Rapids,
Wisconsin
Wickliffe, Kentucky
Duluth, Minnesota
Luke, Maryland
Headquarters
Coated
72%
Other
21%
Supercalendered
7%
Commercial Print
48%
Catalog
13%
Magazine
13%
Coupons and
Inserts
7%
Other
19%
Stevens Point,
Wisconsin
Specialty paper
Coated and
specialty
paper
Coated and
specialty
paper
Coated, specialty and
uncoated paper
Supercalendered
paper
Coated, specialty
and uncoated paper
Coated and
specialty
paper
Coated and
specialty
paper
Miamisburg, Ohio |
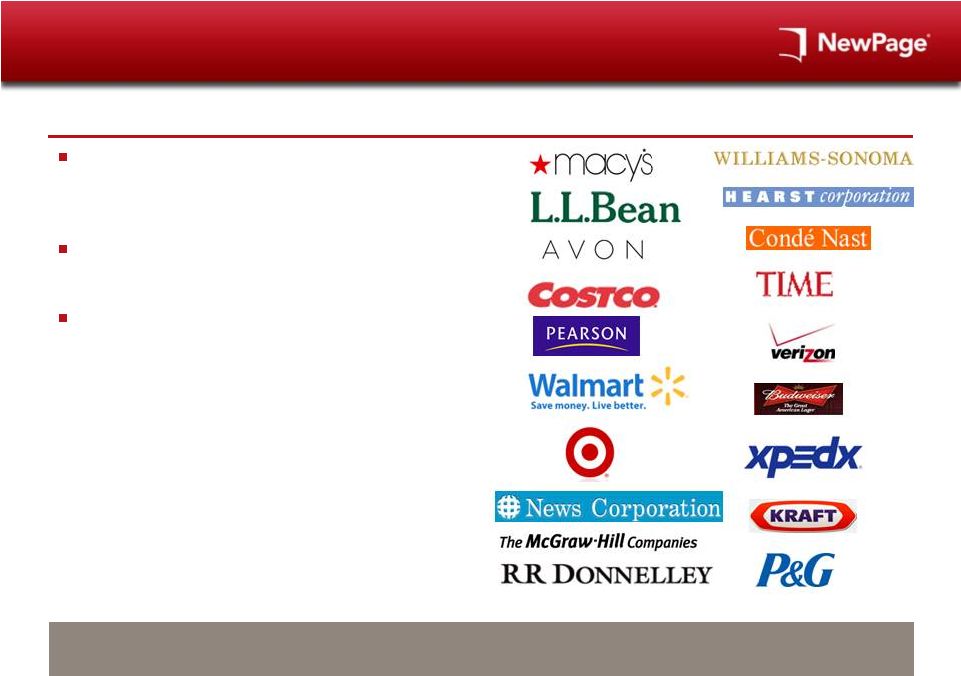 19
NewPage Enjoys Long Standing Relationships
with a Diverse Group of Customers
Source:
Company data.
Combination with Verso will Bolster NewPage’s Ability to Service the Needs of
its Customers Due to an Even More Flexible Operating Platform
NewPage Customers
NewPage has long-standing relationships
with
many leading publishers, commercial printers,
specialty retail merchandisers and paper merchants
Diversified sales channels
–
direct sales, merchant
and broker sales, and specialty sales
Efficient and integrated supply chain
–
NewPage has two major distribution facilities in
addition to its eight paper mills
–
The Company’s mills, along with the various
distribution systems, are strategically located
throughout North America
–
NewPage partners with paper merchants to
provide warehousing and distribution systems to
service both national and local markets |
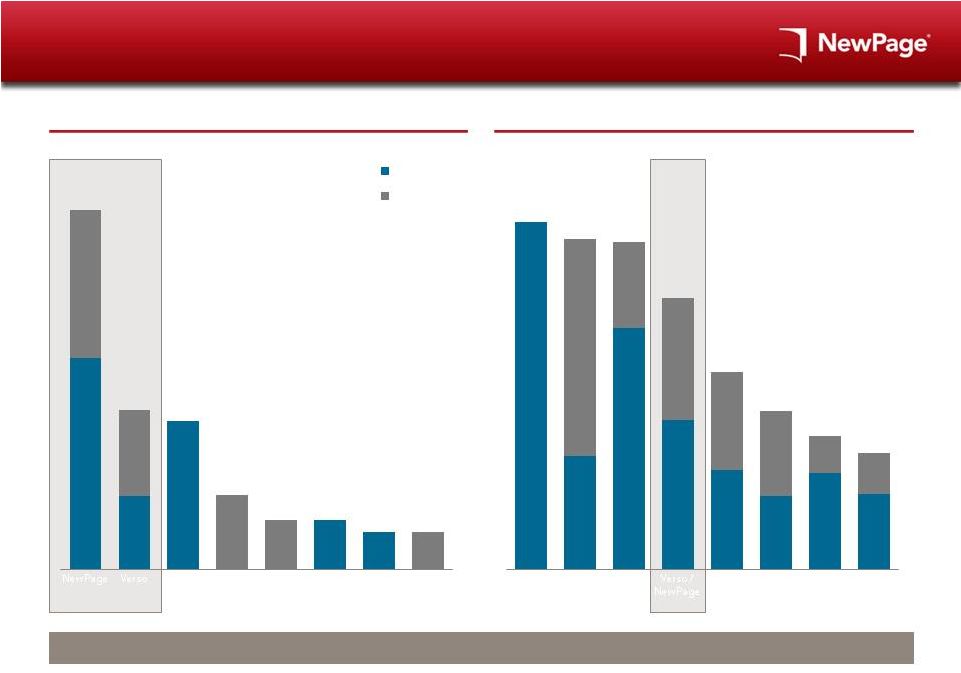 20
Coated Paper Capacity Globally and in
North America
Source:
RISI Capacity reports.
(1)
IP's announced closure of Courtland, AL mill will reduce coated freesheet capacity
by ~185k tons. (Tons in millions)
(Tons in millions)
2.9
1.3
1.2
0.6
0.4
0.4
0.3
0.3
NewPage
Verso
Sappi
Resolute
UPM
IP
Sequana
Kruger
CFS
CGW
5.4
5.1
5.0
4.2
3.0
2.4
2.1
1.8
Asia Pulp
& Paper
UPM
Sappi
Verso /
NewPage
Stora
Burgo
Oji Paper
Nippon
A Combination will Result in the Largest Coated Paper Producer in North America &
#4 Globally (1)
North American Coated Paper Capacity
Global Coated Paper Capacity |
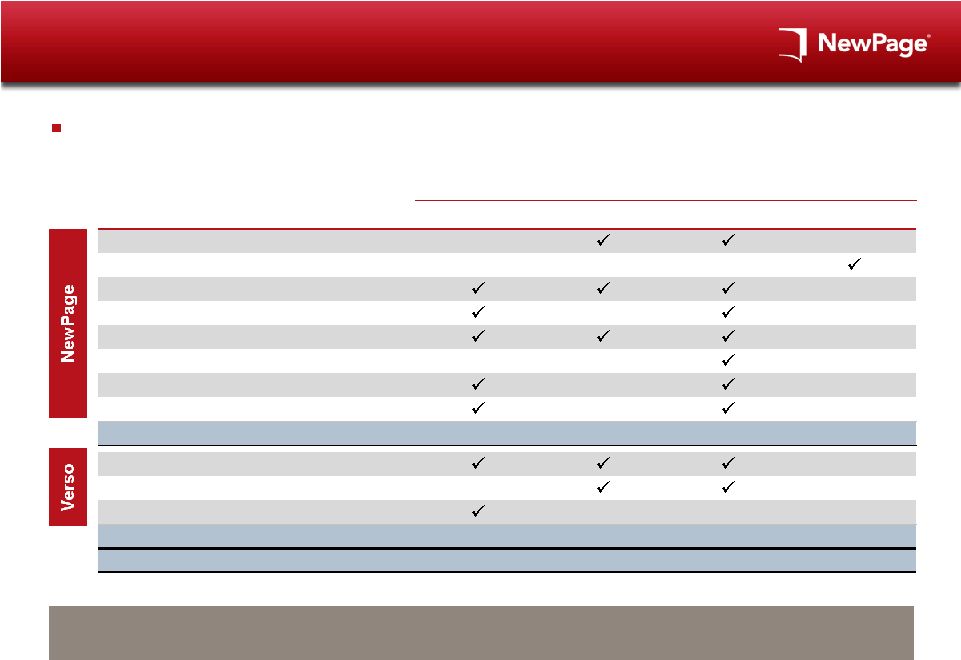 21
NewPage’s Efficient Mill System has Significant
Operating Flexibility
Source:
Management.
Note:
CFS = Coated Freesheet; CGW = Coated Groundwood; SC = Supercalendered.
(1)
On Nov 19th, NewPage announced its intention to idle No. 12 paper machine at
Rumford, which has estimated annual capacity of ~115K tons, beginning mid February 2014.
Capacity
Mill / Machine
(000 tons)
CFS
CGW
Specialty
SC
Biron
370
Duluth
270
Escanaba
785
Luke
480
Rumford
565
Stevens Point
185
Wickliffe
285
Wisconsin Rapids
560
Total NewPage
3,500
Androscoggin
635
Bucksport
405
Quinnesec
425
Total Verso
1,465
Pro Forma Total
4,965
Combination Presents Potential Cost Savings Upside in Rescheduling Production to
Lengthen Production Runs, Optimize Utilization, and Minimize Delivery
Costs (1)
The Combined Company will have improved operating flexibility in allocating production among
its facilities |
 22
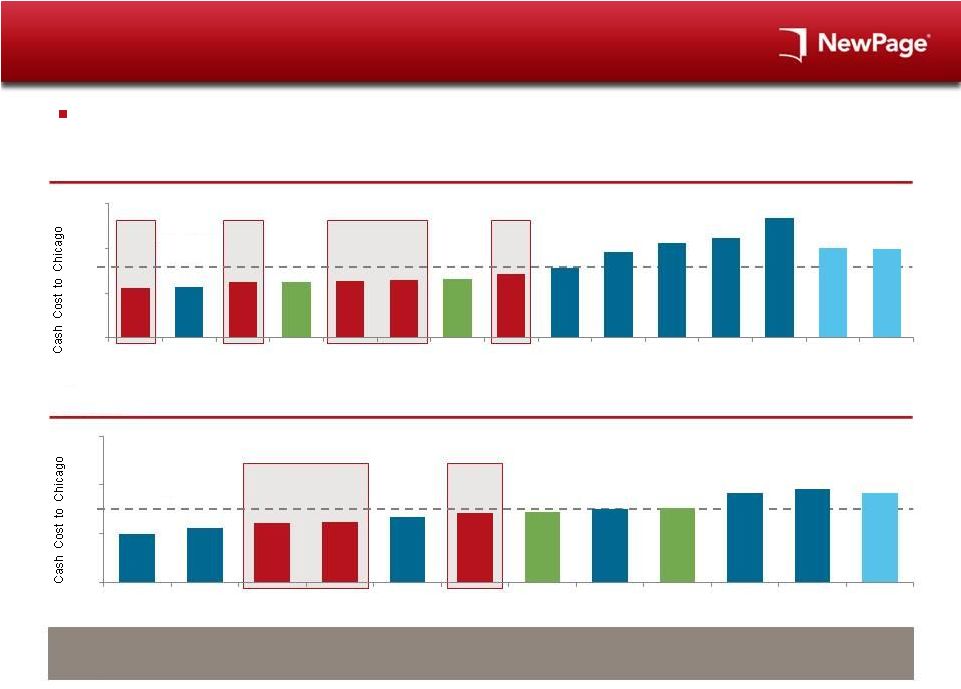
NewPage Operates Many of the Lowest Cost
Coated Paper Mills in the Industry
NewPage and Verso Mills have Lower Cash Costs Relative to Competitors, Driven by
their Pulp- Integration and Structural Characteristics
Average:
$705
Source:
RISI Cornerstone (As of Q3-2013).
Average:
$682
NewPage and Verso have well invested mills, with cumulative capex spend since 2000
of approximately $1.7bn and $950m, respectively (total: ~$2.7bn)
CFS Mills
CGW Mills
400
600
800
$1,000
NWP -
Wisc Rapids
A
NWP -
Escanaba
VRS -
Quinnesec
NWP -
Luke
NWP -
Rumford
VRS -
Androscoggin
NWP -
Wickliffe
B
C
D
E
F
Europe
Asia
600
800
$1,000
NWP -
Escanaba
NWP -
C
NWP -
VRS -
Androscoggin
D
VRS -
Bucksport
E
F
Europe
400
A
B
Rumford
Biron |
 23
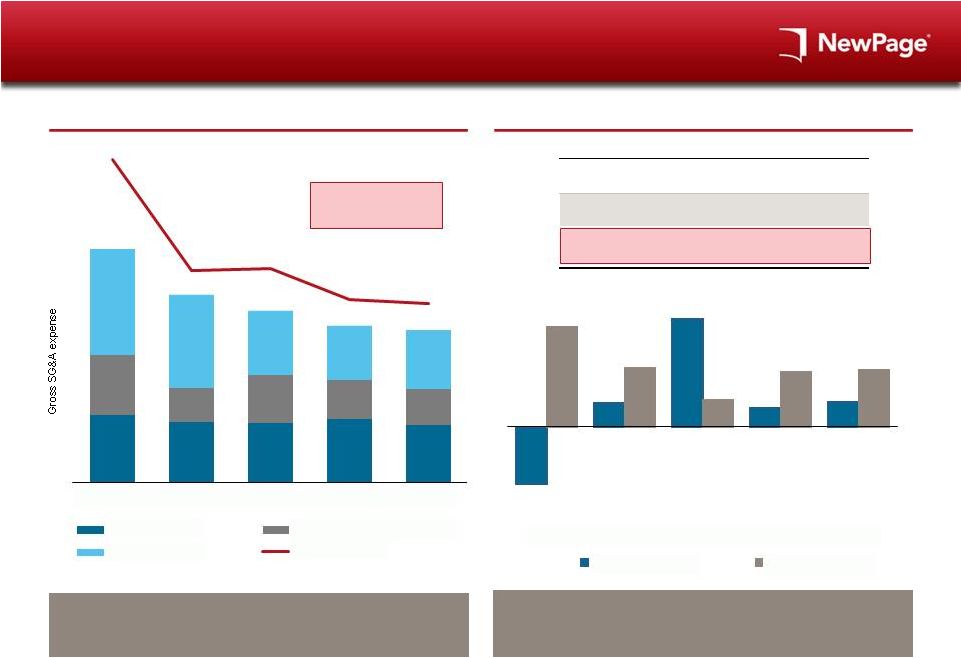
Cost Reduction Opportunities Will Be
Enhanced by Potential Combination
NewPage SG&A
NewPage Mill Productivity and Inflation
Decline in SG&A Expense on the Back of Reduction in
Headcount from 635 in 2009 to 503 in 2013F
Over $270 million in Cumulative Savings Have Been
Achieved at NewPage, Net of Inflation. Verso R-Gap Will
Provide Additional Upside
Source:
Company data.
(1)
Excludes
assessments,
pension/OPEB,
incentive,
equity
award,
and
depreciation.
Potential synergy upside of
$63 million for Combined
Company
(1)
($ in millions)
$249
$201
$184
$168
$163
$83
$55
$55
$47
$46
($ in millions)
$72
$65
$64
$68
$62
$64
$36
$51
$42
$38
$113
$100
$69
$58
$63
Employee Costs
Overhead Costs in COGS
All Other Costs
SG&A / Ton
2009A
2010A
2011A
2012A
2013F
($88)
$36
$164
$28
$38
$152
$90
$40
$83
$86
2009A
2010A
2011A
2012A
2013F
Inflation (deflation)
Mill productivity
Cumulative 2009A – 2013F
Mill Productivity
$451
Inflation / (Deflation)
178
Cumulative Net Mill Productivity
$273
Annual Mill Productivity Approximately $60m
Verso R-Gap Initiatives should yield an Incremental $30m in
Savings per Annum for the Combined Company |
 24
Experienced Management Team
Years in
Industry
Relevant Experience
David J. Paterson
President and CEO
36
President and Chief Executive Officer and a director of Verso since May 2012
Served as President and Chief Executive Officer of AbitibiBowater Inc. from 2007 to 2011
Served as Chairman, President and Chief Executive Officer of Bowater Incorporated
during
2007
and
President
and
Chief
Executive
Officer
of
Bowater
Incorporated
from
2006
to 2007
Robert P. Mundy
Senior Vice President
and CFO
30
Senior Vice President and Chief Financial Officer since August 2006
Previously worked at International Paper Company from 1983 to 2006, where he was
Director of Finance of the Coated and Supercalendered Papers Division from 2002 to
2006,
Director
of
Finance
Projects
from
2001
to
2002,
Controller
of
Masonite
Corporation
from 1999 to 2001, and Controller of the Petroleum and Minerals business from 1996 to
1999
George F. Martin
President and CEO
30
President and Chief Executive Officer since August 2010
Held senior leadership positions with NewPage, MeadWestvaco Papers Group and
Westvaco
Jay A. Epstein
Senior Vice President
and CFO
15
Senior Vice President and Chief Financial Officer since July 2011
Served as Vice President finance, treasurer and secretary of Brant Industries and SP
Newsprint Company and was Chief Financial Officer for SP Recycling Company
Served as Vice President finance of White Birch Paper Company |
 25
Key Credit Highlights
Scale will improve cost-savings and provide customer service advantages
Strong relationships with existing customer base will be reinforced through the
combination The Combined Company Would Become the Cost Leader in the North
American Coated Paper Industry Despite an already low cost structure
relative to peers, the Combined Company will improve its cost position
through synergy realization
Operates many of the lowest cost mills in both CFS and CGW
Modest
capital
requirements
and
favorable
tax
position
provide
Combined
Company
with
consistent
cash
flow
The Merger will reduce the cost structure and generate consistent top quartile FCF
metrics Experienced Management Team
Strong management team with extensive paper industry experience across its top
managers #1 Coated Paper Manufacturer in North America and #4 Globally after Combination with
Verso The Combined Company Generates Strong Free Cash Flow
for Debt Repayment |
 26
5.
Financial Information |
 Shared Services Agreement Summary
Synergy sharing overview
27
As a result of the more favorable cash flow profile at NewPage, a shared services
agreement has been put in place that allocates the synergies to the Verso
parent The
intent
is
that
as
a
result
of
the
shared
services
agreement,
NewPage
financials
will
remain
un-changed
from
what they would be at NewPage standalone
Verso will receive 100% of realized synergies and related cost savings (estimated
at $175m) Verso will bear 1/3 of the restructuring costs and NewPage will
bear 2/3 Verso will invoice NewPage for the synergy savings monthly, and
receive payment quarterly; amount of invoice will be expensed in NewPage
P&L, as it would be had it actually incurred the associated expense
Steering committee has at least one executive officer from each Company. Each party
to be represented equally Verso will provide corporate and
other shared services to
NewPage with any associated
cost savings accruing to Verso
NewPage will continue to pay
the "Standalone Cost" of shared
services as though it were a
standalone entity
The parties can agree to modify
terms and conditions upon good
faith negotiation
Shared Services
Purchasing
Any purchasing savings
resulting from bulk buying by the
Combined Company will accrue
to Verso
NewPage will be billed as if
purchasing for standalone
NewPage, and not a combined
entity
Capacity Protections
NewPage is protected against
diminutions in the value of
NewPage assets and the
negative operating impacts
resulting therefrom
As a Result of this Agreement, NewPage Does Not Get the Benefit of Synergies
|
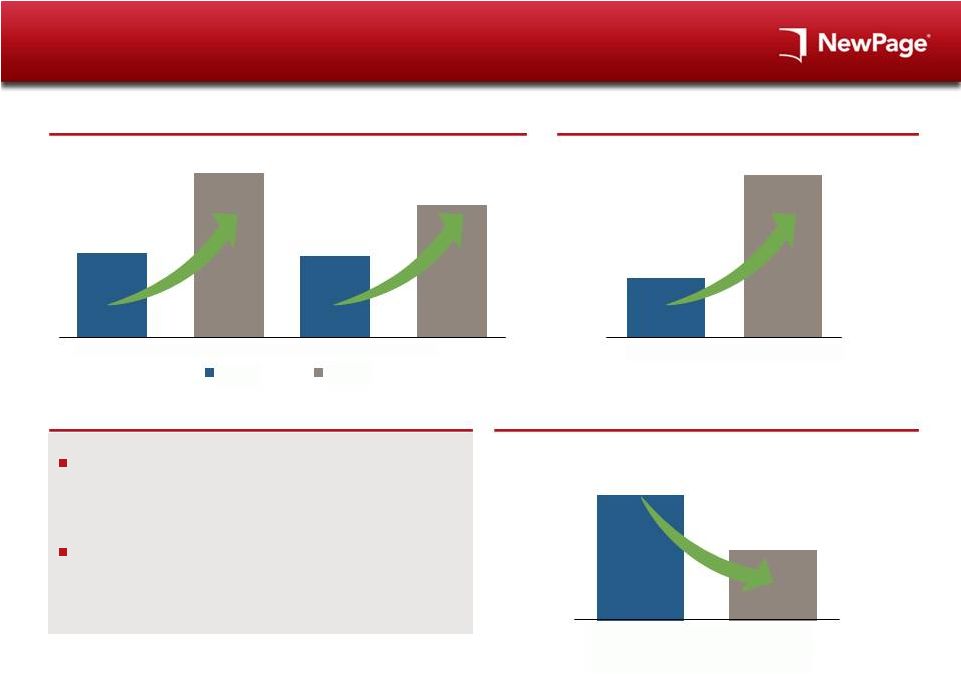 NewPage Earnings Momentum and Deleveraging
Despite Challenging Industry Dynamics
28
2013 Y-o-Y Quarterly Adj. EBITDA Performance
2013 Y-o-Y Annual Adj. EBITDA Performance
Commentary
Improved Leverage Since 2012 Bankruptcy Refinancing
NewPage cost saving initiatives have positioned the
Company for earnings growth with the evidence
proving out in 2013
In 2013, NewPage improved annual Adj. EBITDA by
13% and decreased leverage by .4x in a challenging
market backdrop
($ in millions)
($ in millions)
+47%
+30%
+13%
(.4x)
$58
$57
$85
$74
Q3
Q4E
2012
2013
$238
$270
2012
2013E
1.9x
1.5x
Post Bankruptcy
Emergence
(2012)
2013E |
 29
NewPage Historical Financial Performance
($ in millions)
(1)
Pro-forma revenues of $3,169m equals Form 10 reported revenues of $3,502m but
adjusted for the elimination of $304m for Port Hawkesbury and $28m for Whiting.
(2)
Does not include $54m for Paper Machine 35 at Steven's Point.
(2)
(2)
(1)
$3,724
$2,614
$3,062
$3,169
$3,131
$3,065
$3,071
2008
2009
2010
2011
2012
LTM
9/30/13
2013E
$148
$64
$53
$75
$103
$85
$77
2008
2009
2010
2011
9/30/13
2013E
$498
$151
$289
$324
$238
$253
$270
13.4%
5.8%
9.4%
10.2%
7.6%
8.2%
8.8%
2008
2009
2010
2011
2012
LTM
9/30/13
2013E
Adjusted EBITDA
Adjusted EBITDA margin
$350
$87
$236
$249
$135
$168
$193
2008
2009
2010
2011
2012
LTM
9/30/13
2013E
LTM
2012
Revenue
Adjusted EBITDA
Capex
Adjusted EBITDA –
Capex |
 Significant NewPage Free Cash Flow Potential
Illustrative
30
2013E Current
Last "Peak" EBITDA
NewPage Adjusted EBITDA
$270
$324
2013E Capex
(77)
(77)
Pro Forma Cash Interest
(66)
(66)
Cash Taxes
–
–
Free Cash Flow
$127
$181
Pension Funding
(1)
($47)
($47)
FCF After Pension
$81
$135
FCF as a % of Net Debt
11%
18%
Excludes WC changes
(1)
Average for the next 5 years.
($ in millions)
NewPage Generates Significant Free Cash Flow After Capex, Interest, Taxes and
Pension EBITDA peak after the “Great
Recession”
of 2008/2009 |
 NewPage Borrowing Estimated Borrowing Base
Availability Forecast
31
The following chart details the borrowing base availability as of November 30,
2013: Notes:
(1)
The
NewPage
borrowing
base
will
include
foreign
accounts
that
meet
an
eligibility
criteria
to
be
agreed
and
will
be
capped
at
an
amount
to
be
agreed.
The
pro-forma
November
30,
2013
borrowing
base
has
been
updated
to
reflect
an
estimated
$7
million
of
eligible
foreign
accounts.
(2)
The
definitive
documentation
will
include
eligible
stores
inventory
up
to
an
amount
to
be
agreed
and
will
also
allow
for
eligible
raw
materials
that
are
comprised
of
chemicals.
Both
of
the
aforementioned
inventory
types
are
considered
ineligible
in
the
existing
NewPage
ABL
and
there
will
be
no
availability
from
these
inventory
types
in
the
new
$350
million
NewPage
ABL
until
a
satisfactory
appraisal
and
field
exam
are
conducted.
(3)
Per
the
Hilco
inventory
appraisal
dated
as
of
November
22,
2013
The borrowing base is equal to
the sum of:
85% of the book value of
eligible accounts receivable,
plus
The lesser of (i) 80% of net
book value and (ii) 85% of the
net orderly liquidation value of
eligible inventory, minus
Customary reserves
Accounts Receivable
Total
Gross Accounts Receivable
$217.5
Less Ineligibles:
27.3
Accrued Rebates
17.8
Customer Adjustments
0.9
Past Due A/R (>60 DPD) or (>90 DOI)
1.5
Discounts
1.2
Contras
1.4
Disputed Balances or Customer Chargebacks
2.2
Credit Reclass
0.4
Affiliate / Officer / Director / Employee Receivables
0.1
Other
(1)
1.8
Total Ineligible
$27.3
Eligible Accounts Receivable
$190.2
Advance Rate
85.0%
Accounts Receivable Availability
$161.7
Inventory
Raw Materials
Semi-Finished
Goods
Finished
Goods
Total
Gross Inventory
$88.3
$55.7
$239.8
$383.8
Less Ineligibles
(2)
:
41.2
2.9
13.1
57.2
Eligible Inventory
$47.1
$52.8
$226.8
$326.6
NOLV
(3)
67.8%
57.9%
81.0%
75.4%
Advance Rate
85.0%
85.0%
85.0%
85.0%
$27.1
$26.0
$156.1
$209.2
80% of Cost
$37.7
$42.2
$181.4
$261.3
Lesser of (i) 80% of Cost or (ii) 85% of NOLV
$27.1
$26.0
$156.1
$209.2
Total Borrowing Base Availability
$370.9
Reserves (including rent reserves)
(1.6)
Total Net Borrowing Base Availability
$369.3
Suppressed Availability
$19.3
Lesser of Borrowing Base and Facility Size ($350 million)
$350.0
Loan Balance at Closing
0.0
Letters of Credit Outstanding at Closing
(33.1)
Excess Availability
$316.9
Inventory Availability |
  32
NewPage Pension and OPEB
The pension and OPEB balance sheet liability calculation is prescribed by GAAP and
is calculated using a discount rate of 5.1% and 4.3%, respectively
2014E
2015E
2016E
2017E
2018E
Pension Beginning Balance
$210.9
$154.5
$97.2
$41.5
$4.4
Pension Expense/(Credit)
(1.7)
(9.5)
(7.7)
(6.2)
(5.0)
Pension Funding
(54.7)
(47.8)
(48.0)
(30.9)
(6.5)
Pension Closing Balance
$154.5
$97.2
$41.5
$4.4
($7.1)
OPEB Beginning Balance
$60.0
$50.5
$42.5
$35.2
$28.3
OPEB Expense/(Credit)
2.8
2.2
1.7
1.2
1.0
OPEB Funding
(12.3)
(10.2)
(9.0)
(8.1)
(6.5)
OPEB Closing Balance
$50.5
$42.5
$35.2
$28.3
$22.8
Total Cash Expense
($65.9)
($65.3)
($63.0)
($44.0)
($17.0)
Pension/OPEB Beginning Balance
$270.9
$205.0
$139.7
$76.7
$32.7
Pension/OPEB Expense/(Credit)
1.1
(7.3)
(6.0)
(5.0)
(4.0)
Pension/OPEB Funding
($67.0)
($58.0)
($57.0)
($39.0)
($13.0)
Pension/OPEB Closing Balance
$205.0
$139.7
$76.7
$32.7
$15.7
The
actual
required
amounts
and
timing
of
all
such
future
cash
contributions
will
be
highly
sensitive
to
changes
in
the
applicable
discount
rates
and
returns
on
pension
plan
assets,
and
could
also
be
impacted
by
future
changes
in
the
laws
and
regulations applicable to
pension plan funding
While not reflected in the current projections, there may be changes to funding
levels associated with the Pension Protection Act or “PPA”, which
represents the funding stabilization provisions under the Moving Ahead for Progress in the 21st Century Act signed into law by the
President on July 6, 2012
2014 beginning pension and OPEB balance updated for actuarial assessment of year
end 2013. 2014 through 2018 expense and funding projections estimated based
on plan status at Q3, 2013. ($ in millions) |
 33
6.
Syndication Overview |
 First
Lien Term Loan Indicative Terms 34
Borrower:
NewPage Corporation (the “Borrower”)
Joint Lead Arrangers, Joint
Bookrunners:
CS, Barclays, UBS, BMO
Admin Agent:
CS
Facilities Offered:
$750 million Senior Secured Term Loan Facility
Incremental:
Not to exceed the sum of $140 million and additional amounts subject to certain
leverage ratios; incremental facilities shall provide for 50 bps of MFN for
the first year post closing Initial LIBOR Margin:
L+750-775bps
LIBOR Floor:
1.25%
Issue Price:
99
Term Loan Amortization:
5% after 18 month holiday
Maturity:
7 years
Use of Proceeds:
Proceeds from the new NewPage financing will be used to repay the existing $495
million NewPage Term Loan, fund a special cash payment of approximately
$250 million to NewPage’s existing equityholders, pay fees and expenses in connection with the Facilities and apply to
corporate purposes
Guarantees:
Guaranteed by (i) NewPage Investment Company LLC and (ii) all wholly-owned
domestic subsidiaries of the Borrower (other than (a) domestic
subsidiaries
that
are
subsidiaries
of
foreign
subsidiaries,
(b)
Unrestricted
Subsidiaries
and
(c)
any
bankruptcy
remote
special
purpose receivables entities designated by the Borrower (collectively, the
“NewPage Subsidiary Guarantors”) Security:
Secured
by
first
priority
security
interest
in
substantially
all
of
the
assets
of
the Borrower and each Guarantor and a second priority security
interest in the ABL-Priority Collateral
Optional Prepayments:
Soft call 103 / 102 / 101 / par, also callable at par within 30 calendar days of
any termination of the Merger Agreement Mandatory Prepayments:
100% of cash proceeds from asset sales not reinvested within 12 months
50% ECF sweep (stepping down to 25% if Net First Lien Leverage Ratio less than or
equal to 2.25:1:00 and to 0% if 1.50:1.00) 100% of cash proceeds from debt
financings not otherwise permitted under the facility Affirmative
Covenants: Customary for facilities of this type
Negative Covenants:
Customary for facilities of this type, including limitations on indebtedness,
liens, sale and lease-back transactions, investments, loans and
advances, Mergers, consolidations, sales of assets and acquisitions, restricted
payments, etc.; RP capacity:
1)
Cash / Asset transfers to Verso: $50m per annum, and addtl. amounts subject to
2.50x Net First Lien Leverage; plus, 2)
General
RPs:
customary
“Cumulative
Credit”
amount
subject
to
1.50x
Net
First
Lien
Leverage
Financial Covenants:
Net total leverage ratio of 4.15:1.00 |
 ABL
Revolver Indicative Terms 35
Borrower:
NewPage Corporation (the “Borrower”)
Joint Lead Arrangers, Joint
Bookrunners:
Barclays, CS, UBS, BMO
Admin Agent:
Barclays
Facilities Offered:
$350 million senior secured asset-based revolving credit facility ($200
million through letter of credit subfacility, $30 million swingline facility)
Incremental Facilities:
Up to the greater of (i) $200 million and (ii) the excess of the borrowing
base over the then effective commitments under the facility; incremental
facilities shall provide for 50 bps of MFN for the first year post closing
Borrowing Base:
(a) 85% Eligible Accounts, plus
(b) the lesser of (i) 80% of the net book value of Eligible Inventory and (ii) 85%
of the net orderly liquidation value of Eligible Inventory, minus (c)
reserves against the Borrowing Base as established by the Agent LIBOR
Margin: L + 200 bps for the first three full months post closing, thereafter
subject to an availability based grid ranging from L + 175-225 bps
Commitment Fees:
50 bps for the first three full months post closing, thereafter subject to a
utilization based grid ranging from 37.5-50 bps Maturity:
5 years
Security:
(i) First priority security interests in all accounts receivable, loans
receivable, other receivables, inventory, related books and records and
general intangibles, deposit accounts, cash and proceeds of the Borrower and
Guarantor (“ABL-Priority Collateral”) (ii) Second priority
secured interests in the Non-ABL Priority Collateral underlying the term loan
Financial Covenant:
Should excess availability fall below the greater of (a) 10% of the lesser of (i)
the total Facility Commitments and (ii) the Borrowing Base and (b) $20
million at any time (“Covenant triggering event”), FCCR of 1.0x tested on a trailing four-quarter basis
Field Exams and Appraisals:
One per annum springing to two per annum if Excess Availability falls below the
greater of (a) 12.5% of the lesser of (i) the total Facility
Commitments and (ii) the Borrowing Base and (b) $35 million for five consecutive
business days (an “Excess Availability Triggering Event’) and
more frequently during an event of default
Reporting:
Monthly borrowing base reporting springing to weekly during (i) an Excess
Availability Triggering Event or (ii) an event of default Cash Dominion:
Springing cash dominion during (i) an Excess Availability Triggering Event or (ii)
during an event of default Affirmative Covenants:
Customary for facilities of this type
Negative Covenants:
Customary for facilities of this type, including limitations on indebtedness,
liens, sale and lease-back transactions, investments, loans and
advances, Mergers, consolidations, sales of assets and acquisitions, restricted
payments, etc.; Restricted
Payments
to
Verso:
$40m
per
annum
plus
any
additional
amounts
subject
to
satisfaction
of
the
payment
conditions
Guarantees:
Guaranteed by (i) NewPage Investment Company LLC and (ii) all wholly-owned
domestic subsidiaries of the Borrower (other than (a) domestic subsidiaries
that are subsidiaries of foreign subsidiaries, (b) Unrestricted Subsidiaries and (c) any bankruptcy remote
special purpose receivables entities designated by the Borrower (collectively, the
“NewPage Subsidiary Guarantors”) |
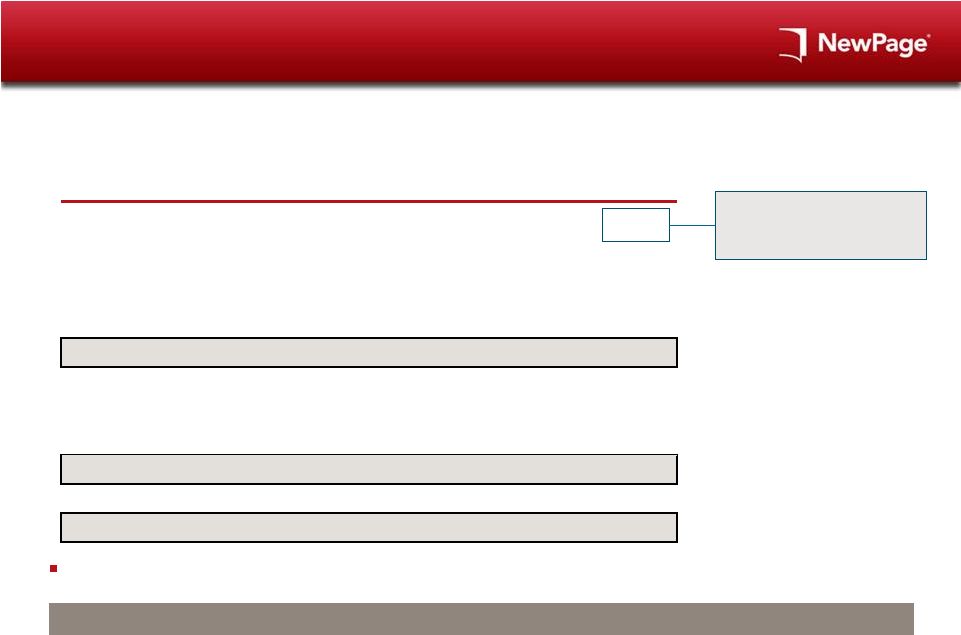
 Key
Financing Dates 36
January 2014
February 2014
Su
Mo
Tu
We
Th
Fr
Sa
Su
Mo
Tu
We
Th
Fr
Sa
1
2
3
4
1
5
6
7
8
9
10
11
2
3
4
5
6
7
8
12
13
14
15
16
17
18
9
10
11
12
13
14
15
19
20
21
22
23
24
25
16
17
18
19
20
21
22
26
27
28
29
30
31
23
24
25
26
27
28
Holiday
Key dates
Key Dates:
Event:
January
15
Bank Meeting in New York
January
29
Commitments due
Week
of
February
3
Close and Fund (will close and fund before Merger close)
2H 2014
Anticipated
Merger
close
(2H
of
2014
due
to
timing
of
regulatory
approval)
th
th
rd |
 Public Q&A
37 |
 38
Appendix |
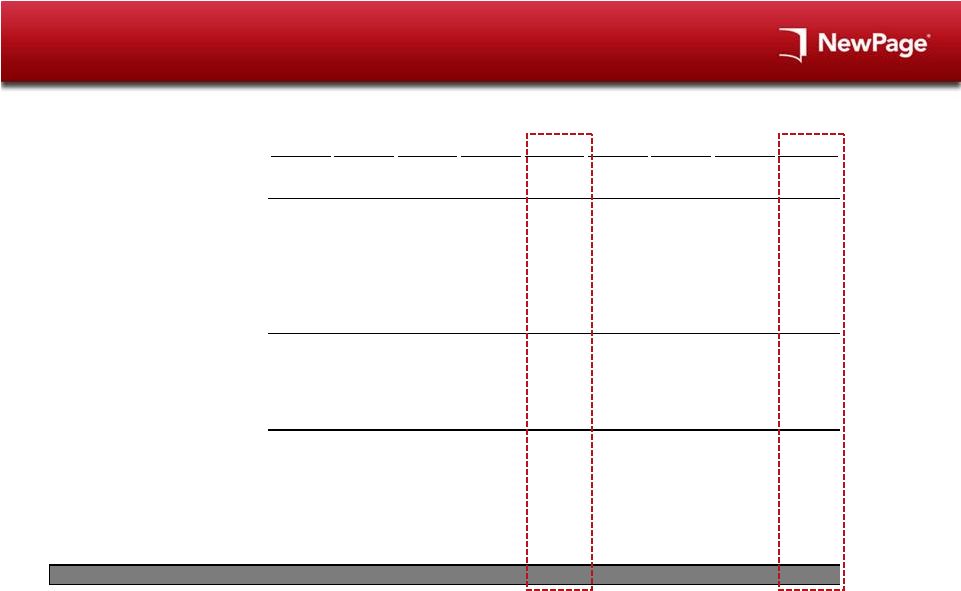
 Complete Merger Sources & Uses
Includes Proposed Verso Exchange Offer
39
($ in millions)
Sources
Uses
New NWP $350m ABL
–
Refi Existing NWP 1L Term Loan
$495
New NWP 1L Term Loan
750
Equity Purchase Price
900
New VRS Seller Notes
650
Term Loan Prepayment Penalty
10
Cash from NWP Balance Sheet
70
Illustrative Fees & Expenses
(1)
65
Total Cash Sources
$1,470
Total Cash Uses
$1,470
New VRS 2nd Pr. Exchange Notes
$186
Retire VRS 2nd Pr. Sr. Sec. Notes
$396
Discount on New VRS 2nd Pr. Notes
210
Retire VRS Sr. Sub. Notes
143
Total existing 2nd Priority Notes
$396
New VRS Sub. Exchange Notes
$81
Discount on New VRS Sub. Notes
61
Total existing Subordinated Notes
$143
Total Sources
$2,008
Total Uses
$2,008
(2)
(3)
The NewPage financing is “portable”
and will be in place prior to the close of the Merger
The VRS Seller Notes will be issued at Merger close, after the Merger Agreement
conditions, including the Verso Exchange
Offer,
regulatory
approvals
and
other
customary
closing
conditions
have
been
met
An important condition of the Merger consummation is the successful reduction of
VRS Junior Debt levels by an amount that has not yet been disclosed
Note:
Assumes 100% participation in Exchange Offers at the Exchange Prices by the Early
Tender Time. (1)
Includes financing and M&A fees; subject to change.
(2)
Based
on
exchange
ratio
of
$470
in
principal
amount
of
New
2
nd
Pr.
Exchange
Notes
for
$1,000
in
principal
amount
of
Existing
2
nd
Pr.
Notes.
(3)
Based on exchange ratio of $570 in principal amount of New Sub. Exchange Notes for
$1,000 in principal amount of Existing Sub. Notes. |
 Pro
Forma Combined Capitalization 40
Note:
Assumes 100% participation in Exchange Offers at the Exchange Prices by the Early
Tender Time. (1)
Pro forma for the effects of cost savings program.
(2)
Assumes 100% participation by early tender date.
(3)
TTM ending 9/30/13.
Assuming 100%
participation at
indicative
exchange prices,
Verso
is
to
reduce
its Junior Debt
levels by ~$271
($ in millions)
Verso Standalone
NewPage Standalone
Pro Forma Combined
Net mult.
Net mult.
Pro forma
Net mult.
9/30/13
Adj. EBITDA
12/31/2013E
Adj. EBITDA
adj.
Pro forma
Adj. EBITDA 9/30/13
Cash & Cash Equivalents
$9
$83
($70)
$22
NewPage
Existing $350m ABL
–
–
–
–
New $350m ABL
–
–
–
–
Existing 1L Term Loan
–
495
(495)
–
New 1L Term Loan
–
–
750
750
Total NewPage debt
–
–
$495
1.6x
$255
$750
1.2x
Verso
$150m ABL
$23
–
–
$23
$50m CF Revolver
–
–
–
–
1L Senior Secured Notes
418
–
650
1,068
Total 1L debt
$440
2.8x
–
–
$905
$1,840
3.1x
1.5L Secured Notes
272
–
–
272
Total 1L, 1.5L debt
$712
4.5x
–
–
$905
$2,112
3.6x
2nd Priority Senior Secured Notes (floating)
13
–
–
13
2nd Priority Senior Secured Notes (fixed)
396
–
(396)
–
New VRS 2nd Pr. Exchange Notes
–
–
186
186
Total secured debt
$1,121
7.2x
–
–
$695
$2,311
3.9x
Senior Subordinated Notes
143
–
(143)
–
New VRS Sub. Exchange Notes
–
–
81
81
Total debt
$1,264
8.1x
–
–
$634
$2,393
4.1x
Verso Adj. EBITDA
(1)
$155
$155
NewPage Adj. EBITDA
(3)
$253
253
Synergies
175
Pro forma combined Adj. EBITDA
$583
(2)
LTM 9/30/13 |
 41
NewPage
Net
Income
to
Adjusted
EBITDA
Walk
Q1 2012
Q2 2012
Q3 2012
Q4 2012
FY 2012
Q1 2013
Q2 2013
Q3 2013
LTM 9/30
Revenue
$760
$759
$803
$809
$3,131
$756
$720
$780
$3,065
Less: Cost of Sales
(723)
(728)
(778)
(786)
(3,015)
(715)
(686)
(715)
(2,902)
Gross Profit
$37
$31
$25
$23
$116
$41
$34
$65
$163
Less: SG&A
($33)
($37)
($35)
($34)
($139)
($41)
($34)
($34)
($143)
Less: Reorganization Items
(33)
(15)
(26)
1,362
1,288
--
--
--
1,362
Less: Other (Expense) / Income
--
--
--
--
--
--
--
1
1
Less: Interest
(112)
105
(10)
(9)
(26)
(11)
(13)
(11)
(44)
Less: Taxes
18
--
(1)
2
19
--
--
--
2
Net Income
($123)
$84
($47)
$1,344
$1,258
($11)
($13)
$21
$1,341
Plus: Interest
112
(105)
10
9
26
11
13
11
44
Plus: Taxes
(18)
--
1
(2)
(19)
--
--
--
(2)
Plus: Depreciation & Amortization
60
59
61
62
242
46
45
46
199
EBITDA
$31
$38
$25
$1,413
$1,507
$46
$45
$78
$1,582
Plus: Restructuring Items
33
15
26
(1,362)
(1,288)
--
--
--
(1,362)
Plus: Equity Award
--
--
--
1
1
4
4
4
13
Plus: Non-Cash Pension Expense
--
--
5
1
6
--
--
--
1
Plus: Gain/Loss
1
1
2
2
6
--
1
--
3
Plus: Other Addbacks
1
3
--
2
6
11
--
3
16
Adjusted EBITDA
$66
$57
$58
$57
$238
$61
$50
$85
$253
($ in millions)
Note:
Totals may not foot due to rounding. |
 NewPage Standalone Structure Chart
42
As of October 31, 2013
NewPage
Corporation
Wickliffe Paper
Company LLC
NewPage
Investment
Company LLC
Rumford Paper
Company
Luke Paper
Company
Escanaba Paper
Company
Chillicothe
Paper Inc.
NewPage
Energy
Services LLC
Gulf Island Pond
Oxygenation
Project
Upland
Resources, Inc.
Entity Key
Delaware
Maine
Michigan
West Virginia
Note:
All entities are 100% owned
unless otherwise indicated
30.5%
Rumford Mill
Luke Mill
Escanaba Mill
NewPage
Consolidated
Papers Inc.
NewPage
Wisconsin
System Inc.
Consolidated
Water
Power Co.
Biron Mill
Duluth Mill
Stevens Point Mill
Wisconsin Rapids Mill
Wickliffe Mill
Wisconsin
Electric Utility
Rumford
GIPOP Inc.
NewPage
Holdings Inc. |
 43 |