Attached files
| file | filename |
|---|---|
| 8-K - 8-K - MRV COMMUNICATIONS INC | a14-3511_18k.htm |
| EX-99.1 - EX-99.1 - MRV COMMUNICATIONS INC | a14-3511_1ex99d1.htm |
Exhibit 99.2
|
|
MRV Communications 16th Annual Needham Growth Conference January 14, 2014 |
|
|
This presentation contains statements regarding future financial and operating results, management's assessment of business trends, and other statements about management's future expectations, beliefs, goals, plans or prospects and those of the market segments in which MRV is engaged that are based on management's current expectations, estimates, forecasts and projections about MRV and its consolidated businesses and the respective market segments in which MRV's businesses operate, in addition to management's assumptions. Statements regarding future financial and operating results, which are not statements of historical facts, constitute forward-looking statements within the meaning of the U.S. Private Securities Litigation Reform Act of 1995. These forward-looking statements are not guarantees of future performance nor guarantees that the events anticipated will occur or expected conditions will remain the same or improve. These statements involve certain risks, uncertainties and assumptions, the likelihood of which are difficult to assess and may not occur, including risks that each of its business segments may not make the expected progress in its respective market, or that management's long-term strategy may not achieve the expected results. Therefore, actual outcomes, performance and results may differ from what is expressed or forecast in such forward-looking statements, and such differences may vary materially from current expectations. For further information regarding risks and uncertainties associated with MRV's businesses, please refer to the "Management's Discussion and Analysis of Financial Condition and Results of Operations" and "Risk Factors" sections of MRV's SEC filings. MRV assumes no obligation to and expressly disclaims any obligation to update or revise any forward-looking statements contained in this document to reflect new information or future events or developments after the date any such statement is made. Safe Harbor Statement 2 |
|
|
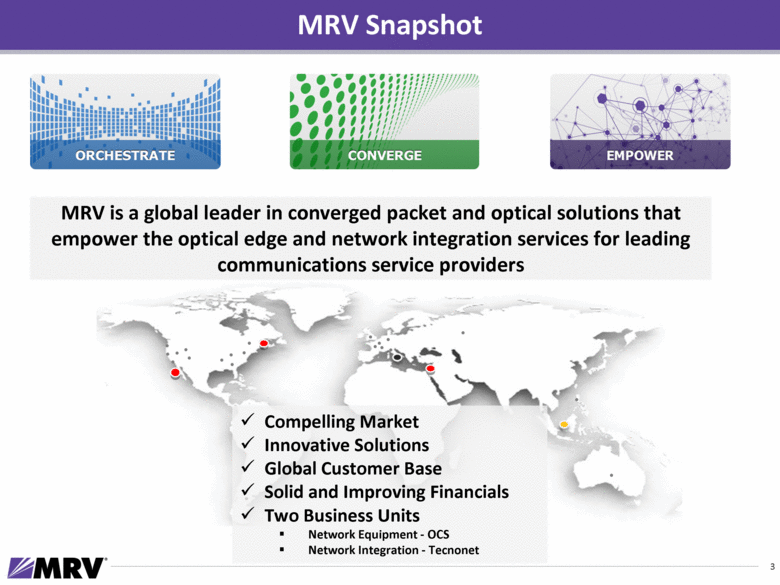
3 MRV Snapshot MRV is a global leader in converged packet and optical solutions that empower the optical edge and network integration services for leading communications service providers Compelling Market Innovative Solutions Global Customer Base Solid and Improving Financials Two Business Units Network Equipment - OCS Network Integration - Tecnonet |
|
|
Investment Highlights 4 New board and management has driven significant improvements to build and unlock shareholder value Focused the Business Strengthened management team Established new strategic focus Sold non-core businesses Resolved litigation and liabilities Returned $139M to shareholders Streamlined cost structure Invested in new products and systems Poised to Capitalize Profitability driven by increasing revenue and lower cost structure Strong balance sheet enabling prudent investments to build market position Large and strategic customer base New product launches deepen customer presence and expand addressable market Well positioned for the coming network transformation |
|
|
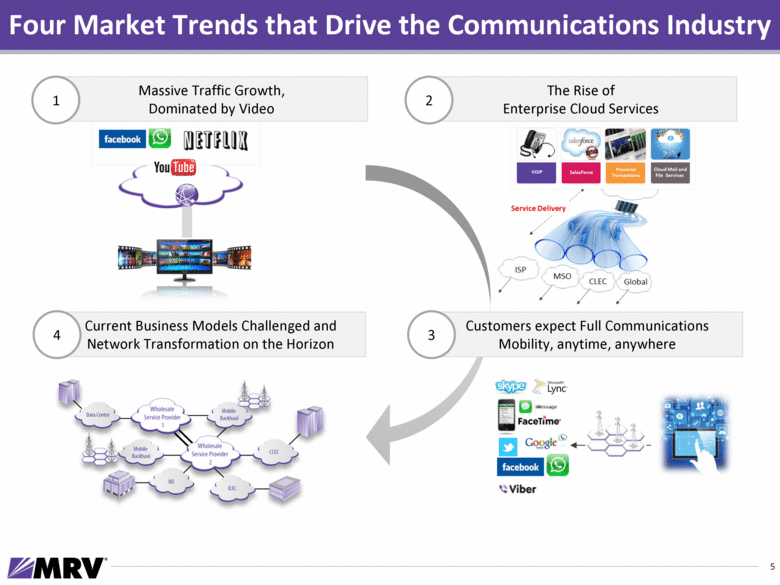
5 Four Market Trends that Drive the Communications Industry The Rise of Enterprise Cloud Services Massive Traffic Growth, Dominated by Video Current Business Models Challenged and Network Transformation on the Horizon Customers expect Full Communications Mobility, anytime, anywhere 1 2 4 3 |
|
|
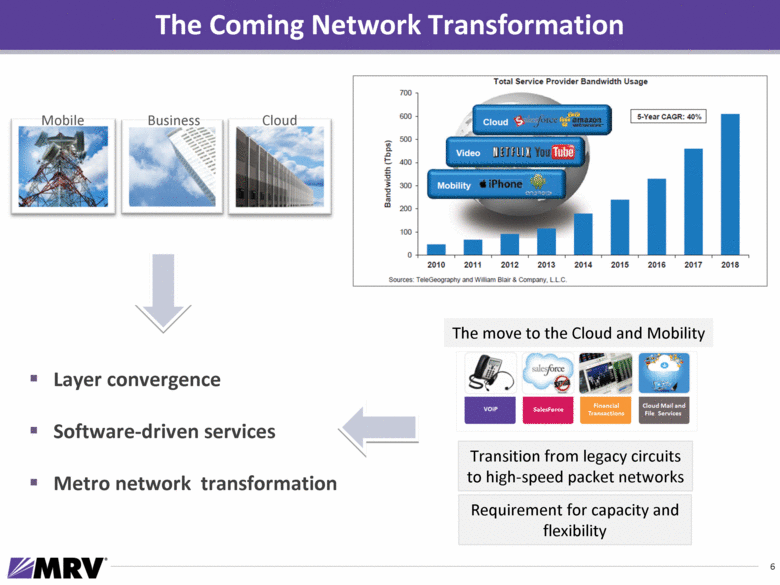
6 The Coming Network Transformation Mobile Business Cloud Layer convergence Software-driven services Metro network transformation The move to the Cloud and Mobility Transition from legacy circuits to high-speed packet networks Requirement for capacity and flexibility |
|
|
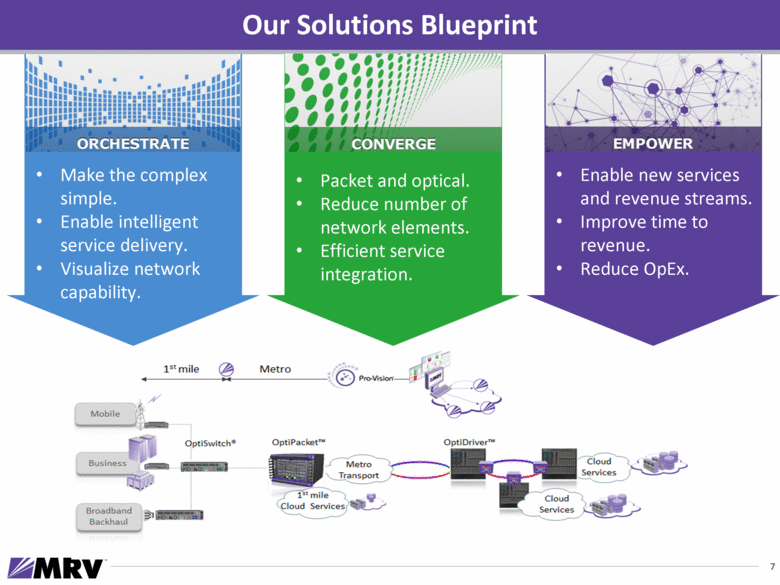
Make the complex simple. Enable intelligent service delivery. Visualize network capability. Packet and optical. Reduce number of network elements. Efficient service integration. Enable new services and revenue streams. Improve time to revenue. Reduce OpEx. Our Solutions Blueprint 7 |
|
|
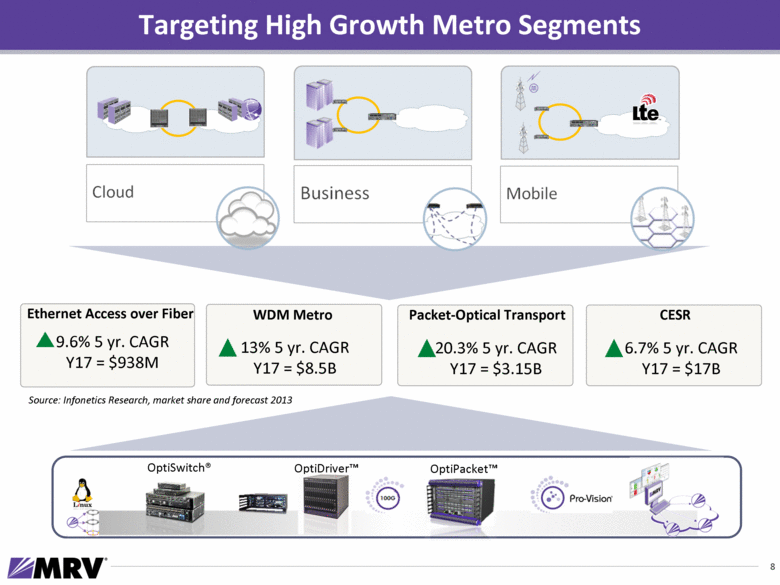
Targeting High Growth Metro Segments WDM Metro 13% 5 yr. CAGR Y17 = $8.5B 9.6% 5 yr. CAGR Y17 = $938M Ethernet Access over Fiber Packet-Optical Transport 20.3% 5 yr. CAGR Y17 = $3.15B CESR 6.7% 5 yr. CAGR Y17 = $17B OptiDriver™ OptiPacket™ OptiSwitch® 8 Source: Infonetics Research, market share and forecast 2013 |
|
|
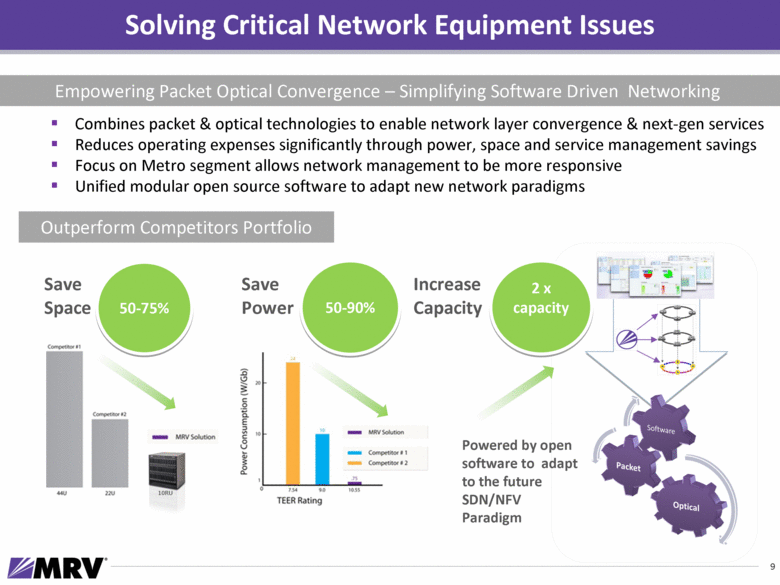
Combines packet & optical technologies to enable network layer convergence & next-gen services Reduces operating expenses significantly through power, space and service management savings Focus on Metro segment allows network management to be more responsive Unified modular open source software to adapt new network paradigms Empowering Packet Optical Convergence – Simplifying Software Driven Networking Solving Critical Network Equipment Issues 9 Outperform Competitors Portfolio 10RU 50-75% Save Space Save Power 50-90% 2 x capacity Powered by open software to adapt to the future SDN/NFV Paradigm Increase Capacity |
|
|
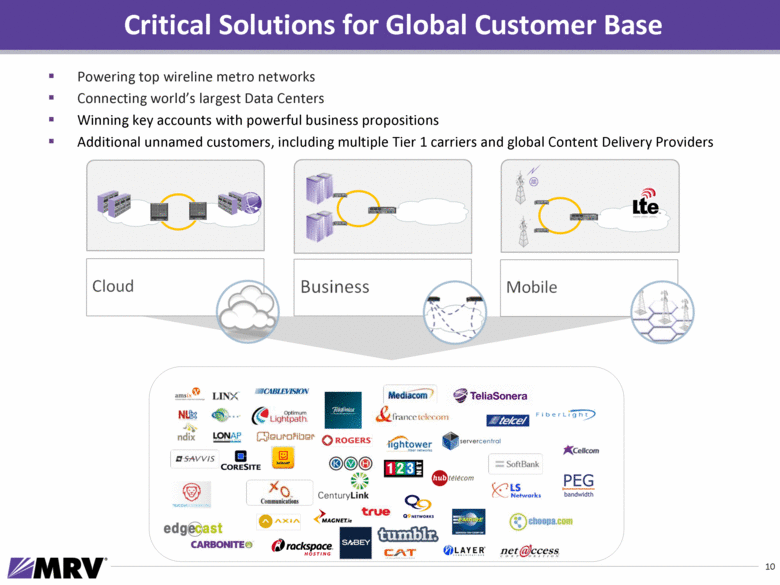
10 Critical Solutions for Global Customer Base Powering top wireline metro networks Connecting world’s largest Data Centers Winning key accounts with powerful business propositions Additional unnamed customers, including multiple Tier 1 carriers and global Content Delivery Providers |
|
|
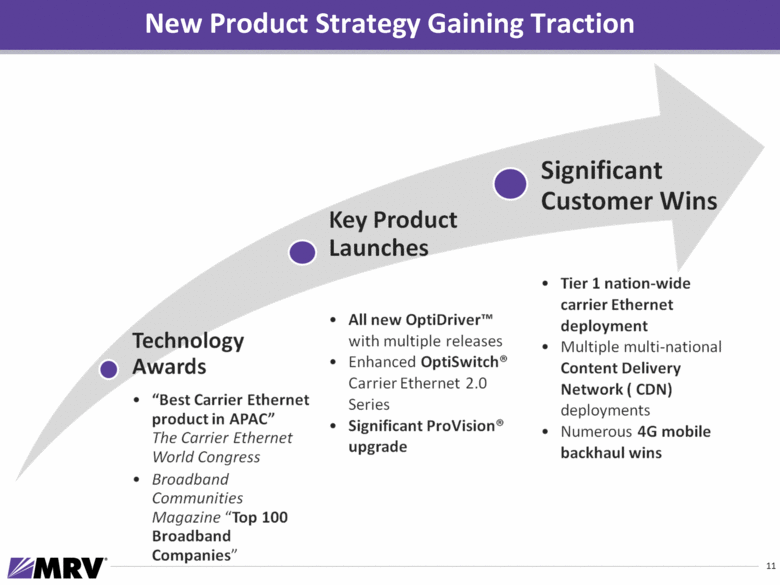
New Product Strategy Gaining Traction 11 |
|
|
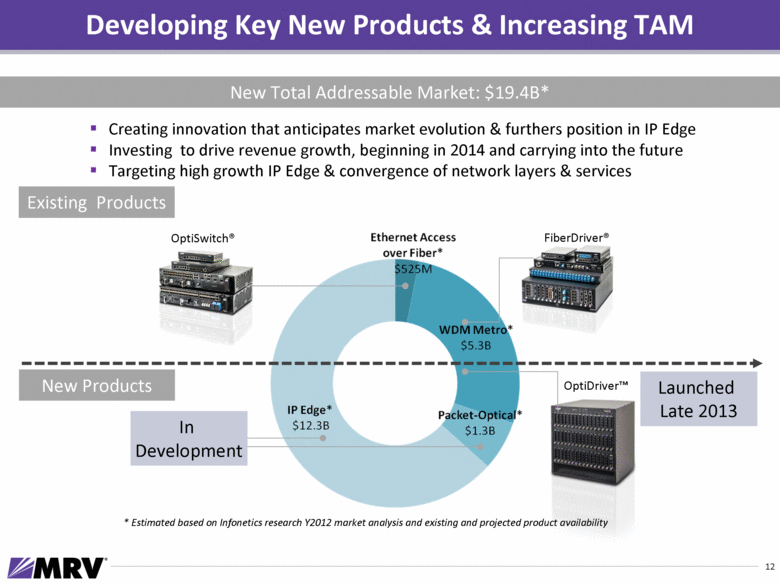
Developing Key New Products & Increasing TAM * Estimated based on Infonetics research Y2012 market analysis and existing and projected product availability OptiSwitch® FiberDriver® OptiDriver™ New Products Existing Products Creating innovation that anticipates market evolution & furthers position in IP Edge Investing to drive revenue growth, beginning in 2014 and carrying into the future Targeting high growth IP Edge & convergence of network layers & services 12 New Total Addressable Market: $19.4B* In Development Launched Late 2013 |
|
|
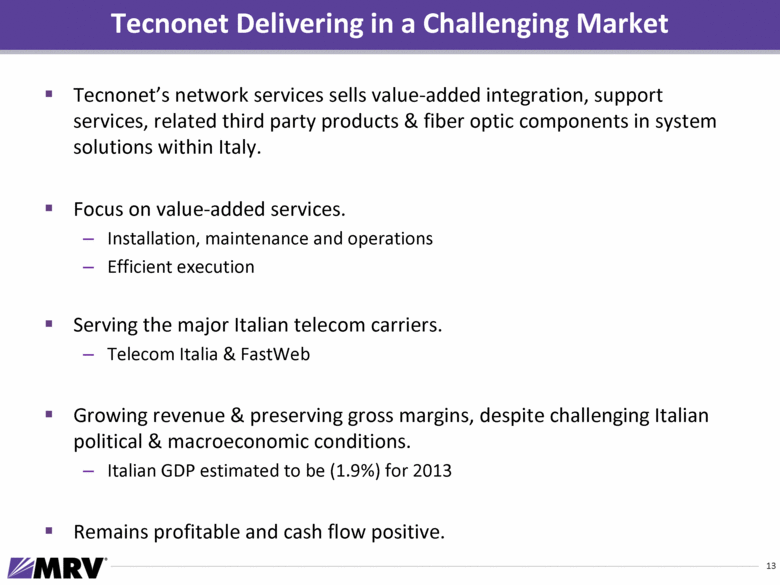
Tecnonet’s network services sells value-added integration, support services, related third party products & fiber optic components in system solutions within Italy. Focus on value-added services. Installation, maintenance and operations Efficient execution Serving the major Italian telecom carriers. Telecom Italia & FastWeb Growing revenue & preserving gross margins, despite challenging Italian political & macroeconomic conditions. Italian GDP estimated to be (1.9%) for 2013 Remains profitable and cash flow positive. Tecnonet Delivering in a Challenging Market 13 |
|
|
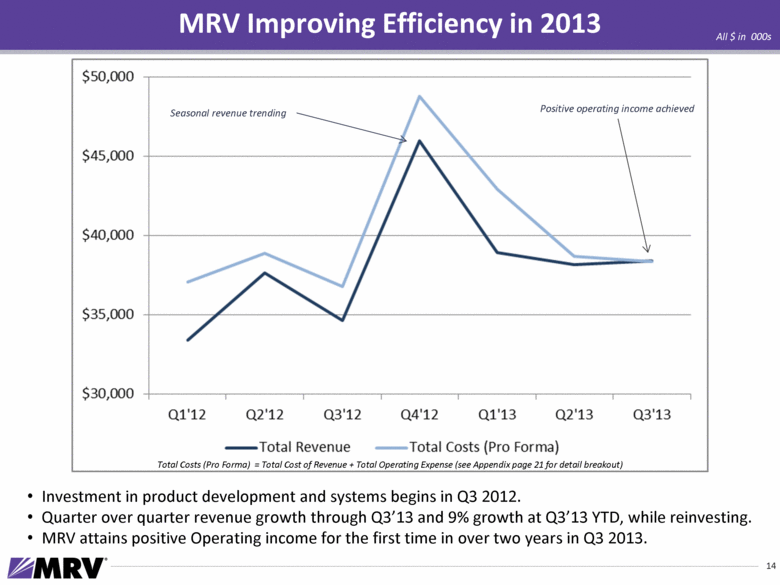
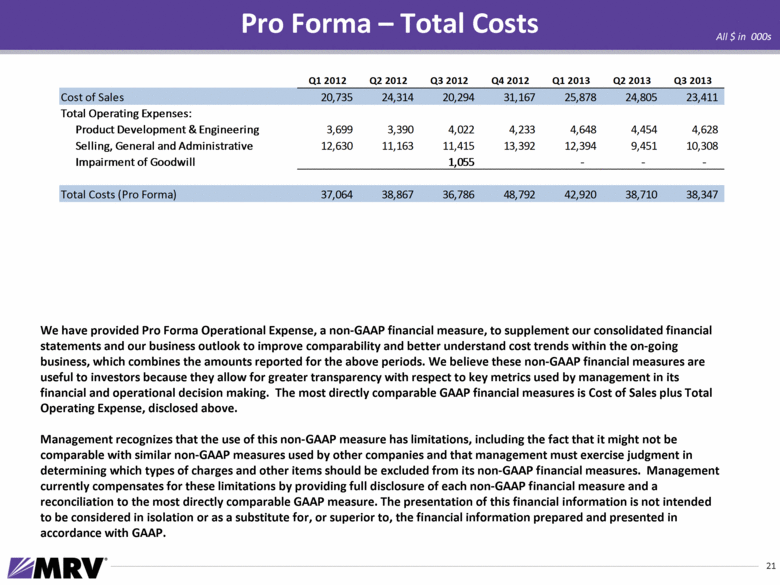
MRV Improving Efficiency in 2013 14 All $ in 000s Investment in product development and systems begins in Q3 2012. Quarter over quarter revenue growth through Q3’13 and 9% growth at Q3’13 YTD, while reinvesting. MRV attains positive Operating income for the first time in over two years in Q3 2013. Positive operating income achieved Seasonal revenue trending Total Costs (Pro Forma) = Total Cost of Revenue + Total Operating Expense (see Appendix page 21 for detail breakout) |
|
|
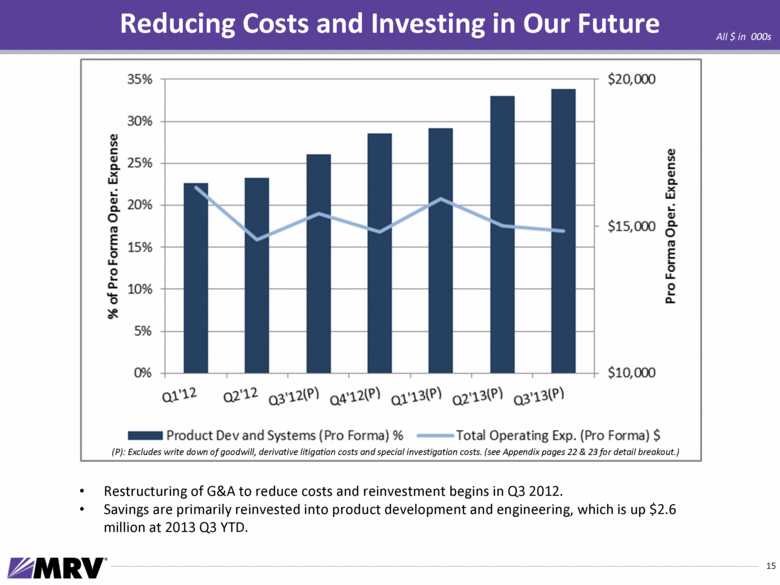
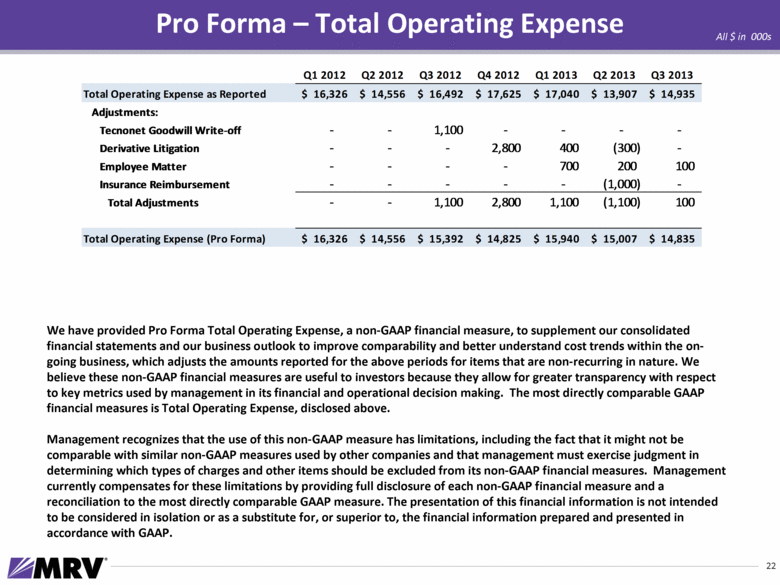
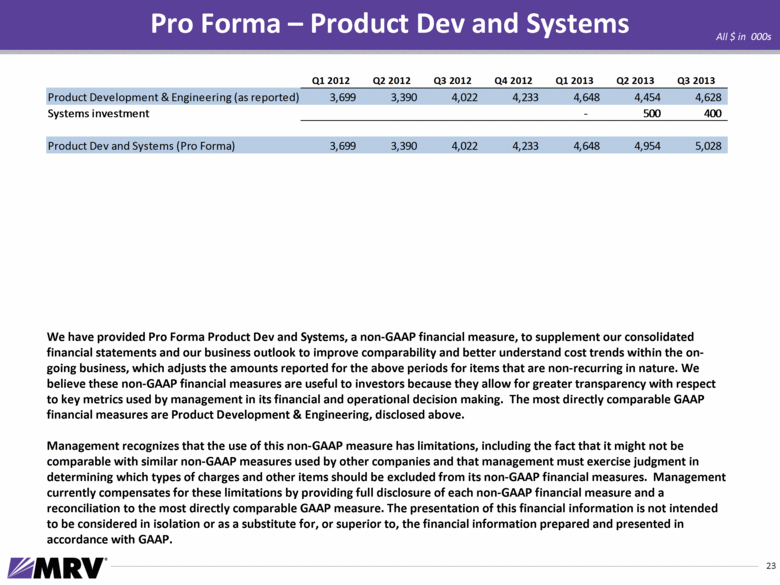
Reducing Costs and Investing in Our Future 15 Restructuring of G&A to reduce costs and reinvestment begins in Q3 2012. Savings are primarily reinvested into product development and engineering, which is up $2.6 million at 2013 Q3 YTD. All $ in 000s (P): Excludes write down of goodwill, derivative litigation costs and special investigation costs. (see Appendix pages 22 & 23 for detail breakout.) |
|
|
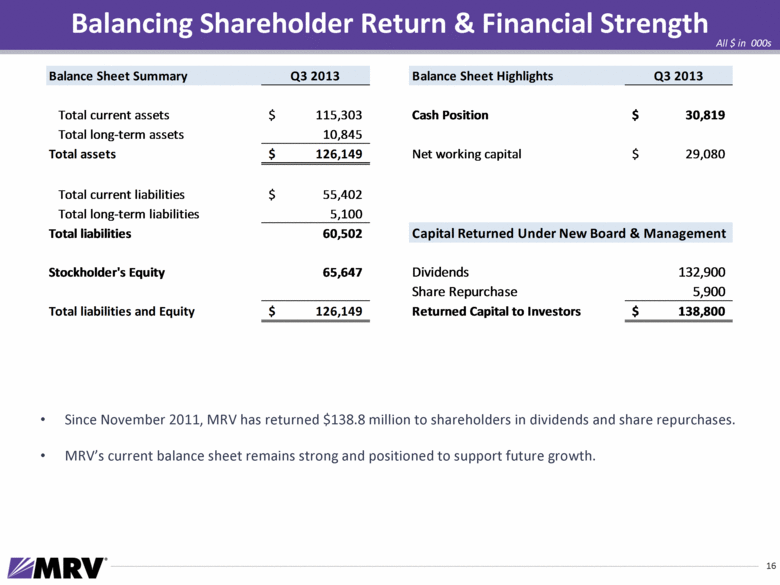
Balancing Shareholder Return & Financial Strength 16 All $ in 000s Since November 2011, MRV has returned $138.8 million to shareholders in dividends and share repurchases. MRV’s current balance sheet remains strong and positioned to support future growth. Balance Sheet Summary Q3 2013 Balance Sheet Highlights Q3 2013 Total current assets 115,303 $ Cash Position 30,819 $ Total long-term assets 10,845 Total assets 126,149 $ Net working capital 29,080 $ Total current liabilities 55,402 $ Total long-term liabilities 5,100 Total liabilities 60,502 Capital Returned Under New Board & Management Stockholder's Equity 65,647 Dividends 132,900 Share Repurchase 5,900 Total liabilities and Equity 126,149 $ Returned Capital to Investors 138,800 $ |
|
|
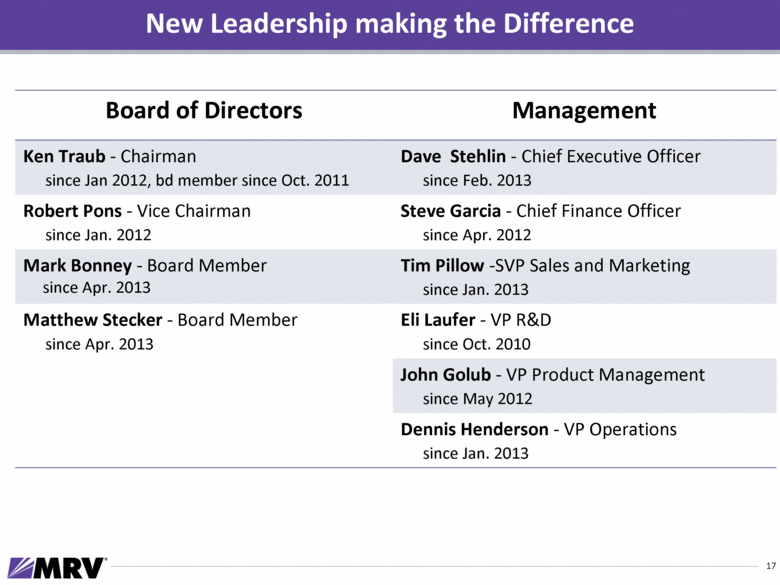
New Leadership making the Difference 17 Board of Directors Management Ken Traub - Chairman since Jan 2012, bd member since Oct. 2011 Dave Stehlin - Chief Executive Officer since Feb. 2013 Robert Pons - Vice Chairman since Jan. 2012 Steve Garcia - Chief Finance Officer since Apr. 2012 Mark Bonney - Board Member since Apr. 2013 Tim Pillow -SVP Sales and Marketing since Jan. 2013 Matthew Stecker - Board Member since Apr. 2013 Eli Laufer - VP R&D since Oct. 2010 John Golub - VP Product Management since May 2012 Dennis Henderson - VP Operations since Jan. 2013 |
|
|
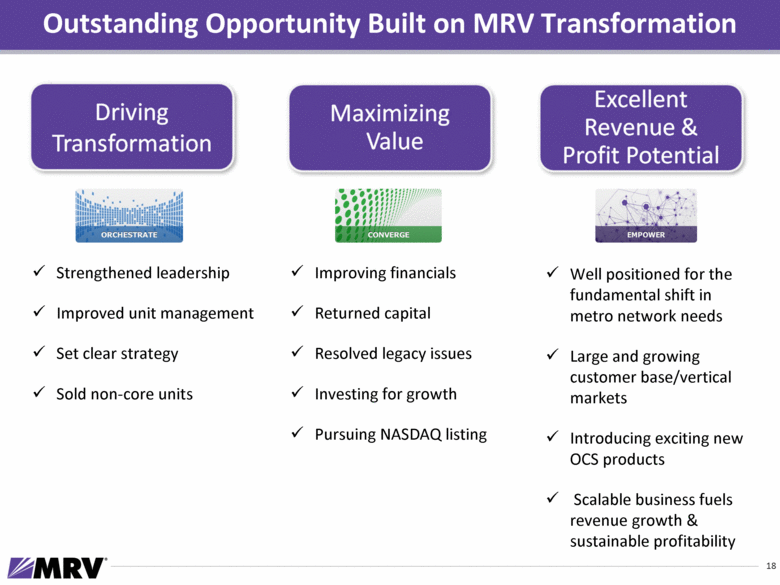
Outstanding Opportunity Built on MRV Transformation 18 Improving financials Returned capital Resolved legacy issues Investing for growth Pursuing NASDAQ listing Well positioned for the fundamental shift in metro network needs Large and growing customer base/vertical markets Introducing exciting new OCS products Scalable business fuels revenue growth & sustainable profitability Strengthened leadership Improved unit management Set clear strategy Sold non-core units Driving Transformation Maximizing Value Excellent Revenue & Profit Potential |
|
|
19 Questions? www.mrv.com info@mrv.com |
|
|
20 |
|
|
Pro Forma – Total Costs 21 All $ in 000s We have provided Pro Forma Operational Expense, a non-GAAP financial measure, to supplement our consolidated financial statements and our business outlook to improve comparability and better understand cost trends within the on-going business, which combines the amounts reported for the above periods. We believe these non-GAAP financial measures are useful to investors because they allow for greater transparency with respect to key metrics used by management in its financial and operational decision making. The most directly comparable GAAP financial measures is Cost of Sales plus Total Operating Expense, disclosed above. Management recognizes that the use of this non-GAAP measure has limitations, including the fact that it might not be comparable with similar non-GAAP measures used by other companies and that management must exercise judgment in determining which types of charges and other items should be excluded from its non-GAAP financial measures. Management currently compensates for these limitations by providing full disclosure of each non-GAAP financial measure and a reconciliation to the most directly comparable GAAP measure. The presentation of this financial information is not intended to be considered in isolation or as a substitute for, or superior to, the financial information prepared and presented in accordance with GAAP. Q1 2012 Q2 2012 Q3 2012 Q4 2012 Q1 2013 Q2 2013 Q3 2013 Cost of Sales 20,735 24,314 20,294 31,167 25,878 24,805 23,411 Total Operating Expenses: Product Development & Engineering 3,699 3,390 4,022 4,233 4,648 4,454 4,628 Selling, General and Administrative 12,630 11,163 11,415 13,392 12,394 9,451 10,308 Impairment of Goodwill 1,055 - - - Total Costs (Pro Forma) 37,064 38,867 36,786 48,792 42,920 38,710 38,347 |
|
|
Pro Forma – Total Operating Expense 22 All $ in 000s We have provided Pro Forma Total Operating Expense, a non-GAAP financial measure, to supplement our consolidated financial statements and our business outlook to improve comparability and better understand cost trends within the on-going business, which adjusts the amounts reported for the above periods for items that are non-recurring in nature. We believe these non-GAAP financial measures are useful to investors because they allow for greater transparency with respect to key metrics used by management in its financial and operational decision making. The most directly comparable GAAP financial measures is Total Operating Expense, disclosed above. Management recognizes that the use of this non-GAAP measure has limitations, including the fact that it might not be comparable with similar non-GAAP measures used by other companies and that management must exercise judgment in determining which types of charges and other items should be excluded from its non-GAAP financial measures. Management currently compensates for these limitations by providing full disclosure of each non-GAAP financial measure and a reconciliation to the most directly comparable GAAP measure. The presentation of this financial information is not intended to be considered in isolation or as a substitute for, or superior to, the financial information prepared and presented in accordance with GAAP. Q1 2012 Q2 2012 Q3 2012 Q4 2012 Q1 2013 Q2 2013 Q3 2013 Total Operating Expense as Reported 16,326 $ 14,556 $ 16,492 $ 17,625 $ 17,040 $ 13,907 $ 14,935 $ Adjustments: Tecnonet Goodwill Write-off - - 1,100 - - - - Derivative Litigation - - - 2,800 400 (300) - Employee Matter - - - - 700 200 100 Insurance Reimbursement - - - - - (1,000) - Total Adjustments - - 1,100 2,800 1,100 (1,100) 100 Total Operating Expense (Pro Forma) 16,326 $ 14,556 $ 15,392 $ 14,825 $ 15,940 $ 15,007 $ 14,835 $ |
|
|
Pro Forma – Product Dev and Systems 23 All $ in 000s We have provided Pro Forma Product Dev and Systems, a non-GAAP financial measure, to supplement our consolidated financial statements and our business outlook to improve comparability and better understand cost trends within the on-going business, which adjusts the amounts reported for the above periods for items that are non-recurring in nature. We believe these non-GAAP financial measures are useful to investors because they allow for greater transparency with respect to key metrics used by management in its financial and operational decision making. The most directly comparable GAAP financial measures are Product Development & Engineering, disclosed above. Management recognizes that the use of this non-GAAP measure has limitations, including the fact that it might not be comparable with similar non-GAAP measures used by other companies and that management must exercise judgment in determining which types of charges and other items should be excluded from its non-GAAP financial measures. Management currently compensates for these limitations by providing full disclosure of each non-GAAP financial measure and a reconciliation to the most directly comparable GAAP measure. The presentation of this financial information is not intended to be considered in isolation or as a substitute for, or superior to, the financial information prepared and presented in accordance with GAAP. Q1 2012 Q2 2012 Q3 2012 Q4 2012 Q1 2013 Q2 2013 Q3 2013 Product Development & Engineering (as reported) 3,699 3,390 4,022 4,233 4,648 4,454 4,628 Systems investment - 500 400 Product Dev and Systems (Pro Forma) 3,699 3,390 4,022 4,233 4,648 4,954 5,028 |

