Attached files
| file | filename |
|---|---|
| 8-K - FORM 8-K - Surgical Care Affiliates, Inc. | d655231d8k.htm |
 Exhibit
99.1 Surgical Care Affiliates, Inc.
32
nd
Annual J.P. Morgan Healthcare Conference
January 2014 |
| Certain
statements herein are “forward-looking statements” made pursuant to the
safe harbor provisions of the Private Securities Litigation Reform Act of 1995.
Statements contained herein that are not clearly historical in nature are forward-looking, and the words
“anticipate,”
“believe,”
“continues,”
“expect,”
“estimate,”
“intend,”
“project”
and similar expressions and future or conditional verbs
such as “will,”
“would,”
“should,”
“could,”
“might,”
“can,”
“may,”
or similar expressions are generally intended to identify forward-
looking statements.
These forward-looking statements speak only as of the date hereof and are based on the
Company’s current plans and expectations and are subject to a number of known and
unknown uncertainties and risks, many of which are beyond the Company’s control.
As a consequence, current plans, anticipated actions and future financial position and results of operations may differ
significantly from those expressed in any forward-looking statements in the presentation.
You should consider the numerous risks and uncertainties described in the
Company’s Form 10-Q for the quarter ended September 30, 2013 and in other documents we have filed
with the U.S. Securities and Exchange Commission, including those described under the headings
of “Risk Factors” and “Forward-Looking
Statements”
in the Form 10-Q. You are cautioned not to unduly rely on such forward-looking
statements when evaluating the information presented and we do not intend to update any
of these forward-looking statements. This presentation includes “unaudited
non-GAAP financial measures” as defined in Regulation G under the Securities
Exchange Act of 1934 , including Adjusted Net Income, Adjusted EBITDA-NCI, and Free
Cash Flow. We present non-GAAP measures when we believe that the additional
information is useful and meaningful to investors. Non-GAAP financial measures do not have any standardized meaning
and are therefore unlikely to be comparable to similar measures presented by other companies.
The presentation of non-GAAP financial measures is not intended to be a substitute
for, and should not be considered in isolation from, the financial measures reported in
accordance with GAAP. Systemwide growth measures should not be considered substitutes
for and are not comparable to GAAP measures. Systemwide growth measures are intended as
supplemental measures of our performance. See the appendix for a reconciliation of
certain non-GAAP financial measures to the comparable GAAP measures. This
presentation also contains estimates and other information concerning our industry that are based on industry publications,
surveys
and forecasts. This information involves a number of assumptions
and limitations, and we have not independently verified the accuracy
or completeness of the information.
Disclaimer
Note: Unless we indicate otherwise or the context requires, references made in this
presentation to “Surgical Care Affiliates”, “the Company”, “SCA”, “we”, “us” and “our”
refer to ASC Acquisition LLC and its consolidated subsidiaries prior to our conversion to a
Delaware corporation on October 30, 2013 and to Surgical Care Affiliates, Inc. and its
consolidated subsidiaries after our conversion to a Delaware corporation on October 30, 2013.
|
 2
Perioperative
services
Management
agreements
ASCs
(majority
ownership
model)
ASCs
(minority
ownership
model with
health
systems)
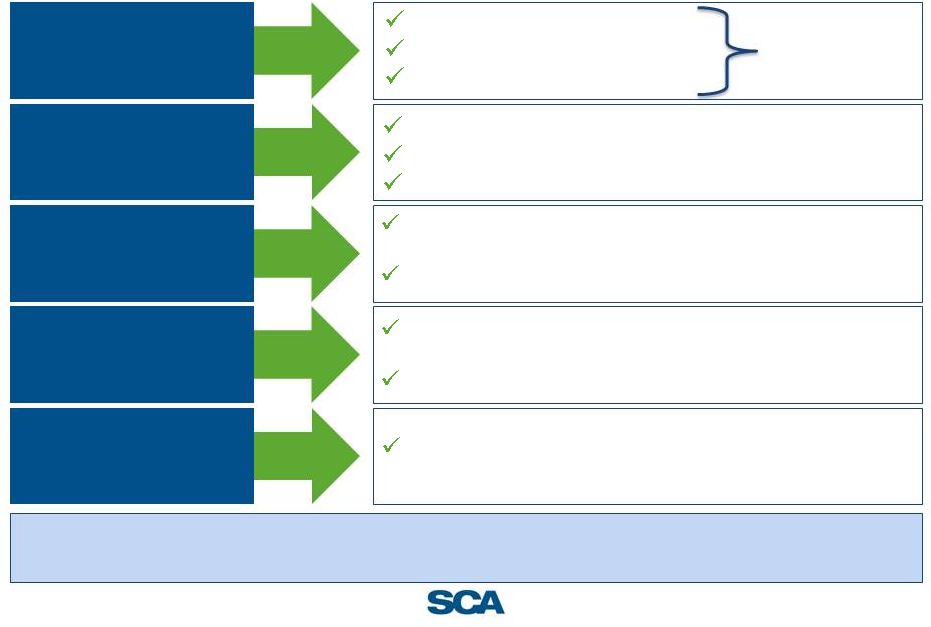
How we
monetize
Ancillary
services
Development
Informatics
Systems
Our
capabilities
Payors
Who we are
Health
systems
Physicians
Patients
Who we
serve
Optimize the delivery of surgical care in partnerships with
physicians and major non-profit health systems
Our
solution |
 3
SCA snapshot
Health systems and physician
JV model
2009
Today
1
National footprint
168 ASC’s; 5 surgical hospitals; 1
sleep center
18 to 42 health system partners since 2007
$146mm of LTM Adjusted EBITDA-NCI, grew 12% in 2012
Revenue ($mm)
$194
$575
1
At 9/30/13 / LTM ended 9/30/13; ² Includes one
facility comprised of 11 sleep center locations Average %
ownership
25%
# of facilities
22
Physician only JV model
2009
Today
1
$660
$705
54%
103
83
91
2
1 |
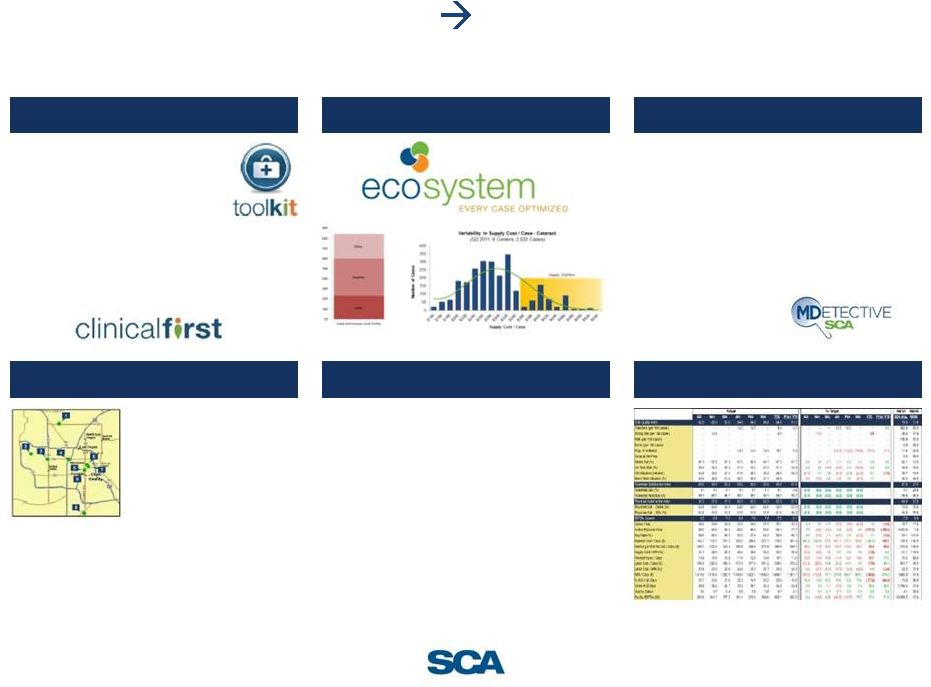
 4
We transformed the business for growth
Health system
partnerships
Organization
building
Suite of services
Carve-out from
HealthSouth
Andrew Hayek
joins as CEO
Physician
Leadership
Board
ECOSystem™
Pete Clemens
joins as CFO
MDetective™
Online SCA
Resources
SCA Insight
Established leadership through continuous investments in the business
Joe Clark
becomes CDO
SCA Knowledge
Library
Michael Rucker
promoted to
COO
SmartSystem
Added sales
team
Transition to health system partnership strategy
Phase of
development
131
127
174
# of centers
Rationalize footprint
Accelerated growth w/ health system partners
Build new leadership
125
123
142
147
1
At 12/31, except 2013 at 9/30/13
2007
2008
2009
2010
2012
2013
2011
1982–Surgical
Care Affiliates was
founded
1 |
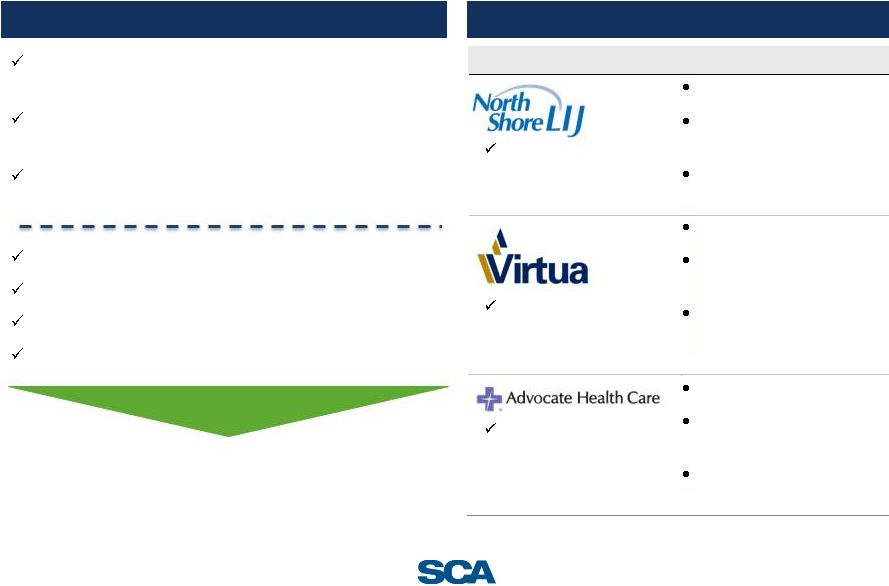 5
Strategic focus on building health system partnerships…
Health system partner
Key metrics
Revenue: $6.7bn
Inpatient market share in
MSA - 27.4%
2nd largest inpatient
market share in NY MSA
Revenue: $1.1bn
Inpatient market share in
MSA – 30.7%
Highest inpatient market
share in Southern New
Jersey
Revenue: $4.6bn
Inpatient market share in
MSA – 16.2%
Highest inpatient market
share in Chicago
Partnership implications
Growing importance of local market leading health
systems
Health systems play larger role in delivery of care, both
primary and specialist
Health systems searching for partners on surgical
strategy (systems, expansion, people)
Enhanced ability to capture surgical volumes
Immediate relevance with Payors in local markets
Capital efficient platform for growth
Unique acquisition / co-development opportunity
•
Non-controlling status in partnered facilities
•
Impact on financial accounting (growth of health
system partnerships will drive equity in non-
controlling interest)
Leading health system in
New York
Leading health system in
New Jersey
Largest health system in
Illinois
Source: Respective audited financial statements, Health Leaders Interstudy reports and
S&P rating reports
Partnered with “winners”
in local markets
Health system partnership rationale |
 6
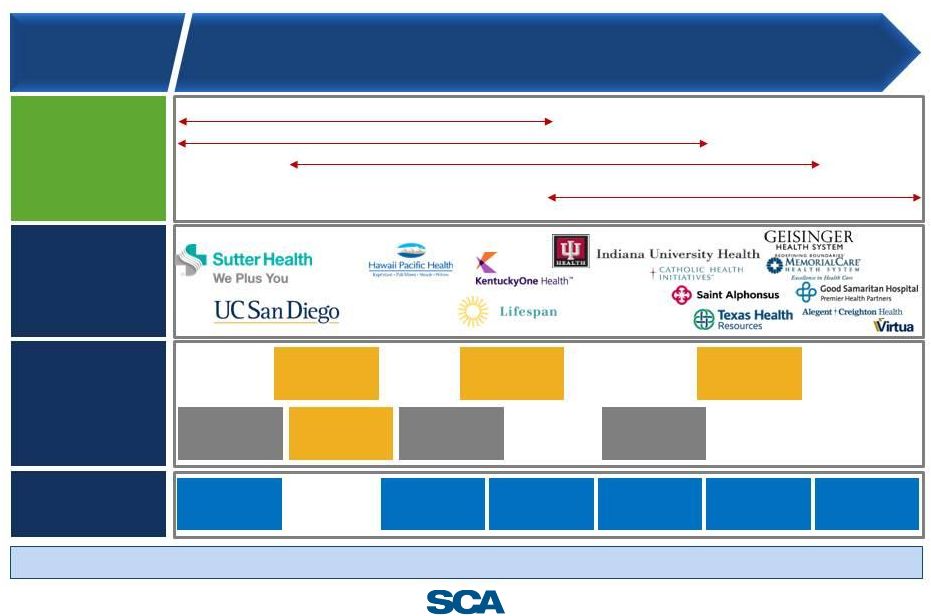
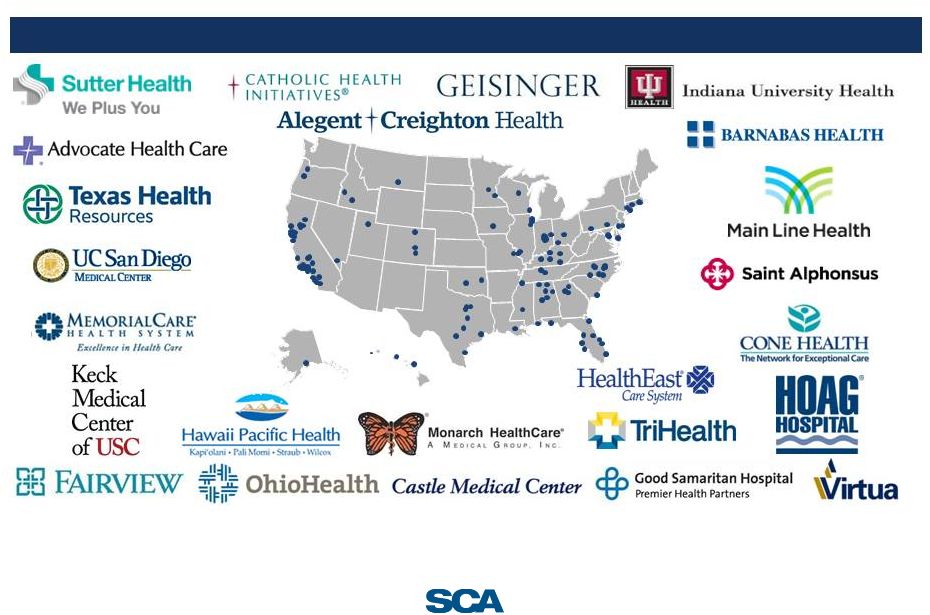
…becoming a Partner of Choice for leaders in the industry
42 health system partners | 650K+ surgical procedures per year |
~2,000 physician partners
Slide represents only selected partners as of 12/31/2013 |
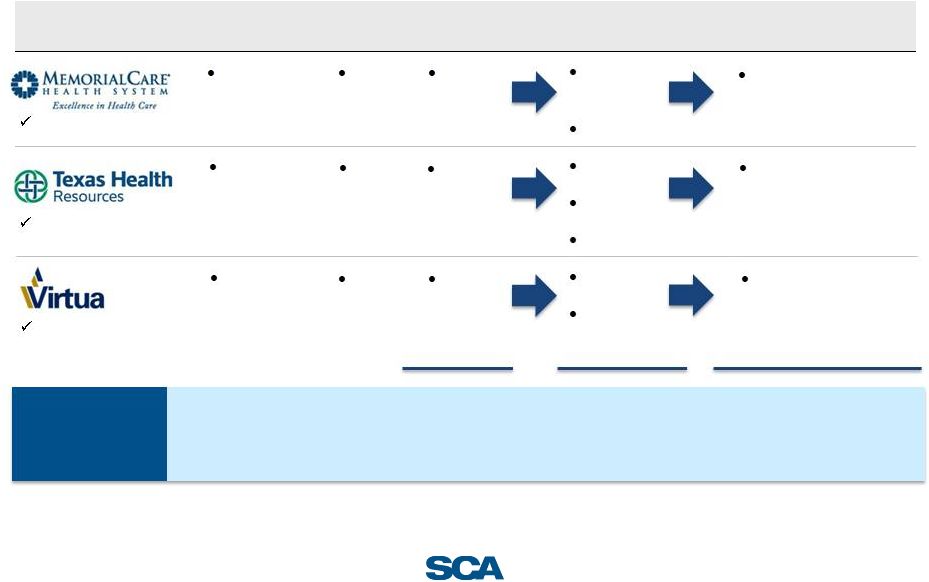 7
Multiple
partnerships
in
early
stages
–
Significant
embedded
growth
Total
10 centers
13 centers
3 LOI’s/pending
1 de novos
21-25 centers in 2014
2
7-11 new ASC’s
annually
2
Largest health system in
Orange County, CA
Largest health system in
Dallas/Fort-Worth
Largest health system in
Southern New Jersey
Health system partner
Health system
network
Launch
date
Status at launch
Current status
Runway for growth and
expansion
6 hospitals
2013
2 ASCs
4 ASCs
+ periop
1 LOI
Expect to acquire 2-3
ASCs annually
25 hospitals
2012
3 ASCs
4
ASCs
1
de novo
Expect to acquire 3-5
ASCs annually
4
hospitals
2013
5 ASCs
5 ASCs
1 Pending
Expect to acquire 2-3
ASCs annually
1
1
2
2
2
3
1 LOI
1
Note: Represents management estimates of facility acquisitions for the next several years.
Actual number of acquisitions in any period may vary subject to market conditions and other factors.
Acquisition of facilities may not lead to revenue growth. Management’s view of overall
pipeline remains robust.
1
Source: Applicable health systems’ website; ² Based on management assessment of local markets and demand for affiliated ASCs; ³ As of
10/1/13 |
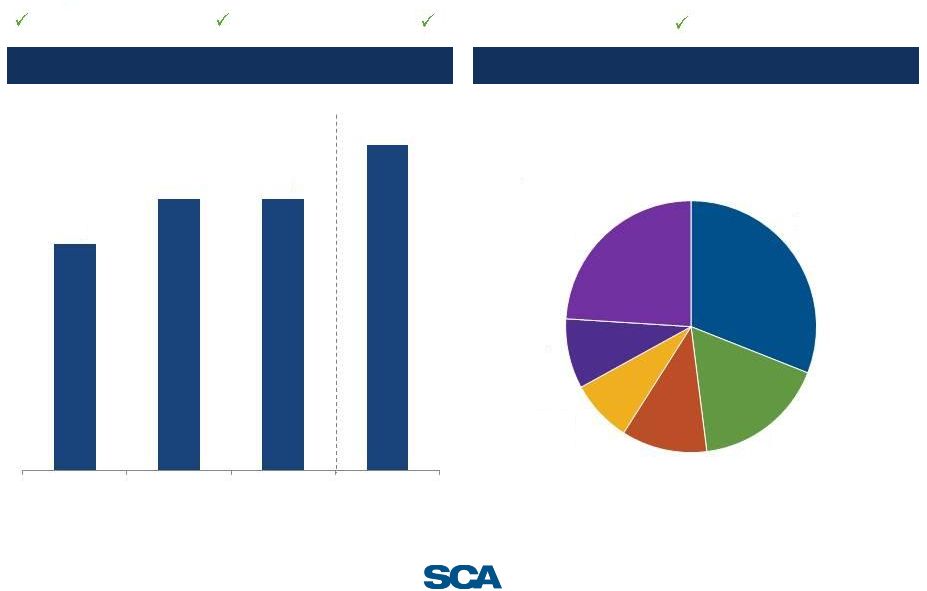
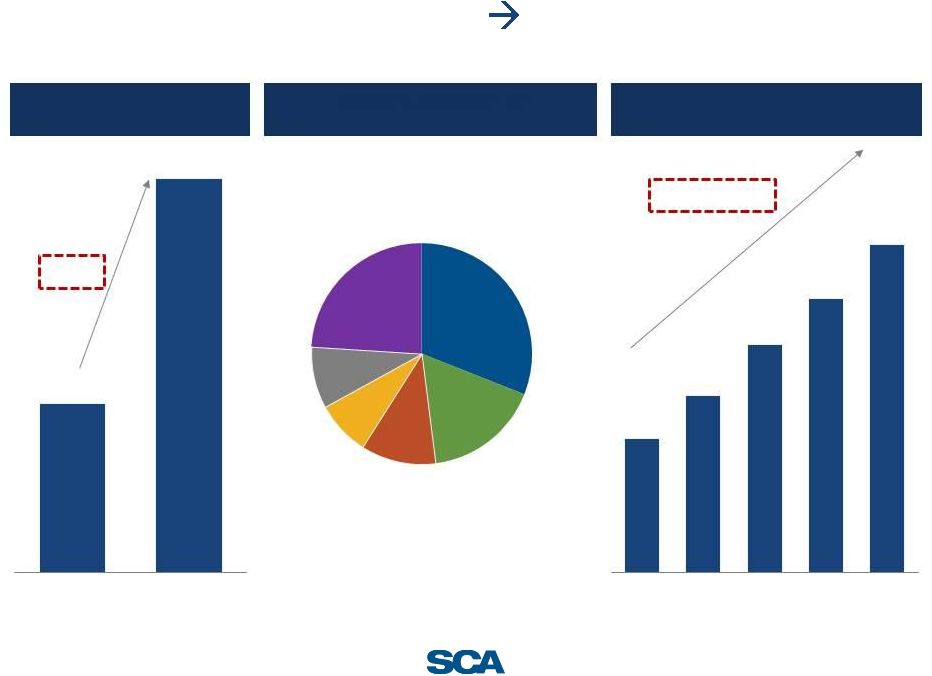 8
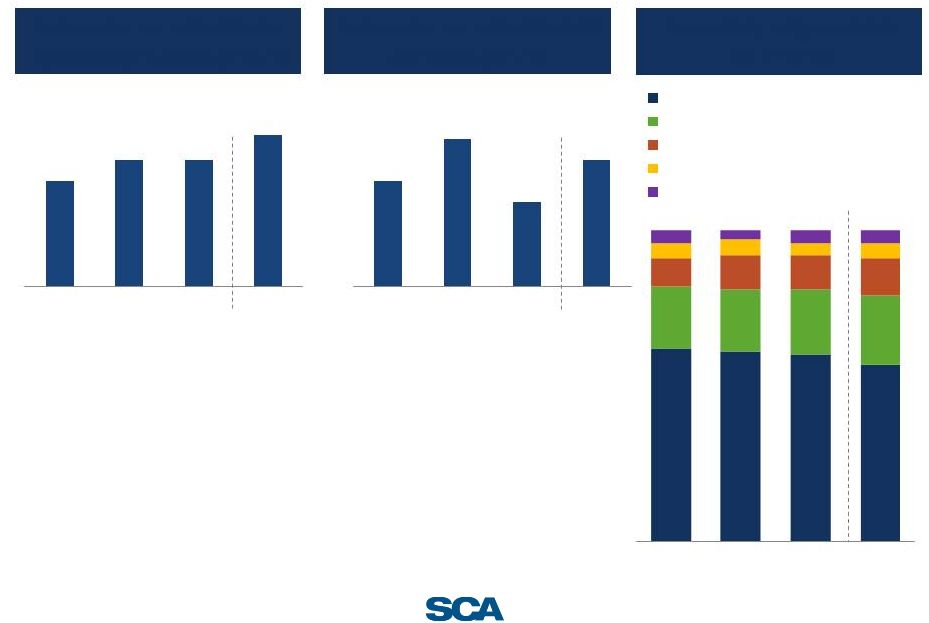
Rigorous operational discipline
Strong results
Health system
partnerships
2.3x
Financial performance
(Adjusted EBITDA-NCI, $mm)
13.1% CAGR
Attractive
case
mix
1
1
As a percentage of net patient revenue, consolidated, as of 1H 2013
General
Surgery
24%
Orthopedic
31%
Ophthalmology
17%
Gastro
11%
Pain
8%
ENT
9%
$89
$102
$117
$130
2009
2010
2011
2012
18
42
2007
9/30/2013
LTM
9/30/13
$146 |
 Key investment
highlights 1
12 months ended 9/30/13
2
1-year forward FV/EBITDA multiple
Aligned with transition to lower-cost, higher-quality care
Differentiated model —
JVs with leading health systems
Market opportunity expanding
Partnerships create capital efficient acquisition model
Significant
investment
in
“Systems
&
Processes”
to
drive
continuous mix and volume improvement
Value-based care driving new opportunities
Track record of execution
Advantageous cash generation
ASCs on average cost 42% less than
hospitals
42 health systems partnerships
17 new partnerships over the past
12 months
Acquired 52 facilities since 2010 at
effective first year multiple of 4.3x
Same-site systemwide 2012 growth:
Net Operating Revenue : 6%
Net Patient Revenue per case : 4%
Pursuing partnerships with ACOs,
IPAs, and payors
2009-YTD, Adjusted EBITDA-NCI
CAGR of 13%
Value of NOL, cash conversion
9
1
2 |
 10
Our solution |
 11
Healthcare is at an inflection point
Pressure on both physician groups and health systems
Consolidation is accelerating
Increasing focus on lowering costs and delivering value
Health systems, physicians and payors are looking for
solutions |
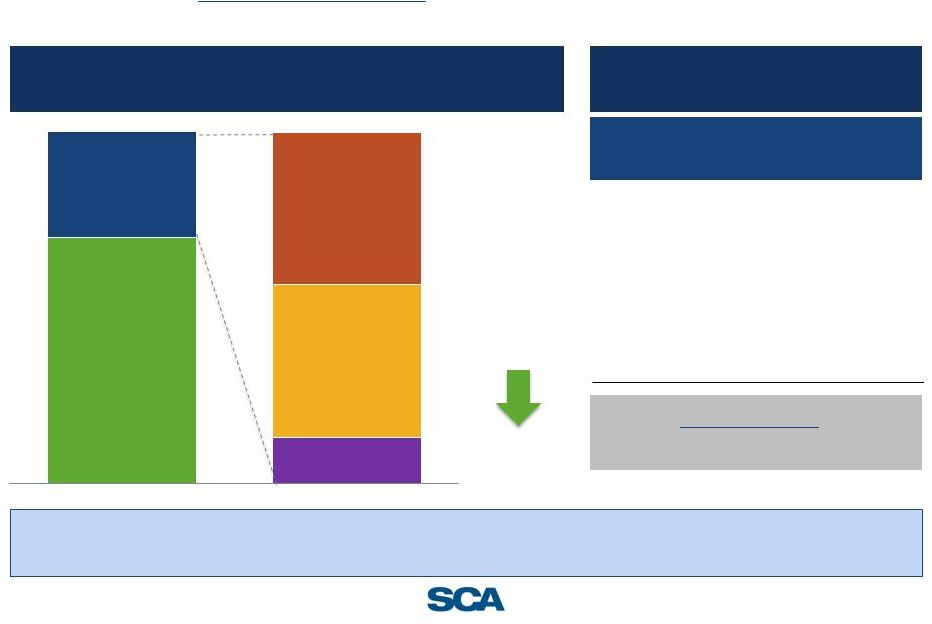 The transition
to value-based care creating new opportunity Surgery represents ~30% of medical
spend for individuals with commercial insurance
Source: Based on management estimates and SCA analysis of commercial payor data sets
Significant
addressable
opportunity
Cataract
Upper GI
Endoscopy
Colonoscopy
$964
$341
$378
$1,670
$591
$655
Source: Ambulatory Surgery Center Association report (2011)
Secular migration
to optimal setting
Surgery
30%
Medical/other
70%
Hospital -
Outpatient
ASC
Hospital -
Inpatient
Surgery spend by setting
Cost comparison ASC vs. hospital
outpatient dept.
Procedure
Medicare
procedure
billed at ASC
Medicare
procedure billed
at hospital
As health systems transition to value-based strategies, the need to manage surgical
costs will only increase
42% lower price
at ASC vs. hospital
12 |
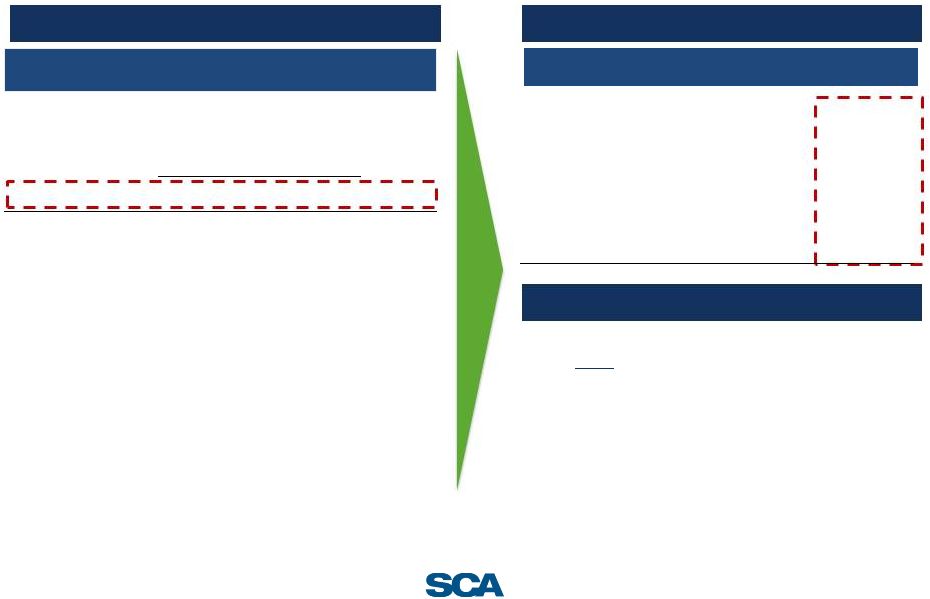
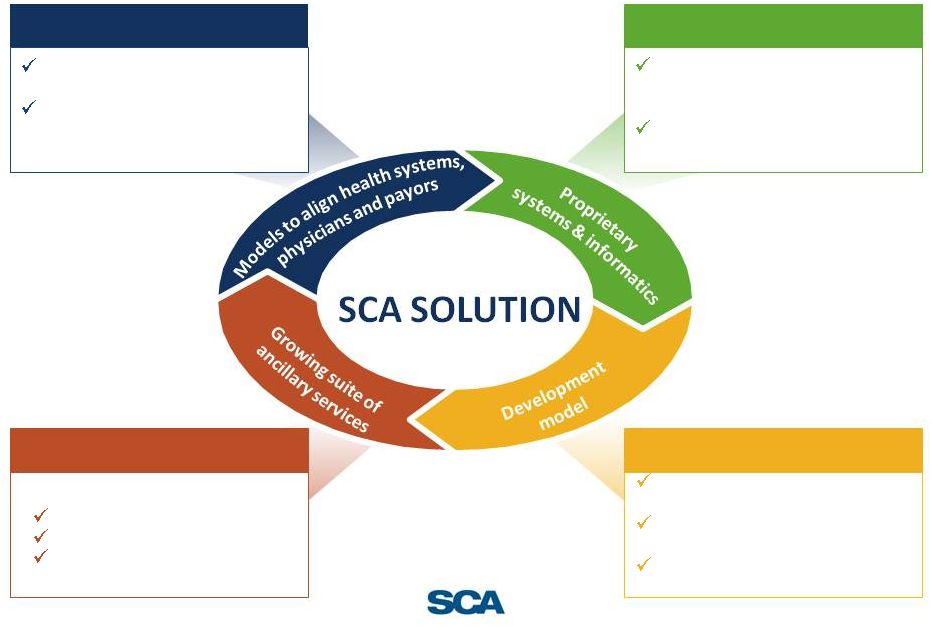 Delivering a
comprehensive surgical solution Models to align health systems,
physicians and payors
Flexibility in partnership model to
attract health systems
Co-management agreements, joint
ventures and alternative payment
models
Proprietary systems & informatics
Proprietary systems optimize
case/facility profitability and drive
productivity
Analytics support clinical and
quality-based metrics
Growing suite of ancillary services
Surgical solutions
Perioperative services
ACO analytics
Development model
Experience negotiating and executing
partnerships
Deploy resources to drive market
strategy
Co-invest with partners and acquire
facilities at attractive multiples
13 |
 14
Technology and informatics
Performance management
•
SCA Quality Index
•
Clinical Consulting Team
•
Regional Quality
Councils
•
Clinical Excellence Universe (in-
center education workstations)
•
Highest opportunity specialty
determination
•
Physician target mapping and
prioritization
•
Disciplined recruitment process
and tracking
•
Experts in service
line
expansion
•
Expansion
•
Consolidation
•
Resyndications
•
Target
identification
•
Integration
•
Perioperative services
•
Revenue cycle analytics
•
Schedule optimization
•
Supply chain
•
Labor efficiency
•
Best practices
•
Fully integrated IT system
Clinical excellence
Case profitability
Physician recruitment
Development
Operational efficiency
Benchmarking/informatics |
 15
Expanding
suite
of
solutions
-
Perioperative
services
Providing
surgical
solutions
•
SCA partners seek broader set of
solutions
•
Hired strong team with perioperative
services experience
•
Adapted their know-how to SCA system
of data, process, and execution
•
Began referencing perioperative services
to SCA’s partner base through SCA’s
development team
•
Now generates profit with 14 surgery
departments engaged
Multi-Site
Perioperative
Clients
Perioperative services have gained meaningful traction and strengthen relationships
with health system partners
1
As of September 30, 2013
1 |
 16
Leveraging our capabilities to drive industry-leading same-
site growth
1
As a percentage of net patient revenue, consolidated only; 1H 2013
Driving case mix
Driving efficiency
Industry-leading metrics
Driving volume growth
5%
6%
6%
7%
2010
2011
2012
9 Mo 2013
Orthopedic
31%
Ophthalmology
17%
Gastro
11%
Pain
8%
ENT
9%
General
Surgery
24%
Same-site systemwide net op. rev. growth
Consolidated
case
mix
1 |
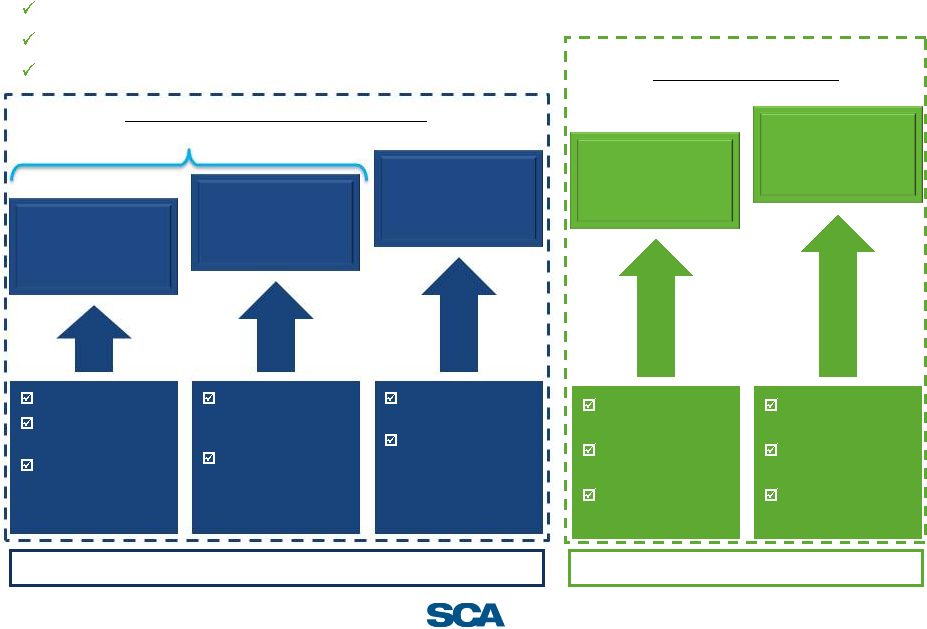 17
Leadership position
High return on capital, given partnership strategy
Expanding universe of health systems seeking partners
Multiple levers for sustainable growth
1/3
1/3
1/3
Acquisitions/
development with
existing partners
New partnerships
and selected
acquisitions
Optimize
same-site
performance
Expanding
platform
Attractive returns on
in-market capital
deployment
Multiple partnerships
in early stages of
opportunity
Multiple ways to
enter a new market
Inflection point in
market creating
opportunity
Perioperative
services
Physician group /
MSO management
Data and analytics
Price/volume
Maximize procedure
mix
Physician recruitment
Transition to value
Surgery benefits
management
Partnerships with
risk-bearing entities
Payor partnership
Organic
Upside opportunities
Long-term target: 10-12% Adjusted EBITDA-NCI growth
Upside
Drivers of Adj. EBITDA-NCI growth |
 18
Financials |
 Financial model
highlights Multi-pronged growth
Attractive same site
systemwide revenue
growth
Growth in partnerships
creates sustainable
tail-wind
Strong cash conversion
reinvested to drive
capital efficient growth
Adjusted EBITDA-NCI is
the key financial metric
contribution
equally
weighted
Same-site growth
In-market co-development
New partnerships/acquisitions
Physician recruitment
Continued efficiency
Focus on case mix
Significant in-market co-development opportunity within
early stage health system partnerships
Growing pipeline of partnerships given market demands
Expectation of no federal cash taxes until 2018 given
significant NOL
Acquiring assets at attractive effective multiples
Nonconsolidated facilities Adj. EBITDA-NCI will grow
faster than consolidated facilities
Long-term target: 10-12% Adjusted EBITDA-NCI growth and
strong double-digit cash Adjusted net income growth
19 |
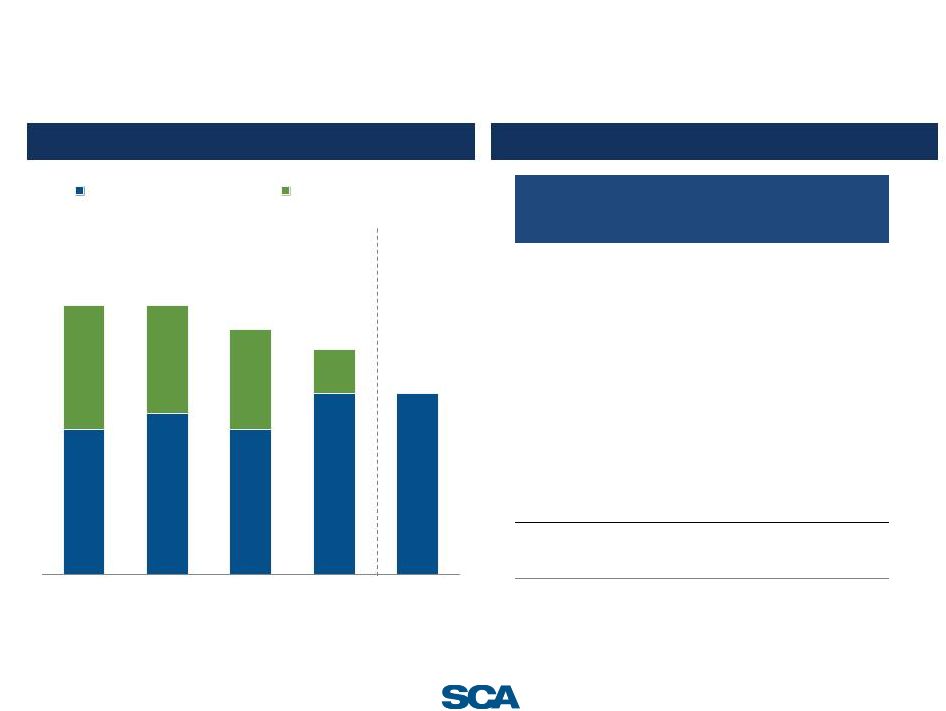
 20
Track record of growth
Systemwide net operating revenue growth
Adjusted EBITDA–NCI ($mm)
17.8%
•
Systemwide net operating revenue growth results
from NPR/case increases, volume increases and new
affiliated centers
•
Managed care contract wins in two markets in late
2012 that rolled through into 2013
•
Q4 2013 expected to be lower than Q4 2012 due to
non-recurring OH benefits booked in Q4 2012.
5.8%
5.6%
17.0%
16.4%
12.1%
2009
2010
2011
2012
9 Mo 2013
$89
$102
$117
$130
$89
$105
2009
2010
2011
2012
9 Mo
2012
9 Mo
2013 |
 21
Same-site systemwide performance and payor mix
Same-site systemwide net
operating revenue growth
Same-site systemwide NPR
per case growth
(YoY growth)
(YoY growth)
•
Reflects recruitment of new
physicians and increasing
market share
•
Shift to longer, higher-acuity
cases (with higher
reimbursement)
•
Same-site systemwide NPR
per case increases are being
driven by preferable case mix
and managed care contracting
–
Offset by lower workers
comp reimbursement in
select markets
Consolidated payor mix
(% of NPR)
62%
61%
60%
57%
20%
20%
21%
22%
9%
11%
11%
12%
5%
4%
5%
4%
3%
4%
Managed care and other discount plans
Medicare
Workers' compensation
Patients and other third party payors
Medicaid
5%
4%
2010
2011
2012
9 Mo 2013
5%
6%
6%
7%
2010
2011
2012
9 Mo
2013
5%
7%
4%
6%
2010
2011
2012
9 Mo
2013 |
 22
Strong cash conversion & efficient capital deployment
Historical free cash flow
•
No cash taxes expected through 2018 due to
NOLs drives attractive cash flow conversion
•
30-40% of Adjusted EBITDA-NCI typically
converts to free cash flow
Vintage analysis ($mm)
•
Capital efficient model —
generally acquire
at
4.0x
effective
multiple
,
due
to
strategic
benefits
•
Positions facilities for continued potential
growth post-acquisition through clinical
integration and market positioning
•
Increasing benefits to in-market density
with health system
Value created under SCA umbrella
Vintage
Purchase
Price
Yr 1 E-
NCI
Yr 2 E-
NCI
Yr 1
Multiple
Yr 2
Multiple
3
2010 Class
$16.8
$2.7
$2.5
6.3x
6.6x
2011 Class
138.4
26.5
33.9
5.2x
4.1x
2012 Class
30.5
13.6
15.6
2.2x
2.0x
2013 Class (YTD)
20.9
5.0
Average
$59.0
$13.7
$17.4
4.3x
3.6x
($mm)
2010
2011
2012
10-'12
CAGR
Operating cash flow
$143.8
$165.3
$171.2
9.1%
Less: Capex
28.7
32.9
28.4
Less: Distributions
1
82.6
84.7
94.2
Free cash flow
$32.5
$47.7
$48.6
22.3%
2
2
3
3
Distributions to noncontrolling interests of consolidated affiliates; ²
Adjusted EBITDA-NCI; ³ Firm value/EBITDA multiple
1
2013 YTD as of 6/30/2013 |
 23
As of September 30, 2013
($mm)
As Adjusted
pro forma IPO
Cash and cash equivalents
$88.6
Long-term debt, including current portion:
$132mm revolving credit facilities due 2016
–
Class B term loans due 2017
215.0
Class C incremental term loans due 2018
388.1
10.0% senior subordinated notes due 2017
–
Notes payable to banks and others
38.9
Capital lease obligations
18.9
Total long-term debt
660.9
Net debt
$572.3
Gross leverage
4.5x
Net leverage
3.9x
Illustrative PF balance sheet
Overview of leverage
Gross leverage
1
Includes Class B and Class C term loans, capital leases and notes payable to banks and
others 2
Pro forma for redemption of senior subordinated notes due 2017
1
2
3.6x
4.0x
3.6x
4.5x
4.5x
6.7x
6.7x
6.1x
5.6x
4.5x
12/31/2010
12/31/2011
12/31/2012
9/30/2013
Pro forma
9/30/2013
Other leverage
Senior secured leverage |
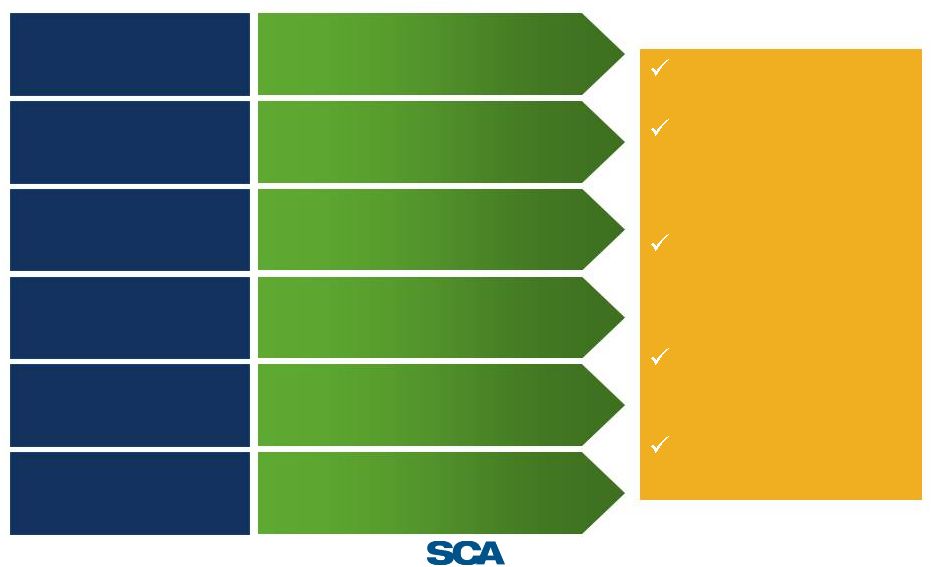 24
Surgical solution partner positioned for sustainable growth
SCA’s competitive
advantages…
Leadership position with
health systems
…
which lead to strong financial
performance and position
the Company for growth
Early stages of multi-
pronged growth plan
Strong cash conversion /
capital-efficient model for
expansion
…
create tangible strategic and
economic benefits…
Differentiated by
proprietary technology
•
Health System partnership provides
unique advantages
•
Acquiring at low effective multiples
•
Proprietary systems to enhance
clinical, operational and financial
results
Aligned with transition to
value-based care
•
Deliver high-quality, cost-effective clinical
outcomes to patients and payors
•
Positioned to work with risk-bearing entities
•
Embedded potential growth in existing
partnerships
•
Capital efficient, disciplined acquisition
strategy
•
Substantial growth in health system
partnerships (from 18 to 42)
•
Strong operational and financial results
Experienced
Management Team
•
Strong prior healthcare experience
•
Proven ability to drive results
Strong same-site growth
Continued growth in
health system
partnerships
Long-term target of
double digit Adjusted
EBITDA-NCI growth
Strong return on
invested capital
Track-record of creating
shareholder value |
 Appendix
25 |
 26
Reconciliation of net income to Adjusted EBITDA-NCI
($mm)
($mm)
2010
2011
2012
2012
2013
Net income
$69.5
$83.5
$72.3
$55.6
$51.0
Plus (minus):
Internet expense, net
$51.1
$55.6
$58.5
$44.4
$48.7
Provision of income tax expense
14.6
20.4
8.3
8.7
10.2
Depreciation and amortization
37.4
40.5
41.7
30.4
31.9
Loss from discontinued operations, net
11.1
3.0
2.8
4.1
4.2
Equity method amortization expense¹
–
10.1
20.3
15.2
17.9
Loss (gain) on sale of investments
(2.1)
(3.9)
7.1
(2.0)
1.1
Loss on extinguishment of debt
–
–
–
–
3.8
Asset impairments
3.0
–
10.2
0.4
3.4
Loss (gain) on disposal of assets
0.4
(0.8)
(0.3)
(0.2)
0.3
IPO related expense
0.8
Non-cash stock compensation expense²
1.3
1.7
1.7
1.3
6.6
Adjusted EBITDA
$186.3
$210.1
$222.7
$158
$179.8
(Minus):
Net income attributable to non-controlling interests
(84.4)
(93.2)
(92.4)
(68.9)
(74.9)
Adjusted EBITDA-NCI
$101.8
$116.9
$130.4
$89.1
$105.0
¹ For the years ended December 31, 2012 and December 31, 2011, we recorded $20.3
million and $10.1 million, respectively, of amortization expense for definite-lived intangible assets attributable to equity
method investments. For the nine-months ended September 30, 2013 and 2012, we recorded
$17.9 million and $15.2 million, respectively, of amortization expense for definite-lived intangible assets
attributable to equity method investments. These expenses are included in Equity in net
income of unconsolidated affiliates in our consolidated financial statements. There was no such amortization expense
for the year-ended December 31, 2010. ²
Represents a non-cash expense relating our equity-based compensation program.
Year-ended December 31,
Unaudited Nine-months ended September 30, |