Attached files
| file | filename |
|---|---|
| 8-K - 8-K - Premier, Inc. | a14-3255_18k.htm |
| EX-99.2 - EX-99.2 - Premier, Inc. | a14-3255_1ex99d2.htm |
Exhibit 99.1
|
|
Transforming Healthcare from the Inside 32nd Annual JP Morgan Healthcare Conference January 13, 2014 Note: Financial information in this presentation is from the company’s FY14 first-quarter earnings release and conference call (11/12/13). |
|
|
Forward-looking statements—Certain statements made in this presentation, including those related to Premier’s financial and business outlook, growth and cross-sell opportunities and financial guidance, are “forward-looking statements.” Forward-looking statements may involve known and unknown risks, uncertainties and other factors that may cause the actual results of Premier to be materially different from historical results or from any future results or projections expressed or implied by such forward-looking statements. Accordingly, readers should not place undue reliance on any forward-looking statements. Readers are urged to consider statements in the conditional or future tenses or that include terms such as “believes,” “belief,” “expects,” “estimates,” “intends,” “anticipates” or “plans” to be uncertain and forward-looking. Forward-looking statements may include comments regarding Premier’s beliefs and expectations as to future events and trends affecting its business and are necessarily subject to uncertainties, many of which are outside Premier’s control. More information on potential risks and other factors that could affect Premier’s financial results is included, and updated, from time to time, in Premier’s periodic and current filings with the SEC, as well as those discussed in Premier’s IPO Prospectus filed with the SEC and available on Premier’s website. Forward-looking statements speak only as of the date they are made. Premier undertakes no obligation to publicly update or revise any forward-looking statements. Non-GAAP financial measures—This presentation includes certain “non-GAAP financial measures” as defined in Regulation G under the Securities Exchange Act of 1934. Schedules are attached that reconcile the non-GAAP financial measures included in the following presentation to the most directly comparable financial measures calculated and presented in accordance with Generally Accepted Accounting Principles in the United States. Premier’s Form 8-K, dated January 13, 2014, to which the following presentation is attached as Exhibit 99.1, as well as its Form 10-Q for the quarter ended September 30, 2013, filed with the SEC on November 12, 2013, provides further explanation and disclosure regarding Premier’s use of non-GAAP financial measures and should be read in conjunction with this presentation. Forward-looking statements and Non-GAAP financial measures |
|
|
Transforming Healthcare FROM THE INSIDE |

|
|
Implications for healthcare systems, PREMIER STRATEGY Member and industry needs Member co-innovation Intelligent and predictive analytics drive continuous improvement from the inside Visibility to cost and quality opportunities Vertical integration of supply chain Early leader in population health management Scale through shared infrastructure Premier strategic differentiation Total cost reduction Quality improvement across the continuum Evolving delivery and payment models Actionable data and information |
|
|
Unique customer alignment Data-driven, technology enabled Diversified growth engine Compelling financial profile Transforming healthcare FROM THE INSIDE |

|
|
Member model DRIVES INNOVATION AND GROWTH SCALE Represent 57% of U.S. community hospitals Over $40 billion in supply chain spend Manage ~1,900 contracts from ~1,100 suppliers 2.5 million real-time clinical transactions daily Data repository which encompasses 1 in 4 U.S. hospital discharges ALIGNMENT Members own ~78% of equity 10 health system board members Embedded field force COMMITMENT 97% of members committed to restructure 86% surveyed over the last three years view Premier as strategic partner or organizational extension CO-INNOVATION Co-develop solutions with members Committees composed of ~180 member hospitals ~850 hospitals in collaboratives Data Alliance Collaborative |
|
|
INTEGRATED SOLUTIONS to complex challenges Unified sales/field Solutions Attributes Single Platform Group purchasing Specialty pharmacy Direct sourcing Leading healthcare supply chain company ~2,000 acute care hospitals use product or service Significant alternate site growth Vertical integration Uniquely advantaged by data access and collaboratives Leading healthcare informatics company ~1,800 hospitals use product or service 46% of purchases by non-GPO customers SaaS analytic products in cost, quality, safety and population health Enterprise data analytics platform–clinical and operational Collaboratives Advisory services Supply Chain Services Performance Services |
|
|
DATA-driven, TECHNOLOGY-enabled |
|
|
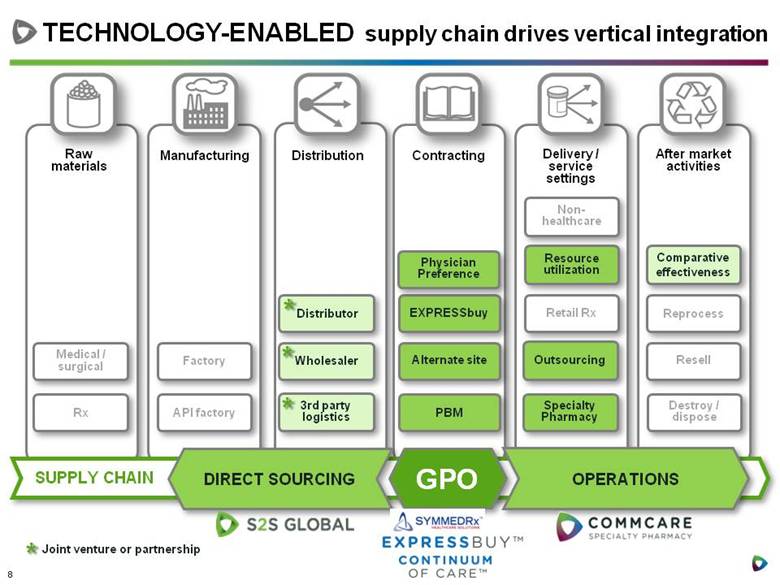
TECHNOLOGY-ENABLED supply chain drives vertical integration Joint venture or partnership * Delivery / service settings Outsourcing Specialty Pharmacy Retail Rx After market activities Destroy / dispose Reprocess Resell Raw materials Manufacturing Distribution Distributor Wholesaler 3rd party logistics Contracting PBM OPERATIONS GPO DIRECT SOURCING Alternate site EXPRESSbuy Medical / surgical Rx API factory Factory Resource utilization * * * Non- healthcare Comparative effectiveness Physician Preference |
|
|
Leveraging data assets for UNIQUE ANALYTIC SOLUTIONS Financial/claims Multi-source data Supply chain/ pharmacy/lab Clinical and outcomes (Acute and amb. charge data) ~870 U.S. hospitals (GL and time-keeping data) ~780 U.S. hospitals (EHR data) ~320 U.S. hospitals (Data from over 400 payers) ~80 U.S. hospitals PLATFORM Detailed price benchmarking and spend optimization, including PPI, pharmacy and value analysis Custom benchmarking against 25% of U.S discharges Benchmarking for budgeting, productivity management Real-time alerting for infection prevention & medication management and regulatory reporting for NHSN Detailed analysis of defined population with payer contracts; risk-stratification, care management |
|
|
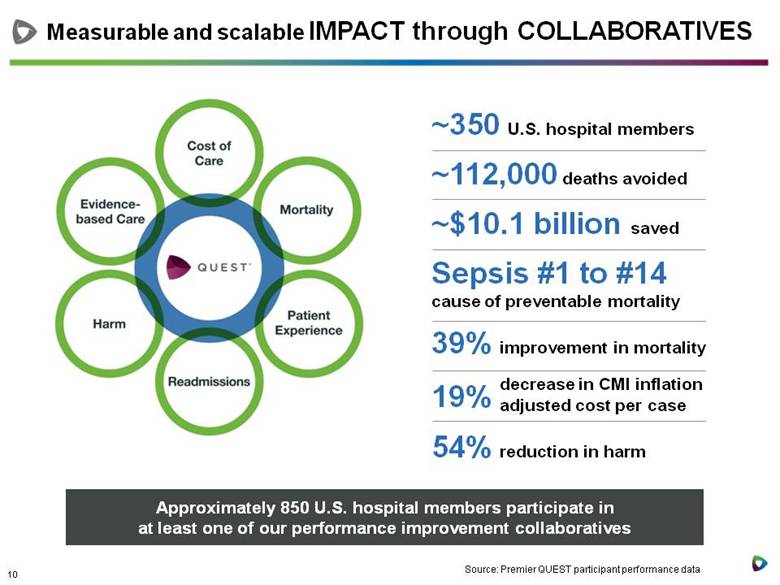
Approximately 850 U.S. hospital members participate in at least one of our performance improvement collaboratives Measurable and scalable IMPACT through COLLABORATIVES ~350 U.S. hospital members ~112,000 deaths avoided ~$10.1 billion saved Sepsis #1 to #14 cause of preventable mortality 39% improvement in mortality decrease in CMI inflation adjusted cost per case 54% reduction in harm 19% Source: Premier QUEST participant performance data |
|
|
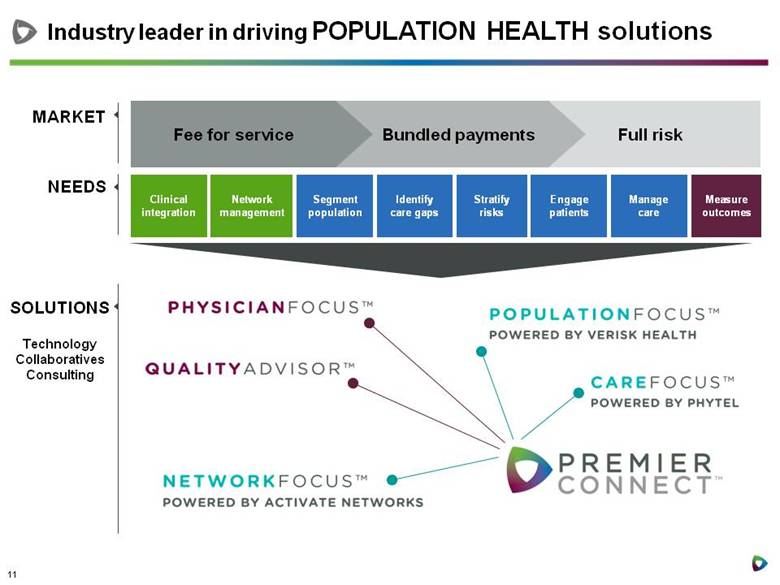
MARKET Industry leader in driving POPULATION HEALTH solutions NEEDS SOLUTIONS Technology Collaboratives Consulting Full risk Bundled payments Fee for service Clinical integration Network management Segment population Identify care gaps Stratify risks Engage patients Manage care Measure outcomes |
|
|
DIVERSIFIED growth engine |
|
|
Multiple levers drive long-term SUSTAINABLE GROWTH TARGETS Upside Performance Services Supply Chain Services Contract penetration New members Service line value Continued penetration of alternate site Innovatix is a leader Multiple assets to leverage Specialty pharmacy EXPRESSbuy Direct sourcing High demand Aligned customer base Collaboratives and consulting are sticky Population management Data warehousing Leverage member relationship and insight Expanding supply chain solutions Steady core GPO growth Alternate site expansion Member penetration performance services New product development Pursue selected M&A and partnership opportunities Strong distribution channel Desired partner/ capability |
|
|
SIGNIFICANT cross-sell opportunities If all members use all Premier solutions – supply chain, applications, collaboratives, advisory services $5 billion revenue opportunity 2,854 acute members Members using supply chain services Members using both supply chain and at least one performance services product or service Members using performance services products and services 1,045 975 834 2,020 total 1,809 total Note: Numbers are as of June 30, 2013. 34% of members are using both supply chain services and at least one informatics product |
|
|
MEMBER-DRIVEN co-development engine Organic Acquisitions Partnerships Premier platform enables rapid deployment of new solutions (2011) (2010) CareScience (2007) (2013) (2013) |
|
|
Ongoing MEMBER VALUE Single offering Multiple offerings Recent multiple offerings members FULLY ENGAGED GPO only CASE STUDY ~$393M value to member ~$23M FY13 revenue to Premier |
|
|
COMPELLING financial profile |

|
|
Financial history Consolidated Net revenue CAGR: 13% Supply Chain Net revenue CAGR: 13% Performance Services Net revenue CAGR: 14% YoY Growth Adjusted EBITDA1 CAGR: 10% Adjusted EBITDA CAGR: 8% Adjusted EBITDA CAGR: 22% YoY Growth Margin 1 Consolidated adjusted EBITDA includes corporate expenses which are not allocated to reportable segments’ adjusted EBITDA See “Forward Looking Statements and Non-GAAP Financial Measures” at the front of this presentation for additional information regarding our use of non-GAAP financial measures. |
|
|
Consolidated first quarter FY14 financial highlights (In millions, except per share data) Q1 FY14 (3 months ended 9/30/13) Q1 FY13 (3 months ended 9/30/12) % change Pro forma net revenue: Supply Chain Services Performance Services $146 $53 $133 $48 10% 10% Total pro forma net revenue $199 $181 10% Non-GAAP pro forma adjusted EBITDA1 $83 $77 8% Non-GAAP pro forma adjusted fully distributed net income1 $44 $42 5% Non-GAAP pro forma adjusted fully distributed EPS1 $0.30 $0.29 1 For non-GAAP measures, see reconciliations to GAAP equivalents in Appendix. |
|
|
Pro forma net revenue: Supply Chain Services Performance Services Total pro forma net revenue $614 - $631M $231 - $238M $845 - $869M Non-GAAP pro forma adjusted EBITDA $335 - $355M Non-GAAP pro forma adjusted fully distributed EPS $1.20 - $1.29 FY14 guidance1 1 As of fiscal 2014 first-quarter conference call, 11/12/2013. For non-GAAP measures, see reconciliations to GAAP equivalents in Appendix. Pro forma guidance measures are “forward-looking statements.” For information regarding the use and limitations of non-GAAP financial measures and forward-looking statements, see “Forward-looking statements and Non-GAAP financial measures” at the front of this presentation. |
|
|
Transforming healthcare FROM THE INSIDE Unique customer alignment Data-driven, technology enabled Diversified growth engine Compelling financial profile |
|
|
Thank You 22 |

|
|
Appendix 23 |
|
|
Our business at a glance1 GPO Specialty pharmacy Direct sourcing SaaS informatics products Performance improvement collaboratives Advisory services Data management/ warehousing Supply Chain Performance Services Business Revenue Drivers FY 11-13 CAGR Fiscal 2014 Pro Forma Guidance2 Net Revenue 13% Segment Adjusted EBITDA 8% Net Revenue 14% Segment Adjusted EBITDA 22% Net Revenue 13% Adjusted EBITDA 10% Net Revenue 10% - 13% Net Revenue 12% - 16% Net Revenue 10% - 13% Adjusted EBITDA 7% - 13% Consolidated Administrative fees paid by suppliers Drug reimbursement Fee for service Product sales of contract manufactured items SaaS subscriptions Fee-for-service Fee-for-service SaaS subscriptions SaaS subscriptions Significant stickiness Strong visibility across diverse revenue streams 1 See Adjusted EBITDA reconciliation to GAAP equivalent in this Appendix. 2As of fiscal 2014 first-quarter conference call, 11-12- 2013. Pro forma guidance measures are “forward-looking statements.” For information regarding the use and limitations of such statements, see “Forward-looking statements and Non-GAAP financial measures” above. |
|
|
Our leadership team Susan DeVore, President and CEO 10 years Premier; 25 years Healthcare Cap Gemini Ernst & Young Mike Alkire, COO 10 years Premier; 20 years Healthcare Cap Gemini Ernst & Young Craig McKasson, CFO 16 years Premier; 20 years Healthcare Ernst & Young Jeff Lemkin, General Counsel 3 years Premier; 40+ years Healthcare McDermott Will & Emery Terry Linn, SVP Strategy 3 years Premier; 30+ years Healthcare Ernst & Young, American Medical International, Charter Medical Kelli Price, SVP People 13 years Premier; 15 years Healthcare Malcolm Baldrige National Quality Award Blair Childs, SVP Advocacy 6 years Premier; 25 years Healthcare AdvaMed Richard Bankowitz, CMO/Chief Scientist 6 years Premier; 25 years Healthcare CareScience, University HealthSystem Consortium Durral Gilbert, President, Supply Chain Services 7 years Premier; 7 years Healthcare BDS Management, Wachovia Securities Wes Champion, SVP, Performance Partners 6 years Premier; 22 years Healthcare Cap Gemini Ernst & Young, Accenture Gary Long, SVP, Chief of Sales <1 year Premier; 20 years Healthcare McKesson Andy Brailo, SVP, Member Field Services 12 years Premier; 20 years Healthcare Medibuy, Bard Keith Figlioli, SVP, Informatics 4 years Premier; 10 years Healthcare IT Eclipsys Chip Cater, SVP, Chief Marketing Officer <1 year Premier; 26 years Sales & Marketing Thomson Reuters |
|
|
Supply Chain Services at a glance Leadership position Integrated solutions differentiate supply chain New wins driving growth in “core” Solid and growing alternate site presence Strong historical growth with multiple growth drivers ~$40B of FY2013 volume – one of the leading acute care GPOs and supply chain platforms GPO utilization by approximately 2,000 hospitals, representing 40% of U.S. community hospitals Supply chain is part of total cost management solution Leverage data and collaboratives to identify and implement supply chain savings Strong net new purchasing volume growth in FY2013 Attractive year-over-year purchasing volume growth Own 50% of Innovatix, a leading alternate site GPO Hospital members diversifying into alternate care settings FY2011-2013 Segment Adjusted EBITDA CAGR of 8%1 Multiple opportunities to drive contract penetration Attractive returns on new wins; scalable platform Early stages of large market opportunities (specialty pharmacy and direct sourcing) 1 See Adjusted EBITDA reconciliation to GAAP equivalent in this Appendix |
|
|
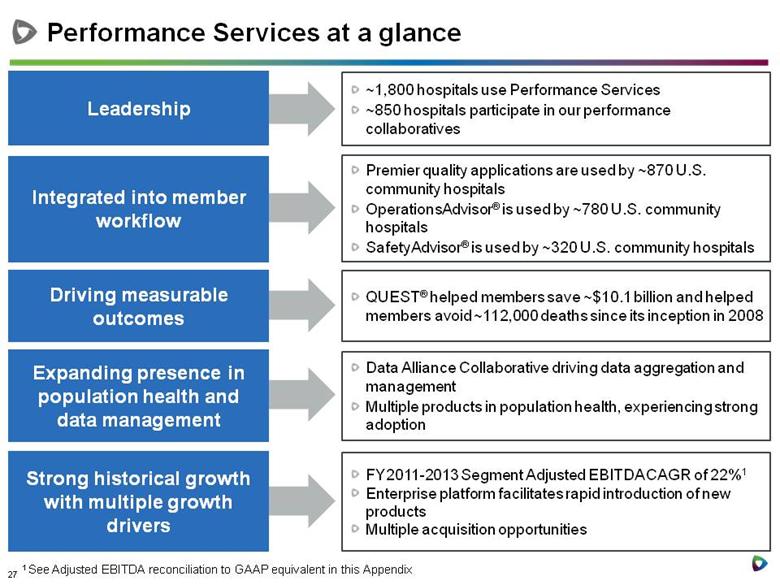
Performance Services at a glance ~1,800 hospitals use Performance Services ~850 hospitals participate in our performance collaboratives Leadership Integrated into member workflow Driving measurable outcomes Expanding presence in population health and data management Strong historical growth with multiple growth drivers Premier quality applications are used by ~870 U.S. community hospitals OperationsAdvisor® is used by ~780 U.S. community hospitals SafetyAdvisor® is used by ~320 U.S. community hospitals QUEST® helped members save ~$10.1 billion and helped members avoid ~112,000 deaths since its inception in 2008 Data Alliance Collaborative driving data aggregation and management Multiple products in population health, experiencing strong adoption FY2011-2013 Segment Adjusted EBITDA CAGR of 22%1 Enterprise platform facilitates rapid introduction of new products Multiple acquisition opportunities 1 See Adjusted EBITDA reconciliation to GAAP equivalent in this Appendix |
|
|
Fiscal 2013 Non-GAAP reconciliations (a) Represents interest income, net and realized gains and losses on our marketable securities (b) Represents legal, accounting and other expenses directly related to the Reorganization and this offering (c) Represents loss on disposal of property and equipment (d) Corporate consists of general and administrative corporate expenses that are not specific to either of our segments (e) Reflects the elimination of the noncontrolling interest in Premier LP as if all member owners of Premier LP had fully exchanged their Class B common units for shares of Class A common stock (f) Reflects income tax expense at an estimated effective income tax rate of 41% of income before income taxes assuming the conversion of all Class B units into shares of Class A common stock and the tax impact of excluding strategic and financial restructuring expenses ($ millions, FYE 6/30) FY2013A Adjusted Fully Distributed Net Income Reconciliation Pro Forma Net Income Attributable to PHSI $33.2 Add: Income Tax Expense 29.6 Add: Strategic and Financial Restructuring Expenses (b) 5.2 Add: Pro Forma Net Income Attributable to Premier LP (e) 218.5 Pro Forma Fully Distributed Income Before Income Taxes $286.4 (116.8) Pro Forma Adjusted Fully Distributed Net Income $169.6 Adjusted for: Income tax expense on pro forma fully distributed income before income taxes (f) |
|
|
Fiscal 2014 first-quarter Non-GAAP reconciliations Reconciliation of Adjusted EBITDA to Net Income and Operating Income: (Unaudited, in thousands) 2013 2012 2013 2012 Net income 112,726 $ 85,067 $ 65,268 $ 61,983 $ Interest and investment income, net (220) (224) (220) (224) Income tax expense 891 2,517 6,761 8,144 Depreciation and amortization 8,356 6,390 8,356 6,390 Amortization of purchased intangible assets 601 385 601 385 EBITDA 122,354 94,135 80,766 76,678 Stock-based compensation — — 325 — Acquisition related expenses 142 — 142 — Strategic and financial restructuring expenses 1,842 554 1,842 554 Gain on disposal of assets (4) — (4) — Adjusted EBITDA 124,334 $ 94,689 $ 83,071 $ 77,232 $ Adjusted EBITDA 124,334 $ 94,689 $ 83,071 $ 77,232 $ Depreciation and amortization (8,356) (6,390) (8,356) (6,390) Amortization of purchased intangible assets (601) (385) (601) (385) Stock-based compensation — — (325) — Acquisition related expenses (142) — (142) — Strategic and financial restructuring expenses (1,842) (554) (1,842) (554) Equity in net income of unconsolidated affiliates (4,114) (2,781) (4,114) (2,781) 109,279 84,579 67,691 67,122 Stock-based compensation in Premier, Inc. — — 325 — Pro forma adjustment for revenue share post-IPO — — 41,263 17,457 Operating income 109,279 $ 84,579 $ 109,279 $ 84,579 $ PHSI Pro forma - Premier, Inc. Three Months Ended September 30, |
|
|
Fiscal 2014 first-quarter Non-GAAP reconciliations Reconciliation of Non-GAAP Pro Forma Adjusted Fully Distributed Net Income: (Unaudited, in thousands) 2013 2012 Pro Forma Adjusted Fully Distributed Net Income: Net income attributable to Premier, Inc. shareholders 14,448 $ 13,890 $ Income tax expense 6,761 8,144 Stock-based compensation 325 — Acquisition related expenses 142 — Strategic and financial restructuring expenses 1,842 554 Net income attributable to noncontrolling interest in Premier LP 51,030 48,398 Pro forma adjusted fully distributed income before income taxes 74,548 70,986 Income tax expense on fully distributed income before income taxes 30,565 29,104 Pro forma adjusted fully distributed net income 43,983 $ 41,882 $ Weighted average fully distributed shares outstanding: Basic 144,983 144,983 Diluted 145,009 144,983 Non-GAAP earnings per share on pro forma adjusted fully distributed net income: Basic 0.30 $ 0.29 $ Diluted $ 0.30 $ 0.29 Pro forma - Premier, Inc. Three Months Ended September 30, |