Attached files
| file | filename |
|---|---|
| 8-K - 8-K - SERVICEMASTER CO, LLC | a14-1334_18k.htm |
Exhibit 99
|
|
TruGreen Spin-Off Presentation – January 7, 2014 |

|
|
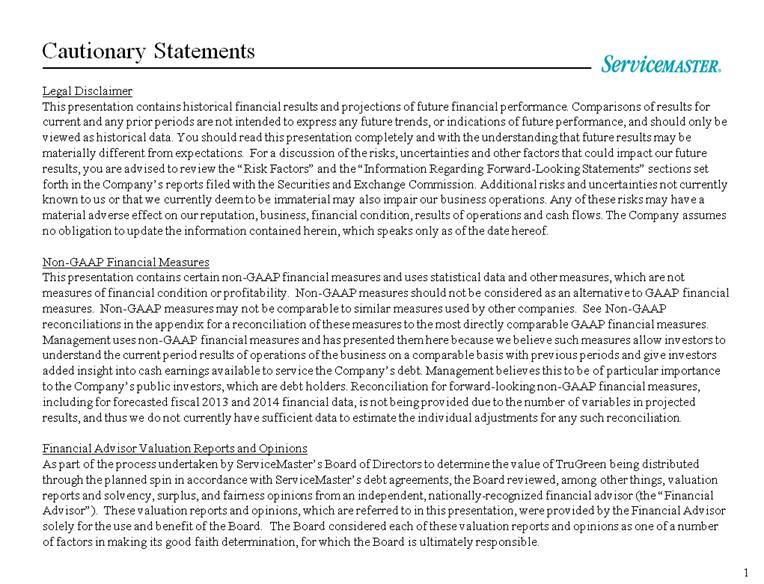
Cautionary Statements 1 Legal Disclaimer This presentation contains historical financial results and projections of future financial performance. Comparisons of results for current and any prior periods are not intended to express any future trends, or indications of future performance, and should only be viewed as historical data. You should read this presentation completely and with the understanding that future results may be materially different from expectations. For a discussion of the risks, uncertainties and other factors that could impact our future results, you are advised to review the “Risk Factors” and the “Information Regarding Forward-Looking Statements” sections set forth in the Company’s reports filed with the Securities and Exchange Commission. Additional risks and uncertainties not currently known to us or that we currently deem to be immaterial may also impair our business operations. Any of these risks may have a material adverse effect on our reputation, business, financial condition, results of operations and cash flows. The Company assumes no obligation to update the information contained herein, which speaks only as of the date hereof. Non-GAAP Financial Measures This presentation contains certain non-GAAP financial measures and uses statistical data and other measures, which are not measures of financial condition or profitability. Non-GAAP measures should not be considered as an alternative to GAAP financial measures. Non-GAAP measures may not be comparable to similar measures used by other companies. See Non-GAAP reconciliations in the appendix for a reconciliation of these measures to the most directly comparable GAAP financial measures. Management uses non-GAAP financial measures and has presented them here because we believe such measures allow investors to understand the current period results of operations of the business on a comparable basis with previous periods and give investors added insight into cash earnings available to service the Company’s debt. Management believes this to be of particular importance to the Company’s public investors, which are debt holders. Reconciliation for forward-looking non-GAAP financial measures, including for forecasted fiscal 2013 and 2014 financial data, is not being provided due to the number of variables in projected results, and thus we do not currently have sufficient data to estimate the individual adjustments for any such reconciliation. Financial Advisor Valuation Reports and Opinions As part of the process undertaken by ServiceMaster’s Board of Directors to determine the value of TruGreen being distributed through the planned spin in accordance with ServiceMaster’s debt agreements, the Board reviewed, among other things, valuation reports and solvency, surplus, and fairness opinions from an independent, nationally-recognized financial advisor (the “Financial Advisor”). These valuation reports and opinions, which are referred to in this presentation, were provided by the Financial Advisor solely for the use and benefit of the Board. The Board considered each of these valuation reports and opinions as one of a number of factors in making its good faith determination, for which the Board is ultimately responsible. |
|
|
Agenda Spin Objectives & Rationale Pre- and Post-Spin Performance Spin Process & Compliance Restricted Payment Thresholds TruGreen Valuation Range Summary 2 |
|
|
Spin Objectives Accelerate timing of IPO Position ServiceMaster against strong market multiples Use IPO proceeds to reduce debt Increase ServiceMaster management focus on Terminix, AHS, and the Franchise Services Group Provide TruGreen the time and focus to execute a sustainable turnaround ServiceMaster will benefit: Reduced volatility / seasonality of earnings Enhanced cash flow profile Spin is leverage neutral to ServiceMaster Honor all financing agreements and covenants 3 |
|
|
Spin Rationale 4 Unlike ServiceMaster’s other business segments, TruGreen experienced a significant downturn in recent years: Since 2010, TruGreen has lost nearly 500,000 customers (23%) Operating margins have eroded due to production inefficiencies, chemical costs, and inflationary pressures compounded by lower fixed cost leverage as falling customer counts drove revenue down Recovery may take several years and may not achieve historical performance levels, particularly given the need to repair customer confidence and reverse the 3-year downward trend in customer counts ServiceMaster incurred significant, successive, impairment charges in 2012 and 2013 of $1.6B to the book value of TruGreen’s goodwill and trade name, reflecting serial declines in actual and projected financial performance TruGreen’s 2013 Adjusted EBITDA and cash flow are projected to be negative TruGreen’s 2014 Adjusted EBITDA is projected to improve slightly, but cash flow is projected to be negligible TruGreen is an obstacle to the potential 2014 IPO of ServiceMaster Situational Assessment TruGreen Spin Enhances ServiceMaster’s ability for an IPO within one year Allows more intense management focus Spin is leverage neutral ServiceMaster’s earnings and cash flow will be less cyclical/more predictable Proceeds from ServiceMaster’s anticipated IPO would be used primarily to reduce debt Solution |

|
|
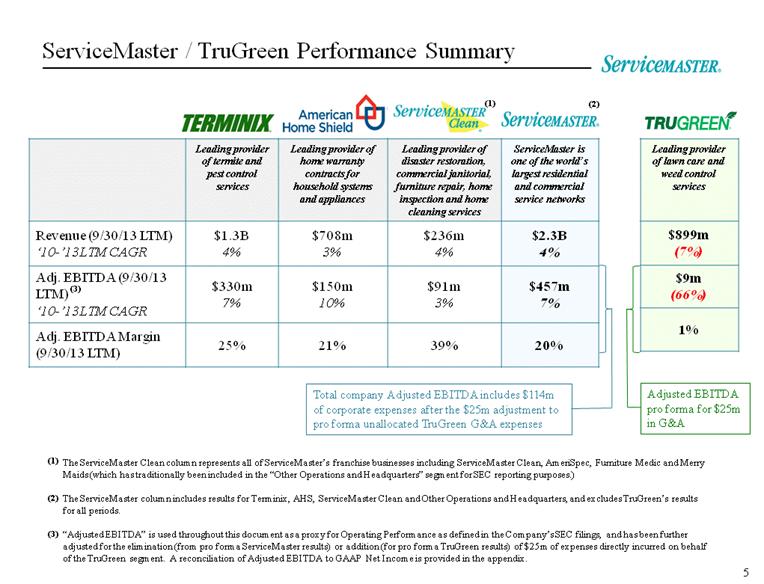
ServiceMaster / TruGreen Performance Summary Leading provider of termite and pest control services Leading provider of home warranty contracts for household systems and appliances Leading provider of disaster restoration, commercial janitorial, furniture repair, home inspection and home cleaning services ServiceMaster is one of the world’s largest residential and commercial service networks Revenue (9/30/13 LTM) ‘10-’13LTM CAGR $1.3B 4% $708m 3% $236m 4% $2.3B 4% Adj. EBITDA (9/30/13 LTM) ‘10-’13LTM CAGR $330m 7% $150m 10% $91m 3% $457m 7% Adj. EBITDA Margin (9/30/13 LTM) 25% 21% 39% 20% The ServiceMaster Clean column represents all of ServiceMaster’s franchise businesses including ServiceMaster Clean, AmeriSpec, Furniture Medic and Merry Maids (which has traditionally been included in the “Other Operations and Headquarters” segment for SEC reporting purposes.) The ServiceMaster column includes results for Terminix, AHS, ServiceMaster Clean and Other Operations and Headquarters, and excludes TruGreen’s results for all periods. “Adjusted EBITDA” is used throughout this document as a proxy for Operating Performance as defined in the Company’s SEC filings, and has been further adjusted for the elimination (from pro forma ServiceMaster results) or addition (for pro forma TruGreen results) of $25m of expenses directly incurred on behalf of the TruGreen segment. A reconciliation of Adjusted EBITDA to GAAP Net Income is provided in the appendix. Total company Adjusted EBITDA includes $114m of corporate expenses after the $25m adjustment to pro forma unallocated TruGreen G&A expenses Leading provider of lawn care and weed control services $899m (7%) $9m (66%) 1% Adjusted EBITDA pro forma for $25m in G&A 5 (1) (1) (2) (2) (3) (3) |
|
|
ServiceMaster Portfolio Pro Forma Results (1) Excludes TruGreen’s results for all periods. (2) Adjusted EBITDA includes $25m reallocation of corporate costs to TruGreen for all periods. (3)Cash contribution = Adjusted EBITDA – (CapEx + Acquisition Payments + Capital Lease Payments) 3% 2% 5% 4% 4% 4% $ millions (% of Adjusted EBITDA) $ billions 2010 – 2013LTM CAGR 4% $ millions 2010 – 2013LTM CAGR 7% (% of Revenue) 19% 20% 20% 20% 73% 78% 79% 3% 2% 5% 5% 4% 4% 6% 6 78% Thousands |
|
|
7 17% 20% 19% 20% 21% 20% (1)Adjusted EBITDA as reported is dark green. Lighter green bars indicate pro forma allocation of direct G&A expenses not reported within TruGreen segment (and held in BSC/Other). (2)Cash contribution = Adjusted EBITDA – (CapEx + Acquisition Payments + Capital Lease Payments) 3% 2% 5% 4% 4% 4% 80% 89% 76% 80% 70% 81% $ millions $ millions 3% 2% 5% 5% 4% 4% 6% Thousands TruGreen Reported & Pro Forma Results 483k decline (22%) |
|
|
TruGreen Spin Process Evaluation of financing agreements for covenant restrictions Receipt and review of TruGreen valuation from an independent, nationally-recognized financial advisor (the “Financial Advisor”) Financial Advisor recommended a valuation range of approximately $352m to $402m Conclusive determination in good faith of the valuation of TruGreen by ServiceMaster’s Board of Directors, after a thorough process, of $399m, at the high end of the Financial Advisor’s range Identification and development of transition services agreements for ServiceMaster to provide support to TruGreen while establishing independence Solicitation of Private Letter Ruling from IRS for qualifying tax-free spin Review of liquidity, and receipt and review of solvency, surplus, and fairness opinions from the Financial Advisor 8 |
|
|
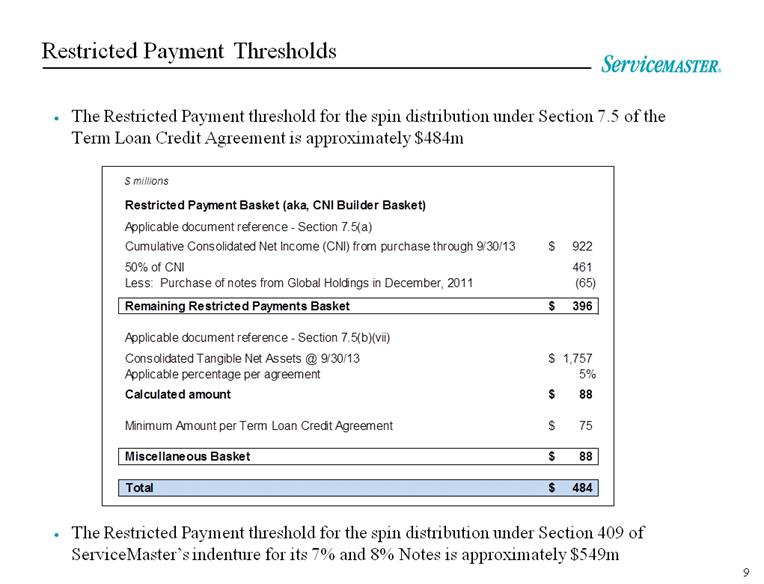
Restricted Payment Thresholds The Restricted Payment threshold for the spin distribution under Section 7.5 of the Term Loan Credit Agreement is approximately $484m The Restricted Payment threshold for the spin distribution under Section 409 of ServiceMaster’s indenture for its 7% and 8% Notes is approximately $549m 9 $ millions Restricted Payment Basket (aka, CNI Builder Basket) Applicable document reference - Section 7.5(a) Cumulative Consolidated Net Income (CNI) from purchase through 9/30/13 922 $ 50% of CNI 461 Less: Purchase of notes from Global Holdings in December, 2011 (65) Remaining Restricted Payments Basket 396 $ Applicable document reference - Section 7.5(b)(vii) Consolidated Tangible Net Assets @ 9/30/13 1,757 $ Applicable percentage per agreement 5% Calculated amount 88 $ Minimum Amount per Term Loan Credit Agreement 75 $ Miscellaneous Basket 88 $ Total 484 $ |
|
|
The Spin is Well Below Restricted Payment Thresholds 10 Section 7.5(a)(3) of the Term Loan Credit Agreement provides that if a dividend is “other than in cash,” as is the case for the proposed dividend, then the amount of that non-cash dividend is “to be as determined in good faith by [ServiceMaster’s] Board of Directors, whose determination shall be conclusive . . . .” The Board determined in good faith that the value of TruGreen to be distributed through the proposed dividend is $399m, at the high end of the range calculated by the Financial Advisor, and approximately $85m below the Term Loan Restricted Payment threshold for the spin-off distribution Financial Advisor Valuation Range $352m – $402m Board Valuation $399m Term Loan Restricted Payment Threshold $484m Difference Between Term Loan Threshold and Board Valuation $85m |

|
|
ServiceMaster Will Continue to Be Solvent The Board received from the Financial Advisor: a solvency and capital surplus analysis a solvency opinion concluding that ServiceMaster is and will remain solvent after giving effect to the spin a capital surplus opinion The Board also received verification statements from ServiceMaster’s CFO as to the existence of sufficient surplus to make the distribution and as to the solvency of ServiceMaster ServiceMaster’s leverage ratio, both before and after the spin, is projected to be approximately 7.6x 11 |
|
|
Summary TruGreen spin is prudent and in the best interest of all ServiceMaster stakeholders Thorough process was followed for spin Leading market segment positions and iconic brands Proven and consistent business model Compelling top- and bottom-line growth initiatives Excellent cash flow profile Strong customer retention rates The spin-off enhances timing for the ServiceMaster IPO, which is planned for 2014, subject to market conditions and performance 12 |

|
|
13 Appendix |

|
|
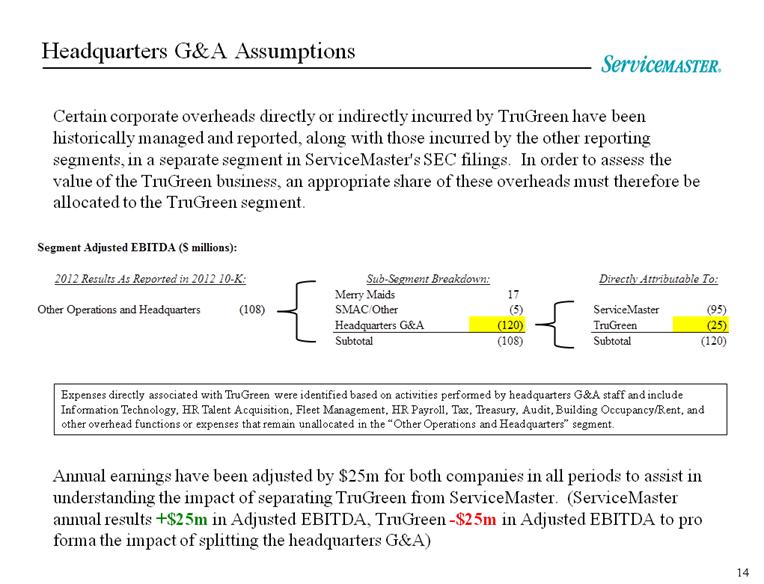
Headquarters G&A Assumptions Certain corporate overheads directly or indirectly incurred by TruGreen have been historically managed and reported, along with those incurred by the other reporting segments, in a separate segment in ServiceMaster's SEC filings. In order to assess the value of the TruGreen business, an appropriate share of these overheads must therefore be allocated to the TruGreen segment. 14 Annual earnings have been adjusted by $25m for both companies in all periods to assist in understanding the impact of separating TruGreen from ServiceMaster. (ServiceMaster annual results +$25m in Adjusted EBITDA, TruGreen -$25m in Adjusted EBITDA to pro forma the impact of splitting the headquarters G&A) Expenses directly associated with TruGreen were identified based on activities performed by headquarters G&A staff and include Information Technology, HR Talent Acquisition, Fleet Management, HR Payroll, Tax, Treasury, Audit, Building Occupancy/Rent, and other overhead functions or expenses that remain unallocated in the “Other Operations and Headquarters” segment. Segment Adjusted EBITDA ($ millions): Merry Maids 17 Other Operations and Headquarters (108) SMAC/Other (5) ServiceMaster (95) Headquarters G&A (120) TruGreen (25) Subtotal (108) Subtotal (120) 2012 Results As Reported in 2012 10-K: Sub-Segment Breakdown: Directly Attributable To: |
|
|
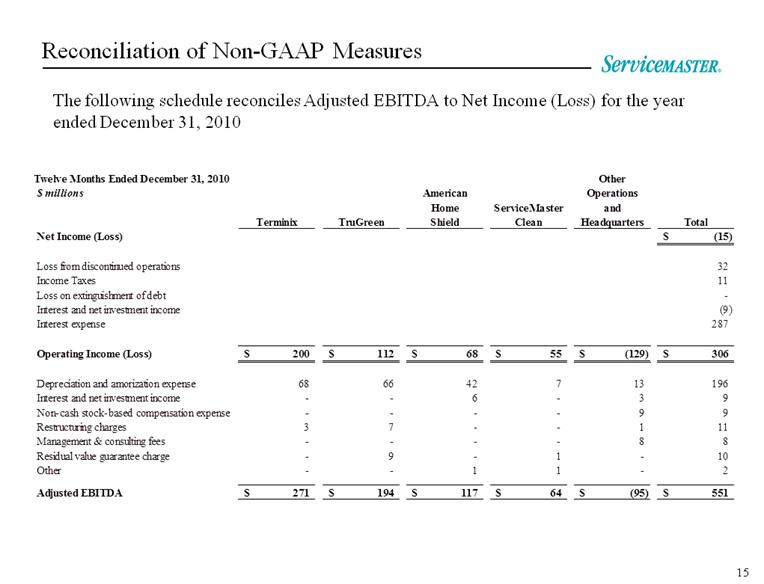
Reconciliation of Non-GAAP Measures The following schedule reconciles Adjusted EBITDA to Net Income (Loss) for the year ended December 31, 2010 15 Twelve Months Ended December 31, 2010 Other $ millions American Operations Home ServiceMaster and Terminix TruGreen Shield Clean Headquarters Total Net Income (Loss) (15) $ Loss from discontinued operations 32 Income Taxes 11 Loss on extinguishment of debt - Interest and net investment income (9) Interest expense 287 Operating Income (Loss) 200 $ 112 $ 68 $ 55 $ (129) $ 306 $ Depreciation and amorization expense 68 66 42 7 13 196 Interest and net investment income - - 6 - 3 9 Non-cash stock-based compensation expense - - - - 9 9 Restructuring charges 3 7 - - 1 11 Management & consulting fees - - - - 8 8 Residual value guarantee charge - 9 - 1 - 10 Other - - 1 1 - 2 Adjusted EBITDA 271 $ 194 $ 117 $ 64 $ (95) $ 551 $ |
|
|
Reconciliation of Non-GAAP Measures The following schedule reconciles Adjusted EBITDA to Net Income (Loss) for the year ended December 31, 2011 16 Twelve Months Ended December 31, 2011 Other $ millions American Operations Home ServiceMaster and Terminix TruGreen Shield Clean Headquarters Total Net Income (Loss) 41 $ Loss from discontinued operations 27 Income Taxes 44 Loss on extinguishment of debt 1 Interest and net investment income (11) Interest expense 273 Other 1 Operating Income (Loss) 221 $ 129 $ 95 $ 58 $ (127) $ 376 $ Depreciation and amorization expense 75 42 27 6 13 163 Interest and net investment income - - 10 - 1 11 Non-cash trade name impairment - 37 - - - 37 Non-cash stock-based compensation expense - - - - 8 8 Restructuring charges 4 1 - - 3 8 Management & consulting fees - - - - 8 8 Other (1) - - - - (1) Adjusted EBITDA 299 $ 209 $ 132 $ 64 $ (94) $ 610 $ |

|
|
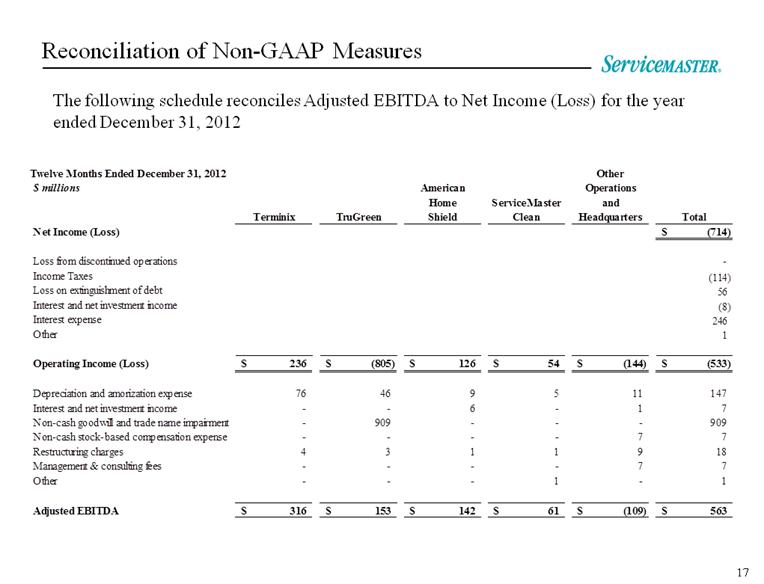
Reconciliation of Non-GAAP Measures The following schedule reconciles Adjusted EBITDA to Net Income (Loss) for the year ended December 31, 2012 17 Twelve Months Ended December 31, 2012 Other $ millions American Operations Home ServiceMaster and Terminix TruGreen Shield Clean Headquarters Total Net Income (Loss) (714) $ Loss from discontinued operations - Income Taxes (114) Loss on extinguishment of debt 56 Interest and net investment income (8) Interest expense 246 Other 1 Operating Income (Loss) 236 $ (805) $ 126 $ 54 $ (144) $ (533) $ Depreciation and amorization expense 76 46 9 5 11 147 Interest and net investment income - - 6 - 1 7 Non-cash goodwill and trade name impairment - 909 - - - 909 Non-cash stock-based compensation expense - - - - 7 7 Restructuring charges 4 3 1 1 9 18 Management & consulting fees - - - - 7 7 Other - - - 1 - 1 Adjusted EBITDA 316 $ 153 $ 142 $ 61 $ (109) $ 563 $ |
|
|
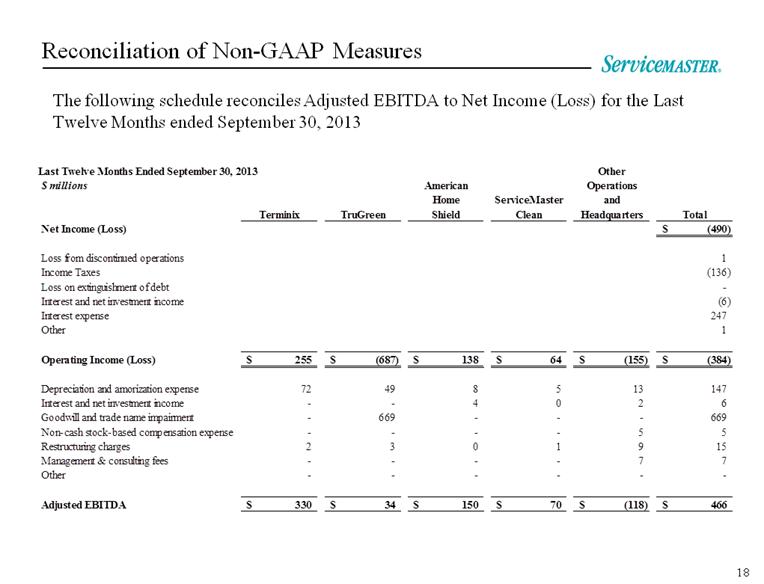
Reconciliation of Non-GAAP Measures The following schedule reconciles Adjusted EBITDA to Net Income (Loss) for the Last Twelve Months ended September 30, 2013 18 Last Twelve Months Ended September 30, 2013 Other $ millions American Operations Home ServiceMaster and Terminix TruGreen Shield Clean Headquarters Total Net Income (Loss) (490) $ Loss from discontinued operations 1 Income Taxes (136) Loss on extinguishment of debt - Interest and net investment income (6) Interest expense 247 Other 1 Operating Income (Loss) 255 $ (687) $ 138 $ 64 $ (155) $ (384) $ Depreciation and amorization expense 72 49 8 5 13 147 Interest and net investment income - - 4 0 2 6 Goodwill and trade name impairment - 669 - - - 669 Non-cash stock-based compensation expense - - - - 5 5 Restructuring charges 2 3 0 1 9 15 Management & consulting fees - - - - 7 7 Other - - - - - - Adjusted EBITDA 330 $ 34 $ 150 $ 70 $ (118) $ 466 $ |