Attached files
| file | filename |
|---|---|
| 8-K - FORM 8-K - Argo Group International Holdings, Ltd. | d646660d8k.htm |
Exhibit 99.1
| 3Q 2013 Investor Presentation December 2013 |
| Forward-Looking Statements This presentation contains "forward-looking statements" which are made pursuant to the safe harbor provisions of the Private Securities Litigation Reform Act of 1995. The forward-looking statements are based on the Company's current expectations and beliefs concerning future developments and their potential effects on the Company. There can be no assurance that actual developments will be those anticipated by the Company. Actual results may differ materially from those projected as a result of significant risks and uncertainties, including non-receipt of the expected payments, changes in interest rates, effect of the performance of financial markets on investment income and fair values of investments, development of claims and the effect on loss reserves, accuracy in projecting loss reserves, the impact of competition and pricing environments, changes in the demand for the Company's products, the effect of general economic conditions, adverse state and federal legislation, regulations and regulatory investigations into industry practices, developments relating to existing agreements, heightened competition, changes in pricing environments, and changes in asset valuations. The Company undertakes no obligation to publicly update any forward-looking statements as a result of events or developments subsequent to the presentation. 2. |
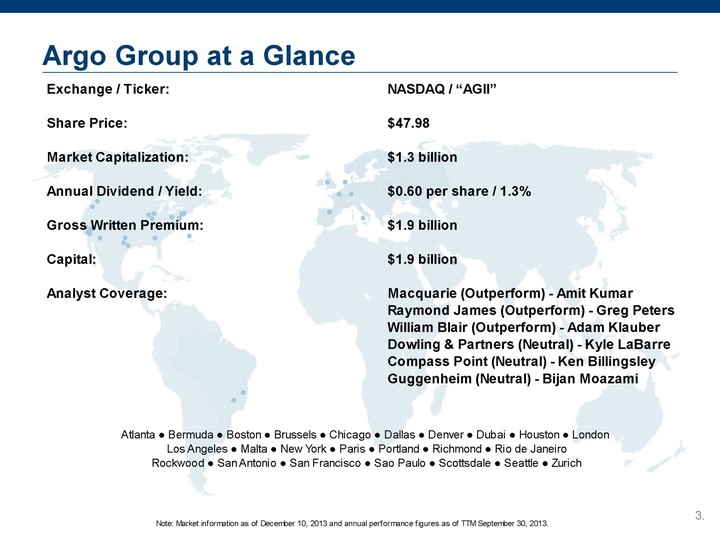
| Argo Group at a Glance |
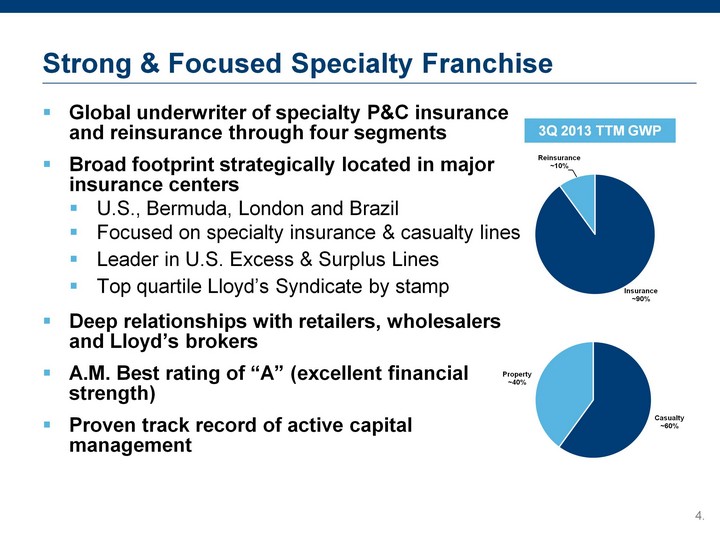
| Strong & Focused Specialty Franchise Global underwriter of specialty P&C insurance and reinsurance through four segments Broad footprint strategically located in major insurance centers U.S., Bermuda, London and Brazil Focused on specialty insurance & casualty lines Leader in U.S. Excess & Surplus Lines Top quartile Lloyd's Syndicate by stamp Deep relationships with retailers, wholesalers and Lloyd's brokers A.M. Best rating of "A" (excellent financial strength) Proven track record of active capital management 3Q 2013 TTM GWP (CHART) (CHART) |
| Maximize shareholder value through growth in book value per share Strategy Aligned Toward Shareholder Value Sustain competitive advantage through superior customer service, product innovation and underwriting knowledge Opportunistically grow organically and/or through strategic acquisitions throughout the underwriting cycle Manage capital and risk appropriately / maintain strong ratings Proven ability to attract talent 5. |
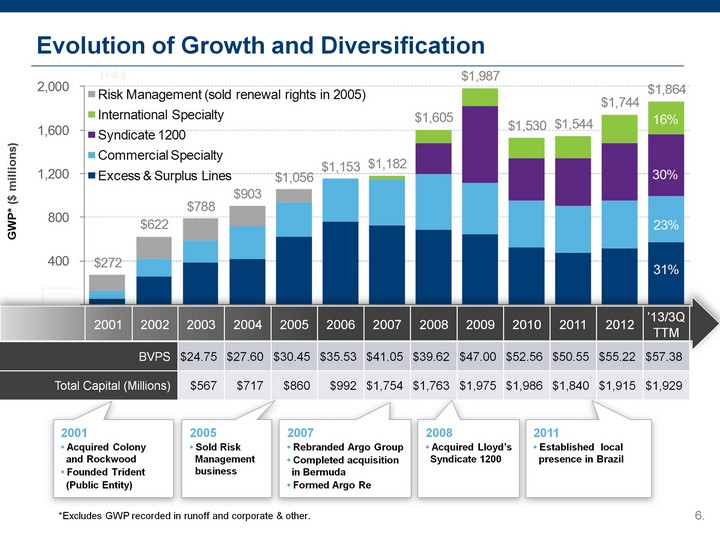
| Evolution of Growth and Diversification $23.03 $501.1M $30.36 $716.8M $992.0M $54.85 $1,844.7M 2001 2002 2003 2004 2005 2006 2007 2008 2009 2010 2011 2012 '13/3QTTM BVPS BVPS BVPS $24.75 $27.60 $30.45 $35.53 $41.05 $39.62 $47.00 $52.56 $50.55 $55.22 $57.38 Total Capital (Millions) Total Capital (Millions) Total Capital (Millions) $567 $717 $860 $992 $1,754 $1,763 $1,975 $1,986 $1,840 $1,915 $1,929 2001 • Acquired Colony and Rockwood • Founded Trident (Public Entity) 2005 • Sold Risk Management business 2007 • Rebranded Argo Group • Completed acquisition in Bermuda • Formed Argo Re 2008 • Acquired Lloyd's Syndicate 1200 2011 • Established local presence in Brazil 6. *Excludes GWP recorded in runoff and corporate & other. |
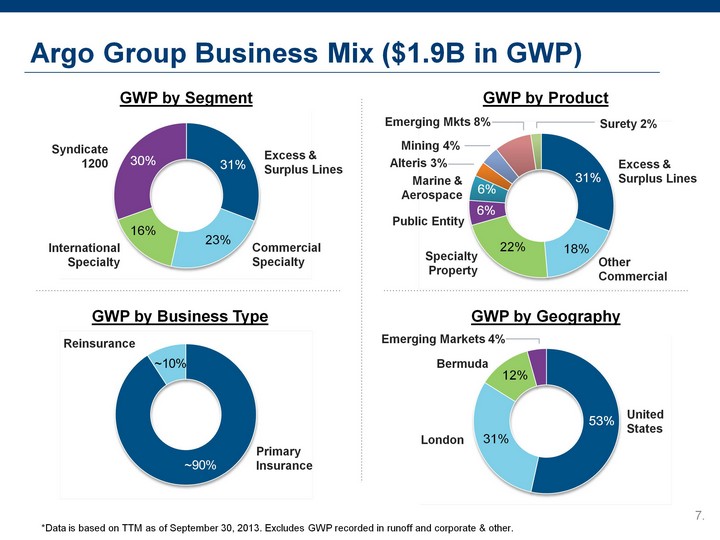
| Argo Group Business Mix ($1.9B in GWP) 7. GWP by Segment Excess & Surplus Lines Commercial Specialty Syndicate 1200 International Specialty 30% 16% 31% GWP by Product GWP by Geography United States London Bermuda *Data is based on TTM as of September 30, 2013. Excludes GWP recorded in runoff and corporate & other. 23% 18% Excess & Surplus Lines 31% Other Commercial Specialty Property Public Entity 22% 6% 6% Marine & Aerospace Surety 2% Alteris 3% Mining 4% Emerging Mkts 8% Emerging Markets 4% 53% 12% 31% GWP by Business Type Primary Insurance Reinsurance |
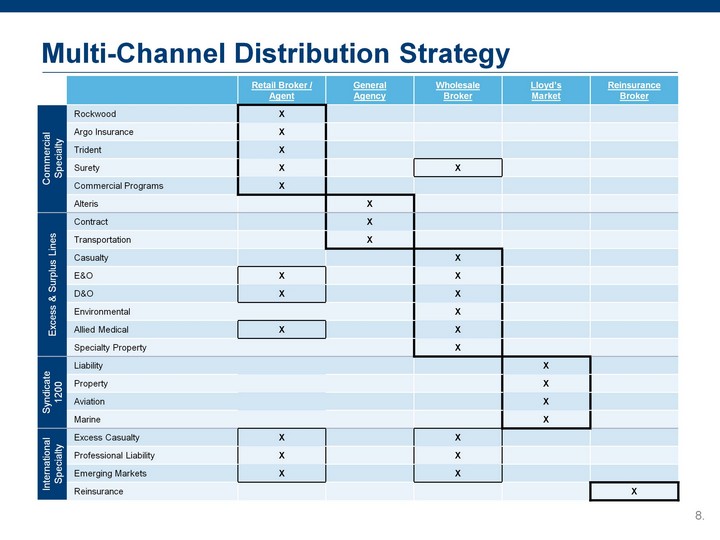
| Multi-Channel Distribution Strategy Retail Broker / Agent General Agency Wholesale Broker Lloyd's Market Reinsurance Broker Commercial Specialty Rockwood X Commercial Specialty Argo Insurance X Commercial Specialty Trident X Commercial Specialty Surety X X Commercial Specialty Commercial Programs X Commercial Specialty Alteris X Excess & Surplus Lines Contract X Excess & Surplus Lines Transportation X Excess & Surplus Lines Casualty X Excess & Surplus Lines E&O X X Excess & Surplus Lines D&O X X Excess & Surplus Lines Environmental X Excess & Surplus Lines Allied Medical X X Excess & Surplus Lines Specialty Property X Syndicate 1200 Liability X Syndicate 1200 Property X Syndicate 1200 Aviation X Syndicate 1200 Marine X International Specialty Excess Casualty X X International Specialty Professional Liability X X International Specialty Emerging Markets X X International Specialty Reinsurance X |
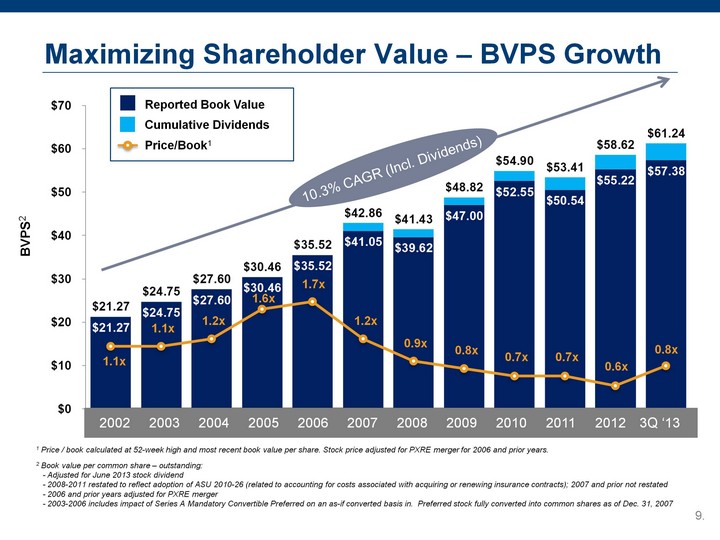
| (CHART) Maximizing Shareholder Value - BVPS Growth 1 Price / book calculated at 52-week high and most recent book value per share. Stock price adjusted for PXRE merger for 2006 and prior years. 2 Book value per common share - outstanding: - Adjusted for June 2013 stock dividend - 2008-2011 restated to reflect adoption of ASU 2010-26 (related to accounting for costs associated with acquiring or renewing insurance contracts); 2007 and prior not restated - 2006 and prior years adjusted for PXRE merger - 2003-2006 includes impact of Series A Mandatory Convertible Preferred on an as-if converted basis in. Preferred stock fully converted into common shares as of Dec. 31, 2007 10.3% CAGR (Incl. Dividends) 1.1x 1.1x 1.2x 1.6x 1.7x 1.2x 0.9x 0.8x 0.7x 0.6x BVPS2 9. 0.7x 0.8x 2008 2009 2010 2011 2006 2007 2005 2004 2003 2002 3Q '13 2012 Reported Book Value Cumulative Dividends Price/Book1 |
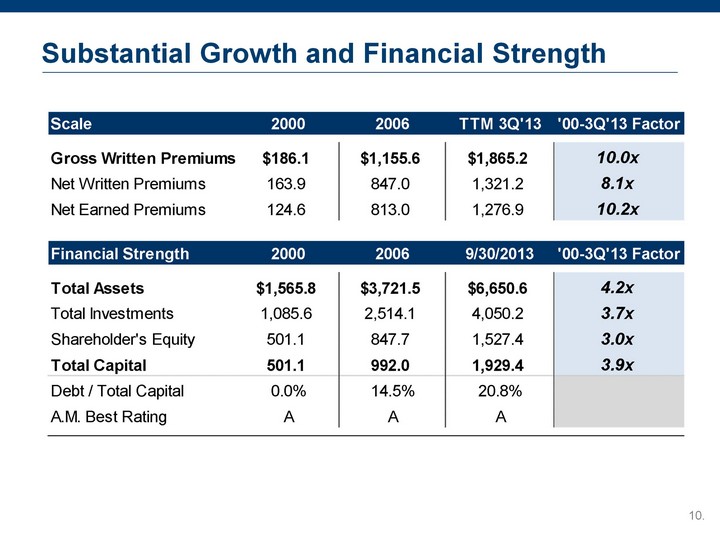
| Substantial Growth and Financial Strength |
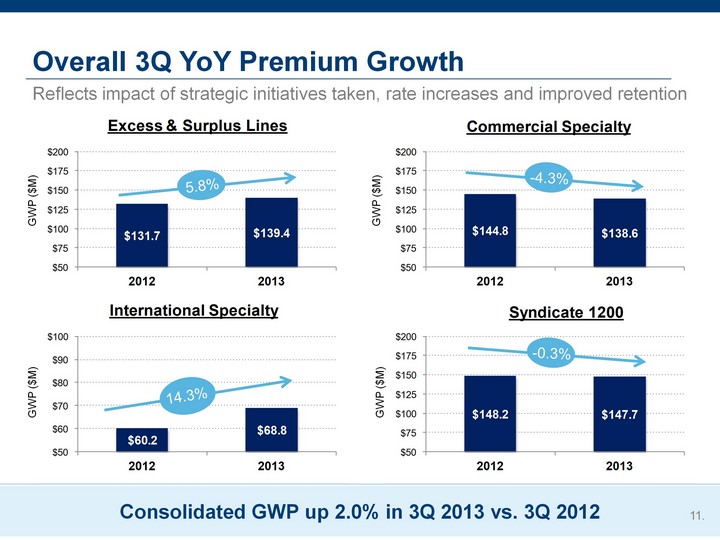
| Consolidated GWP up 2.0% in 3Q 2013 vs. 3Q 2012 Overall 3Q YoY Premium Growth Reflects impact of strategic initiatives taken, rate increases and improved retention GWP ($M) GWP ($M) -4.3% GWP ($M) GWP ($M) 11. 14.3% 5.8% -0.3% |
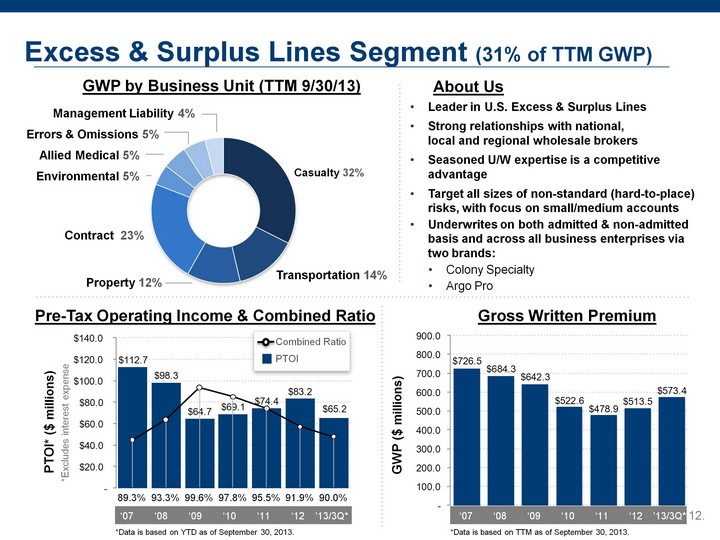
| About Us Leader in U.S. Excess & Surplus Lines Strong relationships with national, local and regional wholesale brokers Seasoned U/W expertise is a competitive advantage Target all sizes of non-standard (hard-to-place) risks, with focus on small/medium accounts Underwrites on both admitted & non-admitted basis and across all business enterprises via two brands: Colony Specialty Argo Pro GWP by Business Unit (TTM 9/30/13) Casualty 32% Transportation 14% Environmental 5% Allied Medical 5% Management Liability 4% Property 12% Contract 23% Errors & Omissions 5% Excess & Surplus Lines Segment (31% of TTM GWP) 12. GWP ($ millions) PTOI* ($ millions) *Excludes interest expense Combined Ratio PTOI 99.6% 97.8% 95.5% 91.9% 93.3% 89.3% '13/3Q* '11 '10 '09 '08 '07 '12 90.0% Gross Written Premium Pre-Tax Operating Income & Combined Ratio '13/3Q* '11 '10 '09 '08 '07 '12 *Data is based on TTM as of September 30, 2013. *Data is based on YTD as of September 30, 2013. |
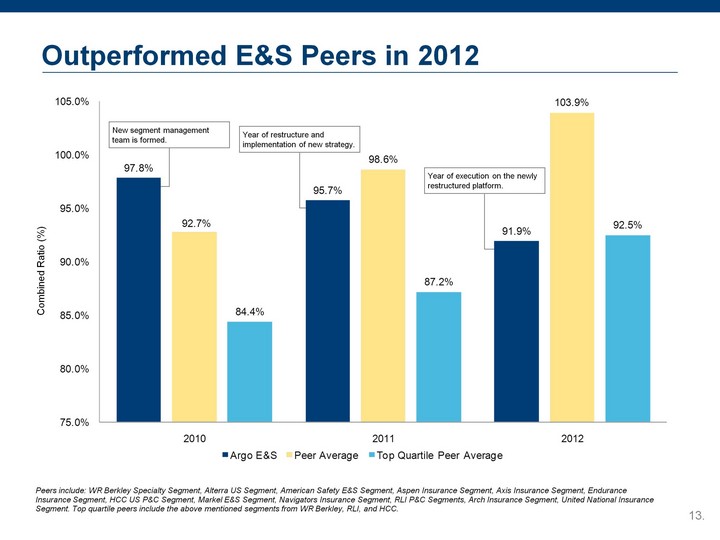
| Outperformed E&S Peers in 2012 Peers include: WR Berkley Specialty Segment, Alterra US Segment, American Safety E&S Segment, Aspen Insurance Segment, Axis Insurance Segment, Endurance Insurance Segment, HCC US P&C Segment, Markel E&S Segment, Navigators Insurance Segment, RLI P&C Segments, Arch Insurance Segment, United National Insurance Segment. Top quartile peers include the above mentioned segments from WR Berkley, RLI, and HCC. New segment management team is formed. Year of restructure and implementation of new strategy. Year of execution on the newly restructured platform. Combined Ratio (%) |
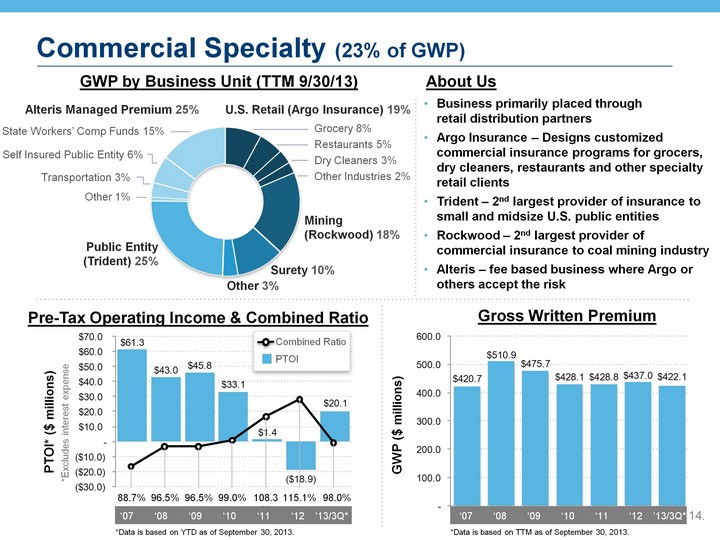
| Commercial Specialty (23% of GWP) About Us Business primarily placed through retail distribution partners Argo Insurance - Designs customized commercial insurance programs for grocers, dry cleaners, restaurants and other specialty retail clients Trident - 2nd largest provider of insurance to small and midsize U.S. public entities Rockwood - 2nd largest provider of commercial insurance to coal mining industry Alteris - fee based business where Argo or others accept the risk GWP ($ millions) PTOI* ($ millions) *Excludes interest expense 96.5% 99.0% 108.3 % 115.1% 96.5% 88.7% 98.0% Gross Written Premium Pre-Tax Operating Income & Combined Ratio Combined Ratio PTOI '13/3Q* '11 '10 '09 '08 '07 '12 '13/3Q* '11 '10 '09 '08 '07 '12 GWP by Business Unit (TTM 9/30/13) U.S. Retail (Argo Insurance) 19% Restaurants 5% Grocery 8% Dry Cleaners 3% Other Industries 2% Public Entity (Trident) 25% Surety 10% Mining (Rockwood) 18% Other 3% Alteris Managed Premium 25% Other 1% Transportation 3% State Workers' Comp Funds 15% Self Insured Public Entity 6% *Data is based on TTM as of September 30, 2013. *Data is based on YTD as of September 30, 2013. |
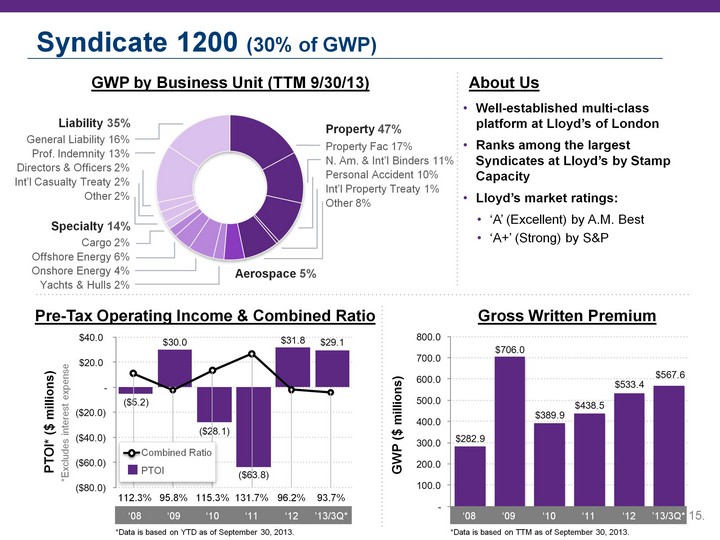
| General Liability 16% Prof. Indemnity 13% Directors & Officers 2% Int'l Casualty Treaty 2% Other 2% Syndicate 1200 (30% of GWP) About Us Well-established multi-class platform at Lloyd's of London Ranks among the largest Syndicates at Lloyd's by Stamp Capacity Lloyd's market ratings: 'A' (Excellent) by A.M. Best 'A+' (Strong) by S&P GWP by Business Unit (TTM 9/30/13) Property 47% Liability 35% Specialty 14% Aerospace 5% Property Fac 17% N. Am. & Int'l Binders 11% Personal Accident 10% Int'l Property Treaty 1% Other 8% 15. GWP ($ millions) PTOI* ($ millions) *Excludes interest expense 115.3% 131.7% 95.8% 112.3% '12 '10 '09 '08 '11 96.2% Gross Written Premium Pre-Tax Operating Income & Combined Ratio '12 '10 '09 '08 '11 Combined Ratio PTOI 93.7% '13/3Q* '13/3Q* Cargo 2% Offshore Energy 6% Onshore Energy 4% Yachts & Hulls 2% *Data is based on TTM as of September 30, 2013. *Data is based on YTD as of September 30, 2013. |
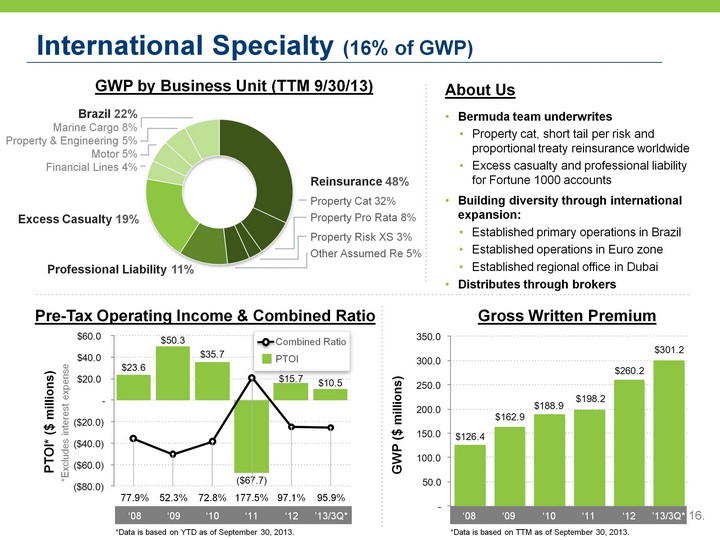
| International Specialty (16% of GWP) About Us Bermuda team underwrites Property cat, short tail per risk and proportional treaty reinsurance worldwide Excess casualty and professional liability for Fortune 1000 accounts Building diversity through international expansion: Established primary operations in Brazil Established operations in Euro zone Established regional office in Dubai Distributes through brokers 16. GWP ($ millions) PTOI* ($ millions) *Excludes interest expense Gross Written Premium Pre-Tax Operating Income & Combined Ratio GWP by Business Unit (TTM 9/30/13) Excess Casualty 19% Professional Liability 11% Brazil 22% Marine Cargo 8% Property & Engineering 5% Motor 5% Financial Lines 4% '12 '10 '09 '08 '11 '13/3Q* '12 '10 '09 '08 '11 '13/3Q* 72.8% 177.5% 52.3% 77.9% 97.1% 95.9% Combined Ratio PTOI Reinsurance 48% Other Assumed Re 5% Property Risk XS 3% Property Pro Rata 8% Property Cat 32% *Data is based on TTM as of September 30, 2013. *Data is based on YTD as of September 30, 2013. |
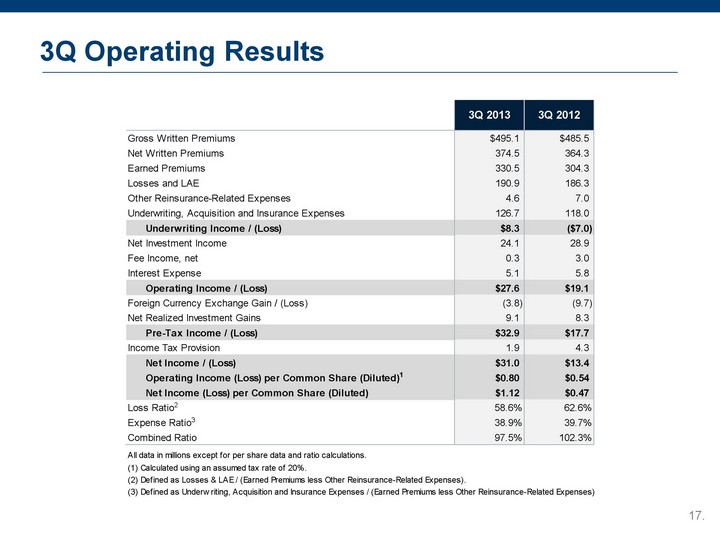
| 3Q Operating Results 17. |
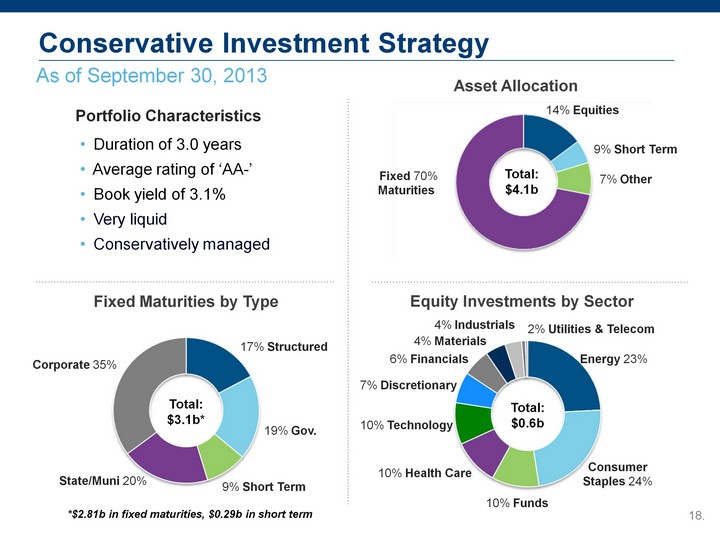
| 18. As of September 30, 2013 Conservative Investment Strategy 17% 18. Portfolio Characteristics Duration of 3.0 years Average rating of 'AA-' Book yield of 3.1% Very liquid Conservatively managed Total: $4.1b Equity Investments by Sector 10% Health Care Energy 23% 6% Financials 4% Industrials 10% Technology 10% Funds 4% Materials 7% Discretionary Consumer Staples 24% Total: $0.6b 2% Utilities & Telecom Fixed Maturities by Type 9% Short Term Corporate 35%. 19% Gov. 17% Structured State/Muni 20%. Total: $3.1b* *$2.81b in fixed maturities, $0.29b in short term |
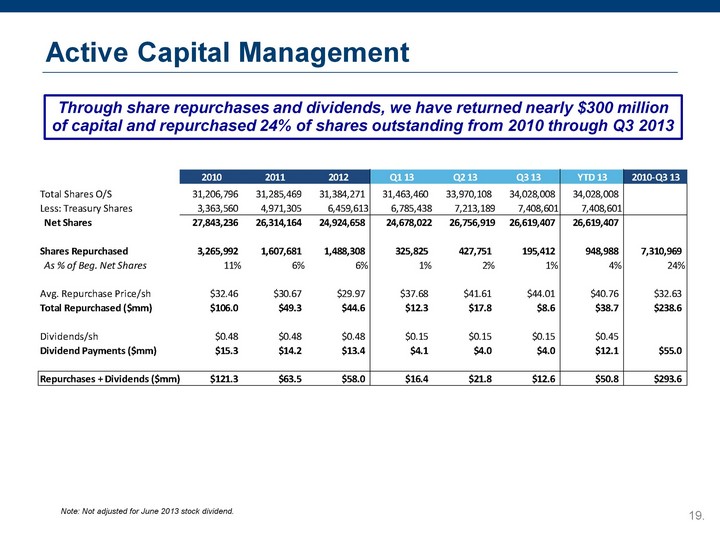
| Active Capital Management Through share repurchases and dividends, we have returned nearly $300 million of capital and repurchased 24% of shares outstanding from 2010 through Q3 2013 Note: Not adjusted for June 2013 stock dividend. |
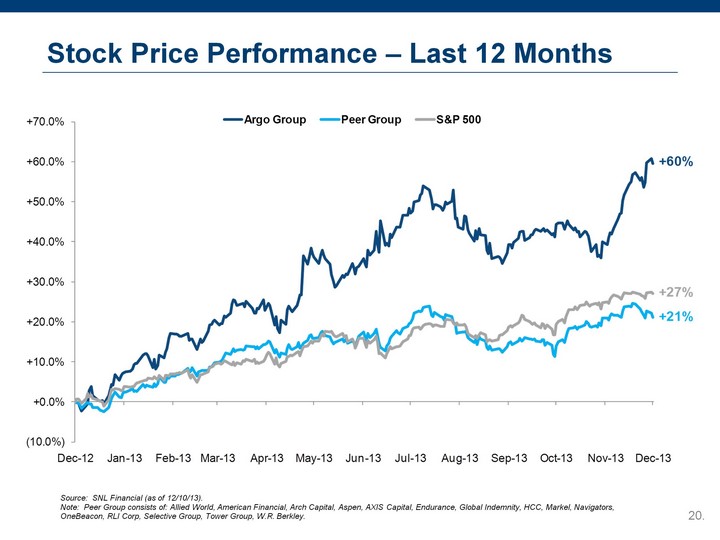
| Stock Price Performance - Last 12 Months Source: SNL Financial (as of 12/10/13). Note: Peer Group consists of: Allied World, American Financial, Arch Capital, Aspen, AXIS Capital, Endurance, Global Indemnity, HCC, Markel, Navigators, OneBeacon, RLI Corp, Selective Group, Tower Group, W.R. Berkley. |

| Compelling Valuation vs. Peer Group 0.84x 1.19x 0.35x Difference Source: SNL Financial (as of 12/10/13). Note: Price to book is average price/book across all peer companies. Peer Group consists of: Allied World, American Financial, Arch Capital, Aspen, AXIS Capital, Endurance, Global Indemnity, HCC, Markel, Navigators, OneBeacon, RLI Corp, Selective Group, Tower Group, W.R. Berkley. |
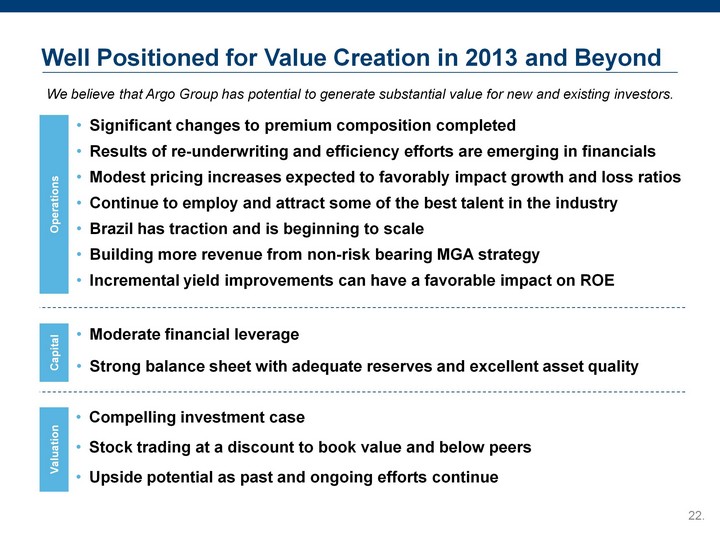
| Well Positioned for Value Creation in 2013 and Beyond Valuation Compelling investment case Stock trading at a discount to book value and below peers Upside potential as past and ongoing efforts continue We believe that Argo Group has potential to generate substantial value for new and existing investors. Operations Significant changes to premium composition completed Results of re-underwriting and efficiency efforts are emerging in financials Modest pricing increases expected to favorably impact growth and loss ratios Continue to employ and attract some of the best talent in the industry Brazil has traction and is beginning to scale Building more revenue from non-risk bearing MGA strategy Incremental yield improvements can have a favorable impact on ROE Capital Moderate financial leverage Strong balance sheet with adequate reserves and excellent asset quality |