Attached files
| file | filename |
|---|---|
| 8-K/A - 8-K/A - HD Supply Holdings, Inc. | a13-25965_18ka.htm |
| EX-99.1 - EX-99.1 - HD Supply Holdings, Inc. | a13-25965_1ex99d1.htm |
Exhibit 99.2
|
|
2013 Third-Quarter Performance December 10, 2013 Financial Results and Company Highlights |

|
|
Disclaimers Forward-Looking Statements This presentation includes “forward-looking statements” within the meaning of Section 27A of the Securities Act and Section 21E of the Exchange Act. Forward-looking statements are subject to known and unknown risks and uncertainties, many of which may be beyond our control. We caution you that the forward-looking information presented herein is not a guarantee of future events, and that actual events may differ materially from those made in or suggested by the forward-looking information contained in this presentation. In addition, forward-looking statements generally can be identified by the use of forward-looking terminology such as “may,” “plan,” “seek,” “comfortable with,” “will,” “expect,” “intend,” “estimate,” “anticipate,” “believe” or “continue” or the negative thereof or variations thereon or similar terminology. A number of important factors could cause actual events to differ materially from those contained in or implied by the forward-looking statements, including those factors discussed in our filings with the U.S. Securities & Exchange Commission’s (the “SEC”), including our Registration Statement on Form S-1, as amended (File No. 333-187872), which can be found at the SEC’s website www.sec.gov. Any forward-looking information presented herein is made only as of the date of this presentation, and we do not undertake any obligation to update or revise any forward-looking information to reflect changes in assumptions, the occurrence of unanticipated events, or otherwise. Non-GAAP Financial Measures HD Supply supplements its reporting net income (loss) with non-GAAP measurements, including Adjusted EBITDA, Adjusted net income (loss) and Adjusted net income (loss) per share. This supplemental information should not be considered in isolation or as a substitute for the GAAP measurements. Additional information regarding Adjusted EBITDA, Adjusted net income (loss) and Adjusted net income (loss) per share referred to in this presentation is included at the end of this presentation under “Reconciliation of Non-GAAP Measures.” |

|
|
Q3’13 Performance Highlights +7% Sales Growth Versus Prior Year (“VPY”); $2.3B of Sales in Q3’13 +6% Organic Growth VPY +400BPs of Growth in Excess of Market Estimate1 29.1% Gross Margin; +40BPs VPY; Including ~20BPs Headwind from Crown Bolt Contract Extension +11% Adjusted EBITDA Growth VPY; $226M of Adjusted EBITDA in Q3’13 1.5x Operating Leverage2 $75M Adjusted Net Income; +$65M VPY $0.38 Adjusted Net Income per Diluted Share3 Sales Growth in Excess of Estimated Market Growth in all Primary Business Units: Facilities Maintenance +6%4.... +400BPs4 versus Market Estimate Waterworks +14% (+11% Organic).... +900BPs1 versus Market Estimate Power Solutions .... +1% +200BPs1 versus Market Estimate White Cap +11%.... +800BPs1 versus Market Estimate +400 BPs of Growth in Excess of Estimated Market Growth 1 Management Estimate; Market Estimate is Management Estimate of the Growth of our Markets Based on Multiple Quantitative and Qualitative Inputs (See Appendix Slide 17 for Further Details) 2 Operating Leverage is Calculated by Dividing Adjusted EBITDA Growth by Total Sales Growth based on a 52 Week Basis 3 Diluted Weighted Average Share Count of 197.7M Outstanding as of 3Q’13 4 Management Estimate Excluding FM Third Quarter “Unusual” Items. Market Estimate is Management Estimate of the Growth of our Markets Based on Multiple Quantitative and Qualitative Inputs. Note: “VPY” denotes versus prior year +400 BPs of Growth in excess of Estimated Market Growth |
|
|
Key Growth Strategies Sell More to Existing Customers (i.e., Share of Wallet) Introduce New Products and Services Expand the Channels to Reach Our Customers (e.g., Internet, Catalog) Acquire New Customers Enter New Geographies (i.e., Open New Locations) Investing for Growth Strategy Unchanged |
|
|
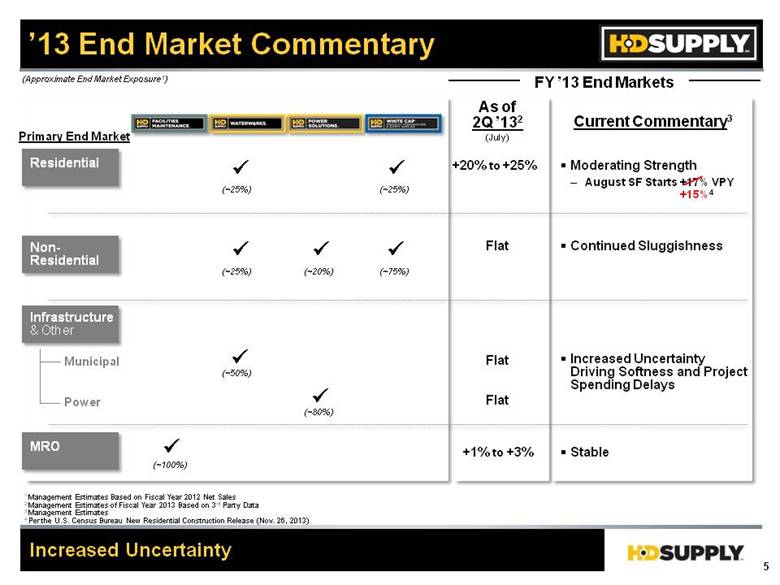
’13 End Market Commentary Increased Uncertainty Current Commentary3 Residential Non- Residential Infrastructure & Other MRO Municipal Power 1 Management Estimates Based on Fiscal Year 2012 Net Sales 2 Management Estimates of Fiscal Year 2013 Based on 3rd Party Data 3 Management Estimates 4 Per the U.S. Census Bureau New Residential Construction Release (Nov. 26, 2013) (~20%) (~80%) (~25%) (~50%) (~25%) (~25%) (~75%) (~100%) (Approximate End Market Exposure1) +20% to +25% As of 2Q ’132 Flat Flat +1% to +3% Flat FY ’13 End Markets Primary End Market (July) Moderating Strength August SF Starts +17% VPY Stable Increased Uncertainty Driving Softness and Project Spending Delays Continued Sluggishness +15%4 |
|
|
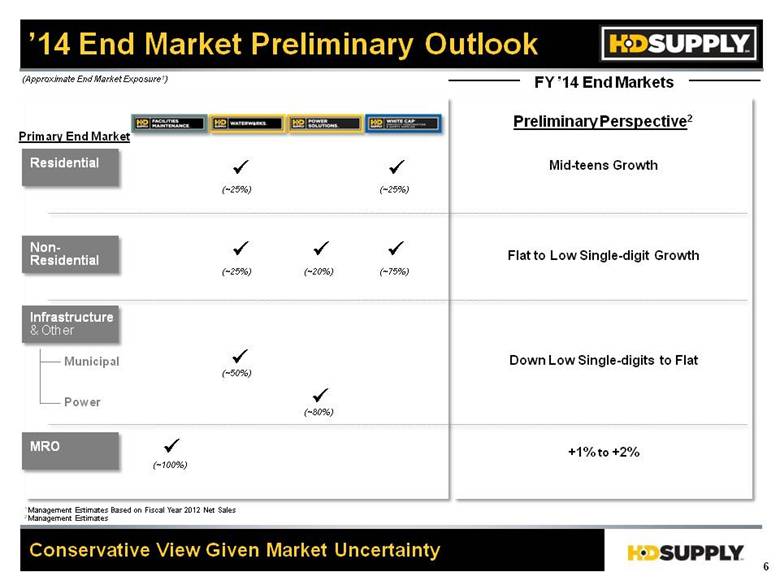
’14 End Market Preliminary Outlook Conservative View Given Market Uncertainty Preliminary Perspective2 Residential Infrastructure & Other MRO Municipal Power 1 Management Estimates Based on Fiscal Year 2012 Net Sales 2 Management Estimates (~20%) (~80%) (~25%) (~50%) (~25%) (~25%) (~75%) (~100%) (Approximate End Market Exposure1) FY ’14 End Markets Primary End Market Mid-teens Growth Flat to Low Single-digit Growth Down Low Single-digits to Flat +1% to +2% Non- Residential |
|
|
Execution Focus Focused on Controllable Execution Execution Focus LT Growth Target1 Share of Wallet (Sales Force Effectiveness); New Products and Services (Category Management) Analyze and Prioritize Growth Investments (BPs Above BU End Market Estimate) +200 - +500 BPs Share of Wallet (Sales Force Effectiveness); New Products and Services (Category Management) SG&A Reductions Given Market Realities and Inventory Alignment Share of Wallet (Sales Force Effectiveness); New Products and Services (Category Management); New Locations Refresh Priority Market Sales Force Effectiveness Relevant Experience to Execute in Uncertain Markets... Strict Accountability, Deep Talent Base Executing Structural Cost Reductions and Growth Intensity New Products and Services (Adjacent Offerings); New Locations Acquire New Customers (Talent Acquisition) 1 Long-term Average Growth Target Based on Management Estimates and Aspirations “Non-Residential” “Industry Transformation” “Pent-Up Demand” “MRO” “Focused Execution” +300 BPs +200 - +500 BPs +200 - +500 BPs 0 - +200 BPs |

|
|
Q3’13 Financial Results $2.1B $2.3B $6.0B $6.6B +7% +10% ’12A Sales YTD 3rd Qtr. 3rd Qtr. ’13A ’12A ’13A Gross Profit Gross Margin % Adj. EBITDA1 Operating Income Adj. EBITDA % Op. Income % VPY $616M $668M 28.7% 29.1% $204M $226M $114 $160 9.5% 9.8% 5.3% 7.0% $1,733M $1,927M 28.7% 29.1% $529M $608M $260 $410 8.8% 9.2% 4.3% 6.2% +8% +40BPs +40% +170BPs +30BPs +11% +11% +40BPs +58% +190BPs +40BPs +15% +7% Sales Growth; +11% Adjusted EBITDA Growth in Q3 VPY ($ in millions, unless otherwise noted) Adj. Net Income1 $10M $75M ($50M) $96M +$65M +$146M 1 See Appendix Pages 26 and 27 for a Reconciliation of Adjusted EBITDA and Adjusted Net Income to Net Income |

|
|
Q3 Segment Performance 3Q'13 $610M 3Q'13 $633M 3Q'13 $472M 3Q'13 $352M Adj. EBITDA $119M $55M $21M $27M Operating Leverage 1.6x 2.1x nmf 2.1x Sales ($ in millions) Sales Growth and Operating Leverage 3Q'12 3Q'12 3Q'12 3Q'12 $587M $553M $468M $318M $112M $42M +14% $21M +1% VPY +4% +6% VPY VPY VPY +31% - +11% +23% $22M |

|
|
Liquidity and Capital Structure Q3’13 Debt Balances Sec. ABL Sec. Term Loan Sec. 1st Lien Notes @ 8.125% Sec. 2nd Lien Notes @ 11.0% Unsec. Sr. Notes @ 11.5% Unsec. Sr. Notes @ 7.5% $480 967 1,269 675 1,000 1,275 10/12/17 10/12/17 4/15/19 4/15/20 7/15/20 7/15/20 Gross Debt Cash Net Debt $5,546 120 $5,666 Facility Balance2 Maturity 1 Estimated Cash Taxes for Future Periods 2 Net of Original Issue Discount and Premium $5.5B Net Debt at the End of Q3’13 $993M Liquidity at the End of Q3’13 No Material Bank Debt Maturities Until 2017 and No Note Maturities Until 2019 Favorable Tax Asset with Significant Gross Federal Net Operating Loss Carryforwards of $2.4B; Cash Taxes of: $1M in Q3 ’13 $2M1 in Q4 ’13 $8M1 for FY’13 $32M Capital Expenditures During Q3’13 (1.4% of Sales); $96M YTD Q3 $993M Liquidity with No Near Term Debt Maturities... Positioned for Growth ($ in millions, unless otherwise noted) |

|
|
Preliminary ’13 November Sales (%) HD Supply Average Daily Sales Growth VPY 9% November Average Daily Sales Growth ’13 Selling Days ’12 Selling Days 11.7% 14.0% 3.6% 9.4% 63 63 Q2’13 9.6% 1.6% 15.1% (0.4%) 10.5% 20 20 Aug. 6.5% 6.0% 15.7% 1.4% 12.4% 19 19 Sept. 8.1% 4.5% 13.0% 1.3% 9.5% 25 25 Oct. 6.6% 3.9% 14.5% 0.9% 10.7% 64 64 Q3’13 7.0% 8.1% 13.7% 7.4% 9.2% 18 18 Nov. 9.2% Preliminary |

|
|
Q4’12 Adjustments for Comparability Adjustments for Crown Bolt Agreement and 53rd Week 1 FY’12 Sales and EBITDA Adjusted for 53rd Week and Impact of CB Extension $1,994M Q4’12 (148) (19) (6) $1,821M 53rd Wk CB Ext Shortfall G’tee CB Ext Price Q4’12 Adj.1 Net Sales ($ in millions) $154M Q4’12 (14) 53rd Wk CB Ext Shortfall G’tee CB Ext Price Q4’12 Adj.1 Adj. EBITDA $115M (19) (6) |

|
|
FY’13 Updated Guidance 8% – 9% Implied FY’13 Adjusted Sales Growth $8,575M $8,500M $683M $8,035M $760M $750M VPY2 FY’12 FY’13 FY’12 FY’13 FY’12 FY’13 Net Sales Adj. EBITDA Adj. Net Income Per Diluted Share1 +9% +8% VPY2 1 Fiscal 2013 Adjusted Net Income per Share Range Assumes a Fully Diluted Weighted Average Share Count of 172 Million 2 Adjusted for 53rd Week and Impact of CB Extension. Please See Appendix Pages 24 and 25 for Details of Adjustments +21% +20% $0.58 $0.52 nmf nmf VPY ($1.01) ($ in millions, except per share amounts) $7,844M2 $626M2 |

|
|
Q&A We Supply the Products and Services to Build Your City and Keep it Running |

|
|
Concluding Remarks +7% Sales Growth in Q3’13... +400BPs1 Versus Our End Market Estimates 29.1% Gross Margin... +40 BPs in Q3’13 Strategy and Investment Approach is Unchanged Despite End Market Uncertainty 9% November VPY Sales Growth2 Early Innings of Our Full Potential Well Positioned in Large, Fragmented Markets 1 Management Estimates 2 Based on Preliminary November Sales |
|
|
Appendix |

|
|
End Market Outgrowth Estimates +400BPs of Estimated End Market Outgrowth MRO Residential Non-Resi. Municipal Power Q3’13 BU Market2 Q3’13 Growth3 Outgrowth2 100% 25% 25% 50% 20% 80% 25% 75% ~2% 6% +400BPs ~2% ~2% (~1%) ~3% 6%4 11% 1% 11% +400BPs4 +900BPs +200BPs +800BPs (Approximate End Market Exposure1) 1 Management Estimates Based on Fiscal Year 2012 Net Sales 2 Management Estimate 3 Organic Sales Growth 4 Management Estimate Excluding Third Quarter “Unusual” Items Primary End Market1 Q3 Primary End Market Estimate2 ~2% ~15% (~2%) (~1%) ~Flat |

|
|
7.0% Monthly Average Daily Sales Growth (%) HD Supply Average Daily Sales Growth VPY 7% Average Daily Sales Growth in Q3’13; 9% Preliminary Average Daily Sales Growth in November ’13 Selling Days ’12 Selling Days 12.9% 13.4% 11.3% 16.5% 65 65 13.1% 12.2% 4.4% 10.6% 19 20 13.0% 14.1% 2.5% 9.9% 20 19 9.3% 15.7% 3.8% 7.3% 24 24 11.7% 14.0% 3.6% 9.4% 63 63 1.6% 15.1% -0.4% 10.5% 20 20 6.0% 15.7% 1.4% 12.4% 19 19 4.5% 13.0% 1.3% 9.5% 25 25 3.9% 14.5% 0.9% 10.7% 64 64 Q1’13 12.6% May 10.5% June 9.5% July 8.9% Q2’13 9.6% Aug 6.5% Sept 8.1% Oct 6.6% Q3’13 8.1% 13.7% 7.4% 9.2% 18 18 Nov 9.2% Preliminary |

|
|
Monthly Net Sales ($) HD Supply Net Sales $633M Preliminary November Sales ’13 Selling Days ’12 Selling Days $561 523 462 $310 65 65 19 20 20 19 24 24 63 63 20 20 19 19 25 25 64 64 Q1’13 $2,068M May $656 June $723 July $878 Q2’13 $2,257 Aug. $720 Sept. $690 Oct. $887 Q3’13 $2,297 ($ in millions) $179 175 133 $99 $203 193 147 $109 $256 233 176 $128 $638 601 456 $336 $199 201 141 $108 $184 194 136 $105 $227 238 195 $139 $610 633 472 $352 $162 $163 $145 $95 18 18 Nov $633M Preliminary |

|
|
Monthly Average Daily Sales Growth – Organic (%) HD Supply Organic Average Daily Sales Growth VPY1 ’13 Selling Days ’12 Selling Days Q1’13 10.8% 9.6% 8.2% 11.3% 16.5% 65 65 May 8.6% 9.3% 7.7% 4.4% 10.6% 19 20 June 7.7% 9.8% 9.2% 2.5% 9.9% 20 19 July 7.8% 8.8% 11.1% 3.8% 7.3% 24 24 Q2’13 9.4% 9.5% 3.6% 9.4% 8.1% 63 63 1 Adjusted for acquisitions and Crown Bolt contract amendment. Previously reported organic growth rates adjusted only for acquisitions (10.4% and 7.8% for Q1’13 and Q2’13, respectively). Aug. 5.8% 1.6% 11.2% -0.4% 10.5% 20 20 Sept. 7.3% 6.0% 11.7% 1.4% 12.4% 19 19 Oct. 5.8% 4.4% 8.9% 2.1% 9.0% 25 25 Q3’13 3.9% 10.6% 0.9% 10.7% 6.3% 64 64 8.1% 9.7% 7.4% 9.2% Nov 8.5% 18 18 Preliminary 6% Organic Average Daily Sales Growth in Q3’13; 8% Preliminary Organic Average Daily Sales Growth in November |

|
|
Preliminary November ’13 Monthly Sales '13 $162M '13 $163M '13 $145M '13 $95M VPY 8% 14% 7% 9% Sales ($ in millions) Continued Sales Growth Despite Tough Comparables '12 '12 '12 '12 $150M $144M $135M $87M 17% 10% 17% 19% VPY Organic1 8% 10% 7% 9% 13% 10% 17% 19% 1 Adjusted for Acquisitions. |

|
|
Average Daily Sales Growth – Organic ~6% Estimated Organic Average Daily Sales Growth in Q3’13 Q1 9.6% 9.4% 8.2% 9.5% 11.3% 3.6% 16.5% 9.4% 10.8% 8.1% 2011 2012 2013 Q2 Q3 Q4 Fac. Maintenance Waterworks Power Solutions White Cap HD Supply Fac. Maintenance Waterworks Power Solutions White Cap HD Supply Fac. Maintenance Waterworks Power Solutions White Cap HD Supply 13.7% 11.4% 14.5% 10.1% 17.1% 6.3% 12.8% 9.3% 5.1% 6.0% 9.1% 11.1% 23.1% 20.4% 14.8% 13.8% 13.7% 9.5% 12.4% 9.8% - - - - - Organic Average Daily Sales Growth VPY1 9.3% 8.6% 13.5% 13.8% (5.4%) 8.5% 3.5% 15.0% 16.2% 12.2% 11.1% 5.5% 5.4% 11.8% 18.4% 25.9% 3.6% 8.5% 9.0% 13.1% 1 Adjusted for Acquisitions, Crown Bolt Contract Amendment, and Selling Days Selling Days 65 63 64 61 Selling Days 65 63 64 66 Selling Days 65 63 64 61 (VPY%) 3.9% 10.6% 0.9% 10.7% 6.3% |

|
|
FY’13 Updated Guidance Net Sales Adj. EBITDA ($ in millions) YTD Q3’13 9 Mos. Ended 11/3 Q4’13 Implied $6,622M $8,575M $8,500M 1 Adjusted for 53rd Week and Impact of CB Extension 2 Adjusted for the Impact of Acquisitions Note: Totals may not foot due to rounding FY’13 Guidance $608M $760M $750M Q4’13 Implied $1,953M $1,878M $152M $142M VPY, Reported 10% (6%) - (2%) 15% 6% - 7% (8%) - (1%) 10% - 11% 8% – 9% Implied FY’13 Adjusted Sales Growth VPY, Adj. Organic1,2 8% 2% - 6% 7% - 8% Acquisitions (2 Pts) 1 Pts (1 Pt) Crown Bolt 0 Pts +4 Pts +1 Pt +1 Pt +19 Pts +7 Pts 53rd Week -- -- +8 Pts +2 Pts +10 Pts +2 Pts VPY, Adjusted1 10% 19% 3% - 7% 8% - 9% 23% - 32% 20% - 21% YTD Q3’13 9 Mos. Ended 11/3 FY’13 Guidance |

|
|
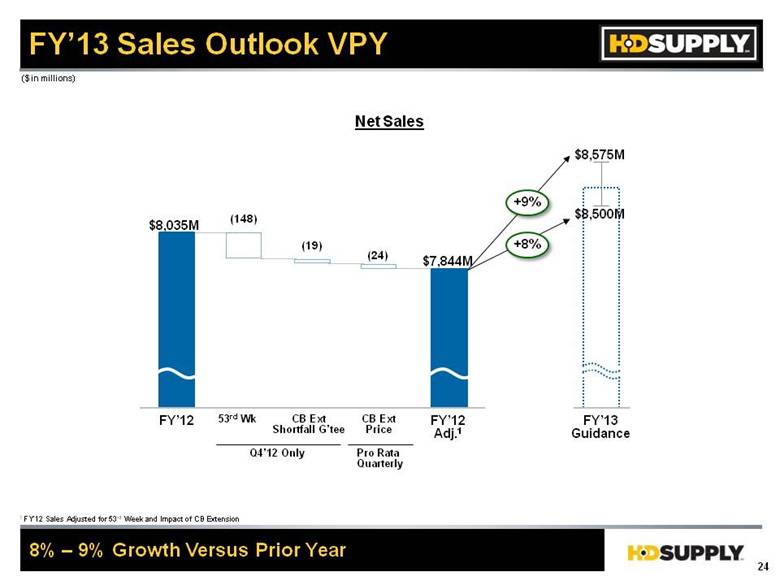
FY’13 Sales Outlook VPY Net Sales 1 FY’12 Sales Adjusted for 53rd Week and Impact of CB Extension 8% – 9% Growth Versus Prior Year ($ in millions) $8,035M FY’12 (148) (19) (24) $7,844M 53rd Wk CB Ext Shortfall G’tee CB Ext Price Q4’12 Only Pro Rata Quarterly FY’12 Adj.1 FY’13 Guidance $8,575M $8,500M +8% +9% |
|
|
FY’13 Adj. EBITDA Outlook VPY ($ in millions) Adj. EBITDA 1 FY’12 Adjusted EBITDA Adjusted for 53rd Week and Impact of CB Extension 20% – 21% Growth Versus Prior Year $683M FY’12 (14) (19) (24) 53rd Wk CB Ext Shortfall G’tee CB Ext Price Q4’12 Only Pro Rata Quarterly FY’12 Adj.1 FY’13 Guidance $760M $750M +20% +21% $626M |

|
|
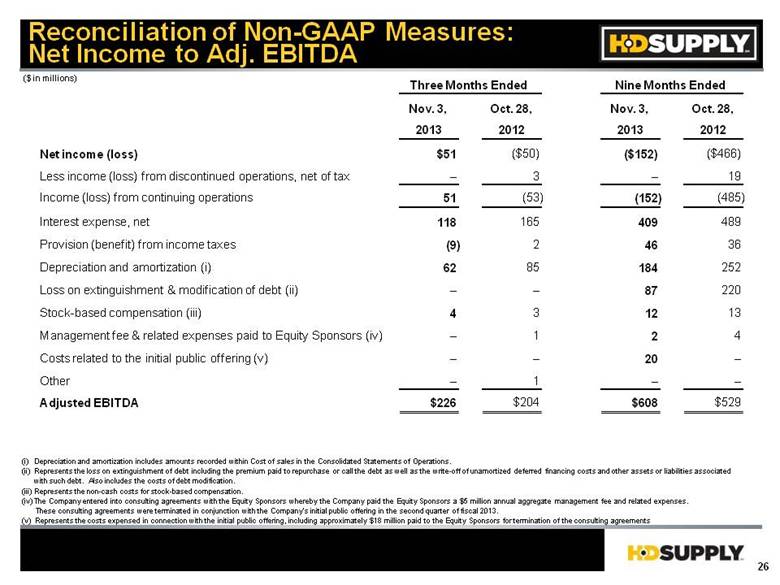
Reconciliation of Non-GAAP Measures: Net Income to Adj. EBITDA ($ in millions) Nov. 3, Oct. 28, Nov. 3, Oct. 28, 2013 2012 2013 2012 Net income (loss) $51 ($50) ($152) ($466) Less income (loss) from discontinued operations, net of tax – 3 – 19 Income (loss) from continuing operations 51 (53) (152) (485) Interest expense, net 118 165 409 489 Provision (benefit) from income taxes (9) 2 46 36 Depreciation and amortization (i) 62 85 184 252 Loss on extinguishment & modification of debt (ii) – – 87 220 Stock-based compensation (iii) 4 3 12 13 Management fee & related expenses paid to Equity Sponsors (iv) – 1 2 4 Costs related to the initial public offering (v) – – 20 – Other – 1 – – Adjusted EBITDA $226 $204 $608 $529 Three Months Ended Nine Months Ended (i) Depreciation and amortization includes amounts recorded within Cost of sales in the Consolidated Statements of Operations. (ii) Represents the loss on extinguishment of debt including the premium paid to repurchase or call the debt as well as the write-off of unamortized deferred financing costs and other assets or liabilities associated with such debt. Also includes the costs of debt modification. (iii) Represents the non-cash costs for stock-based compensation. (iv) The Company entered into consulting agreements with the Equity Sponsors whereby the Company paid the Equity Sponsors a $5 million annual aggregate management fee and related expenses. These consulting agreements were terminated in conjunction with the Company’s initial public offering in the second quarter of fiscal 2013. (v) Represents the costs expensed in connection with the initial public offering, including approximately $18 million paid to the Equity Sponsors for termination of the consulting agreements |
|
|
Reconciliation of Non-GAAP Measures: Net Income to Adj. Net Income ($ in millions, expect per share data) Nov. 3, Oct. 28, Nov. 3, Oct. 28, 2013 2012 2013 2012 Net income (loss) $51 ($50) ($152) ($466) Less income (loss) from discontinued operations, net of tax – 3 – 19 Income (loss) from continuing operations 51 (53) (152) (485) Plus: Provision (benefit) for income taxes (9) 2 46 36 Less: Cash income taxes (1) – (6) (2) Plus: Amortization of acquisition-related intangible assets (other than software) 34 61 101 181 Plus: Loss on extinguishment & modification of debt (i) – – 87 220 Plus: Costs related to the initial public offering (ii) – – 20 – Adjusted net income (loss) $75 $10 $96 ($50) Three Months Ended Nine Months Ended (i) Represents the loss on extinguishment of debt including the premium paid to repurchase or call the debt as well as the write-off of unamortized deferred financing costs and other assets or liabilities associated with such deb. Also includes the costs of debt modifications. (ii) Represents the costs expensed in connection with the initial public offering, including approximately $18 million paid to the Equity Sponsors for termination of consulting agreements. (iii) The dilution calculation uses a share price of $18.00 for all days prior to the initial public offering on June 27, 2013. Weighted average common shares outstanding (in thousands) Basic 191,750 130,555 158,587 130,555 Diluted 197,392 134,238 163,325 130,555 Adjusted Net Income (Loss) Per Share - Basic $0.39 $0.08 $0.61 ($0.38) Adjusted Net Income (Loss) Per Share - Diluted $0.38 $0.07 $0.59 ($0.38) |
