Attached files
| file | filename |
|---|---|
| 8-K - FORM 8-K - EXELON CORP | d640475d8k.htm |
Exhibit 99.1
Change to Format of Exelon Generation Disclosures
All numbers as of September 30, 2013
Exelon®
Change to Format of Exelon Generation Disclosures – Gross Margin, O&M and Depreciation & Amortization Definitions
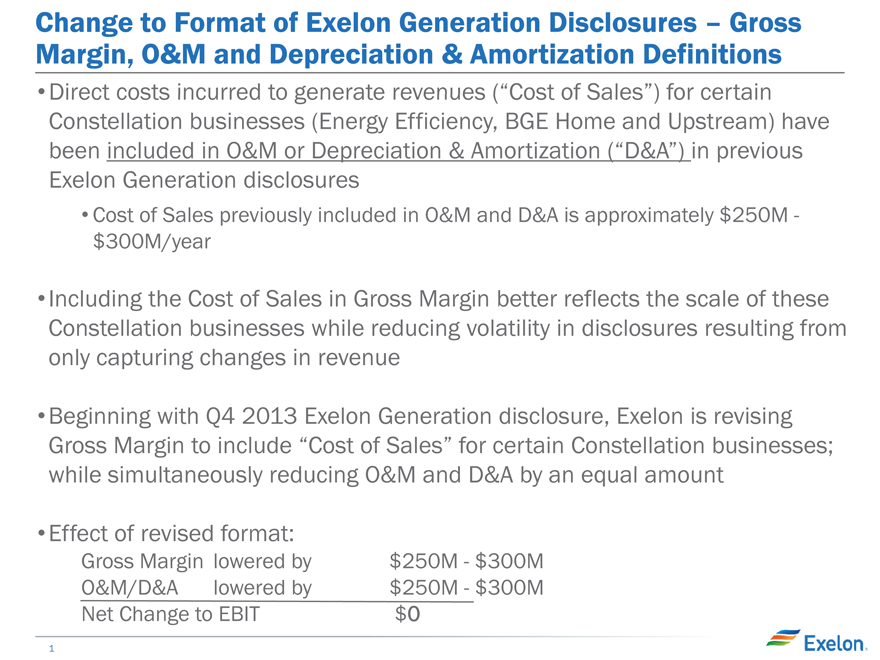
Direct costs incurred to generate revenues (“Cost of Sales”) for certain Constellation businesses (Energy Efficiency, BGE Home and Upstream) have been included in O&M or Depreciation & Amortization (“D&A”) in previous Exelon Generation disclosures
Cost of Sales previously included in O&M and D&A is approximately $250M -$300M/year
Including the Cost of Sales in Gross Margin better reflects the scale of these Constellation businesses while reducing volatility in disclosures resulting from only capturing changes in revenue
Beginning with Q4 2013 Exelon Generation disclosure, Exelon is revising Gross Margin to include “Cost of Sales” for certain Constellation businesses; while simultaneously reducing O&M and D&A by an equal amount
Effect of revised format:
Gross Margin lowered by $250M—$300M
O&M/D&A lowered by $250M—$300M
Net Change to EBIT $0
1
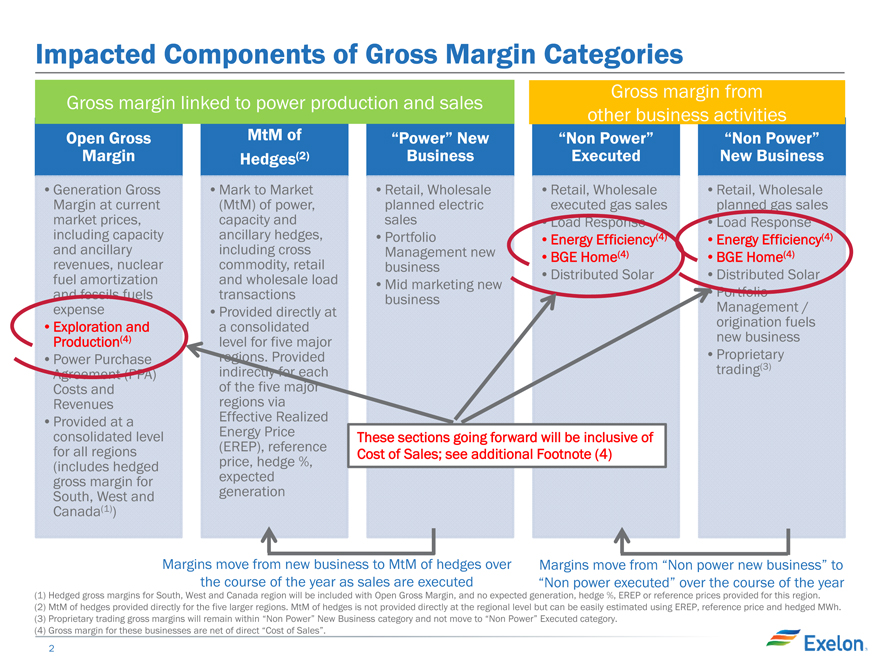
Impacted Components of Gross Margin Categories
Gross margin linked to power production and sales
Open Gross Margin
Generation Gross Margin at current market prices, including capacity and ancillary revenues, nuclear fuel amortization and fossils fuels expense
Exploration and Production(4)
Power Purchase Agreement (PPA) Costs and Revenues
Provided at a consolidated level for all regions (includes hedged gross margin for South, West and Canada(1)) MtM of Hedges(2)
Mark to Market (MtM) of power, capacity and ancillary hedges, including cross commodity, retail and wholesale load transactions
Provided directly at a consolidated level for five major regions. Provided indirectly for each of the five major regions via Effective Realized Energy Price (EREP), reference price, hedge %, expected generation
“Power” New Business
Retail, Wholesale planned electric sales
Portfolio Management new business
Mid marketing new business
Gross margin from other business activities
“Non Power” Executed
Retail, Wholesale executed gas sales
Load Response
Energy Efficiency(4) BGE Home(4)
Distributed Solar
“Non Power” New Business
Retail, Wholesale planned gas sales
Load Response
Energy Efficiency(4)
BGE Home(4)
Distributed Solar
Portfolio Management / origination fuels new business
Proprietary trading(3)
These sections going forward will be inclusive of Cost of Sales; see additional Footnote (4)
Margins move from new business to MtM of hedges over the course of the year as sales are executed
Margins move from “Non power new business” to “Non power executed” over the course of the year
(1) Hedged gross margins for South, West and Canada region will be included with Open Gross Margin, and no expected generation, hedge %, EREP or reference prices provided for this region. (2) MtM of hedges provided directly for the five larger regions. MtM of hedges is not provided directly at the regional level but can be easily estimated using EREP, reference price and hedged MWh. (3) Proprietary trading gross margins will remain within “Non Power” New Business category and not move to “Non Power” Executed category.
(4) Gross margin for these businesses are net of direct “Cost of Sales”.
2
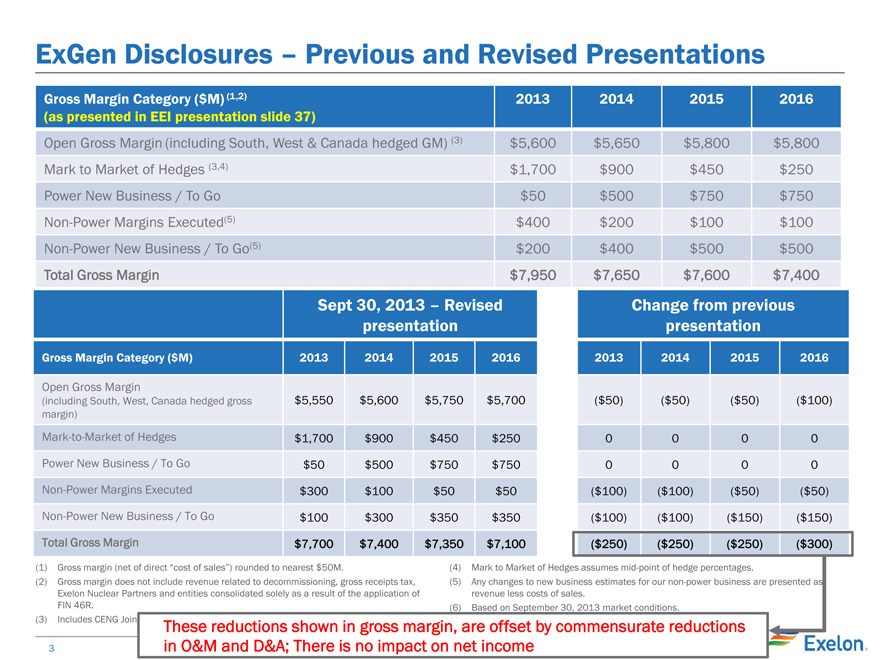
ExGen Disclosures – Previous and Revised Presentations
Gross Margin Category ($M) (1,2) 2013 2014 2015 2016
(as presented in EEI presentation slide 37)
Open Gross Margin (including South, West & Canada hedged GM) (3) $5,600 $5,650 $5,800 $5,800
Mark to Market of Hedges (3,4) $1,700 $900 $450 $250
Power New Business / To Go $50 $500 $750 $750
Non-Power Margins Executed(5) $400 $200 $100 $100
Non-Power New Business / To Go(5) $200 $400 $500 $500
Total Gross Margin $7,950 $7,650 $7,600 $7,400
Sept 30, 2013 – Revised
presentation
Gross Margin Category ($M) 2013 2014 2015 2016
Open Gross Margin
(including South, West, Canada hedged gross $5,550 $5,600 $5,750 $5,700
margin)
Mark-to-Market of Hedges $1,700 $900 $450 $250
Power New Business / To Go $50 $500 $750 $750
Non-Power Margins Executed $300 $100 $50 $50
Non-Power New Business / To Go $100 $300 $350 $350
Total Gross Margin $7,700 $7,400 $7,350 $7,100
Change from previous
presentation
2013 2014 2015 2016
($50) ($50) ($50) ($100)
0 0 0 0
0 0 0 0
($100) ($100) ($50) ($50)
($100) ($100) ($150) ($150)
($250) ($250) ($250) ($300)
(1) Gross margin (net of direct “cost of sales”) rounded to nearest $50M.
(2) Gross margin does not include revenue related to decommissioning, gross receipts tax, Exelon Nuclear Partners and entities consolidated solely as a result of the application of FIN 46R.
(3) Includes CENG Joint
(4) Mark to Market of Hedges assumes mid-point of hedge percentages.
(5) Any changes to new business estimates for our non-power business are presented as revenue less costs of sales.
(6) Based on September 30, 2013 market conditions.
These reductions shown in gross margin, are offset by commensurate reductions in O&M and D&A; There is no impact on net income
3
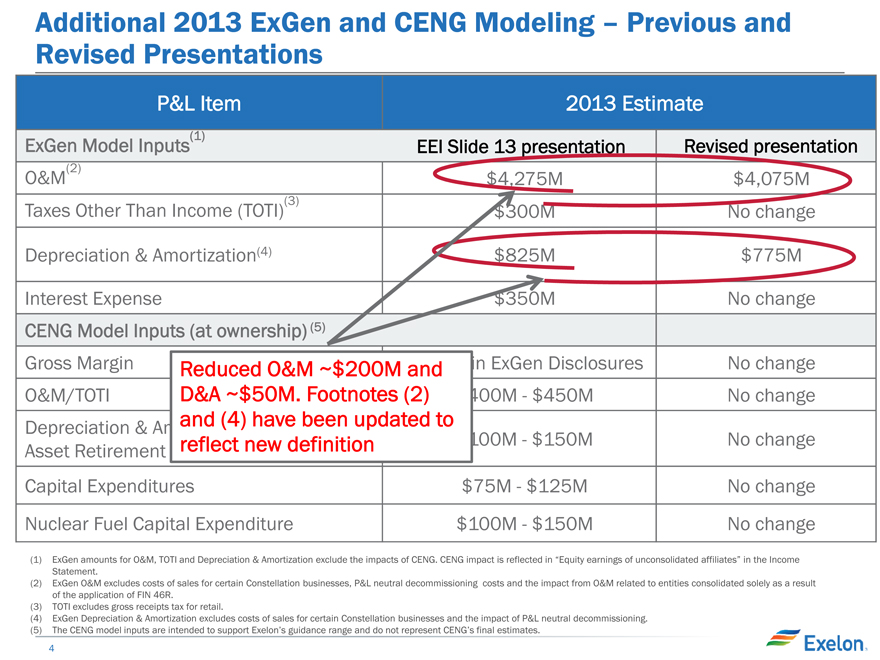
Additional 2013 ExGen and CENG Modeling – Previous and Revised Presentations
P&L Item 2013 Estimate
ExGen Model Inputs(1) EEI Slide 13 presentation Revised presentation
O&M(2) $4,275M $4,075M
Taxes Other Than Income (TOTI)(3) $300M No change
Depreciation & Amortization(4) $825M $775M
Interest Expense $350M No change
CENG Model Inputs (at ownership) (5)
Gross Margin in ExGen Disclosures No change
O&M/TOTI 400M—$450M No change
Depreciation & A
Asset Retirement 100M—$150M No change
Capital Expenditures $75M—$125M No change
Nuclear Fuel Capital Expenditure $100M—$150M No change
Reduced O&M ~$200M and
D&A ~$50M. Footnotes (2)
and (4) have been updated to
reflect new definition
(1) ExGen amounts for O&M, TOTI and Depreciation & Amortization exclude the impacts of CENG. CENG impact is reflected in “Equity earnings of unconsolidated affiliates” in the Income Statement.
(2) ExGen O&M excludes costs of sales for certain Constellation businesses, P&L neutral decommissioning costs and the impact from O&M related to entities consolidated solely as a result of the application of FIN 46R.
(3) TOTI excludes gross receipts tax for retail.
(4) ExGen Depreciation & Amortization excludes costs of sales for certain Constellation businesses and the impact of P&L neutral decommissioning. (5) The CENG model inputs are intended to support Exelon’s guidance range and do not represent CENG’s final estimates.
4