Attached files
| file | filename |
|---|---|
| EX-10.24 - EX-10.24 - RetailMeNot, Inc. | d610696dex1024.htm |
| EX-10.24.1 - EX-10.24.1 - RetailMeNot, Inc. | d610696dex10241.htm |
| EX-10.14.1 - EX-10.14.1 - RetailMeNot, Inc. | d610696dex10141.htm |
| EX-23.1 - EX-23.1 - RetailMeNot, Inc. | d610696dex231.htm |
| EX-23.2 - EX-23.2 - RetailMeNot, Inc. | d610696dex232.htm |
Table of Contents
As filed with the Securities and Exchange Commission on December 2, 2013
Registration No. 333-
UNITED STATES
SECURITIES AND EXCHANGE COMMISSION
Washington, D.C. 20549
FORM S-1
REGISTRATION STATEMENT
UNDER
THE SECURITIES ACT OF 1933
RETAILMENOT, INC.
(Exact name of Registrant as Specified in Its Charter)
| Delaware | 7389 | 26-0159761 | ||
| (State or Other Jurisdiction of Incorporation or Organization) |
(Primary Standard Industrial Classification Code Number) |
(IRS Employer Identification No.) | ||
301 Congress Avenue, Suite 700
Austin, Texas 78701
(512) 777-2970
(Address, Including Zip Code, and Telephone Number, Including Area Code, of Registrant’s Principal Executive Offices)
G. Cotter Cunningham
Chief Executive Officer
301 Congress Avenue, Suite 700
Austin, Texas 78701
(512) 777-2970
(Name, Address, Including Zip Code, and Telephone Number, Including Area Code, of Agent for Service)
Copies to:
| Samer M. Zabaneh Philip W. Russell DLA Piper LLP (US) 401 Congress Avenue, Suite 2500 Austin, Texas 78701 (512) 457-7000 |
Louis J. Agnese, III General Counsel and Secretary RetailMeNot, Inc. 301 Congress Avenue, Suite 700 Austin, Texas 78701 (512) 777-2970 |
Paul R. Tobias Joseph M. Alcorta Wilson Sonsini Goodrich & Rosati, Professional Corporation 900 South Capital of Texas Highway Las Cimas IV, Fifth Floor Austin, Texas 78746 (512) 338-5400 |
Approximate date of commencement of proposed sale to the public: As soon as practicable after this registration statement becomes effective.
If any of the securities being registered on this form are to be offered on a delayed or continuous basis pursuant to Rule 415 under the Securities Act of 1933, as amended (the “Securities Act”), check the following box. ¨
If this form is filed to register additional securities for an offering pursuant to Rule 462(b) under the Securities Act, check the following box and list the Securities Act registration statement number of the earlier effective registration statement for the same offering. ¨
If this form is a post-effective amendment filed pursuant to Rule 462(c) under the Securities Act, check the following box and list the Securities Act registration statement number of the earlier effective registration statement for the same offering. ¨
If this form is a post-effective amendment filed pursuant to Rule 462(d) under the Securities Act, check the following box and list the Securities Act registration statement number of the earlier effective registration statement for the same offering. ¨
Indicate by check mark whether registrant is a large accelerated filer, an accelerated filer, a non-accelerated filer or a smaller reporting company. See the definitions of “large accelerated filer,” “accelerated filer,” and “smaller reporting company” in Rule 12b-2 of the Securities Exchange Act of 1934, as amended (the “Exchange Act”). (check one): ¨ Large accelerated filer, ¨ Accelerated filer, x Non-accelerated filer (do not check if a smaller reporting company) or ¨ Smaller reporting company.
CALCULATION OF REGISTRATION FEE
|
| ||||
| Title of Each Class of Securities To Be Registered |
Proposed Maximum Aggregate |
Amount of Registration Fee | ||
| Series 1 common stock, par value $0.001 |
$200,000,000 | $25,760.00 | ||
|
| ||||
|
| ||||
| (1) | Estimated solely for the purpose of calculating the amount of the registration fee in accordance with Rule 457(o) under the Securities Act. Includes offering price of additional shares that the underwriters have the option to purchase. |
The registrant hereby amends this registration statement on such date or dates as may be necessary to delay its effective date until the registrant shall file a further amendment which specifically states that this registration statement shall thereafter become effective in accordance with Section 8(a) of the Securities Act of 1933, as amended, or until the registration statement shall become effective on such date as the Securities and Exchange Commission, acting pursuant to such Section 8(a), may determine.
Table of Contents
The information in this preliminary prospectus is not complete and may be changed. We and the selling stockholders may not sell these securities until the registration statement filed with the Securities and Exchange Commission is effective. This preliminary prospectus is not an offer to sell these securities and it is not soliciting an offer to buy these securities in any jurisdiction where the offer or sale is not permitted.
Registration No. 333-
PROSPECTUS (subject to completion), dated December 2, 2013
Shares

Series 1 Common Stock
RetailMeNot, Inc. is offering shares of its Series 1 common stock, and the selling stockholders identified in this prospectus are offering an additional shares of Series 1 common stock. We intend to offer approximately $75 million of shares and the remainder will be offered by the selling stockholders. We will not receive any of the proceeds from the sale of the shares being offered by the selling stockholders.
We have two classes of common stock, Series 1 common stock and Series 2 common stock. The rights of the holders of Series 1 common stock and Series 2 common stock are identical, except for voting and conversion rights. Each share of Series 1 common stock is entitled to one vote. Each share of Series 2 common stock is also entitled to one vote other than with respect to the election of members of the board of directors and may be converted at any time at the election of the holder into one share of Series 1 common stock. As such, only holders of Series 1 common stock are entitled to vote on the election of members of the board of directors. After this offering, our executive officers, directors, beneficial owners of 5.0% or more of our outstanding shares of capital stock, and affiliated entities, will own approximately % of our capital stock. In addition, in connection with this offering, our executive officers, directors, beneficial owners of 5.0% or more of our outstanding shares of capital stock, and affiliated entities, will receive approximately $ million of net proceeds from the sale of shares in this offering, after deducting underwriting discounts and commissions payable by such selling stockholders.
Our Series 1 common stock is listed on the NASDAQ Global Select Market under the symbol “SALE”. On November 29, 2013, the last reported sale price of our common stock on the NASDAQ Global Select Market was $28.67 per share.
We are an “emerging growth company” as that term is used in the Jumpstart Our Business Startups Act of 2012, or JOBS Act, and, as such, are subject to reduced public company reporting requirements.
Investing in our Series 1 common stock involves risks. See “Risk Factors” beginning on page 13.
PRICE $ A SHARE
| Price to Public |
Underwriting Discounts and Commissions(1) |
Proceeds to Company |
Proceeds to Selling Stockholders |
|||||||||||||
| Per Share |
$ | $ | $ | $ | ||||||||||||
| Total |
$ | $ | $ | $ | ||||||||||||
| (1) | We have agreed to reimburse the underwriters for certain expenses. See the section titled “Underwriting” on page 142. |
The selling stockholders have granted the underwriters the right to purchase up to an additional shares of Series 1 common stock.
The Securities and Exchange Commission and state securities regulators have not approved or disapproved these securities, or determined if this prospectus is truthful or complete. Any representation to the contrary is a criminal offense.
The underwriters expect to deliver the shares to purchasers on December , 2013.
| GOLDMAN, SACHS & CO. | MORGAN STANLEY | CREDIT SUISSE |
| JEFFERIES | RBC CAPITAL MARKETS | |
| STIFEL | WILLIAM BLAIR | |
December , 2013.
Table of Contents

Table of Contents
| 1 | ||||
| 13 | ||||
| Special Note Regarding Forward-Looking Statements and Industry Data |
42 | |||
| 43 | ||||
| 44 | ||||
| 45 | ||||
| 46 | ||||
| 47 | ||||
| Management’s Discussion and Analysis of Financial Condition and Results of Operations |
51 | |||
| 82 | ||||
| 103 | ||||
| 110 | ||||
| 119 | ||||
| 125 | ||||
| 130 | ||||
| 135 | ||||
| Material U.S. Federal Tax Consequences To Non-U.S. Holders Of Series 1 Common Stock |
138 | |||
| 142 | ||||
| 147 | ||||
| 147 | ||||
| 147 | ||||
| F-1 |
You should rely only on the information contained in this prospectus or in any free-writing prospectus we may authorize to be delivered or made available to you. We have not, the selling stockholders have not and the underwriters have not authorized anyone to provide you with additional or different information. We and the selling stockholders are offering to sell, and seeking offers to buy, shares of our Series 1 common stock only in jurisdictions where offers and sales are permitted. The information in this prospectus or any free-writing prospectus is accurate only as of its date, regardless of its time of delivery or of any sale of shares of our Series 1 common stock. Our business, financial condition, results of operations and prospects may have changed since that date.
For investors outside the U.S.: We have not, the selling stockholders have not and the underwriters have not done anything that would permit this offering, or possession or distribution of this prospectus, in any jurisdiction where action for that purpose is required, other than in the U.S. Persons outside the U.S. who come into possession of this prospectus must inform themselves about, and observe any restrictions relating to, the offering of the shares of Series 1 common stock and the distribution of this prospectus outside of the U.S.
Table of Contents
This summary highlights information contained elsewhere in this prospectus and is a brief overview of key aspects of the offering. Before investing in our Series 1 common stock, you should carefully read this entire prospectus, including our consolidated financial statements and the related notes and the information set forth in the sections titled “Risk Factors” and “Management’s Discussion and Analysis of Financial Condition and Results of Operations.” Some of the statements in this prospectus constitute forward-looking statements. See the section titled “Special Note Regarding Forward-Looking Statements and Industry Data” for more information.
RETAILMENOT, INC.
Overview
We operate the world’s largest digital coupon marketplace, connecting consumers with leading retailers and brands. In 2012, our marketplace featured digital coupons from over 60,000 retailers and brands, and according to our internal data compiled using Google Analytics, we had more than 450 million total visits to our desktop and mobile websites. As of December 31, 2012, we had contracts with more than 10,000 retailers, or paid retailers. We own and operate the largest digital coupon marketplaces in the U.S. (RetailMeNot.com) and the U.K. (VoucherCodes.co.uk) and the largest portfolio of digital coupon websites in France (Web.Bons-de-Reduction.com, Poulpeo.com and Ma-Reduc.com).
We are the leading digital coupon destination for consumers. In 2013, our marketplace featured more than 500,000 digital coupons in each month. Digital coupons are coupons, coupon codes and brand or category specific discounts made available online or through mobile applications that are used by consumers to make online or in-store purchases directly from retailers. Our websites, mobile applications, email newsletters, alerts and social media presence enable consumers to search for, discover and redeem hundreds of thousands of relevant digital coupons from retailers and brands. Our marketplace features digital coupons across multiple product categories, including clothing; electronics; health and beauty; home and office; travel, food and entertainment; personal and business services; and shoes. We believe our investments in digital coupon content quality, product innovation and direct retailer relationships allow us to offer a compelling experience to consumers looking to save money, whether online or in-store.
We believe we are a trusted partner to retailers and brands. During 2010, 2011 and 2012, our paid retailers realized over $0.2 billion, $1.2 billion and $2.4 billion, respectively, in sales attributable to consumer traffic from digital coupons in our marketplace. We estimate that during the five-day period from November 22, 2012, Thanksgiving Day, through November 26, 2012, commonly known as Cyber Monday, sales attributable to consumer traffic from digital coupons in our marketplace accounted for approximately 2% of retail e-commerce spending in the U.S. We provide our retailers and brands access to a large and engaged consumer audience. We help retailers and brands drive sales and acquire new customers, online through our websites and mobile applications, and in-store by displaying a digital coupon on our mobile applications. We enter into contracts with retailers using a pay-for-performance model that enables us to have a mutually beneficial relationship with our paid retailers, as they pay a commission to us only after a sale is made. Retailers are able to identify consumer traffic referred by our websites and measure the sales they realize from it.
We believe our marketplace benefits from network effects. As more consumers use our marketplace, we are better able to obtain high quality digital coupons from retailers and brands, which in turn attracts a larger consumer audience. We seek to reinforce our position as the leading digital coupon destination by continuing to increase consumer traffic and growing the breadth and depth of our digital coupons, as well as our retailer and brand relationships.
1
Table of Contents
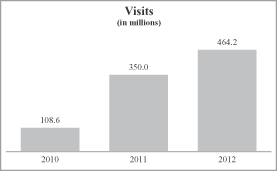
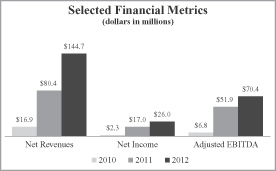
Since we entered the digital coupon market in 2009, we have experienced significant growth. Our net revenues increased from $16.9 million in 2010 to $144.7 million in 2012, representing a 192.9% compound annual growth rate, or CAGR. In the same period, our net income increased from $2.3 million to $26.0 million, representing a 233.0% CAGR, and adjusted EBITDA increased from $6.8 million in 2010 to $70.4 million in 2012, representing a 221.7% CAGR. Our historic growth has been driven organically and through acquisitions. From 2011 to 2012, our consolidated net revenues grew from $80.4 million to $144.7 million. During this period, net revenues from RetailMeNot.com grew organically from $60.5 million to $113.4 million. This $52.9 million increase in net revenues from RetailMeNot.com represents 82.3% of our consolidated net revenues growth. During the nine months ended September 30, 2013, we generated net revenues of $131.3 million, representing a 39.8% increase from the $93.9 million in net revenues we generated during the nine months ended September 30, 2012. Net income changed from $18.2 million for the nine months ended September 30, 2012 to $17.7 million for the nine months ended September 30, 2013, representing a 2.7% decrease from the nine months ended September 30, 2012. Adjusted EBITDA for the nine months ended September 30, 2013 grew to $50.4 million, a 3.5% increase from the $48.7 million in adjusted EBITDA generated during the nine months ended September 30, 2012. From the nine months ended September 30, 2012 to the nine months ended September 30, 2013, organic net revenues grew from $93.9 million to $126.9 million. This $33.0 million increase represented 88.1% of our consolidated net revenues growth. For further discussion regarding adjusted EBITDA, our use of this measure, the limitations of this measure and a reconciliation of adjusted EBITDA to net income, see the section titled “Selected Consolidated Financial and Other Data” on page 47.
In 2012 and the first nine months of 2013, we generated 82.9% and 79.4% of our net revenues, respectively, in the U.S. and the balance in the U.K., France, Canada, Germany and the Netherlands. As of September 30, 2013, we had 414 full-time employees and operations in the U.S., U.K., France, Germany and the Netherlands.
The below charts set forth the growth in our visits, net revenues, net income and adjusted EBITDA for the years ended December 31, 2010, 2011 and 2012:
|
|
Our Industry
We enable consumers to save money while shopping online and in-store and help retailers to drive sales and acquire new customers. The retail industry is large. According to data compiled by Euromonitor International, the worldwide retail industry, excluding grocery retailers, totaled $7.7 trillion in 2012, of which $2.9 trillion was in the markets in which we currently operate. The following trends are driving our industry:
| • | Consumers are increasingly using the Internet to inform purchase decisions and to shop online. According to the Worldwide New Media Market Model published in July 2013 by IDC, the consumer e-commerce market in 2012 was $992.6 billion globally and is projected to grow at a CAGR of 16.7% between 2012 and 2017. |
2
Table of Contents
| • | Mobile commerce is growing rapidly. The proliferation of smartphone devices and tablets makes business to consumer mobile commerce, or m-commerce, one of the fastest growing retail channels. The IDC Worldwide New Media Mobile estimates that m-commerce represented $64.5 billion globally in 2012 and expects it to grow at a 35.5% CAGR between 2012 and 2017. |
| • | Consumers have a mindset for savings. In a January 2013 article, eMarketer estimated that 48.0% of U.S. adult Internet users redeemed a digital coupon for online or offline shopping in the past year. |
| • | Retailers are focused on the return on investment, or ROI, of their marketing spend and are adopting solutions, like digital coupons, which allow them to measure and optimize the impact of their promotional campaigns. |
Consumers and retailers face various challenges that represent barriers to increased retail commerce activity, online and in-store.
Consumers face the following challenges:
| • | difficulty finding relevant coupons for the products and brands they want to purchase; |
| • | invalid or expired coupons; and |
| • | inconvenience associated with traditional coupons found in newspapers and circulars. |
Retailers face the following challenges:
| • | difficulty reaching consumers at scale; |
| • | difficulty engaging consumers across channels; and |
| • | ineffective and difficult to measure marketing solutions. |
Our Solution
We operate the world’s largest digital coupon marketplace, connecting consumers with leading retailers and brands. Consumers are able to visit a trusted destination that allows them to search for, discover and redeem digital coupons from leading retailers, online or in-store. We aggregate digital coupons from retailers, performance marketing networks, our large user community, our employees and outsourced providers. Retailers are able to drive sales and acquire new customers by effectively attracting and engaging a large audience of consumers who are shopping across multiple channels. Our solution enables retailers to better manage their customer acquisition spend and effectively measure their marketing ROI.
Solutions for Consumers
| • | Save money with a broad selection of digital coupons. In 2013, we have featured more than 500,000 digital coupons in each month from retailers and brands across multiple product categories. |
| • | Depth of digital coupon selection from leading retailers within each category. In 2012, we offered thousands of digital coupons per category. Our strong relationships with leading retailers allow us to offer digital coupons exclusive to our marketplace. |
| • | Reliability and curation of digital coupon content. We believe that we provide a high quality experience to consumers by actively monitoring and curating the most frequently visited digital coupon content in our marketplace and incorporating feedback from our large user community. Our merchandising team actively monitors the most frequently visited digital coupon content in our marketplace to ensure content quality and curates such digital coupon content by updating and changing the display and the description of digital coupons. We also provide users the ability to rank |
3
Table of Contents
| digital coupons made available through our marketplace to tell us if a digital coupon made available through our marketplace is valid or not and to submit comments about digital coupon content. Our merchandising team monitors the comments submitted by consumers for additional feedback on digital coupons, such as whether or not the description of the digital coupon contains an error, or is expired, and updates our digital coupon content accordingly. |
| • | Relevance and personalization. We keep consumers informed whenever a digital coupon from one of their preferred retailers becomes available. Consumers can sign up for alerts for digital coupons for specific retailers they have a personal affinity for that come from us via email or submit their brand “likes” and otherwise engage with us on Facebook. We then maintain and use this information to keep our users informed via email or Facebook whenever a digital coupon from one of their preferred retailers becomes available through our marketplace. |
| • | Anytime, anywhere availability and consistency of digital coupons online and in-store. Consumers can search for and discover our digital coupons at virtually any time via our websites, mobile applications, email newsletters and alerts or social media presence. |
Solutions for Retailers
| • | Access to a large consumer audience. In 2012, we had on average over 24.2 million monthly unique visitors to our websites, more traffic than the majority of our retailers’ own websites attract. |
| • | Multichannel engagement with consumers. We enable retailers and brands to consistently engage with consumers online (via our websites, mobile applications, email newsletters, email alerts and social media presence) and in-store (via mobile applications and printed coupons). We have had more than eight million mobile application downloads and have more than thirteen million email subscribers. |
| • | Trusted partnerships and strategic dialogues with retailers. We help optimize digital coupon campaigns for our paid retailers to provide a consistent, high-quality user experience, which we believe reflects positively on the brand image of these retailers. |
| • | Quantifiable, pay-for-performance model that helps retailers measure marketing ROI. Our paid retailers pay a commission to us only after a consumer has made a purchase and are able to track the performance of their digital coupons. |
Our Competitive Strengths
Global leader with scale and strong brands. According to comScore data, we are the largest web property focused on digital coupons as measured by unique visitors. Unique visitors are visitors who have visited one of our websites at least once in a given month. We believe that our strong brand recognition has allowed our marketplace to become the leading destination for consumers looking to save money on retail purchases. As a result, over 90% of traffic to our websites was generated from unpaid sources in 2012. In addition to RetailMeNot.com, our international brand portfolio includes VoucherCodes.co.uk in the U.K., Web.Bons-de-Reduction.com, Poulpeo.com and Ma-Reduc.com in France, Actiepagina.nl in the Netherlands, Deals.com in Germany and RetailMeNot.ca in Canada.
Trusted partner to leading retailers. In 2012, we maintained relationships with more than 10,000 paid retailers, including 367 of the top 500 retailers as ranked in the Internet Retailer 2012 Top 500 Guide, or the 2012 IR500. Additionally, our relationships with most of our top paid retailers are growing. Our top 500 paid retailers paid us, on average, total commission revenues of $235,544 in 2012, demonstrating growth from 2011, when we had paid relationships with 488 of these same retailers, with average total commission revenues of $121,523. During the twelve-month period ended September 30, 2013, we had paid relationships with 498 of these same retailers, with average total commission revenues of $274,811.
4
Table of Contents
Network effects. As more consumers use our marketplace, we are better able to obtain high quality digital coupons from retailers and brands, which in turn attracts a larger consumer audience.
Strong technology platform and proprietary data. Our technology platform is designed to provide the reliability and security necessary to support a large and growing base of consumers, retailers and brands in our marketplace. As engagement through our marketplace increases, we are able to collect more proprietary data on consumer shopping behavior, which allows us to further develop and improve our marketplace in order to better serve consumers and offer more value and insight to our paid retailers. Additionally, our scalable technology serves as a basis to design and support innovative solutions and to further automate and standardize our processes.
Large community of actively engaged users. We leverage our user community’s passion for savings by allowing them to submit digital coupons to our marketplace and to rank and comment on the digital coupons they find the most compelling and relevant, thereby enhancing the content made available to our broad consumer audience. We believe that this engagement by our consumers increases the quality of our content, while lowering our costs to curate and moderate that content ourselves.
Attractive business model with compelling value proposition. In the last three years, we have achieved a compelling combination of growth and profitability. From 2010 to 2012 our net revenues, net income and adjusted EBITDA grew at CAGRs of 192.9%, 233.0% and 221.7%, respectively. We believe our strong financial performance is in part a result of our mutually beneficially relationship with our paid retailers: we generate revenues on a commission basis when retailers complete a sale and consumers save money. For further discussion regarding adjusted EBITDA, our use of this measure, the limitations of this measure and a reconciliation of adjusted EBITDA to net income, see the section titled “Selected Consolidated Financial and Other Data” on page 47.
Our Growth Strategies
Our objective is to expand our position as the largest digital coupon marketplace, connecting consumers with leading retailers and brands. Our strategies to achieve this goal include:
| • | increase traffic and monetization; |
| • | grow depth of paid relationships with retailers; |
| • | enhance mobile solutions and in-store enablement; |
| • | invest in technology and innovation; |
| • | expand internationally; and |
| • | pursue strategic acquisitions. |
Risks Affecting Us
Our business is subject to a number of risks that you should understand before making an investment decision. These risks are discussed more fully in the section titled “Risk Factors” following this prospectus summary. Some of these risks are:
| • | We are an early-stage company with a limited operating history, which makes it difficult to evaluate our current business and future prospects and may increase the risk of your investment. |
| • | We depend on search engines for traffic. Changes to search engine algorithms or practices could adversely affect our ability to generate unpaid traffic, leading to lower revenues and/or increased traffic acquisition costs. |
5
Table of Contents
| • | If we are unable to retain existing retailers, expand our business with existing retailers or attract new consumers, our net revenues may not grow or could decline. |
| • | We depend on performance marketing networks as intermediaries. Factors adversely affecting our relationships with performance marketing networks may adversely affect our ability to attract and retain business and our operating results. |
| • | The market in which we participate is intensely competitive, and we may not be able to compete successfully. |
| • | If we are unsuccessful in expanding the capabilities of our digital coupon solutions for our mobile platforms to allow us to generate net revenues, our net revenues could decline. |
| • | Changes in consumer sentiment or laws, rules or regulations regarding the use of cookies and other tracking technologies and other privacy matters could have a material adverse effect on our ability to generate net revenues and could adversely affect our ability to collect proprietary data on consumer shopping behavior. |
| • | We may be sued by third parties for infringement or other violation of their intellectual or proprietary rights. |
| • | If Texas or any other jurisdiction in which we are resident implements regulations that impose sales tax on certain e-commerce or m-commerce transactions involving the use of performance marketing programs, our net revenues could decline and our business, financial condition and operating results could be adversely affected. |
Corporate Information
We were organized in May 2007 under the name smallponds LLC, which we incorporated into a corporation in September 2007, and are headquartered in Austin, Texas. Our principal executive offices are located at 301 Congress Avenue, Suite 700, Austin, Texas 78701. Our telephone number is (512) 777-2970. Our corporate website address is www.retailmenot.com. The information contained in, or that can be accessed through, our website is not part of this prospectus.
RetailMeNot, VoucherCodes.co.uk, Deals2Buy, Web.Bons-de-Reduction, Poulpeo, Ma-Reduc, Deals.com and Actiepagina.nl are trademarks or logos appearing in this prospectus owned by RetailMeNot, Inc. or one of its subsidiaries. All other trademarks, service marks and trade names appearing in this prospectus are the property of their respective owners.
6
Table of Contents
THE OFFERING
| Series 1 common stock offered by us |
shares |
| Series 1 common stock offered by selling stockholders |
shares |
| Series 1 common stock to be outstanding after this offering |
shares |
| Series 2 common stock to be outstanding after this offering |
6,107,494 shares |
| Total Series 1 and Series 2 common stock to be outstanding after this offering |
shares |
| Use of proceeds |
We intend to use the net proceeds from this offering for working capital and other general corporate purposes, including developing new technologies, funding capital expenditures or making investments in or acquisitions of other businesses, solutions or technologies. We will not receive any of the proceeds from the sale of shares by the selling stockholders. See the section titled “Use of Proceeds.” |
| Proceeds to be paid to certain affiliated parties |
In connection with this offering, our executive officers, directors, beneficial owners of 5.0% or more of our outstanding shares of capital stock, and affiliated entities, will receive approximately $ million of net proceeds from the sale of shares in this offering, after deducting underwriting discounts and commissions payable by such selling stockholders. |
| Risk Factors |
See the section titled “Risk Factors” for a discussion of factors that you should consider carefully before deciding whether to purchase shares of our Series 1 common stock. |
| Voting Rights |
Shares of Series 1 common stock are entitled to one vote per share. Shares of Series 2 common stock are also entitled to one vote per share other than with respect to the election of members of the board of directors. Shares of Series 2 common stock are convertible into an equal number of shares of Series 1 common stock at any time at the election of the holder. See the section titled “Description of Capital Stock.” |
| NASDAQ Global Select Market symbol |
SALE |
7
Table of Contents
Our fiscal year ends on December 31. Except as otherwise indicated, all information in this prospectus (i) is based upon 50,560,515 shares of Series 1 common stock and Series 2 common stock outstanding as of September 30, 2013, and (ii) excludes:
| • | 5,555,499 shares of Series 1 common stock issuable upon the exercise of options outstanding as of September 30, 2013 having a weighted-average exercise price of $10.96 per share; |
| • | 4,089,786 shares of Series 1 common stock, subject to increase on an annual basis, reserved for future issuance under our 2013 Equity Incentive Plan; and |
| • | 560,907 shares of Series 1 common stock, subject to increase on an annual basis, reserved for future issuance under our 2013 Employee Stock Purchase Plan. |
8
Table of Contents
SUMMARY CONSOLIDATED FINANCIAL AND OTHER DATA
The following tables summarize the consolidated financial and operating data for the periods indicated. The summary consolidated statements of operations data for the years ended December 31, 2010, 2011 and 2012 and the summary consolidated balance sheet data as of December 31, 2011 and 2012 have been derived from our audited consolidated financial statements included elsewhere in this prospectus. The summary consolidated statements of operations data presented below for the nine months ended September 30, 2012 and 2013 and the summary consolidated balance sheet data as of September 30, 2013 have been derived from the unaudited interim consolidated financial statements that are included elsewhere in this prospectus. Our historical results are not necessarily indicative of the results that may be expected in the future. You should read the summary financial data presented below in conjunction with our consolidated financial statements and related notes and the sections titled “Selected Consolidated Financial and Other Data” and “Management’s Discussion and Analysis of Financial Condition and Results of Operations.”
| Year Ended December 31, | Nine Months Ended September 30, |
|||||||||||||||||||
| 2010 | 2011 | 2012 | 2012 | 2013 | ||||||||||||||||
| (in thousands, except per share amounts) | ||||||||||||||||||||
| Consolidated Statements of Operations Data: |
| |||||||||||||||||||
| Net revenues |
$ | 16,862 | $ | 80,402 | $ | 144,685 | $ | 93,895 | $ | 131,312 | ||||||||||
| Costs and expenses: |
||||||||||||||||||||
| Cost of net revenues |
1,848 | 3,980 | 9,113 | 6,475 | 8,735 | |||||||||||||||
| Product development |
658 | 4,388 | 14,481 | 9,326 | 21,103 | |||||||||||||||
| Sales and marketing |
5,661 | 15,341 | 40,672 | 22,543 | 40,974 | |||||||||||||||
| General and administrative |
2,472 | 6,883 | 15,758 | 10,777 | 19,919 | |||||||||||||||
| Amortization of purchased intangible assets |
3,394 | 11,296 | 13,158 | 10,244 | 8,673 | |||||||||||||||
| Other operating expenses |
— | 35 | 6,006 | 2,611 | 1,299 | |||||||||||||||
|
|
|
|
|
|
|
|
|
|
|
|||||||||||
| Total costs and expenses |
14,033 | 41,923 | 99,188 | 61,976 | 100,703 | |||||||||||||||
|
|
|
|
|
|
|
|
|
|
|
|||||||||||
| Income from operations |
2,829 | 38,479 | 45,497 | 31,919 | 30,609 | |||||||||||||||
| Other income (expense): |
||||||||||||||||||||
| Interest expense, net |
(930 | ) | (7,784 | ) | (3,221 | ) | (2,519 | ) | (2,410 | ) | ||||||||||
| Fair value change of common stock warrant |
— | (2,103 | ) | — | — | — | ||||||||||||||
| Fair value change of contingent consideration, net |
1,994 | — | — | — | — | |||||||||||||||
| Other income (expense), net |
(16 | ) | (129 | ) | 77 | 49 | 451 | |||||||||||||
|
|
|
|
|
|
|
|
|
|
|
|||||||||||
| Income before income taxes |
3,877 | 28,463 | 42,353 | 29,449 | 28,650 | |||||||||||||||
| Provision for income taxes |
(1,533 | ) | (11,502 | ) | (16,360 | ) | (11,201 | ) | (10,959 | ) | ||||||||||
|
|
|
|
|
|
|
|
|
|
|
|||||||||||
| Net income |
$ | 2,344 | $ | 16,961 | $ | 25,993 | $ | 18,248 | $ | 17,691 | ||||||||||
|
|
|
|
|
|
|
|
|
|
|
|||||||||||
| Preferred stock dividends on participating preferred stock |
(3,247 | ) | (64,715 | ) | (24,577 | ) | (18,388 | ) | (19,928 | ) | ||||||||||
|
|
|
|
|
|
|
|
|
|
|
|||||||||||
| Total undistributed earnings (loss) |
(903 | ) | (47,754 | ) | 1,416 | (140 | ) | (2,237 | ) | |||||||||||
| Undistributed earnings allocated to participating preferred stock |
— | — | (1,390 | ) | — | — | ||||||||||||||
|
|
|
|
|
|
|
|
|
|
|
|||||||||||
| Net income (loss) attributable to common stockholders |
$ | (903 | ) | $ | (47,754 | ) | $ | 26 | $ | (140 | ) | $ | (2,237 | ) | ||||||
|
|
|
|
|
|
|
|
|
|
|
|||||||||||
| Net income (loss) per share attributable to common stockholders: |
||||||||||||||||||||
| Basic and diluted |
$ | (1.27 | ) | $ | (64.19 | ) | $ | 0.03 | $ | (0.17 | ) | $ | (0.16 | ) | ||||||
|
|
|
|
|
|
|
|
|
|
|
|||||||||||
| Weighted-average number of shares used in computing net income (loss) per share: |
||||||||||||||||||||
| Basic |
709 | 744 | 841 | 821 | 13,703 | |||||||||||||||
|
|
|
|
|
|
|
|
|
|
|
|||||||||||
| Diluted |
709 | 744 | 2,277 | 821 | 13,703 | |||||||||||||||
|
|
|
|
|
|
|
|
|
|
|
|||||||||||
9
Table of Contents
| Year Ended December 31, | Nine Months Ended September 30, |
|||||||||||||||||||
| 2010 | 2011 | 2012 | 2012 | 2013 | ||||||||||||||||
| Consolidated Statements of Operations as Percentage of Net Revenues: |
||||||||||||||||||||
| Net revenues |
100.0 | % | 100.0 | % | 100.0 | % | 100.0 | % | 100.0 | % | ||||||||||
| Costs and expenses: |
||||||||||||||||||||
| Cost of net revenues |
11.0 | 5.0 | 6.3 | 6.9 | 6.7 | |||||||||||||||
| Product development |
3.9 | 5.5 | 10.0 | 9.9 | 16.1 | |||||||||||||||
| Sales and marketing |
33.6 | 19.1 | 28.1 | 24.0 | 31.2 | |||||||||||||||
| General and administrative |
14.7 | 8.6 | 10.9 | 11.5 | 15.2 | |||||||||||||||
| Amortization of purchased intangible assets |
20.1 | 14.0 | 9.1 | 10.9 | 6.6 | |||||||||||||||
| Other operating expenses |
— | — | 4.2 | 2.8 | 0.9 | |||||||||||||||
|
|
|
|
|
|
|
|
|
|
|
|||||||||||
| Total costs and expenses |
83.3 | 52.2 | 68.6 | 66.0 | 76.7 | |||||||||||||||
|
|
|
|
|
|
|
|
|
|
|
|||||||||||
| Income from operations |
16.7 | 47.8 | 31.4 | 34.0 | 23.3 | |||||||||||||||
| Other income (expense): |
||||||||||||||||||||
| Interest expense, net |
(5.5 | ) | (9.7 | ) | (2.2 | ) | (2.7 | ) | (1.8 | ) | ||||||||||
| Fair value change of common stock warrant |
— | (2.6 | ) | — | — | — | ||||||||||||||
| Fair value change of contingent consideration, net |
11.8 | — | — | — | — | |||||||||||||||
| Other income (expense), net |
(0.1 | ) | (0.2 | ) | 0.1 | 0.1 | 0.3 | |||||||||||||
|
|
|
|
|
|
|
|
|
|
|
|||||||||||
| Income before income taxes |
22.9 | 35.3 | 29.3 | 31.4 | 21.8 | |||||||||||||||
| Provision for income taxes |
(9.1 | ) | (14.3 | ) | (11.3 | ) | (12.0 | ) | (8.3 | ) | ||||||||||
|
|
|
|
|
|
|
|
|
|
|
|||||||||||
| Net income |
13.8 | % | 21.0 | % | 18.0 | % | 19.4 | % | 13.5 | % | ||||||||||
|
|
|
|
|
|
|
|
|
|
|
|||||||||||
| As of December 31, | As of September 30, 2013 |
|||||||||||
| 2011 | 2012 | |||||||||||
| (dollars in thousands) | ||||||||||||
| Consolidated Balance Sheet Data: |
||||||||||||
| Cash and cash equivalents |
$ | 88,234 | $ | 97,142 | $ | 136,408 | ||||||
| Working capital |
78,631 | 98,152 | 141,122 | |||||||||
| Total assets |
347,326 | 370,920 | 432,171 | |||||||||
| Total liabilities |
74,817 | 63,266 | 69,725 | |||||||||
| Redeemable convertible preferred stock |
321,450 | 349,027 | — | |||||||||
| Total stockholders’ equity (deficit) |
(48,941 | ) | (41,373 | ) | 362,446 | |||||||
| Year Ended December 31, | Nine Months Ended September 30, |
|||||||||||||||||||
| 2010 | 2011 | 2012 | 2012 | 2013 | ||||||||||||||||
| (in thousands, except net revenues per visit) | ||||||||||||||||||||
| Operating Metrics:(1) |
||||||||||||||||||||
| Visits |
108,574 | 349,992 | 464,240 | 315,802 | 376,289 | |||||||||||||||
| Net revenues per visit |
$ | 0.16 | $ | 0.23 | $ | 0.31 | $ | 0.30 | $ | 0.35 | ||||||||||
| Year Ended December 31, | Nine Months Ended September 30, |
|||||||||||||||||||
| 2010 | 2011 | 2012 | 2012 | 2013 | ||||||||||||||||
| (dollars in thousands) | ||||||||||||||||||||
| Other Financial Data: |
||||||||||||||||||||
| Adjusted EBITDA(2) |
$ | 6,800 | $ | 51,895 | $ | 70,373 | $ | 48,657 | $ | 50,357 | ||||||||||
| (1) | See the section titled “Management’s Discussion and Analysis of Financial Condition and Results of Operations—Key Financial and Operating Metrics” on page 54 for a description of these operating metrics. |
10
Table of Contents
| (2) | We define adjusted EBITDA as net income plus depreciation, amortization of intangible assets, stock-based compensation expense, third party acquisition-related costs, other non-cash operating expenses (including asset impairment charges and compensation-related charges associated with seller notes issued in connection with acquisitions), net interest expense, other non-operating income or expense (including changes in fair value of warrant liabilities and contingent consideration) and income taxes, net of any foreign exchange income or expense. |
The following table presents a reconciliation of adjusted EBITDA to net income for each of the periods indicated:
| Year Ended December 31, | Nine Months Ended September 30, |
|||||||||||||||||||
| 2010 | 2011 | 2012 | 2012 | 2013 | ||||||||||||||||
| (dollars in thousands) | ||||||||||||||||||||
| Reconciliation of Adjusted EBITDA: |
||||||||||||||||||||
| Net income |
$ | 2,344 | $ | 16,961 | $ | 25,993 | $ | 18,248 | $ | 17,691 | ||||||||||
| Depreciation and amortization expense |
3,460 | 11,556 | 14,192 | 10,938 | 10,076 | |||||||||||||||
| Stock-based compensation expense |
68 | 471 | 4,048 | 2,559 | 7,068 | |||||||||||||||
| Third-party acquisition-related costs |
443 | 1,354 | 630 | 630 | 1,305 | |||||||||||||||
| Other operating expenses |
— | 35 | 6,006 | 2,611 | 1,299 | |||||||||||||||
| Interest expense, net |
930 | 7,784 | 3,221 | 2,519 | 2,410 | |||||||||||||||
| Fair value change of common stock warrant |
— | 2,103 | — | — | — | |||||||||||||||
| Fair value change of contingent consideration, net |
(1,994 | ) | — | — | — | — | ||||||||||||||
| Other (income) expense, net |
16 | 129 | (77 | ) | (49 | ) | (451 | ) | ||||||||||||
| Provision for income taxes |
1,533 | 11,502 | 16,360 | 11,201 | 10,959 | |||||||||||||||
|
|
|
|
|
|
|
|
|
|
|
|||||||||||
| Adjusted EBITDA |
$ | 6,800 | $ | 51,895 | $ | 70,373 | $ | 48,657 | $ | 50,357 | ||||||||||
|
|
|
|
|
|
|
|
|
|
|
|||||||||||
The following tables present depreciation and stock-based compensation expense as included in the various lines of our consolidated statements of operations:
| Year Ended December 31, | Nine Months Ended September 30, |
|||||||||||||||||||
| 2010 | 2011 | 2012 | 2012 | 2013 | ||||||||||||||||
| (dollars in thousands) | ||||||||||||||||||||
| Depreciation Expense: |
||||||||||||||||||||
| Cost of net revenues |
$ | 16 | $ | 62 | $ | 99 | $ | 45 | $ | 199 | ||||||||||
| Product development |
12 | 74 | 380 | 236 | 570 | |||||||||||||||
| Sales and marketing |
27 | 84 | 382 | 302 | 417 | |||||||||||||||
| General and administrative |
11 | 40 | 173 | 111 | 217 | |||||||||||||||
|
|
|
|
|
|
|
|
|
|
|
|||||||||||
| Total depreciation expense |
$ | 66 | $ | 260 | $ | 1,034 | $ | 694 | $ | 1,403 | ||||||||||
|
|
|
|
|
|
|
|
|
|
|
|||||||||||
| Year Ended December 31, | Nine Months Ended September 30, |
|||||||||||||||||||
| 2010 | 2011 | 2012 | 2012 | 2013 | ||||||||||||||||
| (dollars in thousands) | ||||||||||||||||||||
| Stock-Based Compensation Expense: |
||||||||||||||||||||
| Cost of net revenues |
$ | 1 | $ | 23 | $ | 157 | $ | 81 | $ | 449 | ||||||||||
| Product development |
12 | 164 | 1,144 | 713 | 1,641 | |||||||||||||||
| Sales and marketing |
23 | 113 | 993 | 592 | 1,568 | |||||||||||||||
| General and administrative |
32 | 171 | 1,754 | 1,173 | 3,410 | |||||||||||||||
|
|
|
|
|
|
|
|
|
|
|
|||||||||||
| Total stock-based compensation expense |
$ | 68 | $ | 471 | $ | 4,048 | $ | 2,559 | $ | 7,068 | ||||||||||
|
|
|
|
|
|
|
|
|
|
|
|||||||||||
11
Table of Contents
Non-GAAP Financial Measures
Adjusted EBITDA
To provide investors with additional information regarding our financial results, we have disclosed in the table above and elsewhere in this prospectus adjusted EBITDA, a non-GAAP financial measure. We have provided a reconciliation above of adjusted EBITDA to net income, the most directly comparable GAAP financial measure.
We have included adjusted EBITDA in this prospectus because it is a key measure used by our management and board of directors to understand and evaluate our operating performance for the following reasons:
| • | our management uses adjusted EBITDA in conjunction with GAAP financial measures as part of our assessment of our business and in communications with our board of directors concerning our financial performance; |
| • | our management and board of directors use adjusted EBITDA in establishing budgets, operational goals and as an element in determining executive compensation; |
| • | adjusted EBITDA provides consistency and comparability with our past financial performance, facilitates period-to-period comparisons of operations that could otherwise be masked by the effect of the expenses that we exclude in this non-GAAP financial measure and facilitates comparisons with other peer companies, many of which use similar non-GAAP financial measures to supplement their GAAP results; |
| • | securities analysts use a measure similar to our adjusted EBITDA as a supplemental measure to evaluate the overall operating performance and comparison of companies, and we include adjusted EBITDA in our investor and analyst presentations; and |
| • | adjusted EBITDA excludes non-cash charges, such as depreciation, amortization and stock-based compensation, because such non-cash expenses in any specific period may not directly correlate to the underlying performance of our business operations and can vary significantly between periods. |
Adjusted EBITDA has limitations as an analytical tool, and you should not consider it in isolation or as a substitute for analysis of our results as reported under GAAP. Some of these limitations are:
| • | although depreciation and amortization are non-cash charges, the assets being depreciated and amortized may have to be replaced in the future, and adjusted EBITDA does not reflect cash capital expenditure requirements for such replacements or for new capital expenditure requirements; |
| • | adjusted EBITDA excludes stock-based compensation expense which has been, and will continue to be for the foreseeable future, a significant recurring expense in our business and is an important part of our employees’ compensation; |
| • | adjusted EBITDA does not reflect changes in, or cash requirements for, our working capital needs; |
| • | adjusted EBITDA does not reflect tax payments that may represent a reduction in cash available to us; and |
| • | other companies, including companies in our industry, may calculate adjusted EBITDA differently, which reduces its usefulness as a comparative measure. |
Because of these limitations, you should consider adjusted EBITDA alongside other financial performance measures, including various cash flow metrics, net income and our other GAAP results.
12
Table of Contents
An investment in our Series 1 common stock involves a high degree of risk. You should carefully consider the risks and uncertainties described below and all other information contained in this prospectus before deciding whether to purchase shares of our Series 1 common stock. Our business, prospects, financial condition or operating results could be materially adversely affected by any of these risks, as well as other risks not currently known to us or that are currently considered immaterial. The trading price of our Series 1 common stock could decline due to any of these risks, and you may lose all or part of your investment. In assessing these risks, you should also refer to the other information contained in this prospectus, including our consolidated financial statements and related notes, before deciding to purchase any shares of our Series 1 common stock.
Risks Related to Our Business
We are an early-stage company with a limited operating history, which makes it difficult to evaluate our current business and future prospects and may increase the risk of your investment.
We began our operations in September 2007 and did not enter the digital coupons industry until late 2009. Our limited operating history may make it difficult to evaluate our current business and our future prospects. We have encountered and will continue to encounter risks and difficulties frequently experienced by growing companies in rapidly changing industries, including challenges in accurate financial planning and forecasting. You should consider our business and prospects in light of the risks and difficulties we may encounter as an early-stage company.
If we are unable to continue to attract visitors to our websites from search engines, then consumer traffic to our websites could decrease, which could negatively impact the number of purchases generated for our retailers through our marketplace, and therefore negatively impact our ability to maintain or grow our net revenues and profitability.
We generate consumer traffic to our websites using various methods, including search engine marketing, or SEM, search engine optimization, or SEO, email campaigns and social media referrals. Our net revenues and profitability levels are dependent upon our continued ability to use a combination of these methods to generate consumer traffic to our websites in a cost-efficient manner. We have experienced and continue to experience fluctuations in search result rankings for a number of our websites. There can be no assurances that we will be able to grow or maintain current levels of consumer traffic to our websites.
Our SEM and SEO techniques have been developed to work with existing search algorithms utilized by the major search engines. Major search engines frequently modify their search algorithms. Changes in these algorithms could cause our websites to receive less favorable placements, which could reduce the number of users who visit our websites. We may be unable to modify our SEM and SEO strategies in response to any future search algorithm changes made by the major search engines, which could require a change in the strategy we use to generate consumer traffic to our websites.
In addition, websites must comply with search engine guidelines and policies. These guidelines and policies are complex and may change at any time. If we fail to follow such guidelines and policies properly, search engines may rank our content lower in search results or could remove our content altogether from their indices. If we fail to understand and comply with these guidelines, our SEO strategy may become unsuccessful.
If we are listed less prominently or fail to appear in search result listings for any reason, including as a result of our failure to successfully execute our SEM and SEO strategies, or our failure to comply with search engine guidelines and policies, it is likely that the number of visitors to our websites will decline. Any such decline in consumer traffic to our websites could adversely impact the number of purchases we generate for our retailers, which could adversely affect our net revenues. We may not be able to replace this traffic with the same volume
13
Table of Contents
of visitors or in the same cost-effective manner from other channels, such as cost-per-click search engine marketing or display or other advertising, or at all. An attempt to replace this traffic through other channels may require us to increase our sales and marketing expenditures, which would adversely affect our operating results and which may not be offset by additional net revenues.
If we are unable to retain our existing retailers, expand our business with existing retailers or attract new retailers and consumers, our net revenues could decline.
Our ability to continue to grow our net revenues will depend in large part on expanding our business with existing retailers and attracting new retailers. The number of our current retailers may not expand materially beyond our existing base and may decline. Furthermore, even for our largest retailers, the amount they pay us is typically only a small fraction of their overall advertising budget. Retailers may view their spend with us as experimental and may either reduce or terminate their spend with us if they determine a superior alternative for generating sales. In addition, retailers may determine that distributing digital coupons through our platform results in undesirably broad distribution of their coupons or otherwise does not provide a compelling value proposition. Some retailers have demanded that we remove digital coupons relating to their products or services from our websites, and we anticipate that some retailers will do so in the future. Retailers also may reduce the commission rates they pay to us for sales our websites facilitate. If we are unable to negotiate favorable terms with current or new retailers in the future, including the commission rates they pay us, our operating results will be adversely affected. Additionally, retailers may fail to pay the performance marketing networks the fees the retailers owe, which is a prerequisite to us receiving our commissions from the networks.
Retailers do not enter into long-term obligations with us requiring them to use our solutions and their contracts with us are cancelable upon short or no notice and without penalty. We cannot be sure that our retailers will continue to use our solutions or that we will be able to replace retailers that do not renew their campaigns with new ones generating comparable revenues.
If we are unable to attract new consumers and maintain or increase consumer traffic to our websites, new retailers may choose not to use, and existing retailers may not continue to use, our solutions for their promotional campaigns, and our volume of new digital coupon inventory may suffer as the perceived usefulness of our marketplace declines. If our existing retailers do not continue to use our solutions for their promotional campaigns, or if we are unable to attract and expand the amount of business we do with new retailers, our sales will decrease and our operating results will be adversely affected.
We are highly dependent on performance marketing networks as intermediaries. Factors adversely affecting our relationships with performance marketing networks, or the termination of these networks, may adversely affect our ability to attract and retain business and our operating results.
Most of our net revenues comes from commissions earned for promoting digital coupons on behalf of retailers. Often, the commissions we earn are tracked and paid by performance marketing networks. For 2012, 96.4% of our net revenues came from retailers that pay us through performance marketing networks, primarily Commission Junction, LinkShare and Google Affiliate Network. Performance marketing networks provide retailers with affiliate tracking links for revenues attribution to publishers and the ability to distribute digital coupon content to multiple publishers. We do not have exclusive relationships with performance marketing networks. They do not enter into long-term commitments to us allowing us to use their solutions, and their contracts with us are cancelable upon short or no notice and without penalty.
Our sales could be adversely impacted by industry changes relating to the use of performance marketing networks. For example, if retailers seek to bring the distribution of their digital coupon content in-house rather than using a performance marketing network, we would need to develop relationships with more retailers directly, which we might not be able to do and which could increase our sales, marketing and product expenses. Additionally, we face challenges associated with consumers’ increasing use of mobile devices to complete their
14
Table of Contents
online purchases. For example, many retailers currently do not recognize affiliate tracking links on their mobile-optimized websites or applications, and tracking mechanisms on mobile websites or applications may not function to allow retailers to properly attribute sales to us. As a result, we may not receive commission revenues when a consumer makes a purchase from their mobile device on a retailer’s mobile-optimized website after clicking through a digital coupon displayed on one of our websites or mobile applications if the retailer’s mobile monetization mechanisms are not enabled.
Moreover, as a result of dealing primarily with performance marketing networks, we have less of a direct relationship with retailers than would be the case if we dealt directly with retailers. The presence of performance marketing networks as intermediaries between us and retailers creates a challenge to building our own brand awareness and affinity with retailers. Additionally, in the event that our relationship with a performance marketing network were to terminate, our mechanism for receiving payments from the retailers we service through that network would terminate, which could materially and adversely impact our net revenues.
Some performance marketing networks that we work with could be considered our competitors because they also offer some components of our solution, including publishing digital coupons on their own websites. If they further develop these capabilities, they may offer their own competitive solutions to retailers and, as a result, our ability to compete effectively could be significantly compromised and our business and operating results could be adversely affected.
If retailers alter the way they attribute credit to publishers in their performance marketing programs, our net revenues could decline and our operating results could be adversely affected.
Retailers often advertise and market digital coupons through performance marketing programs, a type of performance-based marketing in which a retailer rewards one or more publishers for each visitor or customer generated by the publisher’s own marketing efforts. When a consumer executes a purchase on a retailer’s website as a result of a performance marketing program, most performance marketing conversion tracking tools credit the most recent link or ad clicked by the consumer prior to that purchase. This practice is generally known as “last-click attribution.” We generate the vast majority of our net revenues through transactions for which we receive last-click attribution. In recent years, some retailers have sought, and in some cases adopted, alternatives to last-click attribution. These alternatives are primarily “first-click attribution,” which credits the first link or ad clicked by a consumer prior to executing a purchase, or “multichannel attribution,” which applies weighted values to each of a retailer’s advertisements and tracks how each of those advertisements contributed to a purchase. If retailers widely adopt first-click attribution, multichannel attribution or otherwise alter the ways they attribute credit for purchases to us, and if we are unable to adapt our business practices to such alterations, our net revenues could decline and our business, financial condition and operating results could be adversely affected.
The market in which we participate is intensely competitive, and we may not be able to compete successfully.
The market for digital coupon solutions is highly competitive, fragmented and rapidly changing. Our competition for traffic from consumers seeking to save money on online or in-store purchases includes digital coupon websites and mobile applications, cash back and loyalty websites, retailers, search engines, social networks, comparison shopping websites, newspapers and direct mail campaigns. Our competition for retailer marketing spend includes digital coupon sites that offer a pay-for-performance model, search engines and social networks that compete for online advertising spend and television, magazines and newspapers that compete for offline advertising spend. With the introduction of new technologies and the influx of new entrants to the market, we expect competition to persist and intensify in the future, which could harm our ability to increase sales and maintain our profitability. We also expect competition in e-commerce generally, and digital coupon solutions in particular, to continue to increase because there are no significant barriers to entry. A substantial number of digital coupon websites, including those that attempt to replicate our business model, have emerged globally. In addition to such competitors, we are experiencing increasing competition from other large businesses that offer digital coupons similar to ours as an add-on to their core business. For example, Groupon and Living Social are
15
Table of Contents
now offering digital coupons, and Google and PayPal are now offering digital coupons for in-store purchases. We also expect to compete against other Internet sites that serve niche markets and interests. In addition, we compete with traditional offline coupon and discount services, as well as newspapers, magazines and other traditional media companies that provide coupons and discounts on products and services.
Our success depends on the breadth, depth, quality and reliability of our digital coupon selection, as well as our continued innovation and ability to provide features that make our marketplace useful and appealing to consumers. If we are unable to develop quality features that consumers want to use, then consumers may become dissatisfied with our marketplace and elect to use the offerings of one of our competitors, which could adversely affect our operating results.
Certain of our larger potential competitors may have the resources to significantly change the nature of the digital coupon industry to their advantage, which could materially disadvantage us. For example, Google, PayPal, Yahoo!, Bing and Facebook have widely adopted industry platforms which they could leverage to distribute digital coupons that could be disadvantageous to our competitive position.
Our current and potential competitors may have significantly more financial, technical, marketing and other resources than we have, be able to devote greater resources to the development, promotion, sale and support of their products and services, have more extensive consumer bases and deeper relationships, and may have longer operating histories and greater name recognition than we have. As a result, these competitors may be better able to respond quickly to new technologies, develop deeper retailer relationships or offer services at lower prices. Any of these developments would make it more difficult for us to sell our solutions and could result in increased pricing pressure, reduced profit margins, increased sales and marketing expenses or the loss of market share.
In the traditional coupon landscape, our primary competitors for advertising spend include publishers of printable coupons. Many of these competitors have significant consumer reach, well-developed retailer relationships, and much larger financial resources and longer operating histories than we have.
We also directly and indirectly compete with retailers for consumer traffic. Many retailers market and offer their own digital coupons directly to consumers using their own websites, email newsletter and alerts, mobile applications, social media presence and other distribution channels. Our retailers could be more successful than we are at marketing their own digital coupons or could decide to terminate their relationship with us because they no longer want to pay us to compete against them.
We may face competition from companies we do not yet know about. If existing or new companies develop, market or resell competitive digital coupon solutions, acquire one of our existing competitors or form a strategic alliance with one of our competitors, our ability to compete effectively could be significantly compromised and our operating results could be harmed.
We have experienced rapid growth in recent periods. If we fail to manage our growth, our financial performance may suffer.
We have expanded our overall business, consumer traffic, paid retailers, employee headcount and operations in recent periods. We increased our total number of full-time employees and contractors from 35 as of December 31, 2010 to 414 as of September 30, 2013. We have also established or acquired operations in other countries. In 2011, we acquired the business of VoucherCodes.co.uk, which is based in the U.K. In 2012, we acquired Web.Bons-de-Reduction.com and Poulpeo.com, which are based in France, and relaunched Deals.com in Germany. In March 2013, we acquired Actiepagina.nl, which is based in the Netherlands. In July 2013, we acquired Ma-Reduc.com, which is based in France. In most of these instances, we previously had no presence in these countries. Our business is becoming increasingly complex, especially in light of the number of acquisitions we have integrated and are in the process of integrating. Our limited operating history, reliance on multiple websites and brands and our rapid expansion have placed, and will continue to place, a significant strain on our managerial, operational, product development, sales and marketing, administrative, financial and other resources.
16
Table of Contents
We expect to continue to increase headcount and to hire more specialized personnel in the future. We will need to continue to hire, train and manage additional qualified website developers, software engineers, partner management personnel and sales and marketing staff in order to improve and maintain our technology to properly manage our growth. If our new hires perform poorly, if we are unsuccessful in hiring, training, managing and integrating these new employees or if we are not successful in retaining our existing employees, our business may be harmed.
Further, to accommodate our expected growth we must add new hardware and software and improve and maintain our technology, systems and network infrastructure. Failure to effectively upgrade our technology or network infrastructure to support our expected increases in traffic volume could result in unanticipated system disruptions, slow response times or poor experiences for consumers. To manage the expected growth of our operations and personnel and to support financial reporting requirements as a public company, we will need to improve our transaction processing and reporting, operational and financial systems, procedures and controls. These improvements will be particularly challenging if we acquire new operations with different back-end systems. For example, we are in the process of converting the method of collecting a substantial portion of the data necessary to record our net revenues. Our current and planned personnel, systems, procedures and controls may not be adequate to support our future operations. If we are unable to manage our growth successfully and hire additional qualified personnel in an efficient manner, our business, financial conditions and operating results could be adversely affected.
We experience quarterly fluctuations in our operating results due to a number of factors that make our future results difficult to predict and could cause our operating results to fall below expectations or our guidance.
Our business is subject to seasonal fluctuations. Specifically, our net revenues are traditionally strongest in the third and fourth quarters of each year due to increases in holiday shopping. Conversely, our first and second quarter net revenues are typically lower.
Since the majority of our expenses are personnel-related and include salaries and stock-based compensation, benefits and incentive-based compensation plan expenses, we have not experienced significant seasonal fluctuations in the timing of our expenses from period to period other than increases in discretionary advertising and promotional spending during the third and fourth quarter holiday shopping period. We plan to continue to increase our investment in sales and marketing and product development substantially as we seek to leverage our solution to capitalize on what we see as a growing global opportunity. We also expect that our general and administrative expenses will increase both to support our growing operations and manage increased costs of operating as a public company. For the foregoing reasons or other reasons we may not anticipate, historical patterns should not be considered indicative of our future sales activity, expenditure levels or performance.
Factors that may affect our quarterly operating results include the following:
| • | the number and quality of the digital coupons on our websites and mobile applications; |
| • | consumer visits to our websites and use of our mobile applications, and purchases of retail products by consumers resulting from those visits; |
| • | the success and costs of our online advertising and marketing initiatives, including advertising costs for paid search keywords that we deem relevant to our business; |
| • | the levels of compensation that retailers are willing to pay us to attract customers; |
| • | the amount that consumers spend when they make purchases using the digital coupons we provide; |
| • | market acceptance of our current and future solutions, including our ability to sell additional solutions to existing retailers and to add new retailers to our business in multiple regions around the world; |
| • | overall levels of consumer spending; |
17
Table of Contents
| • | the budgeting cycles of our retailers; |
| • | the cyclical and discretionary nature of marketing spend and any resulting changes in the number and quality of digital coupons that retailers choose to offer; |
| • | changes in the competitive dynamics of the digital coupon industry, including consolidation among competitors, performance marketing networks or customers, and our reputation and brand strength relative to our competitors; |
| • | the response of consumers to our digital coupon content; |
| • | our ability to control costs, including our operating expenses; |
| • | network outages, errors in our solutions or security breaches and any associated expenses and collateral effects; |
| • | our ability to achieve the growth rate that was anticipated by us in setting our operating and capital expense budgets; |
| • | foreign currency exchange rate fluctuations, as our foreign sales and costs are denominated in local currencies; |
| • | costs related to acquisitions or licensing of, or investments in, products, services, technologies or other businesses and our ability to integrate and manage any acquisitions successfully; and |
| • | general economic and political conditions in our domestic and international markets. |
As a result of these and other factors, we have a limited ability to forecast the amount of future net revenues and expenses, and our operating results may vary from quarter to quarter and may fall below our estimates or the expectations of public market analysts and investors. Fluctuations in our quarterly operating results may lead analysts to change their long-term models for valuing our common stock, cause us to face short-term liquidity issues, impact our ability to retain or attract key personnel or cause other unanticipated issues, all of which could cause our stock price to decline. As a result of the potential variations in our quarterly net revenues and operating results, we believe that quarter-to-quarter comparisons of our net revenues and operating results may not be meaningful and the results of any one quarter should not be relied upon as an indication of future performance.
If online commerce does not continue to grow, or contracts, our business may suffer.
The business of selling goods and services over the Internet, and the use of digital coupons in those transactions, is dynamic and relatively new. Concerns about fraud, privacy and other challenges may discourage additional consumers from adopting the Internet as a medium of commerce. Acquiring new customers for our marketplace and increasing consumer traffic may become more difficult and costly than it has been in the past, particularly in markets where our marketplace has been available for some time. In order to increase consumer traffic to our websites and use of our mobile applications, we must appeal to consumers who historically have used traditional means of commerce to purchase goods and services and may prefer alternatives to our websites, such as the retailer’s own website. If these consumers prove to be less active than consumers who are already providing traffic to our websites, or we are unable to gain efficiencies in our operating costs, including our cost of increasing consumer traffic to our websites, our business could be adversely impacted. Furthermore, to the extent that weak economic conditions cause consumer spending to decline or cause our customers and potential customers to freeze or reduce their marketing budgets, particularly in the online retail market, demand for our solutions may be negatively affected.
If we are not able to maintain a positive perception of the content available through our marketplace, maintain and enhance our RetailMeNot brand and the brands associated with each of our other websites, our reputation and business may suffer.
A decrease in the quality of the digital coupons available through our marketplace could harm our reputation and damage our ability to attract and retain consumers and retailers, which could adversely affect our business.
18
Table of Contents
Additionally, maintaining and enhancing our RetailMeNot brand and the brands of each of our other websites are critical to our ability to attract new retailers and consumers to our marketplace, generate net revenues and successfully introduce new solutions. We may not be able to successfully build our RetailMeNot brand in the U.S. without losing some or all of the value associated with, or decreasing the effectiveness of, our other brands. We expect that the promotion of our brands will require us to make substantial investments and as our market becomes more competitive, these branding initiatives may become increasingly difficult and expensive. The successful promotion of our brands will depend largely on our marketing and public relations efforts. If we do not successfully maintain and enhance our brands, we could lose consumer traffic, which could, in turn, cause retailers to terminate or reduce the extent of their relationship with us. Our brand promotion activities may not be successful or may not yield net revenues sufficient to offset this cost, which could adversely affect our reputation and business.
Our business model depends upon digital coupon inventory that we do not own or otherwise control, and the failure to maintain sufficient inventory or quality of the digital coupons available on our websites may adversely affect our perceived value by consumers and therefore retailers.
Our success depends on our ability to provide consumers with the digital coupons they seek. The vast majority of our revenues come from arrangements in which we are paid by retailers to promote their digital coupons. Additionally, approximately one-third of the digital coupons on our websites are submitted by users. Therefore, we do not own or control the inventory of content upon which our business depends. Because a large number of our digital coupons are submitted by users, our efforts to ensure the quality and reliability of those digital coupons are critical to our success. From time to time consumers submit complaints that our digital coupons are invalid or expired. If our algorithms and automated processes for sorting user-submitted digital coupons are ineffective, or if our employees responsible for manual review and curation of user-submitted digital coupons are unable to effectively select and sort the digital coupons that are reliable and most appealing to our users, we may be unable meet the needs of consumers and our operating results may be adversely affected.
Retailers have a variety of channels through which to promote their products and services. If these retailers elect to promote their coupons and discounts through other channels or not to promote coupons or discounts at all, or if our competitors are willing to accept lower commissions than we are to promote these digital coupons, our ability to obtain content may be impeded and our business, financial condition and operating results will be adversely affected. Similarly, if users do not contribute digital coupons to our websites, or if they contribute digital coupons that are not attractive or reliable, the digital coupon inventory in our marketplace may decrease or become less valuable to consumers. If we cannot maintain sufficient digital coupon inventory in our marketplace, consumers may perceive our marketplace as less relevant, consumer traffic to our websites and use of our mobile applications will decline and, as a result, our business, financial condition and operating results will be adversely affected.
Consumers are increasingly using mobile devices to access our content and if we are unsuccessful in expanding the capabilities of our digital coupon solutions for our mobile platforms to allow us to generate net revenues as effectively as our desktop platforms, our net revenues could decline.
Web usage and the consumption of digital content are increasingly shifting to mobile platforms such as smartphones and other connected devices. Industry-wide solutions to monetize digital coupon content effectively on these platforms are at an early stage of development and the future demand and growth prospects for digital coupon content on these mobile platforms is uncertain.
The growth of our business depends in part on our ability to deliver compelling solutions to retailers through these new mobile marketing channels. Our success on mobile platforms will be dependent on our interoperability with popular mobile operating systems that we do not control, such as Android, iOS and Windows Mobile, and any changes in such systems that degrade our functionality or give preferential treatment to competitive services could adversely affect usage of our services through mobile devices.
19
Table of Contents
Further, to deliver high quality mobile offerings, it is important that our solutions integrate with a range of other mobile technologies, systems, networks and standards that we do not control. We may not be successful in developing relationships with key participants in the mobile industry or in developing products that operate effectively with these technologies, systems, networks or standards. For example, many retailers today do not recognize affiliate tracking links on their mobile websites, and affiliate tracking links on mobile websites may not function to allow retailers’ sales to be attributed to us. As a result, we may not receive commission revenues when a consumer executes a purchase on the retailer’s platform after clicking through a digital coupon displayed on our mobile website or in our mobile applications. If retailers fail to recognize affiliate tracking links on their mobile websites, or affiliate tracking links on mobile websites do not function to allow retailers’ sales to be attributed to us and our mobile traffic continues to increase or represent a higher percentage of our consumer traffic, our business could be harmed and our operating results could be adversely affected.
If we fail to achieve success with our mobile applications and mobile website, or if we otherwise fail to deliver effective solutions to advertisers for mobile platforms and other emerging platforms, our ability to monetize these growth opportunities will be constrained, and our business, financial condition and operating results would be adversely affected.
Our failure or the failure of third-party service providers to protect our platform and network against security breaches, or otherwise protect our confidential information, could damage our reputation and brand and substantially harm our business and operating results.
We deliver digital coupon content via our websites, mobile applications and email newsletter and alerts and social media presence, and we collect and maintain data about consumers, including personally identifiable information, as well as other confidential or proprietary information. Our security measures may not detect or prevent all attempts to hack our systems, denial-of-service attacks, viruses, malicious software, break-ins, phishing attacks, social engineering, security breaches or other attacks and similar disruptions that may jeopardize the security of information stored in and transmitted by our platform or that we or our third-party service providers otherwise maintain. Breaches of our security measures or those of our third-party service providers could result in unauthorized access to our platform or other systems; unauthorized access to and misappropriation of consumer information, including consumers’ personally identifiable information, or other confidential or proprietary information of ourselves or third parties; viruses, worms, spyware or other malware being served from our platform; deletion or modification of content, or the display of unauthorized content, on our websites or our mobile applications; or a denial of service or other interruption in our operations. Because techniques used to obtain unauthorized access to or sabotage systems change frequently and may not be known until launched against us or our third-party service providers, we and they may be unable to anticipate these attacks or to implement adequate preventative measures. Any actual or perceived breach of our security could damage our reputation and brand, expose us to a risk of loss or litigation and possible liability, require us to expend significant capital and other resources to alleviate problems caused by such breaches and deter consumers and retailers from using our online marketplace, which would harm our business, financial condition and operating results.
Interruptions or delays in service from third-party data center hosting facilities and other third parties could impair the delivery of our solutions and harm our business.
We currently serve our customers from third-party data center hosting facilities located in California, Virginia, the U.K., France, Germany and the Netherlands. All of our data gathering and analytics are conducted on, and the content we deliver is processed through, servers in these facilities. We also rely on bandwidth providers, internet service providers and mobile networks to deliver content. Any damage to, or failure of, the systems of our third-party providers could result in interruptions to our service.
Despite precautions taken at our third-party data centers, these facilities may be vulnerable to damage or interruption from break-ins, computer viruses, denial-of-service attacks, acts of terrorism, vandalism or sabotage,
20
Table of Contents
power loss, telecommunications failures, fires, floods, earthquakes, hurricanes, tornadoes and similar events. The occurrence of any of these events, a decision to close the facilities without adequate notice or other unanticipated problems at these facilities could result in loss of data, lengthy interruptions in the availability of our services and harm to our reputation and brand. While we have disaster recovery arrangements in place, they have not been tested under actual disasters or similar events.
Additionally, our third-party data center facility agreements are of limited durations, and our third-party data center facilities have no obligation to renew their agreements with us on commercially reasonable terms, or at all. If for any reason we are unable to renew our agreements with these facilities on commercially reasonable terms or if our arrangement with one or more of our data centers is terminated, we could experience additional expense in arranging for new facilities and support, and we may experience delays in the provisioning of our solutions until an agreement with another data center facility can be arranged. This shift to alternate facilities could take more than 24 hours depending on the nature of the event, which could cause significant interruptions in the delivery of our solutions and adversely affect our business and reputation. In addition, the failure of these facilities to meet our capacity requirements could result in interruptions in the availability or functionality of our solutions or impede our ability to scale our operations.
Furthermore, we depend on continuous and uninterrupted access to the Internet through third-party bandwidth providers to operate our business. If we lose the services of one or more of our bandwidth providers for any reason or if their services are disrupted, we could experience disruption in our services or we could be required to retain the services of a replacement bandwidth provider, which could increase our operating costs and harm our business and reputation.
Any errors, defects, disruptions or other performance problems with our solutions could harm our reputation and may damage our retailers’ businesses. Interruptions in our solutions could cause retailers to terminate their contracts with us, which would likely reduce our net revenues and harm our business, operating results and financial condition.
An increase in the return rate of paid retailers’ products or a change in the categories of products retailers choose to promote using digital coupons could reduce our net revenues.
The commission revenues we receive from paid retailers is in part a function of the amount consumers purchase from paid retailers and net of product returns. We do not have control over the categories or quality of products or services that our retailers deliver, nor do we have control over the digital coupons they provide us. As a result, we rely on our historical experience for our estimate of returns. If paid retailers’ actual levels of returns are greater than the level of returns we estimate or if paid retailers elect to use digital coupon content to promote products and services with a higher return rate than what we have experienced historically, our net revenues could decline. Because some categories of products tend to experience higher return rates than others, a shift in the types of goods consumers purchase using our solutions could lead to an increase in returns and our net revenues could decline. Additionally, return rates in the foreign countries in which we operate are currently higher than return rates in the U.S. If we continue to expand our operations in countries with high return rates, our operating results may be negatively affected.
Regulatory, legislative or self-regulatory developments regarding Internet privacy matters could adversely affect our ability to conduct our business.
Consumer and industry groups have expressed concerns about online data collection and use by companies, which has resulted in the release of various industry self-regulatory codes of conduct and best practice guidelines that are binding for member companies and that govern, among other things, the ways in which companies can collect, use and disclose user information, how companies must give notice of these practices and what choices companies must provide to consumers regarding these practices. We are obligated in certain cases to comply with best practices or codes of conduct addressing matters, such as the online tracking of users or devices.
21
Table of Contents
U.S. regulatory agencies have also placed an increased focus on online privacy matters and, in particular, on online advertising activities that utilize cookies, which are small files of non-personalized information placed on an Internet user’s computer, and other online tracking methods. Such regulatory agencies have released, or are expected to release, reports pertaining to these matters. For example, on March 26, 2012, the Federal Trade Commission, or FTC, issued a report on consumer privacy intended to articulate best practices for companies collecting and using consumer data. The report recommends companies adopt several practices that could have an impact on our business, including giving consumers notice and offering them choices about being tracked across other parties’ websites and implementing a persistent “Do Not Track” mechanism to enable consumers to choose whether to allow tracking of their online search and browsing activities, including on mobile devices. Various industry participants have worked to develop and finalize standards relating to a Do Not Track mechanism, and such standards may be implemented and adopted by industry participants at any time. We may be required or otherwise choose to adopt Do Not Track mechanisms, in which case our ability to use our existing tracking technologies and permit their use by performance marketing networks and other third parties could be impaired. This could cause our net revenues to decline and adversely affect our operating results.
U.S. and foreign governments have enacted, considered or are considering legislation or regulations that could significantly restrict industry participants’ ability to collect, augment, analyze, use and share anonymous data, such as by regulating the level of consumer notice and consent required before a company can employ cookies or other electronic tracking tools. A number of bills have been proposed in the U.S. Congress in the past that contained provisions that would have regulated how companies can use cookies and other tracking technologies to collect and use information about consumers. Some of those bills also contained provisions that would have specifically regulated the collection and use of information, particularly geolocation information, from mobile devices. At least one such bill presently has been proposed in the U.S. Congress.
Additionally, the EU has traditionally imposed more strict obligations under data privacy laws and regulations. Individual EU member countries have had discretion with respect to their interpretation and implementation of EU data privacy laws, resulting in variation of privacy standards from country to country. Legislation and regulation in the EU and some EU member states requires companies to obtain specific types of notice and consent from consumers before using cookies or other tracking technologies. To comply with these requirements, the use of cookies or other similar technologies may require the user’s affirmative, opt-in consent. Additionally, in January 2012, the European Commission announced significant proposed reforms to its existing data protection legal framework that, if implemented, may result in a greater compliance burden with respect to our operations in Europe.
Changes in global privacy laws and regulations and self-regulatory regimes may force us to incur substantial costs or require us to change our business practices. This could compromise our ability to pursue our growth strategies effectively and may adversely affect the demand for our solutions or otherwise harm our business and financial condition. For instance, new privacy laws or regulations or changed interpretations of existing laws or regulations could require performance marketing networks or us to take additional measures to facilitate consumer privacy preferences or to limit or cease altogether the collection, use or disclosure of data. For example, one potential restriction on the use of cookies would allow a website that a consumer has elected to visit to continue to place cookies on the user’s browser without explicit consent, but would require the user’s explicit consent for a third party to place its cookies on the user’s browser. The recent FTC staff report also recommends that websites offer consumers a choice about whether the owner of the website can use third parties to track the consumer’s activity for certain purposes. We are dependent on third parties, including performance marketing networks, to place cookies on browsers of users that visit our websites. If in the future we are restricted from allowing cookies, if there is a material increase in the number of users who choose to opt out or block cookies and other tracking technologies, or if performance marketing networks’ cookies or other tracking mechanisms otherwise do not function properly, our ability to generate net revenues would be significantly impaired.
22
Table of Contents
Finally, we may be subject to foreign laws regulating online advertising even in jurisdictions where we do not have any physical presence to the extent a digital media content provider has advertising inventory that we manage or to the extent that we collect and use data from consumers in those jurisdictions. Such laws may vary widely around the world, making it more costly for us to comply with them. Failure to comply may harm our business and our operating results could be adversely affected.
Changes in consumer sentiment or laws, rules or regulations regarding the use of cookies and other tracking technologies and other privacy matters could have a material adverse effect on our ability to generate net revenues and could adversely affect our ability to collect proprietary data on consumer shopping behavior.
Consumers may become increasingly resistant to the collection, use and sharing of information online, including information used to deliver advertising and to attribute credit to publishers in performance marketing programs, and take steps to prevent such collection, use and sharing of information. For example, consumer complaints and/or lawsuits regarding online advertising or the use of cookies or other tracking technologies in general and our practices specifically could adversely impact our business.
Consumers can currently opt out of the placement or use of most cookies for online advertising purposes by either deleting or disabling cookies on their browsers, visiting websites that allow consumers to place an opt-out cookie on their browsers, which instructs participating entities not to use certain data about consumers’ online activity for the delivery of targeted advertising, or by downloading browser plug-ins and other tools that can be set to: identify cookies and other tracking technologies used on websites; prevent websites from placing third-party cookies and other tracking technologies on the user’s browser; or block the delivery of online advertisements on websites and applications.
Changes in device and software features could make it easier for Internet users to prevent the placement of cookies or to block other tracking technologies. In particular, the default settings of consumer devices and software may be set to prevent the placement of cookies unless the user actively elects to allow them. For example, Apple’s Safari browser currently has a default setting under which third-party cookies are not accepted, and users must activate a browser setting to enable cookies to be set. Additionally, Mozilla Corporation announced on February 25, 2013, that its Firefox browser also will not accept third-party cookies by default. On February 22, 2012, the Digital Advertising Alliance announced that its members will work to add browser-based header signals to the set of tools by which consumers can express their preferences not to be tracked online. A recent FTC report on consumer privacy calls for the development and implementation of a persistent Do Not Track mechanism that enable consumers to choose whether to allow the tracking of their online search and browsing activities. Various industry participants have worked to develop and finalize standards relating to a Do Not Track mechanism, and such standards may be implemented and adopted by industry participants at any time.
We are dependent on performance marketing networks or in some instances, retailers, to place cookies on browsers of users that visit our websites or to use other tracking mechanisms to allow retailer sales through our marketplace to be attributed to us, and if we are restricted from allowing these or if they do not function in a manner that allows retailer sales through our marketplace to be attributed to us, our ability to generate net revenues would be significantly impaired. In particular, if consumer sentiment regarding privacy issues or the development and deployment of new browser solutions or other Do Not Track mechanisms results in a material increase in the number of users who choose to opt out or block cookies and other tracking technologies or who are otherwise using browsers where they need to, and fail to, configure the browser to accept cookies, or otherwise results in cookies or other tracking technologies not functioning properly, our ability to conduct our business, operating results and financial condition would be adversely affected.
In addition to this change in consumer preferences, if retailers or brands perceive significant negative consumer reaction to targeted online advertising or the tracking of consumers’ online activities, they may determine that such advertising or tracking has the potential to negatively impact their brand. In that case, advertisers may limit or stop the use of our solutions, and our operating results and financial condition would be adversely affected.
23
Table of Contents
Our business practices with respect to data and consumer protection could give rise to liabilities or reputational harm as a result of governmental regulation, legal requirements or industry standards relating to consumer privacy, data protection and consumer protection.
Federal, state and international laws and regulations govern the collection, use, retention, sharing and security of data that we collect. We strive to comply with all applicable laws, regulations, self-regulatory requirements and legal obligations relating to privacy, data protection and consumer protection, including those relating to the use of data for marketing purposes. It is possible, however, that these requirements may be interpreted and applied in a manner that is inconsistent from one jurisdiction to another and may conflict with other rules or our practices. We cannot assure you that our practices have complied, comply, or will comply fully with all such laws, regulations, requirements and obligations. Any failure, or perceived failure, by us to comply with federal, state or international laws or regulations, including laws and regulations regulating privacy, data security, marketing communications or consumer protection, or other policies, self-regulatory requirements or legal obligations could result in harm to our reputation, a loss in business, and proceedings or actions against us by governmental entities, consumers, retailers or others. We may also be contractually liable to indemnify and hold harmless performance marketing networks or other third parties from the costs or consequences of noncompliance with any laws, regulations, self-regulatory requirements or other legal obligations relating to privacy, data protection and consumer protection or any inadvertent or unauthorized use or disclosure of data that we store or handle as part of operating our business. Any such proceeding or action, and any related indemnification obligation, could hurt our reputation, force us to incur significant expenses in defense of these proceedings, distract our management, increase our costs of doing business and cause consumers and retailers to decrease their use of our marketplace, and may result in the imposition of monetary liability.
Government regulation of the Internet, e-commerce and m-commerce is evolving, and unfavorable changes or failure by us to comply with these laws and regulations could substantially harm our business and results of operations.
We are subject to general business regulations and laws as well as regulations and laws specifically governing the Internet, e-commerce and m-commerce in a number of jurisdictions around the world. Existing and future regulations and laws could impede the growth of the Internet, e-commerce, m-commerce or other online services. These regulations and laws may involve taxation, tariffs, privacy and data security, anti-spam, data protection, content, copyrights, distribution, electronic contracts, electronic communications and consumer protection. It is not clear how existing laws and regulations governing issues such as property ownership, sales and other taxes, libel and personal privacy apply to the Internet as the vast majority of these laws and regulations were adopted prior to the advent of the Internet and do not contemplate or address the unique issues raised by the Internet, e-commerce or m-commerce. It is possible that general business regulations and laws, or those specifically governing the Internet, e-commerce or m-commerce may be interpreted and applied in a manner that is inconsistent from one jurisdiction to another and may conflict with other rules or our practices. We cannot assure you that our practices have complied, comply or will comply fully with all such laws and regulations. Any failure, or perceived failure, by us to comply with any of these laws or regulations could result in damage to our reputation, a loss in business, and proceedings or actions against us by governmental entities or others. Any such proceeding or action could hurt our reputation, force us to spend significant resources in defense of these proceedings, distract our management, increase our costs of doing business, and cause consumers and retailers to decrease their use of our marketplace, and may result in the imposition of monetary liability. We may also be contractually liable to indemnify and hold harmless third parties from the costs or consequences of noncompliance with any such laws or regulations. In addition, it is possible that governments of one or more countries may seek to censor content available on our websites and mobile applications or may even attempt to completely block access to our marketplace. Adverse legal or regulatory developments could substantially harm our business. In particular, in the event that we are restricted, in whole or in part, from operating in one or more countries, our ability to retain or increase our customer base may be adversely affected and we may not be able to maintain or grow our net revenues as anticipated.
24
Table of Contents
As we develop and provide solutions, we may be subject to additional and unexpected regulations, which could increase our costs or otherwise harm our business.
As we develop and provide solutions that address new market segments, we may become subject to additional laws and regulations, which could create unexpected liabilities for us, cause us to incur additional costs or restrict our operations.
We have begun to introduce new product offerings, which may be subject to regulation by federal, state and local authorities and by authorities in foreign countries. For example, unlike our other solutions, in order to facilitate card-linked offers which we are considering, we must acquire and store consumer credit card data. The storage of credit card data requires compliance with the Payment Card Industry Data Security Standard, or PCI DSS, which compliance certification we recently obtained. Under the PCI DSS, we are required to adopt and implement internal controls over the use, storage and security of credit card data to help prevent credit card fraud. Failure to comply with this standard or other loss of our PCI DSS compliance would result in breaches of contractual obligations with our payment processors, may subject us to fines, penalties, damages and civil liability and could eventually prevent us from processing or accepting credit cards.
From time to time, we may be notified of or otherwise become aware of additional laws and regulations that governmental organizations or others may claim should be applicable to our business. Our failure to anticipate the application of these laws and regulations accurately, or other failure to comply, could create liability for us, result in adverse publicity or cause us to alter our business practices, which could cause our net revenues to decrease, our costs to increase or our business otherwise to be harmed.
We may face liability for, and may be subject to claims related to, inaccurate or outdated content provided to us, or content provided to us without permission, which could require us to pay significant damages, may be extremely costly to defend even if decided in our favor and could limit our ability to operate.
The information on our websites and applications that is provided by performance marketing networks and retailers and collected from third parties relates to digital coupons from retailers participating in the digital coupon industry. We are exposed to the risk that some of this content may contain inaccurate or outdated information about retailer products or services or the discounts thereon, or digital coupons that are not made available or intended to be made available to all consumers. This could cause consumers and retailers to lose confidence in the information provided on our platform or become dissatisfied with our platform and result in lawsuits being filed against us.
In addition, we may face potential liability relating to information that is published or made available through our marketplace, including information generated by us, user-generated content and proprietary information of third parties. This content may expose us to claims related to trademark and copyright infringement and other intellectual property rights, rights of privacy, defamation, fraud, negligence, breach of contract, tortious interference, unfairness, deceptiveness, false or misleading advertising, personal injury torts, noncompliance with state or federal laws relating to digital coupons or other theories based on the nature and content of the information. The laws relating to the liability of service providers for activities of their users is currently unsettled both within the U.S. and internationally, although risks related to these types of lawsuits may be enhanced in certain jurisdictions outside the U.S. where our protection from liability for third-party actions is more unclear and where we may be less protected under local laws than we are in the U.S.
Such claims or lawsuits could divert the time and attention of management and technical personnel away from our business and result in significant costs to investigate and defend, regardless of the merits of the claims, as well as significant damages if we are found liable. The scope and amount of our insurance may not adequately protect us against these types of damages. Additionally, as a result of such claims, we may elect or be compelled to remove valuable content from our websites or mobile applications, which could decrease the usefulness of our platform for consumers and result in less traffic to our websites and less usage of our mobile applications. If any of these events occur, our business and financial results could be adversely affected.
25
Table of Contents
Our business could suffer if the jurisdictions in which we operate change the way in which they regulate user-generated content.
Our business, including our ability to operate and expand internationally, could be adversely affected if legislation or regulations are adopted, interpreted or implemented in a manner that is inconsistent with our current business practices related to user-generated content and that requires changes to these practices or the design of our platform or solutions. For example, if legislation is passed that limits the immunities afforded to websites that publish user-generated content, we may be compelled to remove content from our platform that we would otherwise publish or restrict the types of businesses that we can promote coupon content for, among other changes. Legislative changes such as these were proposed in the U.S. last year and could increase our operating costs and make it more difficult for consumers to use our platform, resulting in less consumer traffic and net revenues, and our business and operating results could suffer.
If Texas or any other jurisdiction in which we are resident implements regulations that impose sales tax on certain e-commerce or m-commerce transactions involving the use of performance marketing programs, our net revenues could decline and our business, financial condition and operating results will be adversely affected.
In 2008, New York implemented regulations that require retailers to collect and remit sales taxes on sales made to residents of New York if the publisher that facilitated that sale is a New York resident. In 2011, Illinois and California each passed similar regulations. In addition, several other states have proposed similar regulations, although some of the regulations proposed by these other states have not passed. None of these sales tax requirements have had a material impact on our results of operations to date. However, if Texas or any other jurisdiction in which we are resident were to pass similar regulations, we believe a substantial number of the retailers that we work with would cease using our marketplace or significantly alter the manner in which they pay us. This would decrease our sales and our business, financial condition and operating results would be adversely affected.
The growth of e-commerce and m-commerce in the U.S. could suffer if the federal government implements new regulations that obligate retailers, or permit states to obligate retailers, to collect sales taxes from consumers on certain e-commerce or m-commerce transactions, which would adversely affect our growth.
Legislation introduced in the 113th Congress in 2013, including H.R. 684 and S. 336, would grant states the authority to require out-of-state retailers to collect and remit sales taxes. The adoption of remote sales tax collection legislation would result in the imposition of sales taxes and additional costs associated with complex sales tax collection, remittance and audit compliance requirements on many of our retailers, which would make selling online or through mobile applications less attractive for these retailers. Additionally, the introduction of new or increased taxes applicable to online transactions could make online purchases less attractive to consumers relative to in-store retail purchases. These changes could substantially impair the growth of e-commerce and m-commerce in the U.S., and could diminish our opportunity to derive financial benefit from our activities in the U.S.
We may be sued by third parties for infringement or other violation of their intellectual property or proprietary rights.
Internet, advertising and e-commerce companies frequently are subject to litigation based on allegations of infringement, misappropriation, dilution or other violations of intellectual property rights. Some Internet, advertising and e-commerce companies, including some of our competitors, own large numbers of patents, copyrights, trademarks and trade secrets, which they may use to assert claims against us.
Third parties have asserted, and may in the future assert, that we have infringed, misappropriated or otherwise violated their intellectual property rights.
26
Table of Contents
For instance, the use of our technology to provide our solutions could be challenged by claims that such use infringes, dilutes, misappropriates or otherwise violates the intellectual property rights of a third party. In addition, we may face claims that content published or made available through our websites or mobile applications violates third-party intellectual property rights. For example, retailers and other third parties frequently have complained that their trademarks, copyrights or other intellectual property are being used on our websites without their permission and in violation of their rights or in violation of laws or regulations.
As we face increasing competition and as a public company, the possibility of intellectual property rights claims against us grows. Such claims and litigation may involve patent holding companies or other adverse intellectual property rights holders who have no relevant product revenue, and therefore our own pending patents and other intellectual property rights may provide little or no deterrence to these rights holders in bringing intellectual property rights claims against us. There may be intellectual property rights held by others, including issued or pending patents and trademarks, that cover significant aspects of our technologies, content, branding or business methods, and we cannot assure that we are not infringing or violating, and have not violated or infringed, any third-party intellectual property rights or that we will not be held to have done so or be accused of doing so in the future.
Any claim that we have violated intellectual property or other proprietary rights of third parties, with or without merit, and whether or not settled out of court or determined in our favor, could be time-consuming and costly to address and resolve, and could divert the time and attention of management and technical personnel from our business. Furthermore, an adverse outcome of a dispute may result in an injunction and could require us to pay substantial monetary damages, including treble damages and attorneys’ fees, if we are found to have willfully infringed a party’s intellectual property rights. Any settlement or adverse judgment resulting from such a claim could require us to enter into a licensing agreement to continue using the technology, content or other intellectual property that is the subject of the claim; restrict or prohibit our use of such technology, content or other intellectual property; require us to expend significant resources to redesign our technology or solutions; and require us to indemnify third parties. Royalty or licensing agreements, if required or desirable, may be unavailable on terms acceptable to us, or at all, and may require significant royalty payments and other expenditures. There also can be no assurance that we would be able to develop or license suitable alternative technology, content or other intellectual property to permit us to continue offering the affected technology, content or services to our customers. Any of these events could harm our business, operating results and financial condition.
Failure to protect or enforce our intellectual property rights could harm our business and results of operations.
We pursue the registration of our patentable technology, domain names, trademarks and service marks in the U.S. and in certain jurisdictions abroad. We also strive to protect our intellectual property rights by relying on federal, state and common law rights, as well as contractual restrictions. We typically enter into confidentiality and invention assignment agreements with our employees and contractors, and confidentiality agreements with parties with whom we conduct business in order to limit access to, and disclosure and use of, our proprietary information. However, we may not be successful in executing these agreements with every party who has access to our confidential information or contributes to the development of our technology or intellectual property rights. Those agreements that we do execute may be breached, and we may not have adequate remedies for any such breach. These contractual arrangements and the other steps we have taken to protect our intellectual property rights may not prevent the misappropriation or disclosure of our proprietary information nor deter independent development of similar technology or intellectual property by others.
Effective trade secret, patent, copyright, trademark and domain name protection is expensive to obtain, develop and maintain, both in terms of initial and ongoing registration or prosecution requirements and expenses and the costs of defending our rights. We are seeking to protect our patentable technology, trademarks and
27
Table of Contents
domain names in an increasing number of jurisdictions, a process that is expensive and may not be successful or which we may not pursue in every location. We may, over time, increase our investment in protecting our intellectual property through additional patent filings that could be expensive and time-consuming. We have 31 pending patent applications, including three provisional applications. We do not know whether any of our pending patent applications will result in the issuance of patents or whether the examination process will require us to narrow our claims or we may otherwise be unable to obtain patent protection for the technology covered in our pending patent applications. Even if patents are issued, they and our trademarks and other intellectual property rights may be challenged by others or invalidated through administrative process or litigation. Moreover, any issued patents may not provide us with a competitive advantage and, as with any technology, competitors may be able to develop similar or superior technologies to our own, now or in the future.
Additionally, in the U.S., the central provisions of the Leahy-Smith America Invents Act became effective recently. Among other things, this law switched U.S. patent rights from the former “first-to-invent” system to a “first inventor-to-file” system. This may result in inventors and companies having to file patent applications more frequently to preserve rights in their inventions. This may favor larger competitors that have the resources to file more patent applications.
Monitoring unauthorized use of the content on our websites and mobile applications, and our other intellectual property and technology, is difficult and costly. Our efforts to protect our proprietary rights and intellectual property may not have been and may not be adequate to prevent their misappropriation or misuse. Third parties from time to time copy content or other intellectual property or technology from our solutions without authorization and seek to use it for their own benefit. We generally seek to address such unauthorized copying or use, but we have not always been successful in stopping all unauthorized use of our content or other intellectual property or technology, and may not be successful in doing so in the future. Further, we may not have been and may not be able to detect unauthorized use of our technology or intellectual property, or to take appropriate steps to enforce our intellectual property rights. Our competitors may also independently develop similar technology. Effective patent, trademark, copyright and trade secret protection may not be available to us in every country in which our solutions or technology are hosted or available. The laws of some foreign countries may not be as protective of intellectual property rights as those in the U.S., and mechanisms for enforcement of intellectual property rights may be inadequate. Further, legal standards relating to the validity, enforceability and scope of protection of intellectual property rights are uncertain. The laws in the U.S. and elsewhere change rapidly, and any future changes could adversely affect us and our intellectual property. Our failure to meaningfully protect our intellectual property rights could result in competitors offering solutions that incorporate our most technologically advanced features, which could reduce demand for our solutions.
We may find it necessary or appropriate to initiate claims or litigation to enforce our intellectual property rights, protect our trade secrets or determine the validity and scope of intellectual property rights claimed by others. Litigation is inherently uncertain and any litigation of this nature, regardless of outcome or merit, could result in substantial costs and diversion of management and technical resources, any of which could adversely affect our business and operating results. If we fail to maintain, protect and enhance our intellectual property, our business and operating results may be harmed.
We may be unable to continue the use of our domain names, or prevent third parties from acquiring and using domain names that infringe on, are similar to, or otherwise decrease the value of our brands, trademarks or service marks.
We have registered domain names for our websites that we use in our business. If we lose the ability to use a domain name, whether due to trademark claims, failure to renew the applicable registration, or any other cause, we may be forced to market our solutions under a new domain name, which could cause us substantial harm, or to incur significant expense in order to purchase rights to the domain name in question. In addition, our competitors and others could attempt to capitalize on our brand recognition by using domain names similar to ours. Domain names similar to ours have been registered in the U.S. and elsewhere. We may be unable to prevent
28
Table of Contents
third parties from acquiring and using domain names that infringe on, are similar to, or otherwise decrease the value of our brands, trademarks or service marks. Protecting and enforcing our rights in our domain names may require litigation, which could result in substantial costs and diversion of management’s attention.
The consumer traffic to our websites and mobile applications may decline and our business may suffer if other companies copy information from our platform and publish or aggregate it with other information for their own benefit.
From time to time, other companies copy information or content from our platform, through website scraping, robots or other means, and publish or aggregate it with other information for their own benefit. When third parties copy, publish or aggregate content from our platform, it makes them more competitive, and decreases the likelihood that consumers will visit our websites or use our mobile applications to search and discover the information they seek, which could negatively affect our business, results of operations and financial condition. We may not be able to detect such third-party conduct in a timely manner or at all and, even if we are able to identify these situations, we may not be able to prevent them and have not always been able to prevent them in the past. In some cases, particularly in the case of websites operating outside of the U.S., our available remedies may be inadequate to protect us against such practices. In addition, we may be required to expend significant financial or other resources to successfully enforce our rights.
We rely on information technology to operate our business and maintain competitiveness, and any failure to adapt to technological developments or industry trends could harm our business.
We depend on the use of information technologies and systems. As our operations grow in size and scope, we must continuously improve and upgrade our systems and infrastructure while maintaining or improving the reliability and integrity of our infrastructure. Our future success also depends on our ability to adapt our systems and infrastructure to meet rapidly evolving consumer trends and demands while continuing to improve the performance, features and reliability of our solutions in response to competitive services and product offerings. The emergence of alternative platforms such as smartphones and tablets and the emergence of niche competitors who may be able to optimize products, services or strategies for such platforms will require new investment in technology. New developments in other areas, such as cloud computing, could also make it easier for competition to enter our markets due to lower up-front technology costs. In addition, we may not be able to maintain our existing systems or replace or introduce new technologies and systems as quickly as we would like or in a cost-effective manner.
Some of our solutions contain open source software, which may pose particular risks to our proprietary software and solutions.
We use open source software in our solutions and will use open source software in the future. Some licenses governing our use of open source software contain requirements that we make available source code for modifications or derivative works we create based upon the open source software, and that we license such modifications or derivative works under the terms of a particular open source license or other license granting third parties certain rights of further use. By the terms of certain open source licenses, we could be required to release the source code of our proprietary software, and to make our proprietary software available under open source licenses, if we combine our proprietary software with open source software in certain manners. Although we monitor our use of open source software, we cannot assure you that all open source software is reviewed prior to use in our solutions, that our programmers have not incorporated open source software into our solutions, or that they will not do so in the future. Additionally, the terms of many open source licenses to which we are subject have not been interpreted by U.S. or foreign courts. There is a risk that open source software licenses could be construed in a manner that imposes unanticipated conditions or restrictions on our ability to market or provide our solutions. In addition, the terms of open source software licenses may require us to provide software that we develop using such open source software to others on unfavorable license terms. As a result of our current or future use of open source software, we may face claims or litigation, be required to release our
29
Table of Contents
proprietary source code, pay damages for breach of contract, re-engineer our solutions, discontinue making our solutions available in the event re-engineering cannot be accomplished on a timely basis or take other remedial action. Any such re-engineering or other remedial efforts could require significant additional research and development resources, and we may not be able to successfully complete any such re-engineering or other remedial efforts. Further, in addition to risks related to license requirements, use of certain open source software can lead to greater risks than use of third-party commercial software, as open source licensors generally do not provide warranties or controls on the origin of software. Any of these risks could be difficult to eliminate or manage, and, if not addressed, could have a negative effect on our business, financial condition and operating results.
We are subject to international business uncertainties that could adversely affect our operations and operating results.
Our net revenues from operations outside the U.S. comprised 17.1% and 20.6% of our net revenues in 2012 and for the nine months ended September 30, 2013, respectively, and we expect this percentage to increase in the future. Currently, we have operations in the U.K., France, the Netherlands and Germany. We intend to expand our existing operations in these countries as well as establish a presence in additional countries to grow our international sales. Operating in foreign countries requires significant resources and management attention, and we have limited experience entering new geographic markets. In addition, the varying commercial and Internet infrastructure in other countries may make it difficult for us to replicate our business model. In many countries, we compete with local companies that have more experience in their respective markets than we do, and we may not benefit from first-to-market advantages. To achieve widespread acceptance in new countries and markets, we must continue to tailor our solutions and business model to the unique circumstances of such countries and markets, which can be difficult and costly. Failure to adapt practices and models effectively to each country into which we expand could slow our international growth. We cannot assure you that our international efforts will be successful. International sales and operations may be subject to risks such as:
| • | competition with local or foreign companies entering the same markets; |
| • | the cost and resources required to localize our solutions, while maintaining retailer and consumer satisfaction such that our marketplace will continue to attract high quality retailers; |
| • | difficulties in staffing and managing foreign operations due to distance, time zones, language and cultural differences; |
| • | higher product return rates; |
| • | burdens of complying with a wide variety of laws and regulations, including regulation of digital coupon terms, Internet services, privacy and data protection, bulk emailing and anti-competition regulations, which may limit or prevent us from offering of our solutions in some jurisdictions or limit our ability to enforce contractual obligations; |
| • | adverse tax effects and foreign exchange controls making it difficult to repatriate earnings and cash; |
| • | political and economic instability; |
| • | terrorist activities and natural disasters; |
| • | differing employment practices and laws and labor disruptions; |
| • | technology compatibility; |
| • | credit risk and higher levels of payment fraud; |
| • | increased financial accounting and reporting burdens and complexities and difficulties in implementing and maintaining adequate internal controls; |
| • | slower adoption of the Internet as an advertising, broadcast and commerce medium in certain of those markets as compared to the U.S.; |
30
Table of Contents
| • | lower levels of consumer spending and fewer opportunities for growth compared to the U.S.; |
| • | preference for local vendors; and |
| • | different or lesser degrees of intellectual property protection. |
In addition, the U.S. has in the past proposed, and is currently evaluating, changes to the corporate tax structure that would include taxation of offshore earnings of U.S. businesses. If this were to occur, our effective tax rates would likely increase. Further, we are subject to U.S. and foreign legislation, such as the Foreign Corrupt Practices Act and the U.K. Bribery Act. While we maintain high standards of ethical conduct, our policies, training and monitoring of compliance with applicable anti-corruption laws are at a very early stage of development. If any of our employees or agents were to violate these laws in the conduct of our business, we could be subject to substantial penalties and our reputation could be impaired.
These factors could have an adverse effect on our net revenues from advertisers located outside the U.S. and, consequently, on our business and operating results.
We may be unable to identify suitable acquisition candidates, effectively integrate newly acquired businesses, or achieve expected operating results from acquisitions.
Part of our growth strategy is to increase our net revenues and improve our operating results through the acquisition of similar or complementary businesses. There can be no assurance that suitable candidates for acquisitions will be identified or, if suitable candidates are identified, that acquisitions can be completed on acceptable terms, if at all.
Since our inception, we have completed eleven acquisitions, and we may continue to make acquisitions in the future. Our success will depend in part on our ability to identify, negotiate, and complete acquisitions, and integrate the acquired businesses and, if necessary, satisfactory debt or equity financing to fund those acquisitions. As is the case with our current facility, if we finance an acquisition with debt financing, we will incur interest expense and may have to comply with financing covenants or secure the debt obligations with our assets. Mergers and acquisitions are inherently risky, and any mergers and acquisitions we complete may not be successful. Any mergers and acquisitions we undertake in the future would involve numerous risks, any of which could have a material adverse effect on our business and the market price of our common stock, including the following:
| • | use of cash resources and incurrence of debt and contingent liabilities in funding acquisitions, which may limit our operational flexibility and other potential uses of our cash, including stock repurchases, dividend payments and retirement of outstanding indebtedness; |
| • | expected and unexpected costs incurred in identifying and pursuing acquisitions and performing due diligence on potential acquisition targets that may or may not be successful; |
| • | failure of the acquired company to achieve anticipated consumer traffic, revenue, earnings or cash flows; |
| • | our responsibility for the liabilities of the businesses we acquire, including the assumption of liabilities that were not disclosed to us or that exceed our estimates; |
| • | difficulties in integrating and managing the combined operations, technologies and solutions; |
| • | failure to identify all of the problems, liabilities or other shortcomings or challenges of an acquired company, including issues related to intellectual property, solution quality or architecture, regulatory compliance practices, revenue recognition or other accounting practices or employee or customer issues; |
| • | diversion of management’s attention or other resources from our existing business; |
31
Table of Contents
| • | inability to maintain the key business relationships and the reputations of the businesses we acquire; |
| • | difficulties in assigning or transferring technology or intellectual property licensed by acquired companies from third parties to us or our subsidiaries; |
| • | uncertainty of entry into markets in which we have limited or no prior experience or in which competitors have stronger market positions; |
| • | our dependence on unfamiliar retailers or performance marketing networks of the companies we acquire; |
| • | insufficient incremental revenue to offset our increased expenses associated with acquisitions; |
| • | our inability to maintain internal standards, controls, procedures and policies; |
| • | challenges in integrating and auditing the financial statements of acquired companies that have not historically prepared financial statements in accordance with U.S. generally accepted accounting principles; |
| • | impairment of goodwill or other intangible assets such as trademarks or other intellectual property arising from acquisitions; |
| • | amortization of expenses related to acquired intangible assets and other adverse accounting consequences; |
| • | potential loss of key employees from the companies we acquire; and |
| • | dilution of our stockholders’ ownership interests if we finance all or a portion of the purchase price of any acquisition by issuing equity. |
Further, we rely heavily on the representations and warranties provided to us by the sellers of acquired companies, including as they relate to creation of, ownership of and rights in intellectual property, existence of open source code, existence of encumbrances and operating restrictions and compliance with laws and contractual requirements. If any of these representations and warranties are inaccurate or breached, such inaccuracy or breach could result in costly litigation and assessment of liability for which there may not be adequate recourse against such sellers, in part due to contractual time limitations and limitations of liability.
We may need additional capital in the future, which may not be available to us on favorable terms, or at all, and may dilute your ownership of our Series 1 common stock.
After this offering, we will have an aggregate of shares of Series 1 common stock authorized but unissued and not reserved for issuance under our stock option plans or otherwise. We may issue all of these shares without any action or approval by our stockholders, subject to certain limitations of the NASDAQ Global Select Market. We may require additional capital from equity or debt financing in the future in order to take advantage of strategic opportunities, or to support our existing business. We may not be able to secure timely additional financing on favorable terms, or at all. The terms of any additional financing may place limits on our financial and operating flexibility, including our ability to issue or repurchase equity, develop new or enhanced existing products, complete acquisitions or otherwise take advantage of business opportunities. If we raise additional funds or finance acquisitions through further issuances of equity, convertible debt securities or other securities convertible into equity, you and our other stockholders could suffer significant dilution in your percentage ownership of our company, and any new securities we issue could have rights, preferences and privileges senior to those of holders of our Series 1 common stock, including shares of Series 1 common stock sold in this offering. If we are unable to obtain adequate financing or financing on terms satisfactory to us, if and when we require it, our ability to grow or support our business and to respond to business challenges could be significantly limited.
32
Table of Contents
If our management team does not remain with us in the future, our business, operating results and financial condition could be adversely affected.
We have been successful in attracting a knowledgeable and talented management team. Our future success depends in large part on our ability to attract and retain high-quality management and operating personnel. Our senior management team’s in-depth knowledge of and deep relationships with the participants in our industry are extremely valuable to us. Our business also requires skilled technical and marketing personnel, who are in high demand and are often subject to competing offers. Competition for qualified employees is intense in our industry, and the loss of even a few qualified employees, or an inability to attract, retain and motivate additional highly skilled employees required for the planned expansion of our business, could harm our operating results and impair our ability to grow.
To attract and retain key personnel, we use various measures, including an equity incentive program and incentive bonuses for executive officers and other employees. These measures may not be enough to attract and retain the personnel we require to operate our business effectively. We also have a number of employees who were granted stock options over the past few years that have an exercise price per share that is significantly lower than the current fair market value. If we are successful as a public company, these employees may choose to exercise their options and sell the shares, recognizing a substantial gain. As a result, it may be difficult for us to retain such employees.
Our management team has limited experience managing a public company, and regulatory compliance may divert its attention from the day-to-day management of our business.
Some of the individuals who now constitute our management team have limited experience managing a publicly-traded company and limited experience complying with the increasingly complex laws pertaining to public companies. Our management team may not successfully or efficiently manage our continued transition to a public company that will be subject to significant regulatory oversight and reporting obligations under the federal securities laws. In particular, these new obligations will require substantial attention from our senior management and could divert their attention away from the day-to-day management of our business, which could materially and adversely impact our business operations.
Our management team has a limited history of working together and may not be able to execute our business plan.
Our management team has worked together for only a limited period of time and has a limited track record of executing our business plan as a team. In addition, we have recently filled a number of positions in our senior management and finance and accounting staff. Accordingly, certain key personnel have only recently assumed the duties and responsibilities they are now performing, and it is difficult to predict whether our management team, individually and collectively, will be effective in operating our business.
If we are unable to attract additional partner management and sales representatives, or if a significant number of our partner manager or sales representatives leave us, our ability to increase our net revenues could be negatively impacted.
Our ability to expand our business will depend, in part, on our ability to attract additional partner management and sales representatives. Competition for qualified partner managers and sales representatives can be intense, and we may be unable to hire additional team members when we need them or at all. Any difficulties we experience in attracting additional partner managers or sales representatives could have a negative impact on our ability to expand our retailer base, increase net revenues and continue our growth.
In addition, we must retain our current partner management and sales representatives and properly incentivize them to obtain new retailer relationships. If a significant number of our partner managers and sales representatives were to leave us or join our competitors, our net revenues could be negatively impacted. In
33
Table of Contents
certain circumstances, we have entered into agreements with our partner managers and sales representatives that contain non-compete provisions to mitigate this risk, but we may need to litigate to enforce our rights under these agreements, which could be time-consuming, expensive and ineffective. A significant increase in the turnover rate among our current partner managers or sales representatives could also increase our recruiting costs and decrease our operating efficiency, which could lead to a decline in our net revenues and profitability.
If we cannot maintain our corporate culture as we grow, we could lose the innovation, teamwork and focus that contribute to our business.
We believe that a critical component of our success has been our corporate culture, which we believe fosters innovation, encourages teamwork, cultivates creativity and promotes focus on execution. We have invested substantial time, energy and resources in building a highly collaborative team that works together effectively in an environment designed to promote openness, honesty, mutual respect and the pursuit of common goals. As we continue to develop the infrastructure of a public company and continue to grow, we may find it difficult to maintain these valuable aspects of our corporate culture and to attract competent personnel who are willing to embrace our culture. Any failure to preserve our culture could negatively impact our future success, including our ability to attract and retain personnel, encourage innovation and teamwork and effectively focus on and pursue our corporate objectives.
The intended tax benefits of our corporate structure and intercompany arrangements depend on the application of the tax laws of various jurisdictions and on how we operate our business.
Our corporate structure and intercompany arrangements, including the manner in which we develop and use our intellectual property and the transfer pricing of our intercompany transactions, are intended to reduce our worldwide effective tax rate. We are currently evaluating a restructuring of our non-U.S. entities to streamline our European operations, and we may implement this and other structures and arrangements in the future. The application of the tax laws of various jurisdictions, including the U.S., to our international business activities is subject to interpretation and depends on our ability to operate our business in a manner consistent with our corporate structure and intercompany arrangements. The taxing authorities of the jurisdictions in which we operate may challenge our methodologies for valuing developed technology or intercompany arrangements, including our transfer pricing, or determine that the manner in which we operate our business does not achieve the intended tax consequences, which could increase our worldwide effective tax rate and harm our financial position and results of operations. In order to effectively structure and execute our international tax strategy we will need to continue to hire, train and manage qualified personnel. If our new hires underperform, or if we are unsuccessful in hiring, training, managing and integrating these new employees, our business may be harmed.
Our corporate structure includes legal entities located in jurisdictions with income tax rates lower than the U.S. statutory tax rate. Our intercompany arrangements allocate income to such entities in accordance with arm’s-length principles and commensurate with functions performed, risks assumed and ownership of valuable corporate assets. We believe that income taxed in certain foreign jurisdictions at a lower rate relative to the U.S. statutory rate will have a beneficial impact on our worldwide effective tax rate.
Significant judgment is required in evaluating our tax positions and determining our provision for income taxes. During the ordinary course of business, there are many transactions and calculations for which the ultimate tax determination is uncertain. For example, our effective tax rates could be adversely affected by earnings being lower than anticipated in countries where we have lower statutory rates and higher than anticipated in countries where we have higher statutory rates, by changes in foreign currency exchange rates or by changes in the relevant tax, accounting and other laws, regulations, principles and interpretations. As we operate in numerous taxing jurisdictions, the application of tax laws can be subject to diverging and sometimes conflicting interpretations by tax authorities of these jurisdictions. It is not uncommon for taxing authorities in different countries to have conflicting views, for instance, with respect to, among other things, the manner in which the arm’s length standard is applied for transfer pricing purposes, or with respect to the valuation of intellectual property. In addition, tax laws are dynamic and subject to change as new laws are passed and new interpretations of the law
34
Table of Contents
are issued or applied. In particular, there is uncertainty in relation to the U.S. tax legislation in terms of the future corporate tax rate but also in terms of the U.S. tax consequences of income derived from intellectual property held overseas in low tax jurisdictions.
Our existing corporate structure and intercompany arrangements have been implemented in a manner we believe is in compliance with current prevailing tax laws. However, the tax benefits which we intend to derive from our current and any future intercompany arrangements could be undermined if we are unable to adapt the manner in which we operate our business and if tax laws change.
The enactment of legislation implementing changes in the U.S. taxation of international business activities or the adoption of other tax reform policies could materially impact our financial condition and results of operations.
The current administration has made public statements indicating that it has made international tax reform a priority, and key members of the U.S. Congress have conducted hearings and proposed new legislation. Recent changes to U.S. tax laws, including limitations on the ability of taxpayers to claim and utilize foreign tax credits and the deferral of certain tax deductions until earnings outside of the U.S. are repatriated to the U.S., as well as changes to U.S. tax laws that may be enacted in the future, could impact the tax treatment of our foreign earnings, as well as cash and cash equivalent balances we currently maintain outside of the U.S. Due to the expanding scale of our international business activities, any changes in the U.S. taxation of such activities may increase our worldwide effective tax rate and harm our financial condition and results of operations.
We rely on performance marketing networks and retailers to determine the amount payable to us accurately. If their reports are inaccurate or delayed, our operating results could be harmed and we could experience fluctuations in our performance.
Our performance marketing networks and retailers typically pay us on a monthly basis based upon sales generated from digital coupons. We rely on our performance marketing networks and retailers to report accurately and in a timely manner the amount of commission revenues earned by us. We calculate our net revenues, prepare our financial reports, projections and budgets and direct our advertising, marketing and other operating efforts based on reports we receive from our performance marketing networks and retailers. It is difficult for us to determine independently whether our performance marketing networks or retailers are reporting all revenue data due to us. We have occasionally experienced instances of incomplete or delayed reports from our performance marketing networks and retailers, and we generally do not have the contractual right to audit our performance marketing networks or retailers. To the extent that our performance marketing networks or retailers fail to report accurately the amount of net revenues payable to us in a timely manner or at all, we will not recognize and collect net revenues to which we are entitled, which could harm our operating results. If we are allowed to audit a performance marketing network or retailer and do so, or if we otherwise dispute the accuracy of a revenue report a performance marketing network or retailer has delivered to us, our recognition of net revenues to which we may ultimately be entitled could be delayed. Conversely, if a performance marketing network or retailer delivers a report overstating the amount of net revenues earned by us in one period and attempts to reverse the overpayment in a subsequent period, whether by seeking a refund from us or reducing a future payment due to us, our recognition of revenue could be overstated. Any such delay or overstatement in our revenue recognition could harm our business and operating results.
We obtain the revenue reporting information from our performance marketing networks using a variety of methods, including the use of file transfer protocol file feeds, various application programming interfaces provided by the performance marketing networks and manual downloads of data from the performance marketing networks’ web portals. However, we currently use only file transfer protocol file feeds and manual downloads when collecting the data we use to record our net revenues. The use of these methods inherently subjects us to lower levels of internal control over revenue data, which could result in a misstatement of our net revenues. We are in the process of converting our method of collecting a substantial portion of the data necessary
35
Table of Contents
to record our net revenues. We intend to automate this process by using the various application programming interfaces provided by the performance marketing networks. While we have developed detailed testing plans for the conversion to this new method, there is an inherent risk that some errors may go undetected for a period of time following conversion, which could result in a misstatement of our net revenues.
If we are unable to comply with all covenants of our current and future debt arrangements, and if our lenders fail to waive any violation of those covenants by us, we could be subject to substantial penalties, which would impair our ability to operate and adversely affect our operating results.
We currently have a term debt facility that provides us with cash, which we use to fund our operations and which requires us to comply with a number of restrictive covenants. We may enter into other debt arrangements in the future, which may contain similar or additional restrictive covenants. We are currently subject to covenants related to minimum trailing twelve month EBITDA levels, a funded debt to EBITDA ratio, a fixed charge coverage ratio (each as more fully described in our amended and restated revolving credit and term loan agreement), and the defense of our intellectual and other property, among others. We may become subject to additional covenants in connection with future debt arrangements. If we are unable to comply with one or more covenants applicable to us and our lenders are unwilling to waive our noncompliance, our lenders may have the right to terminate their commitments to lend to us, cause all amounts outstanding to become due and payable immediately, sell certain of our assets which are collateral for our obligations and take other measures which may impair our operations. If funds under our loan arrangements become unavailable or if we are forced unexpectedly to repay amounts outstanding under our loan arrangements, our assets and cash flow may be insufficient to make such repayments or may leave us with insufficient funds to continue our operations as planned and would have a material adverse effect on our business.
We are subject to currency exchange risk in connection with our international business operations.
Cash inflows and outflows in our international operations are typically denominated in currencies other than the U.S. dollar, which is our functional currency for financial reporting purposes. For 2010, 2011, 2012 and for the nine months ended September 30, 2013, approximately 0.0%, 9.7%, 17.1% and 20.6%, respectively, of our net revenues were denominated in such foreign currencies. Our reliance on foreign currencies subjects our financial results to fluctuations in currency exchange rates and changes in the proportion of our net revenues and expenses attributable to each of our foreign locations. We recognized a foreign exchange loss of $40,000 in 2012. In addition, we expect our exposure to fluctuations in foreign exchange rates to increase as we expand our business in existing and new international markets. Although we do not currently engage in any hedging activities relating to foreign currency, we may in the future enter into hedging arrangements in order to manage foreign currency translation but such activity may not completely eliminate fluctuations in our operating results. Foreign currency exchange rate fluctuations could adversely impact our profitability.
We may be required to record a significant charge to earnings if our goodwill or amortizable intangible assets become impaired.
We are required under GAAP to review our amortizable intangible assets for impairment when events or changes in circumstances indicate the carrying value may not be recoverable. Goodwill is required to be tested for impairment at least annually. Conditions that would necessitate an impairment assessment include a significant decline in the observable market value of an asset, a significant change in the extent or manner in which an asset is used, or any other significant adverse change that would indicate that the carrying amount of an asset or group of assets may not be recoverable. The events and circumstances we consider include the business climate, legal factors, operating performance indicators and competition. We may be required to record a significant charge to earnings in our consolidated financial statements during the period in which any impairment of our goodwill or amortizable intangible assets is determined. This could adversely impact our results of operations.
36
Table of Contents
Risks Related to this Offering and Ownership of Our Series 1 Common Stock
Our stock price may be volatile, and you may be unable to sell your shares at or above the offering price.
The trading price of our Series 1 common stock may be highly volatile and could be subject to wide fluctuations in response to various factors, including the risk factors described in this section of the prospectus, and other factors beyond our control. Factors affecting the trading price of our Series 1 common stock include:
| • | variations in our operating results or the operating results of similar companies; |
| • | announcements of technological innovations, new services or service enhancements and strategic alliances or agreements by us or by our competitors; |
| • | marketing and advertising initiatives by us or our competitors; |
| • | the gain or loss of retailer relationships; |
| • | threatened or actual litigation; |
| • | major changes in our management; |
| • | recruitment or departure of key personnel; |
| • | changes in the estimates of our operating results or changes in recommendations by any securities analysts that follow our Series 1 common stock; |
| • | market conditions in our industry, the industries of our customers and the economy as a whole; |
| • | the overall performance of the equity markets; |
| • | sales of shares of our Series 1 common stock by existing stockholders; |
| • | volatility in our stock price, which may lead to higher stock-based compensation expense under applicable accounting standards; |
| • | adoption or modification of regulations, policies, procedures or programs applicable to our business; and |
| • | the market’s reaction to our reduced disclosure as a result of being an emerging growth company under the JOBS Act. |
In addition, the stock market in general and the market for e-commerce companies in particular, have experienced extreme price and volume fluctuations that have often been unrelated or disproportionate to the operating performance of those companies. Broad market and industry factors may harm the market price of our Series 1 common stock regardless of our actual operating performance. These fluctuations may even be more pronounced in the trading market for our stock shortly following this offering. Each of these factors, among others, could adversely affect your investment in our Series 1 common stock. Some companies that have had volatile market prices for their securities have had securities class action lawsuits filed against them. If a suit were filed against us, regardless of its merits or outcome, it could result in substantial costs and divert management’s attention.
Insiders have substantial control over us, and this control may limit our stockholders’ ability to influence corporate matters and delay or prevent a third party from acquiring control over us.
Upon completion of this offering, our directors and executive officers and their affiliates will beneficially own, in the aggregate, approximately % of our outstanding Series 1 common stock compared to % represented by the shares sold in this offering. Further, we anticipate that C. Thomas Ball, a member of our board of directors and a general partner of Austin Ventures, and Jeffrey M. Crowe, a member of our board of directors and a general partner of Norwest Venture Partners, will hold an aggregate of approximately % and % of our Series 1 common stock, respectively, following this offering. This significant concentration of ownership may
37
Table of Contents
adversely affect the trading price for our Series 1 common stock because investors often perceive disadvantages in owning stock in companies with controlling stockholders. In addition, these stockholders will be able to exercise influence over all matters requiring stockholder approval, including the election of directors and approval of corporate transactions, such as a merger or other sale of our company or its assets. This concentration of ownership could limit your ability to influence corporate matters and may have the effect of delaying or preventing a change in control, including a merger, consolidation or other business combination involving us, or discouraging a potential acquirer from making a tender offer or otherwise attempting to obtain control, even if that change in control would benefit our other stockholders. For information regarding the ownership of our outstanding stock by our executive officers and directors and their affiliates, please see the section titled “Principal and Selling Stockholders.”
Our stock price could decline due to the large number of outstanding shares of our common stock eligible for future sale.
Sales of substantial amounts of our common stock in the public market, or the perception that these sales could occur, could cause the market price of our common stock to decline. These sales could also make it more difficult for us to sell equity or equity-related securities in the future at a time and price that we deem appropriate.
Upon completion of this offering, we will have shares of common stock outstanding. The shares sold in this offering will be, and the 10,454,544 shares sold in our initial public offering were, immediately tradable without restriction. Of the remaining shares, shares will be eligible for sale on January 15, 2014, upon the expiration of lock-up agreements executed in connection with our initial public offering, and shares will be eligible for sale upon the expiration of lock-up agreements executed in connection with this offering, which is expected to occur 90 days after the date of this offering, subject in some cases to volume and other restrictions under Rules 144 and 701 under the Securities Act of 1933, as amended, or the Securities Act, and various vesting agreements. The representatives of the underwriters may, in their sole discretion and at any time without notice, release all or any portion of the securities subject to lock-up agreements.
On August 7, 2013, we registered 10,262,195 shares of our Series 1 common stock that we have issued or may issue under our equity plans, which shares will be eligible for sale upon the expiration of lock-up agreements, subject in some cases to volume and other restrictions under Rules 144 and 701 under the Securities Act, and various vesting agreements. In addition, some of our employees, including some of our named executive officers, have entered into 10b5-1 trading plans regarding sales of shares of our Series 1 common stock. These plans provide for sales to occur from time to time after the expiration of the lock-up period related to our initial public offering, or with respect to any employee who has entered into a 10b5-1 trading plan that also participates as a selling stockholder in this offering, after March 31, 2014. If these additional shares are sold, or if it is perceived that they will be sold, in the public market, the trading price of our common stock could decline. Please see the section titled “Shares Eligible for Future Sale.”
Following this offering, holders of approximately % of our common stock will be entitled to rights with respect to the registration of these shares under the Securities Act. Please see the section titled “Description of Capital Stock—Registration Rights.” If we register their shares of common stock following the expiration of the lock-up agreements, these stockholders could sell those shares in the public market without being subject to the volume and other restrictions of Rule 144 and Rule 701.
We have incurred and will continue to incur significant increased expenses and administrative burdens as a public company, which could have a material adverse effect on our operations and financial results.
We face increased legal, accounting, administrative and other costs and expenses as a public company that we did not incur as a private company. The Sarbanes-Oxley Act of 2002, or the Sarbanes-Oxley Act, including
38
Table of Contents
the requirements of Section 404, as well as rules and regulations subsequently implemented by the Securities and Exchange Commission, or SEC, the Public Company Accounting Oversight Board and the NASDAQ Global Select Market, impose additional reporting and other obligations on public companies. Compliance with public company requirements has increased our costs and made some activities more time-consuming. A number of those requirements require us to carry out activities we have not done previously. For example, we have created new board committees and adopted new internal controls and disclosure controls and procedures. In addition, we have incurred and will continue to incur additional expenses associated with our SEC reporting requirements. Furthermore, if we identify any issues in complying with those requirements (for example, if we or our auditors identify a material weakness or significant deficiency in our internal control over financial reporting), we could incur additional costs rectifying those issues, and the existence of those issues could adversely affect us, our reputation or investor perceptions of us. Risks associated with our status as a public company may make it more difficult for us to attract and retain qualified persons to serve on our board of directors or as executive officers. We expect that the additional reporting and other obligations imposed on us by these rules and regulations will increase our legal and financial compliance costs and the costs of our related legal, accounting and administrative activities by approximately $2.0 million per year. These increased costs will require us to divert a significant amount of money that we could otherwise use to expand our business and achieve our strategic objectives. Advocacy efforts by stockholders and third parties may also prompt additional changes in governance and reporting requirements, which could further increase our costs.
If we fail to maintain proper and effective internal controls, our ability to produce accurate and timely financial statements could be impaired, which could harm our operating results, our ability to operate our business and investors’ views of us.
Ensuring that we have adequate internal financial and accounting controls and procedures in place so that we can produce accurate financial statements on a timely basis is a costly and time-consuming effort that needs to be re-evaluated frequently. Our internal control over financial reporting is a process designed to provide reasonable assurance regarding the reliability of financial reporting and the preparation of financial statements in accordance with GAAP. We are in the process of documenting, reviewing and improving our internal controls and procedures for compliance with Section 404 of the Sarbanes-Oxley Act, which requires annual management assessment of the effectiveness of our internal control over financial reporting. If we fail to maintain proper and effective internal controls, our ability to produce accurate and timely financial statements could be impaired, which could harm our operating results, harm our ability to operate our business, and reduce the trading price of our stock.
As an “emerging growth company” under the JOBS Act, we are permitted to, and intend to, rely on exemptions from certain disclosure requirements, which could make our common stock less attractive to investors.
As an “emerging growth company” under the JOBS Act, we are permitted to, and intend to, rely on exemptions from certain disclosure requirements. In particular, we have not included all of the executive compensation related information that would be required in this prospectus if we were not an emerging growth company. In addition, for so long as we are an emerging growth company, we will not be required to:
| • | have an auditor report on our internal control over financial reporting pursuant to Section 404(b) of the Sarbanes-Oxley Act; |
| • | comply with any requirement that may be adopted by the Public Company Accounting Oversight Board regarding mandatory audit firm rotation or a supplement to the auditor’s report providing additional information about the audit and the financial statements (auditor discussion and analysis); and |
| • | submit certain executive compensation matters to shareholder advisory votes, such as “say on pay” and “say on frequency.” |
39
Table of Contents
In addition, Section 107 of the JOBS Act also provides that an emerging growth company can take advantage of the extended transition period provided in Section 7(a)(2)(B) of the Securities Act for complying with new or revised accounting standards. An emerging growth company can therefore delay the adoption of certain accounting standards until those standards would otherwise apply to private companies.
Although we intend to rely on the exemptions provided in the JOBS Act, the exact implications of the JOBS Act for us are still subject to interpretations and guidance by the SEC and other regulatory agencies. Also, as our business grows, we may no longer satisfy the conditions of an emerging growth company. We will remain an “emerging growth company” until the earliest of (i) the last day of the fiscal year during which we have total annual gross revenues of $1 billion or more; (ii) December 31, 2018; (iii) the date on which we have, during the previous three-year period, issued more than $1 billion in non-convertible debt; and (iv) the date on which we are deemed to be a “large accelerated filer” under the Exchange Act. We will be deemed a large accelerated filer on the first day of the fiscal year after the market value of our common equity held by non-affiliates exceeds $700 million, measured on June 30. We are currently evaluating and monitoring developments with respect to these new rules and we cannot assure you that we will be able to enjoy part or all of the benefits from the JOBS Act. We cannot predict whether investors will find our common stock less attractive to the extent we rely on the exemptions available to emerging growth companies. If some investors find our common stock less attractive as a result, there may be a less active trading market for our common stock and our stock price may be more volatile.
If securities or industry analysts do not continue to publish research or publish unfavorable or misleading research about our business, our stock price and trading volume could decline.
The trading market for our common stock depends in part on the research and reports that securities or industry analysts publish about us or our business. If one or more of the analysts who covers us downgrades our stock or publishes unfavorable or misleading research about our business, our stock price would likely decline. If one or more of these analysts ceases coverage of our company or fails to publish reports on us regularly, we could lose visibility in the market for our stock and demand for our stock could decrease, which could cause our stock price or trading volume to decline.
Anti-takeover provisions in our charter documents and Delaware law could discourage, delay or prevent a change in control of our company and may affect the trading price of our Series 1 common stock.
We are a Delaware corporation and the anti-takeover provisions of the Delaware General Corporation Law, which apply to us, may discourage, delay or prevent a change in control by prohibiting us from engaging in a business combination with an interested stockholder for a period of three years after the stockholder becomes an interested stockholder, even if a change in control would be beneficial to our existing stockholders. For more information, see the section titled “Description of Capital Stock—Anti-Takeover Effects of Our Charter and Bylaws and Delaware Law.” In addition, our amended and restated certificate of incorporation and amended and restated bylaws may discourage, delay or prevent a change in our management or control over us that stockholders may consider favorable. Our amended and restated certificate of incorporation and amended and restated bylaws:
| • | authorize the issuance of “blank check” preferred stock that could be issued by our board of directors to defend against a takeover attempt; |
| • | establish a classified board of directors, as a result of which the successors to the directors whose terms have expired will be elected to serve from the time of election and qualification until the third annual meeting following their election; |
| • | require that directors only be removed from office for cause and only upon a supermajority stockholder vote; |
| • | provide that vacancies on the board of directors, including newly created directorships, may be filled only by a majority vote of directors then in office rather than by stockholders; |
40
Table of Contents
| • | prevent stockholders from calling special meetings; and |
| • | prohibit stockholder action by written consent, requiring all actions to be taken at a meeting of the stockholders. |
We currently do not intend to pay dividends on our common stock and, consequently, your only opportunity to achieve a return on your investment is if the price of our Series 1 common stock appreciates.
We currently do not plan to declare dividends on shares of our common stock in the foreseeable future. Any payment of future dividends will be at the discretion of our board of directors, subject to compliance with certain covenants contained in our credit facility, which limit our ability to pay dividends, and will depend on our financial condition, results of operations, capital requirements, general business conditions, and other factors that our board of directors may deem relevant. For more information, see the section titled “Dividend Policy.” Consequently, your only opportunity to achieve a return on your investment in our company will be if the market price of our common stock appreciates and you sell your shares at a profit. There is no guarantee that the price of our common stock that will prevail in the market after this offering will ever exceed the price that you pay.
Our management will have broad discretion over the use of the proceeds we receive in this offering and might not apply those proceeds in ways that increase the value of your investment.
Our management will have broad discretion to use the net proceeds from this offering, and you will be relying on the judgment of our management regarding the application of these proceeds. Our management might not apply the net proceeds of this offering in ways that increase the value of your investment. We expect to use the net proceeds from this offering for general corporate purposes, including working capital and capital expenditures, which may in the future include investments in, or acquisitions of, complementary businesses, services or technologies. We have not allocated the net proceeds for general corporate purposes to any specific purpose. Our management might not be able to yield a significant return, if any, on any investment of these net proceeds. You will not have the opportunity to influence our decisions on how the net proceeds from this offering are used. For more information, please see the section titled “Use of Proceeds.”
41
Table of Contents
SPECIAL NOTE REGARDING FORWARD-LOOKING STATEMENTS AND INDUSTRY DATA
This prospectus, including the sections titled “Summary,” “Risk Factors,” “Management’s Discussion and Analysis of Financial Condition and Results of Operations” and “Business,” contains forward-looking statements. Forward-looking statements convey our current expectations or forecasts of future events. All statements contained in this prospectus, other than statements of historical fact, are forward-looking. You can identify forward-looking statements by terminology such as “anticipates,” “believes,” “can,” “continue,” “could,” “estimates,” “expects,” “intends,” “may,” “plans,” “seeks,” “should,” “will,” or “would” or the negative of these terms or similar expressions.
There are a number of important factors that could cause our actual results to differ materially from the results anticipated by these forward-looking statements. These important factors include those that we discuss in the section titled “Risk Factors.” You should read these factors and the other cautionary statements made in this prospectus as being applicable to all related forward-looking statements wherever they appear in this prospectus. If one or more of these factors materialize, or if any underlying assumptions prove incorrect, our actual results, performance or achievements may vary materially from any future results, performance or achievements expressed or implied by these forward-looking statements. We undertake no obligation to update publicly any forward-looking statements, whether as a result of new information, future events or otherwise, except as required by law.
Unless otherwise indicated, information contained in this prospectus concerning our industry and the markets in which we operate, including our general expectations and market position, market opportunity and market share, is based on information from various sources (including comScore, eMarketer, the e-tailing group, Euromonitor International, Forrester Research, Inc., IDC, Internet Retailer and other industry publications, surveys, forecasts and our internal research), and on assumptions that we have made, which we believe are reasonable, based on those data and other similar sources and on our knowledge of the markets for our services. Our internal research has not been verified by any independent source, and we have not independently verified any third-party information and cannot assure you of its accuracy or completeness. While we believe the market position, market opportunity and market share information included in this prospectus is generally reliable, such information is inherently imprecise. In addition, projections, assumptions and estimates of our future performance and the future performance of the industry in which we operate are necessarily subject to a high degree of uncertainty and risk due to a variety of factors, including those described in the section titled “Risk Factors” and elsewhere in this prospectus. These and other factors could cause results to differ materially from those expressed in the projections, assumptions and estimates included in this prospectus.
42
Table of Contents
We estimate that the net proceeds to us from this offering will be approximately $ million, based on an assumed public offering price of $ per share, which was the closing price of our Series 1 common stock as reported on the NASDAQ Global Select Market on December , 2013, after deducting underwriting discounts and commissions and estimated offering expenses payable by us. If the underwriters exercise their option to purchase additional shares, there will be no change in total proceeds to us, as any additional shares would be sold by the selling stockholders.
We will not receive any proceeds from the sale of shares of Series 1 common stock by the selling stockholders. The selling stockholders who are our executive officers, members of our board of directors, beneficial owners of 5.0% or more of our outstanding shares of common stock and affiliated entities, will receive approximately $ million of net proceeds from the sale of shares in this offering, after deducting underwriting discounts and commissions payable by such selling stockholders.
We do not have current specific plans for the use of a significant portion of the net proceeds from this offering. We generally intend to use the balance of the net proceeds of this offering for working capital and other general corporate purposes, including developing new technologies, funding capital expenditures or making investments in or acquisitions of other businesses, solutions or technologies.
Pending the uses mentioned above, we intend to invest the net proceeds of this offering in short-term, interest-bearing, investment-grade securities. Our management will have broad discretion in the application of the net proceeds to us from this offering, and investors will be relying on the judgment of our management regarding the application of the proceeds.
43
Table of Contents
MARKET PRICE OF SERIES 1 COMMON STOCK
Our Series 1 common stock has been listed on the NASDAQ Global Select Market under the symbol “SALE” since July 19, 2013. Prior to that date, there was no public trading market for our Series 1 common stock. Our Series 1 common stock priced at $21.00 per share in our initial public offering on July 18, 2013. The following table sets forth for the periods indicated the high and low intra-day sale prices per share of our Series 1 common stock as reported on the NASDAQ Global Select Market:
| High | Low | |||||||
| Third Quarter (from July 19, 2013) |
$ | 39.50 | $ | 26.12 | ||||
| Fourth Quarter (through November 29, 2013) |
$ | 36.30 | $ | 27.76 | ||||
On November 29, 2013, the last reported sale price of our Series 1 common stock on the NASDAQ Global Select Market was $28.67 per share. As of September 30, 2013, we had 31 holders of record of our Series 1 and Series 2 common stock. The actual number of holders of Series 1 and Series 2 common stock is greater than these numbers of record holders and includes stockholders who are beneficial owners, but whose shares are held in street name by brokers and nominees. The number of holders of record also does not include stockholders whose shares may be held in trust by other entities.
44
Table of Contents
We have never declared or paid any cash dividends on our common stock. Neither Delaware law nor our amended and restated certificate of incorporation requires our board of directors to declare dividends on our common stock. Any future determination to declare cash dividends on our common stock will be made at the discretion of our board of directors and will depend on our financial condition, results of operations, capital requirements, general business conditions and other factors that our board of directors may deem relevant. We do not anticipate paying cash dividends on our common stock for the foreseeable future.
45
Table of Contents
The following table sets forth our capitalization as of September 30, 2013, on:
| • | an actual basis; |
| • | an as adjusted basis giving effect to the sale by us of shares of Series 1 common stock in this offering at an assumed public offering price of $ per share, which was the closing price of our Series 1 common stock as reported on the NASDAQ Global Select Market on December , 2013, after deducting underwriting discounts and commissions and estimated offering expenses payable by us. |
You should read the information in this table together with our consolidated financial statements and related notes, the sections titled “Selected Consolidated Financial and Other Data” and “Management’s Discussion and Analysis of Financial Condition and Results of Operations” and the other information appearing elsewhere in this prospectus.
| As of September 30, 2013 |
||||||||
| Actual | As Adjusted |
|||||||
| (Unaudited) (dollars in thousands) |
||||||||
| Cash and cash equivalents |
$ | 136,408 | $ | |||||
|
|
|
|
|
|||||
| Long-term debt, including current maturities |
$ | 42,972 | $ | 42,972 | ||||
| Stockholders’ Equity (Deficit): |
||||||||
| Preferred stock: $0.001 par value, 10,000,000 shares authorized, no shares issued or outstanding, actual and as adjusted |
— | — | ||||||
| Series 1 common stock: $0.001 par value, 150,000,000 shares authorized, 44,453,021 shares issued and outstanding, actual; 150,000,000 shares authorized, 48,053,021 shares issued and outstanding, as adjusted |
45 | |||||||
| Series 2 common stock: $.001 par value, 6,107,494 shares authorized, issued and outstanding, actual and as adjusted |
6 | 6 | ||||||
| Additional paid-in capital |
414,068 | |||||||
| Accumulated other comprehensive loss |
(91 | ) | (91 | ) | ||||
| Accumulated deficit |
(51,582 | ) | (51,582 | ) | ||||
|
|
|
|
|
|||||
| Total stockholders’ equity (deficit) |
362,446 | |||||||
|
|
|
|
|
|||||
| Total capitalization |
$ | 405,418 | $ | |||||
|
|
|
|
|
|||||
The number of shares of Series 1 and Series 2 common stock reflected in the discussion and the table above is based on 44,453,021 shares of Series 1 common stock and 6,107,494 shares of Series 2 common stock outstanding as of September 30, 2013, and excludes:
| • | 5,555,499 shares of Series 1 common stock issuable upon exercise of options outstanding as of September 30, 2013, at a weighted-average exercise price of $10.96 per share; |
| • | 4,089,786 shares of Series 1 common stock, subject to increase on an annual basis, reserved for future issuance under our 2013 Equity Incentive Plan; and |
| • | 560,907 shares of Series 1 common stock, subject to increase on an annual basis, reserved for future issuance under our 2013 Employee Stock Purchase Plan. |
46
Table of Contents
SELECTED CONSOLIDATED FINANCIAL AND OTHER DATA
The tables on the following pages set forth the consolidated financial and operating data as of and for the periods indicated. Financial information for periods prior to 2010 has not been provided as we had no significant operations prior to 2010. The consolidated statements of operations data presented below for the years ended December 31, 2010, 2011 and 2012 and the consolidated balance sheet data as of December 31, 2011 and 2012 have been derived from the audited consolidated financial statements that are included elsewhere in this prospectus. The consolidated statements of operations data presented below for the nine months ended September 30, 2012 and 2013 and the consolidated balance sheet data as of September 30, 2013 have been derived from the unaudited interim consolidated financial statements that are included elsewhere in this prospectus.
We acquired the businesses of RetailMeNot.com in November 2010, VoucherCodes.co.uk in August 2011, Web.Bons-de-Reduction.com and Poulpeo.com in May 2012, Actiepagina.nl in March 2013, Ma-Reduc.com in July 2013 and YSL Ventures in October 2013. The consolidated statements of operations, balance sheets and statements of cash flows include the results of businesses acquired from the effective date of the acquisition for accounting purposes.
The following information should be read in conjunction with our consolidated financial statements and related notes, the sections titled “Risk Factors” and “Management’s Discussion and Analysis of Financial Condition and Results of Operations” and the other information included elsewhere in this prospectus. Our historical results are not necessarily indicative of our future results.
| Year Ended December 31, |
Nine Months Ended September 30, |
|||||||||||||||||||
| 2010 | 2011 | 2012 | 2012 | 2013 | ||||||||||||||||
| (in thousands, except per share amounts) | ||||||||||||||||||||
| Consolidated Statements of Operations Data: |
||||||||||||||||||||
| Net revenues |
$ | 16,862 | $ | 80,402 | $ | 144,685 | $ | 93,895 | $ | 131,312 | ||||||||||
| Costs and expenses: |
||||||||||||||||||||
| Cost of net revenues |
1,848 | 3,980 | 9,113 | 6,475 | 8,735 | |||||||||||||||
| Product development |
658 | 4,388 | 14,481 | 9,326 | 21,103 | |||||||||||||||
| Sales and marketing |
5,661 | 15,341 | 40,672 | 22,543 | 40,974 | |||||||||||||||
| General and administrative |
2,472 | 6,883 | 15,758 | 10,777 | 19,919 | |||||||||||||||
| Amortization of purchased intangible assets |
3,394 | 11,296 | 13,158 | 10,244 | 8,673 | |||||||||||||||
| Other operating expenses |
— | 35 | 6,006 | 2,611 | 1,299 | |||||||||||||||
|
|
|
|
|
|
|
|
|
|
|
|||||||||||
| Total costs and expenses |
14,033 | 41,923 | 99,188 | 61,976 | 100,703 | |||||||||||||||
|
|
|
|
|
|
|
|
|
|
|
|||||||||||
| Income from operations |
2,829 | 38,479 | 45,497 | 31,919 | 30,609 | |||||||||||||||
| Other income (expense): |
||||||||||||||||||||
| Interest expense, net |
(930 | ) | (7,784 | ) | (3,221 | ) | (2,519 | ) | (2,410 | ) | ||||||||||
| Fair value change of common stock warrant |
— | (2,103 | ) | — | — | — | ||||||||||||||
| Fair value change of contingent consideration, net |
1,994 | — | — | — | — | |||||||||||||||
| Other income (expense), net |
(16 | ) | (129 | ) | 77 | 49 | 451 | |||||||||||||
|
|
|
|
|
|
|
|
|
|
|
|||||||||||
| Income before income taxes |
3,877 | 28,463 | 42,353 | 29,449 | 28,650 | |||||||||||||||
| Provision for income taxes |
(1,533 | ) | (11,502 | ) | (16,360 | ) | (11,201 | ) | (10,959 | ) | ||||||||||
|
|
|
|
|
|
|
|
|
|
|
|||||||||||
| Net income |
$ | 2,344 | $ | 16,961 | $ | 25,993 | $ | 18,248 | $ | 17,691 | ||||||||||
|
|
|
|
|
|
|
|
|
|
|
|||||||||||
| Preferred stock dividends on participating preferred stock |
(3,247 | ) | (64,715 | ) | (24,577 | ) | (18,388 | ) | (19,928 | ) | ||||||||||
|
|
|
|
|
|
|
|
|
|
|
|||||||||||
| Total undistributed earnings (loss) |
(903 | ) | (47,754 | ) | 1,416 | (140 | ) | (2,237 | ) | |||||||||||
| Undistributed earnings allocated to participating preferred stock |
— | — | (1,390 | ) | — | — | ||||||||||||||
|
|
|
|
|
|
|
|
|
|
|
|||||||||||
| Net income (loss) attributable to common stockholders |
$ | (903 | ) | $ | (47,754 | ) | $ | 26 | $ | (140 | ) | $ | (2,237 | ) | ||||||
|
|
|
|
|
|
|
|
|
|
|
|||||||||||
| Net income (loss) per share attributable to common stockholders: |
||||||||||||||||||||
| Basic and diluted |
$ | (1.27 | ) | $ | (64.19 | ) | $ | 0.03 | $ | (0.17 | ) | $ | (0.16 | ) | ||||||
|
|
|
|
|
|
|
|
|
|
|
|||||||||||
| Weighted-average number of shares used in computing net income (loss) per share: |
||||||||||||||||||||
| Basic |
709 | 744 | 841 | 821 | 13,703 | |||||||||||||||
|
|
|
|
|
|
|
|
|
|
|
|||||||||||
| Diluted |
709 | 744 | 2,277 | 821 | 13,703 | |||||||||||||||
|
|
|
|
|
|
|
|
|
|
|
|||||||||||
47
Table of Contents
| Year Ended December 31, |
Nine Months Ended September 30, |
|||||||||||||||||||
| 2010 | 2011 | 2012 | 2012 | 2013 | ||||||||||||||||
| Consolidated Statements of Operations Data as Percentage of Net Revenues: |
||||||||||||||||||||
| Net revenues |
100.0 | % | 100.0 | % | 100.0 | % | 100.0 | % | 100.0 | % | ||||||||||
| Costs and expenses: |
||||||||||||||||||||
| Cost of net revenues |
11.0 | 5.0 | 6.3 | 6.9 | 6.7 | |||||||||||||||
| Product development |
3.9 | 5.5 | 10.0 | 9.9 | 16.1 | |||||||||||||||
| Sales and marketing |
33.6 | 19.1 | 28.1 | 24.0 | 31.2 | |||||||||||||||
| General and administrative |
14.7 | 8.6 | 10.9 | 11.5 | 15.2 | |||||||||||||||
| Amortization of purchased intangible assets |
20.1 | 14.0 | 9.1 | 10.9 | 6.6 | |||||||||||||||
| Other operating expenses |
— | — | 4.2 | 2.8 | 0.9 | |||||||||||||||
|
|
|
|
|
|
|
|
|
|
|
|||||||||||
| Total costs and expenses |
83.3 | 52.2 | 68.6 | 66.0 | 76.7 | |||||||||||||||
|
|
|
|
|
|
|
|
|
|
|
|||||||||||
| Income from operations |
16.7 | 47.8 | 31.4 | 34.0 | 23.3 | |||||||||||||||
| Other income (expense): |
||||||||||||||||||||
| Interest expense, net |
(5.5 | ) | (9.7 | ) | (2.2 | ) | (2.7 | ) | (1.8 | ) | ||||||||||
| Fair value change of common stock warrant |
— | (2.6 | ) | — | — | — | ||||||||||||||
| Fair value change of contingent consideration, net |
11.8 | — | — | — | — | |||||||||||||||
| Other income (expense), net |
(0.1 | ) | (0.2 | ) | 0.1 | 0.1 | 0.3 | |||||||||||||
|
|
|
|
|
|
|
|
|
|
|
|||||||||||
| Income before income taxes |
22.9 | 35.3 | 29.3 | 31.4 | 21.8 | |||||||||||||||
| Provision for income taxes |
(9.1 | ) | (14.3 | ) | (11.3 | ) | (12.0 | ) | (8.3 | ) | ||||||||||
|
|
|
|
|
|
|
|
|
|
|
|||||||||||
| Net income |
13.8 | % | 21.0 | % | 18.0 | % | 19.4 | % | 13.5 | % | ||||||||||
|
|
|
|
|
|
|
|
|
|
|
|||||||||||
| As of December 31, | As of September 30, |
|||||||||||
| 2011 | 2012 | 2013 | ||||||||||
| (dollars in thousands) | ||||||||||||
| Consolidated Balance Sheet Data: |
||||||||||||
| Cash and cash equivalents |
$ | 88,234 | $ | 97,142 | $ | 136,408 | ||||||
| Working capital |
78,631 | 98,152 | 141,122 | |||||||||
| Total assets |
347,326 | 370,920 | 432,171 | |||||||||
| Total liabilities |
74,817 | 63,266 | 69,725 | |||||||||
| Redeemable convertible preferred stock |
321,450 | 349,027 | — | |||||||||
| Total stockholders’ equity (deficit) |
(48,941 | ) | (41,373 | ) | 362,446 | |||||||
| Year Ended December 31, | Nine Months Ended September 30, | |||||||||||||||||||
| 2010 | 2011 | 2012 | 2012 | 2013 | ||||||||||||||||
| (in thousands, except net revenues per visit) | ||||||||||||||||||||
| Operating Metrics:(1) |
||||||||||||||||||||
| Visits |
108,574 | 349,992 | 464,240 | 315,802 | 376,289 | |||||||||||||||
| Net revenues per visit |
$ | 0.16 | $ | 0.23 | $ | 0.31 | $ | 0.30 | $ | 0.35 | ||||||||||
| Year Ended December 31, | Nine Months Ended September 30, | |||||||||||||||||||
| 2010 | 2011 | 2012 | 2012 | 2013 | ||||||||||||||||
| (dollars in thousands) | ||||||||||||||||||||
| Other Financial Data: |
||||||||||||||||||||
| Adjusted EBITDA(1) |
$ | 6,800 | $ | 51,895 | $ | 70,373 | $ | 48,657 | $ | 50,357 | ||||||||||
| (1) | See the section titled “Management’s Discussion and Analysis of Financial Condition and Results of Operations—Key Financial and Operating Metrics” on page 54 for a description of these operating metrics. |
| (2) | We define adjusted EBITDA as net income plus depreciation, amortization of intangible assets, stock-based compensation expense, third-party acquisition-related costs, other non-cash operating expenses (including asset |
48
Table of Contents
| impairment charges and compensation-related charges associated with seller notes issued in connection with acquisitions), net interest expense, other non-operating income or expense (including changes in fair value of warrant liabilities and contingent consideration) and income taxes, net of any foreign exchange income or expense. |
The following table presents a reconciliation of adjusted EBITDA to net income for each of the periods indicated:
| Year Ended December 31, | Nine Months Ended September 30, |
|||||||||||||||||||
| 2010 | 2011 | 2012 | 2012 | 2013 | ||||||||||||||||
| (dollars in thousands) | ||||||||||||||||||||
| Reconciliation of Adjusted EBITDA: |
||||||||||||||||||||
| Net income |
$ | 2,344 | $ | 16,961 | $ | 25,993 | $ | 18,248 | $ | 17,691 | ||||||||||
| Depreciation and amortization expense |
3,460 | 11,556 | 14,192 | 10,938 | 10,076 | |||||||||||||||
| Stock-based compensation expense |
68 | 471 | 4,048 | 2,559 | 7,068 | |||||||||||||||
| Third-party acquisition-related costs |
443 | 1,354 | 630 | 630 | 1,305 | |||||||||||||||
| Other operating expenses |
— | 35 | 6,006 | 2,611 | 1,299 | |||||||||||||||
| Interest expense, net |
930 | 7,784 | 3,221 | 2,519 | 2,410 | |||||||||||||||
| Fair value change of common stock warrant |
— | 2,103 | — | — | — | |||||||||||||||
| Fair value change of contingent consideration, net |
(1,994 | ) | — | — | — | — | ||||||||||||||
| Other (income) expense, net |
16 | 129 | (77 | ) | (49 | ) | (451 | ) | ||||||||||||
| Provision for income taxes |
1,533 | 11,502 | 16,360 | 11,201 | 10,959 | |||||||||||||||
|
|
|
|
|
|
|
|
|
|
|
|||||||||||
| Adjusted EBITDA |
$ | 6,800 | $ | 51,895 | $ | 70,373 | $ | 48,657 | $ | 50,357 | ||||||||||
|
|
|
|
|
|
|
|
|
|
|
|||||||||||
The following tables present depreciation and stock-based compensation expense as included in the various lines of our consolidated statements of operations:
| Year Ended December 31, | Nine Months Ended September 30, |
|||||||||||||||||||
| 2010 | 2011 | 2012 | 2012 | 2013 | ||||||||||||||||
| (dollars in thousands) | ||||||||||||||||||||
| Depreciation Expense: |
||||||||||||||||||||
| Cost of net revenues |
$ | 16 | $ | 62 | $ | 99 | $ | 45 | $ | 199 | ||||||||||
| Product development |
12 | 74 | 380 | 236 | 570 | |||||||||||||||
| Sales and marketing |
27 | 84 | 382 | 302 | 417 | |||||||||||||||
| General and administrative |
11 | 40 | 173 | 111 | 217 | |||||||||||||||
|
|
|
|
|
|
|
|
|
|
|
|||||||||||
| Total depreciation expense |
$ | 66 | $ | 260 | $ | 1,034 | $ | 694 | $ | 1,403 | ||||||||||
|
|
|
|
|
|
|
|
|
|
|
|||||||||||
| Year Ended December 31, | Nine Months Ended September 30, |
|||||||||||||||||||
| 2010 | 2011 | 2012 | 2012 | 2013 | ||||||||||||||||
| (dollars in thousands) | ||||||||||||||||||||
| Stock-Based Compensation Expense: |
||||||||||||||||||||
| Cost of net revenues |
$ | 1 | $ | 23 | $ | 157 | $ | 81 | $ | 449 | ||||||||||
| Product development |
12 | 164 | 1,144 | 713 | 1,641 | |||||||||||||||
| Sales and marketing |
23 | 113 | 993 | 592 | 1,568 | |||||||||||||||
| General and administrative |
32 | 171 | 1,754 | 1,173 | 3,410 | |||||||||||||||
|
|
|
|
|
|
|
|
|
|
|
|||||||||||
| Total stock-based compensation expense |
$ | 68 | $ | 471 | $ | 4,048 | $ | 2,559 | $ | 7,068 | ||||||||||
|
|
|
|
|
|
|
|
|
|
|
|||||||||||
49
Table of Contents
Non-GAAP Financial Measures
Adjusted EBITDA
To provide investors with additional information regarding our financial results, we have disclosed in the table above and elsewhere in this prospectus adjusted EBITDA, a non-GAAP financial measure. We have provided a reconciliation above of adjusted EBITDA to net income, the most directly comparable GAAP financial measure.
We have included adjusted EBITDA in this prospectus because it is a key measure used by our management and board of directors to understand and evaluate our operating performance for the following reasons:
| • | our management uses adjusted EBITDA in conjunction with GAAP financial measures as part of our assessment of our business and in communications with our board of directors concerning our financial performance; |
| • | our management and board of directors use adjusted EBITDA in establishing budgets, operational goals and as an element in determining executive compensation; |
| • | adjusted EBITDA provides consistency and comparability with our past financial performance, facilitates period-to-period comparisons of operations that could otherwise be masked by the effect of the expenses that we exclude in this non-GAAP financial measure and facilitates comparisons with other peer companies, many of which use similar non-GAAP financial measures to supplement their GAAP results; |
| • | securities analysts use a measure similar to our adjusted EBITDA as a supplemental measure to evaluate the overall operating performance and comparison of companies, and we include adjusted EBITDA in our investor and analyst presentations; and |
| • | adjusted EBITDA excludes non-cash charges, such as depreciation, amortization and stock-based compensation, because such non-cash expenses in any specific period may not directly correlate to the underlying performance of our business operations and can vary significantly between periods. |
Adjusted EBITDA has limitations as an analytical tool, and you should not consider it in isolation or as a substitute for analysis of our results as reported under GAAP. Some of these limitations are:
| • | although depreciation and amortization are non-cash charges, the assets being depreciated and amortized may have to be replaced in the future, and adjusted EBITDA does not reflect cash capital expenditure requirements for such replacements or for new capital expenditure requirements; |
| • | adjusted EBITDA excludes stock-based compensation expense which has been, and will continue to be for the foreseeable future, a significant recurring expense in our business and is an important part of our employees’ compensation; |
| • | adjusted EBITDA does not reflect changes in, or cash requirements for, our working capital needs; |
| • | adjusted EBITDA does not reflect tax payments that may represent a reduction in cash available to us; and |
| • | other companies, including companies in our industry, may calculate adjusted EBITDA differently, which reduces its usefulness as a comparative measure. |
Because of these limitations, you should consider adjusted EBITDA alongside other financial performance measures, including various cash flow metrics, net income and our other GAAP results.
50
Table of Contents
MANAGEMENT’S DISCUSSION AND ANALYSIS OF
FINANCIAL CONDITION AND RESULTS OF OPERATIONS
The following discussion and analysis of our financial condition and results of operations should be read in conjunction with our consolidated financial statements and related notes included elsewhere in this prospectus. In addition to historical consolidated financial information, the following discussion contains forward-looking statements that reflect our plans, estimates and beliefs. Our actual results could differ materially from those discussed in the forward-looking statements. Factors that could cause or contribute to these differences include those discussed below and elsewhere in this prospectus, particularly in the section titled “Risk Factors.”
We operate the world’s largest digital coupon marketplace, connecting consumers with leading retailers and brands. In 2012, our marketplace featured digital coupons from over 60,000 retailers and brands, and according to our internal data compiled using Google Analytics, we had more than 450 million total visits to our desktop and mobile websites. As of December 31, 2012, we had contracts with more than 10,000 retailers. We own and operate the largest digital coupon marketplaces in the U.S. (RetailMeNot.com) and the U.K. (VoucherCodes.co.uk) and the largest portfolio of digital coupon websites in France (Web.Bons-de-Reduction.com, Poulpeo.com and Ma-Reduc.com).
We derive substantially all of our net revenues from retailers or brands who pay us directly or through third-party performance marketing networks. A retailer is a merchant that sells goods or services directly to consumers. A paid retailer is a retailer or brand with which we have a contract pursuant to which it has agreed to pay us a commission for sales attributable to us using affiliate tracking links to digital coupons made available in our marketplace. These contracts specify the default commission rate that a paid retailer agrees to pay us, however, we generally attempt to negotiate increases in these rates with most of our top paid retailers. In 2012, we had contracts with more than 10,000 individual paid retailers. In some instances, the paid retailer itself provides affiliate tracking links for attribution of sales using digital coupons made available in our marketplace and pays us directly. However, in most cases, paid retailers contract with performance marketing networks to provide affiliate tracking links for attribution of sales using digital coupons made available in our marketplace. These paid retailers then pay the commissions we earn to the performance marketing network, which in turn pays those commissions to us. In general, our contracts with performance marketing networks govern our use of affiliate tracking links made available to us by the performance marketing network and the remittance of any commissions payable to us from paid retailers utilizing the performance marketing network. The performance marketing network with which a paid retailer contracts to provide affiliate tracking links provides us with the paid retailer’s contract terms, which must be accepted by us and the paid retailer, and which further govern our use of affiliate tracking links for such paid retailer and payment of commissions to us. Our contracts are generally short term, meaning that they can be cancelled by any of the contracting parties on 30 days’ notice or less.
In 2012 and in the nine months ended September 30, 2013, 96.9% and 97.1% of our net revenues, respectively, were derived from commissions earned when consumers made purchases using digital coupons featured on our websites and mobile applications, and 3.1% and 2.9% of our net revenues, respectively, were earned from advertising placements. We expect that substantially all of our net revenues in the future will continue to be derived from commissions. Commission rates are determined through negotiations with retailers based on a variety of factors, including the level of exposure to consumers in our marketplace, the quality and volume of sales realized from consumers using digital coupons from our marketplace and the category of products purchased using digital coupons. We sell our solutions to retailers through a direct sales force. We have contracts with more than 10,000 of the over 60,000 retailers whose digital coupons are featured in our marketplace.
Our net revenues increased from $16.9 million in 2010 to $144.7 million in 2012, representing a 192.9% CAGR. In the same period, our net income increased from $2.3 million to $26.0 million representing a 233.0% CAGR, and our adjusted EBITDA increased from $6.8 million in 2010 to $70.4 million in 2012, representing a 221.7% CAGR. Our historic growth has been driven organically and through acquisitions. From 2011 to 2012 our consolidated net revenues grew from $80.4 million to $144.7 million. During this period, net revenues from
51
Table of Contents
RetailMeNot.com grew from $60.5 million to $113.4 million. This $52.9 million increase in net revenues from RetailMeNot.com represented 82.3% of our consolidated net revenues growth. During the nine months ended September 30, 2013, we generated net revenues of $131.3 million, representing a 39.8% increase from the $93.9 million in net revenues we generated during the nine months ended September 30, 2012. Net income changed from $18.2 million for the nine months ended September 30, 2012 to $17.7 million for the nine months ended September 30, 2013, resulting in a 2.7% decrease from the nine months ended September 30, 2012. Adjusted EBITDA for the nine months ended September 30, 2013 grew to $50.4 million, a 3.5% increase from the $48.7 million in adjusted EBITDA generated during the nine months ended September 30, 2012. From the nine months ended September 30, 2012 to the nine months ended September 30, 2013, organic net revenues grew from $93.9 million to $126.9 million. This $33.0 million increase represented 88.1% of our consolidated net revenues growth. We have increased commissions as a result of increased commerce driven by an increase in consumer visits to our websites, an increase in digital coupons available in our marketplace and an increase in the dollar amount of products purchased by consumers. See page 50 for further discussion of adjusted EBITDA, our use of this measure, the limitations of this measure as an analytical tool, and the reconciliation of adjusted EBITDA to net income, the most directly comparable GAAP financial measure.
To date, we have expanded our operations outside of the U.S. to the U.K., France, Germany and the Netherlands. We evaluate new market opportunities based on a number of market-specific factors, including the target market’s population size, local gross domestic product, or GDP, the size and the growth of e-commerce within the target market, the significance of Internet penetration in the target market, the breadth and depth of online retailers, the adoption of performance marketing by retail advertisers in the target market and consumer adoption and popularity of digital coupons. Each factor is weighted differently based on what we believe is important to our success in the market. We have made substantial investments in our international operations personnel, technology and infrastructure to drive consumer traffic and improved monetization to enhance our net revenues growth. We intend to continue to pursue a strategy of significant investment internationally.
52
Table of Contents
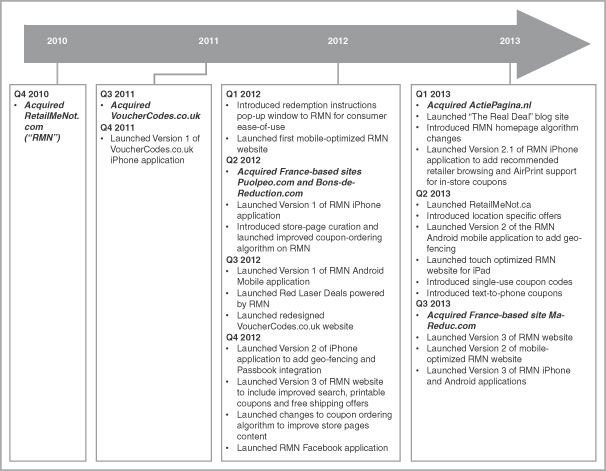
We were formed in 2007 and began our operations as a digital coupon marketplace in November 2009 with the acquisitions of the businesses of Deals2Buy.com, Coupon7.com, Couponshare.com and CheapStingyBargains.com. In November 2010, we acquired the business of RetailMeNot.com. As a result, our net revenues for 2010 include the net revenues of RetailMeNot.com for the period from the acquisition date through December 31, 2010 of $5.3 million, or 31.4% of 2010 net revenues. In August 2011, we acquired the business of VoucherCodes.co.uk, expanding our operations into the U.K. Our net revenues for 2011 include the net revenues of VoucherCodes.co.uk for the period from the acquisition date through December 31, 2011 of $7.8 million, or 9.7% of 2011 net revenues. In April 2012, we acquired the businesses of Web.Bons-de-Reduction.com and Poulpeo.com, expanding our operations into France. Our net revenues for 2012 include the net revenues of Web.Bons-de-Reduction.com and Poulpeo.com for the period from the acquisition date through December 31, 2012 of $3.3 million or 2.3% of 2012 net revenues. In March 2013, we acquired the business of Actiepagina.nl, expanding our operations into the Netherlands. In July 2013, we acquired the business of Ma-Reduc.com. Our net revenues for the nine months ended September 30, 2013 include the revenues of Actiepagina.nl and Ma-Reduc.com for the period from the acquisition date through September 30, 2013, which were not significant. In October 2013, we acquired the business of YSL Ventures, Inc.
Our acquisitions have required us to integrate new operations, offices and employees and to formulate and execute on marketing, product, partner management, content and technology strategies associated with the acquired businesses. We continue to manage multiple brands and technology platforms of the acquired businesses, which has increased our cost of operations.
53
Table of Contents
We believe that featuring desirable digital coupons is necessary to attract visitors to our marketplace, which includes our websites, mobile applications and email and social media distribution channels. In addition to increasing the number of visitors to our marketplace, we are focused on increasing the rate and frequency at which these visitors make purchases from retailers whose digital coupons are featured in our marketplace. To meet these challenges, we are focused on a combination of marketing strategies, including pay-per-click advertising, search engine optimization and branding campaigns, with a goal of driving visits to our marketplace as well as increasing the exposure of the digital coupon category. We are also investing in product enhancements to make it easier for consumers visiting our marketplace to search and find the right digital coupons. We believe these enhancements will increase consumers’ interactions with our retailers, which will in turn increase the value we are able to provide to our paid retailers.
We intend to achieve future success by continuing to focus on recruiting, training and retaining talented employees, increasing our branding efforts and strengthening our relationships with retailers. We also plan to improve the consistency and reliability of our marketplace by investing in the development and implementation of certain universal software platforms to support all of our websites. We believe this investment will allow us to more easily and rapidly integrate the systems of any additional digital coupon businesses which we may acquire and should result in increased operational efficiency. We believe that these significant investments in our team, branding, relationships and technology will enable our expansion into new markets and improve the quality and consistency of our marketplace.
Key Financial and Operating Metrics
We measure our business using both financial and operating metrics. We use these metrics to assess the progress of our business, make decisions on where to allocate capital, time and technology investments, and assess the longer-term performance of our business. The key financial and operating metrics we use are as follows:
| Year Ended December 31, | Nine Months Ended September 30, | |||||||||||||||||||
| 2010 | 2011 | 2012 | 2012 | 2013 | ||||||||||||||||
| (in thousands, except net revenues per visit) | ||||||||||||||||||||
| Financial Metrics |
||||||||||||||||||||
| Net revenues |
$ | 16,862 | $ | 80,402 | $ | 144,685 | $ | 93,895 | $ | 131,312 | ||||||||||
| Adjusted EBITDA |
6,800 | 51,895 | 70,373 | 48,657 | 50,357 | |||||||||||||||
| Operating Metrics |
||||||||||||||||||||
| Visits |
108,574 | 349,992 | 464,240 | 315,802 | 376,289 | |||||||||||||||
| Net revenues per visit |
$ | 0.16 | $ | 0.23 | $ | 0.31 | $ | 0.30 | $ | 0.35 | ||||||||||
Financial Metrics
Net Revenues. Substantially all of our net revenues consist of commissions we receive from paid retailers, either directly or through performance marketing networks. In general, we earn a commission from a paid retailer when a consumer clicks on a digital coupon for that paid retailer on one of our websites or mobile applications and then makes a purchase from that paid retailer. In some instances, we earn commissions from a paid retailer when a consumer presents a digital coupon to the retailer and the digital coupon is scanned or a unique digital coupon code is entered by the retailer at the point of sale. We also earn advertising revenues from advertising placements on our websites and mobile applications. We believe net revenues are an important indicator for our business because they are a reflection of the value we offer to consumers and retailers through our websites and mobile applications.
Adjusted EBITDA. We define this metric as net income plus depreciation, amortization of intangible assets, stock-based compensation expense, third party acquisition-related costs, other non-cash operating expenses
54
Table of Contents
(including asset impairment charges and compensation-related charges associated with seller notes issued in connection with acquisitions), net interest expense, other non-operating income and expenses (including changes in fair value of warrant liabilities and contingent consideration) and income taxes net of any foreign exchange income or expenses. We believe that the use of adjusted EBITDA is helpful in evaluating our operating performance because it excludes certain non-cash expenses, including depreciation, amortization of intangible assets and stock-based compensation expense. See footnote 2 on page 48 to the table in the section titled “Selected Consolidated Financial and Other Data” for additional discussion of adjusted EBITDA and the reconciliation to net income.
Operating Metrics
Visits. We define a visit as a group of interactions that take place on one of our websites within a given time frame as measured by Google Analytics, a product that provides digital marketing intelligence. A single visit can contain multiple page views, events, social interactions, custom variables, and e-commerce transactions. A single visitor can open multiple visits. Visits can occur on the same day, or over several days, weeks, or months. As soon as one visit ends, there is then an opportunity to start a new visit. A visit ends either through the passage of time or a campaign change, with a campaign generally meaning arrival via search engine, referring site, or campaign-tagged information. A visit ends through passage of time either after thirty minutes of inactivity or at midnight Pacific Time. A visit ends through a campaign change if a visitor arrives via one campaign or source, leaves the site, and then returns via another campaign or source. Currently, visits do not include interactions through our mobile applications.
We view visits to our websites as a key indicator of our brand awareness among consumers and whether we are providing consumers with useful products and features, thereby increasing their usage of our marketplace. We believe that a higher level of usage may contribute to an increase in our net revenues and exclusive digital coupons as retailers will have exposure to a larger potential customer base.
Net Revenues Per Visit. Net revenues per visit is defined as net revenues for the period divided by visits for the period.
Key Components of Our Results of Operations
Net Revenues
Substantially all of our net revenues consist of commissions we receive from paid retailers, either directly or through performance marketing networks. In general, we earn commissions from a paid retailer when a consumer makes a purchase from that paid retailer after clicking on a digital coupon for that paid retailer on one of our websites, mobile websites or mobile applications. In some instances, we earn commissions from a paid retailer when a consumer presents a digital coupon to the retailer in-store and the digital coupon is scanned or a unique digital coupon code is entered by the retailer at the point of sale. We provide performance marketing solutions under contracts with retailers, which generally provide for commission payments to be facilitated by performance marketing networks. Commission rates are typically negotiated with individual retailers with which we have contracts. Our commission rates vary based on both the retailer as well as the product category. We recognize commission revenues when we receive confirmation that a consumer has completed a purchase transaction with a paid retailer, as reported to us through a performance marketing network, or in some cases, by the retailer directly. When a digital coupon applies only to specific items, the discount to the consumer will be applied only to those specific items, but our commission is generally based on the aggregate purchase price of all items purchased at that time by the consumer. We also earn advertising revenues from advertising placements on our websites and mobile applications, which have historically not been significant. We expect that substantially all of our net revenues in the future will continue to be derived from commissions. Commission revenues are reported net of a reserve for estimated returns. We estimate returns based on our actual historical returns experience; these returns have not been significant.
55
Table of Contents
Costs and Expenses
We classify our costs and expenses into six categories: cost of net revenues, product development, sales and marketing, general and administrative, amortization of purchased intangible assets and other operating expenses. We allocate our personnel facilities and general information technology, or IT, costs, which include IT and facilities-related personnel costs, rent, depreciation and other general costs, to all of the above categories of operating expenses, other than amortization of purchased intangibles and other operating expenses. We expect personnel costs will be higher in 2013, both in absolute dollars and as a percentage of net revenues, when compared to the prior year as a result of our plan to continue to increase the number of our employees as we continue to invest in our business. Personnel costs for employees include salaries and amounts earned under variable compensation plans, payroll taxes, benefits, stock-based compensation expense, costs associated with recruiting new employees, travel costs and other employee-related costs.
Cost of Net Revenues
Our cost of net revenues consists of direct and indirect costs incurred to generate net revenues. These costs consist primarily of personnel costs of our merchandising, site operations, and website technical support employees; fees paid to third-party contractors engaged in the operation and maintenance of our websites; depreciation; and website hosting and Internet service costs. We expect our cost of net revenues to increase in both absolute dollars and as a percentage of net revenues in 2013 as we build our infrastructure of employees and tools to support a larger business across multiple markets and endeavor to increase the number and amount of consumer purchases resulting from visits to our websites and from use of our mobile applications.
Product Development
Our product development expense consists primarily of personnel costs of our product management and software engineering teams, as well as fees paid to third-party contractors and consultants engaged in the design, development, testing and improvement of the functionality and user experience of our websites and mobile applications. We expense all internal product and development costs as we do not track and separately identify costs of identifiable development activities from costs of maintenance and related activities. We intend to significantly increase our technology and product resources over the next year by hiring additional personnel to develop new features and products for our websites and mobile applications. We expect these additional investments to cause our product development expenses to increase both in absolute dollars and as a percentage of net revenues in 2013 as compared to 2012.
Sales and Marketing
Our sales and marketing expense consists primarily of personnel costs of our sales, partner management, marketing, SEO and business analytics employees, as well as online and other advertising expenditures, branding programs and other marketing expenses. Our advertising, branding programs and other marketing costs include paid search advertising fees, online display advertising, including on social networking sites, television advertising, creative development fees, public relations, email campaigns, trade show costs and other general marketing costs. We intend to significantly increase our sales and marketing efforts in 2013 to support our products, increase consumer traffic to our websites, encourage downloads of our mobile applications and increase overall awareness of our brand. Therefore, we expect our sales and marketing expenses to increase in absolute dollars and as a percent of net revenues in 2013.
General and Administrative
Our general and administrative expense consists primarily of the personnel costs of our general corporate functions, including executive, finance, accounting, legal and human resources. Other costs included in general and administrative include professional fees for legal, audit and other consulting services, travel and entertainment, charitable contributions and other general corporate overhead expenses. We expect to incur incremental costs associated with operating as a public company, including increases in our accounting and legal personnel, additional
56
Table of Contents
consulting, legal and audit fees, insurance costs, board of directors’ compensation, costs associated with compliance with the Sarbanes-Oxley Act and other requirements. As a result, we expect our general and administrative expenses to increase both in absolute dollars and as a percentage of net revenues in 2013.
Amortization of Purchased Intangibles
We have recorded identifiable intangible assets in conjunction with our various acquisitions, and are amortizing those assets over their estimated useful lives. This amortization expense has increased as these acquisitions have occurred. We perform impairment testing of goodwill annually and, in the case of intangibles with definite lives, whenever events or circumstances indicate that impairment may have occurred. We expect our amortization expenses to decline in absolute dollars and as a percentage of net revenues in future periods, however, changes in our amortization expenses will depend upon the level of our future acquisition activity.
Other Operating Expenses
Other operating expenses primarily consist of amounts related to non-cash impairments of purchased intangible assets. In 2012, we determined that we would no longer support three of our websites, Coupon7.com, Couponshare.com and CheapStingyBargains.com. We have redirected traffic from CheapStingyBargains.com to Deals2Buy.com and refer visitors from Coupon7.com and Couponshare.com to RetailMeNot.com. We do not expect these sites to provide additional income. As a result of this impairment indicator, we determined that a complete impairment of the remaining unamortized intangible assets related to these websites was warranted, resulting in an impairment charge of $4.9 million. We did not record any intangible asset impairment charges during the years ended December 31, 2010 and 2011 or the nine months ended September 30, 2013.
In 2012, we acquired Web.Bons-de-Reduction.com and Poulpeo.com and issued $3.5 million in seller notes to the selling stockholders of the business. These seller notes are due and payable contingent upon the continued employment of the selling stockholders and as a result have been recorded as deferred compensation, which we are amortizing over the term of the compensation arrangement with the sellers.
Other Income (Expense)
Amounts included in other income (expense) include interest income earned on our available cash and cash equivalents, interest expense incurred in connection with our senior debt, subordinated debt and seller notes issued in connection with acquisitions and the amortization of deferred financing costs. We repaid all amounts outstanding on our subordinated debt in 2011. We also include in other income (expense), fair value adjustments to contingent consideration related to certain acquisitions, net fair value adjustments to warrant liabilities, derivative instruments issued in connection with our subordinated debt and foreign currency exchange gains and losses. Changes in these amounts will depend to some extent upon the level of our future acquisition activities and the use of borrowings to fund any such acquisitions.
Income Tax Expense
We accrue federal, state and foreign income taxes at the applicable statutory rates adjusted for certain items, including non-deductible expenses, the most significant of which are the change in fair value of a common stock warrant, acquisition costs and stock-based compensation. During 2012, our effective tax rate was 38.6%. Our effective tax rate in recent periods differed from our anticipated long-term effective tax rate due to the impact of foreign tax rates, as well as non-deductible expenses. Our mix of foreign versus U.S. income, our ability to generate tax credits and our incurrence of any non-deductible expenses will likely cause our effective tax rate to fluctuate in the future. As of December 31, 2012 we had no federal net operating loss or tax credit carryforwards. We are currently evaluating a restructuring of our non-U.S. entities to streamline our European operations, which we believe may result in a reduced overall effective tax rate over time. In the event we implement this restructuring, we anticipate a tax liability in the quarter in which such restructuring is implemented.
57
Table of Contents
Results of Operations
The following table presents our historical operating results for the periods indicated. The period-to-period comparisons of financial results are not necessarily indicative of future results.
| Year Ended December 31, | Nine Months Ended September 30, |
|||||||||||||||||||
| 2010 | 2011 | 2012 | 2012 | 2013 | ||||||||||||||||
| (dollars in thousands) | ||||||||||||||||||||
| Consolidated Statements of Operations Data: |
||||||||||||||||||||
| Net revenues |
$ | 16,862 | $ | 80,402 | $ | 144,685 | $ | 93,895 | $ | 131,312 | ||||||||||
| Costs and expenses: |
||||||||||||||||||||
| Cost of net revenues |
1,848 | 3,980 | 9,113 | 6,475 | 8,735 | |||||||||||||||
| Product development |
658 | 4,388 | 14,481 | 9,326 | 21,103 | |||||||||||||||
| Sales and marketing |
5,661 | 15,341 | 40,672 | 22,543 | 40,974 | |||||||||||||||
| General and administrative |
2,472 | 6,883 | 15,758 | 10,777 | 19,919 | |||||||||||||||
| Amortization of purchased intangible assets |
3,394 | 11,296 | 13,158 | 10,244 | 8,673 | |||||||||||||||
| Other operating expenses |
— | 35 | 6,006 | 2,611 | 1,299 | |||||||||||||||
|
|
|
|
|
|
|
|
|
|
|
|||||||||||
| Total costs and expenses |
14,033 | 41,923 | 99,188 | 61,976 | 100,703 | |||||||||||||||
|
|
|
|
|
|
|
|
|
|
|
|||||||||||
| Income from operations |
2,829 | 38,479 | 45,497 | 31,919 | 30,609 | |||||||||||||||
| Other income (expense): |
||||||||||||||||||||
| Interest expense, net |
(930 | ) | (7,784 | ) | (3,221 | ) | (2,519 | ) | (2,410 | ) | ||||||||||
| Fair value change of common stock warrant |
— | (2,103 | ) | — | — | — | ||||||||||||||
| Fair value change of contingent consideration, net |
1,994 | — | — | — | — | |||||||||||||||
| Other income (expense), net |
(16 | ) | (129 | ) | 77 | 49 | 451 | |||||||||||||
|
|
|
|
|
|
|
|
|
|
|
|||||||||||
| Income before income taxes |
3,877 | 28,463 | 42,353 | 29,449 | 28,650 | |||||||||||||||
| Provision for income taxes |
(1,533 | ) | (11,502 | ) | (16,360 | ) | (11,201 | ) | (10,959 | ) | ||||||||||
|
|
|
|
|
|
|
|
|
|
|
|||||||||||
| Net income |
$ | 2,344 | $ | 16,961 | $ | 25,993 | $ | 18,248 | $ | 17,691 | ||||||||||
|
|
|
|
|
|
|
|
|
|
|
|||||||||||
| Year Ended December 31, | Nine Months Ended September 30, |
|||||||||||||||||||
| 2010 | 2011 | 2012 | 2012 | 2013 | ||||||||||||||||
| Consolidated Statements of Operations Data as Percentage of Net Revenues: |
||||||||||||||||||||
| Net revenues |
100.0 | % | 100.0 | % | 100.0 | % | 100.0 | % | 100.0 | % | ||||||||||
| Costs and expenses: |
||||||||||||||||||||
| Cost of net revenues |
11.0 | 5.0 | 6.3 | 6.9 | 6.7 | |||||||||||||||
| Product development |
3.9 | 5.5 | 10.0 | 9.9 | 16.1 | |||||||||||||||
| Sales and marketing |
33.6 | 19.1 | 28.1 | 24.0 | 31.2 | |||||||||||||||
| General and administrative |
14.7 | 8.6 | 10.9 | 11.5 | 15.2 | |||||||||||||||
| Amortization of purchased intangible assets |
20.1 | 14.0 | 9.1 | 10.9 | 6.6 | |||||||||||||||
| Other operating expenses |
— | — | 4.2 | 2.8 | 0.9 | |||||||||||||||
|
|
|
|
|
|
|
|
|
|
|
|||||||||||
| Total costs and expenses |
83.3 | 52.2 | 68.6 | 66.0 | 76.7 | |||||||||||||||
|
|
|
|
|
|
|
|
|
|
|
|||||||||||
| Income from operations |
16.7 | 47.8 | 31.4 | 34.0 | 23.3 | |||||||||||||||
| Other income (expense): |
||||||||||||||||||||
| Interest expense, net |
(5.5 | ) | (9.7 | ) | (2.2 | ) | (2.7 | ) | (1.8 | ) | ||||||||||
| Fair value change of common stock warrant |
— | (2.6 | ) | — | — | — | ||||||||||||||
| Fair value change of contingent consideration, net |
11.8 | — | — | — | — | |||||||||||||||
| Other income (expense), net |
(0.1 | ) | (0.2 | ) | 0.1 | 0.1 | 0.3 | |||||||||||||
|
|
|
|
|
|
|
|
|
|
|
|||||||||||
| Income before income taxes |
22.9 | 35.3 | 29.3 | 31.4 | 21.8 | |||||||||||||||
| Provision for income taxes |
(9.1 | ) | (14.3 | ) | (11.3 | ) | (12.0 | ) | (8.3 | ) | ||||||||||
|
|
|
|
|
|
|
|
|
|
|
|||||||||||
| Net income |
13.8 | % | 21.0 | % | 18.0 | % | 19.4 | % | 13.5 | % | ||||||||||
|
|
|
|
|
|
|
|
|
|
|
|||||||||||
58
Table of Contents
Net Revenues
| Nine Months Ended September 30, |
||||||||
| 2012 | 2013 | |||||||
| (dollars in thousands) | ||||||||
| Net Revenues by Geography: |
||||||||
| U.S. |
$ | 77,979 | $ | 104,284 | ||||
| International |
15,916 | 27,028 | ||||||
|
|
|
|
|
|||||
| Total net revenues |
$ | 93,895 | $ | 131,312 | ||||
|
|
|
|
|
|||||
| Percentage of Net Revenues by Geography: |
||||||||
| U.S. |
83.0 | % | 79.4 | % | ||||
| International |
17.0 | % | 20.6 | % | ||||
|
|
|
|
|
|||||
| Total percentage |
100.0 | % | 100.0 | % | ||||
|
|
|
|
|
|||||
Nine months Ended September 30, 2013 Compared to Nine months Ended September 30, 2012. Net revenues increased by $37.4 million, or 39.8%, for the nine months ended September 30, 2013 compared to the nine months ended September 30, 2012. In total, commissions paid to us as a result of consumer purchases made using RetailMeNot.com and VoucherCodes.co.uk accounted for approximately 92.8% of the increase for the period. Net revenues from the websites Web.Bons-de-Reduction.com and Poulpeo.com, which we acquired in May 2012, Actiepagina.nl, which we acquired in March 2013, and Ma-Reduc.com, which we acquired in July 2013, accounted for 11.8% of the increase for the period. These amounts were partially offset by a $2.0 million decline in net revenues from Coupon7.com and Couponshare.com, which are websites that we stopped supporting during the fourth quarter of 2012, as well as nominal declines in net revenues from certain of our other websites. Approximately 54.4% of the organic growth in net revenues was due to improved monetization, driven by an increase in the percentage of visits that resulted in a paid transaction, with the remainder of the growth due to an increase in visits. Net revenues were positively affected by continued expansion of our online and offline marketing efforts, including increased investment in both paid and organic search and email subscriptions. The merchandising, usability and functionality enhancements we implemented in 2012 also contributed to improved net revenues per visit at RetailMeNot.com.
| Year Ended December 31, | ||||||||||||
| 2010 | 2011 | 2012 | ||||||||||
| (dollars in thousands) | ||||||||||||
| Net Revenues by Geography: |
||||||||||||
| U.S. |
$ | 16,862 | $ | 72,616 | $ | 119,986 | ||||||
| International |
— | 7,786 | 24,699 | |||||||||
|
|
|
|
|
|
|
|||||||
| Total net revenues |
$ | 16,862 | $ | 80,402 | $ | 144,685 | ||||||
|
|
|
|
|
|
|
|||||||
| Percentage of Net Revenues by Geography: |
||||||||||||
| U.S. |
100.0 | % | 90.3 | % | 82.9 | % | ||||||
| International |
— | % | 9.7 | % | 17.1 | % | ||||||
|
|
|
|
|
|
|
|||||||
| Total percentage |
100.0 | % | 100.0 | % | 100.0 | % | ||||||
|
|
|
|
|
|
|
|||||||
2012 Compared to 2011. Net revenues increased by $64.3 million, or 80.0%, for the year ended December 31, 2012 compared to the year ended December 31, 2011. In total, commissions paid to us as a result of consumer purchases made using RetailMeNot.com accounted for approximately 82.0% of the increase for the year. Of the increase in net revenues, $13.6 million was due to net revenues from VoucherCodes.co.uk, which we owned for a full year in 2012 as compared to less than five months in 2011. Another $3.3 million of this increase resulted from our May 2012 acquisition of the websites Web.Bons-de-Reduction.com and Poulpeo.com. The organic increases in net revenues were driven by an increase in visits (approximately 30% of the increase) with
59
Table of Contents
the remainder due primarily to improved monetization driven by an increase in the percentage of visits that resulted in a paid transaction. Net revenues were positively affected by a significant expansion in 2012 of the online and offline marketing efforts we initiated in 2011, including increased investment in both paid and organic search and email subscriptions. The merchandising, usability and functionality enhancements we implemented in late 2011 and in 2012 also contributed to improved revenues per visit at RetailMeNot.com.
2011 Compared to 2010. Net revenues increased by $63.5 million, or 376.8%, for the year ended December 31, 2011 compared to the year ended December 31, 2010. Commissions paid to us as a result of consumer purchases made using RetailMeNot.com accounted for approximately 87.4% of the increase for the year. Of the increase in net revenues, $55.5 million was due to net revenues from RetailMeNot.com, which we owned for a full year in 2011 as compared to approximately one month in 2010. Further, our August 2011 acquisition of VoucherCodes.co.uk contributed $7.8 million. The organic increases in net revenues were driven by an increase in visits (approximately 8% of the increase) with the remainder due primarily to improved monetization. The improved monetization was due entirely to an increase in the percentage of visits that resulted in a paid transaction partially offset by a small decrease in earnings per transactions. The improved net revenues per visit was due primarily to website enhancements, particularly at RetailMeNot.com.
Cost of Net Revenues
| Nine Months Ended September 30, |
||||||||
| 2012 | 2013 | |||||||
| (dollars in thousands) | ||||||||
| Cost of net revenues |
$ | 6,475 | $ | 8,735 | ||||
| Percentage of net revenues |
6.9 | % | 6.7 | % | ||||
Nine months Ended September 30, 2013 Compared to Nine months Ended September 30, 2012. For the nine months ended September 30, 2013, cost of net revenues increased by $2.3 million, or 34.9%, compared to the nine months ended September 30, 2012. This increase was largely attributable to a $1.5 million increase in allocated facility and information technology costs and website support costs. We increased our investment in our information technology and website support infrastructure to expand the capacity and to improve the performance and scalability of our websites. Additionally, personnel costs increased by $0.7 million, as we added personnel to our content teams in order to increase digital coupon content and to further improve content quality.
| Year Ended December 31, | ||||||||||||
| 2010 | 2011 | 2012 | ||||||||||
| (dollars in thousands) | ||||||||||||
| Cost of net revenues |
$ | 1,848 | $ | 3,980 | $ | 9,113 | ||||||
| Percentage of net revenues |
11.0 | % | 5.0 | % | 6.3 | % | ||||||
2012 Compared to 2011. For the year ended December 31, 2012, cost of net revenues increased by $5.1 million, or 129.0%, compared to the year ended December 31, 2011. This increase was primarily attributable to a $3.8 million increase in personnel costs, as we increased the number of personnel in this category from 28 employees at the beginning of the year to 44 employees at the end of the year. We increased website operating costs by $0.8 million to support increased consumer traffic to our websites as well as to strengthen our technology infrastructure. We added personnel to our content teams in order to increase digital coupon content and to further improve content quality. We also increased investment in our infrastructure to expand the capacity and to improve the performance and scalability of our websites. As a result of our personnel additions during 2012, we significantly increased our investment in technology and office facilities, incurring $0.5 million in additional facilities costs allocation and website support costs.
2011 Compared to 2010. For the year ended December 31, 2011, cost of net revenues increased by $2.1 million, or 115.4%, compared to the year ended December 31, 2010. This increase was primarily attributable to a $1.5 million increase in personnel and contract labor costs, as we increased the number of personnel in this
60
Table of Contents
category from 13 employees at the beginning of the year to 28 employees at the end of the year. We added personnel to our content teams following the acquisitions of RetailMeNot.com and VoucherCodes.co.uk in order to enhance content sourcing, moderation and curation for the websites. The increase in personnel also led to an increase in allocated facilities and IT support costs of $0.2 million, while website operating costs increased by $0.2 million.
Product Development
| Nine Months Ended September 30, |
||||||||
| 2012 | 2013 | |||||||
| (dollars in thousands) | ||||||||
| Product development |
$ | 9,326 | $ | 21,103 | ||||
| Percentage of net revenues |
9.9 | % | 16.1 | % | ||||
Nine months Ended September 30, 2013 Compared to Nine months Ended September 30, 2012. For the nine months ended September 30, 2013, product development expense increased by $11.8 million, or 126.3%, compared to the nine months ended September 30, 2012. This increase was primarily attributable to an $8.4 million increase in personnel costs. The increase in personnel also led to an increase in allocated facilities and IT support costs of $1.5 million. We increased personnel in order to enhance the functionality of our websites, to develop new products, including mobile applications, to enter new geographies and to strengthen our reporting and analytics capabilities. Additionally, third-party fees for usability studies and technology licenses used in the design and development of our websites increased by $1.9 million.
| Year Ended December 31, | ||||||||||||
| 2010 | 2011 | 2012 | ||||||||||
| (dollars in thousands) | ||||||||||||
| Product development |
$ | 658 | $ | 4,388 | $ | 14,481 | ||||||
| Percentage of net revenues |
3.9 | % | 5.5 | % | 10.0 | % | ||||||
2012 Compared to 2011. For the year ended December 31, 2012, product development expense increased by $10.1 million, or 230.0%, compared to the year ended December 31, 2011. This increase was primarily attributable to a $7.3 million increase in personnel costs, as we increased the number of personnel in this category from 51 employees at the beginning of the year to 93 employees at the end of the year. The increase in personnel also led to an increase in allocated facilities and IT support costs of $1.8 million. We increased personnel in order to enhance the functionality of our websites, to develop new products, including mobile applications, to enter new geographies and to strengthen our reporting and analytics capabilities. Additionally, fees for usability studies and technology licenses used in the design and development of our websites increased $1.0 million.
2011 Compared to 2010. For the year ended December 31, 2011, product development expense increased by $3.7 million, or 566.9%, compared to the year ended December 31, 2010. This increase was primarily attributable to a $2.9 million increase in personnel costs, as we increased the number of personnel in this category from six employees at the beginning of the year to 51 employees at the end of the year. The increase in personnel also led to an increase in allocated facilities and IT support costs of $0.3 million. Additionally, fees for usability studies and technology licenses used in the design and development of our websites increased $0.5 million.
Sales and Marketing
| Nine Months Ended March 31, | ||||||||
| 2012 | 2013 | |||||||
| (dollars in thousands) | ||||||||
| Sales and marketing |
$ | 22,543 | $ | 40,974 | ||||
| Percentage of net revenues |
24.0 | % | 31.2 | % | ||||
61
Table of Contents
Nine months Ended September 30, 2013 Compared to Nine months Ended September 30, 2012. For the nine months ended September 30, 2013, sales and marketing expense increased by $18.4 million, or 81.8%, compared to the nine months ended September 30, 2012. This increase was primarily attributable to an increase in advertising and personnel costs as we continue to build our brand, acquire new customers and increase consumer traffic to our websites in order to grow our business. Online, brand and other marketing expenses increased by $7.4 million. This increase was primarily attributable to public relations and offline and online advertising for brand building, contextual advertising placements and user acquisition efforts. We also incurred an increase of $4.7 million in paid search expenses. Finally, personnel costs increased by $5.1 million, which led to a related increase in allocated facilities and IT support costs of $1.1 million. We increased personnel in order to continue the expansion of our partner management teams to support our growing portfolio of websites and to further strengthen relationships with top retailers. We also added personnel to support the marketing initiatives described above and to expand our email marketing, social media and other consumer acquisition initiatives.
| Year Ended December 31, | ||||||||||||
| 2010 | 2011 | 2012 | ||||||||||
| (dollars in thousands) | ||||||||||||
| Sales and marketing |
$ | 5,661 | $ | 15,341 | $ | 40,672 | ||||||
| Percentage of net revenues |
33.6 | % | 19.1 | % | 28.1 | % | ||||||
2012 Compared to 2011. For the year ended December 31, 2012, sales and marketing expense increased by $25.3 million, or 165.1%, compared to the year ended December 31, 2011. This increase was primarily attributable to an increase in advertising and personnel costs as we continued to build our brand, acquire new customers and increase consumer traffic to our websites in order to grow our business. For the year ended December 31, 2012, online, brand and other marketing expenses increased by $15.7 million. These increases are primarily attributable to public relations and offline and online advertising for brand building; user acquisition efforts; and higher paid search costs for traffic growth. Online marketing costs consist of search engine fees and contextual advertising placements. We incurred $8.6 million in paid search expenses for the year ended December 31, 2012, an increase of $1.7 million, or 24.6%, over the year ended December 31, 2011. Personnel costs increased by $5.9 million for the year ended December 31, 2012, as we grew the number of personnel in this category from 63 employees at the beginning of the year to 105 employees at the end of the year. The increase in personnel led to a related increase in allocated facilities and IT support costs of $1.9 million. We increased personnel in order to continue the expansion of our retailer teams to support our growing portfolio of websites and to further strengthen relationships with top retailers. We also added personnel to support the marketing initiatives described above as well as to expand our email marketing, social media and other consumer acquisition initiatives.
2011 Compared to 2010. For the year ended December 31, 2011, sales and marketing expense increased by $9.7 million, or 171.0%, compared to the year ended December 31, 2010. This increase was primarily attributable to an increase in advertising costs associated with the initiation of our branding campaign in 2011 and personnel costs associated with our increased focus on marketing. For the year ended December 31, 2011, online, brand and other marketing expenses increased by $3.5 million. We incurred $6.9 million in paid search expenses for the year ended December 31, 2011, an increase of $2.9 million, or 72.5%, over the year ended December 31, 2010. Personnel costs increased $3.1 million for the year ended December 31, 2011, as we grew the number of personnel in this category from ten employees at the beginning of the year to 63 employees at the end of the year. We added personnel to our partner management teams following the acquisitions of RetailMeNot.com and VoucherCodes.co.uk in order to deepen relationships with an expanded base of retail partners, to convert unpaid retailers to paid retailers and to secure more exclusive digital coupons. We also increased marketing personnel to support our increased levels of investment in public relations, search marketing, email marketing and social media efforts in order to build our brand and increase visits to our websites. The increase in personnel led to a related increase in allocated facilities and IT support costs of $0.3 million.
62
Table of Contents
General and Administrative
| Nine Months Ended March 31, | ||||||||
| 2012 | 2013 | |||||||
| (dollars in thousands) | ||||||||
| General and administrative |
$ | 10,777 | $ | 19,919 | ||||
| Percentage of net revenues |
11.5 | % | 15.2 | % | ||||
Nine months Ended September 30, 2013 Compared to Nine months Ended September 30, 2012. For the nine months ended September 30, 2013, general and administrative expense increased by $9.1 million, or 84.8%, compared to the nine months ended September 30, 2012. This increase was primarily attributable to a $7.3 million increase in personnel costs. We added personnel to further the build-out of our human resources and legal functions, to increase our business development efforts and to add resources in the finance function to operate as a public company. Professional fees increased $1.6 million for the nine months ended September 30, 2013, due to increased legal, accounting and consulting costs associated with the growth of our existing business and preparation for and execution of our initial public offering.
| Year Ended December 31, | ||||||||||||
| 2010 | 2011 | 2012 | ||||||||||
| (dollars in thousands) | ||||||||||||
| General and administrative |
$ | 2,472 | $ | 6,883 | $ | 15,758 | ||||||
| Percentage of net revenues |
14.7 | % | 8.6 | % | 10.9 | % | ||||||
2012 Compared to 2011. For the year ended December 31, 2012, general and administrative expense increased by $8.9 million, or 128.9%, compared to the year ended December 31, 2011. This increase was primarily attributable to an $8.4 million increase in personnel costs as we increased the number of personnel in this category from 22 employees at the beginning of the year to 52 employees at the end of the year to support the growth of our business. We added personnel to establish human resources and legal functions, to increase our business development efforts and to add resources in the finance function in order to begin preparing to operate as a public company. However, allocated facilities and IT support costs declined by $1.0 million as this category comprised a smaller percentage of total personnel. Professional fees increased $0.8 million for the year ended December 31, 2012, due to increased legal, accounting and consulting costs associated with the growth of our existing business and strategic initiatives, including the acquisition of the businesses of Web.Bons-de-Reduction.com and Poulpeo.com during 2012 and preparation for a potential public offering.
2011 Compared to 2010. For the year ended December 31, 2011, general and administrative expense increased by $4.4 million, or 178.4%, compared to the year ended December 31, 2010. This increase was primarily attributable to a $2.4 million increase in personnel costs as we increased the number of personnel in this category from six employees at the beginning of the year to 22 employees at the end of the year to support the growth in our business. Professional fees increased $1.6 million for the year ended December 31, 2011, due to increased legal, accounting, and consulting costs associated with the growth of our existing operations and strategic initiatives, including the acquisition of the business of VoucherCodes.co.uk during 2011.
Amortization of Purchased Intangible Assets
| Nine Months Ended March 31, |
||||||||
| 2012 | 2013 | |||||||
| (dollars in thousands) | ||||||||
| Amortization of purchased intangible assets |
$ | 10,244 | $ | 8,673 | ||||
| Percentage of net revenues |
10.9 | % | 6.6 | % | ||||
Nine months Ended September 30, 2013 Compared to Nine months Ended September 30, 2012. For the nine months ended September 30, 2013, amortization of purchased intangible assets decreased by $1.6 million, or 15.3%, compared to the nine months ended September 30, 2012. The decrease in amortization expense for the
63
Table of Contents
nine months ended September 30, 2013 was primarily the result of the expiration of the useful life of certain of the purchased intangible assets as part of our acquisition of the business of VoucherCodes.co.uk in 2011 and the recorded impairment of $2.9 million during the fourth quarter of 2012 of the remaining unamortized intangible assets related to two of our websites, Coupon7.com and Couponshare.com. These impairment costs were recognized in other operating expenses in our statement of operations. These decreases were partially offset by the recognition of amortization expense associated with the addition of purchased intangible assets as part of our acquisitions of the businesses of Ma-Reduc.com in July 2013 and Actiepagina.nl in March 2013.
| Year Ended December 31, | ||||||||||||
| 2010 | 2011 | 2012 | ||||||||||
| (dollars in thousands) | ||||||||||||
| Amortization of purchased intangible assets |
$ | 3,394 | $ | 11,296 | $ | 13,158 | ||||||
| Percentage of net revenues |
20.1 | % | 14.0 | % | 9.1 | % | ||||||
2012 Compared to 2011. For the year ended December 31, 2012, amortization of purchased intangible assets increased by $1.9 million, or 16.5%, compared to the year ended December 31, 2011. The increase in amortization expense for 2012 was the result of our recognition of a full year of amortization expense associated with the purchased intangible assets as part of our August 2011 acquisition of the business of VoucherCodes.co.uk, as compared to our recognition of only a partial year of amortization in 2011, and the addition of purchased intangible assets as part of our acquisition of the businesses of Web.Bons-de-Reduction.com and Poulpeo.com in 2012, partially offset by decreases in amortization expense resulting from the expiration of the useful life of certain of the purchased intangible assets as part of our acquisition of the business of RetailMeNot.com in 2010.
2011 Compared to 2010. For the year ended December 31, 2011, amortization of purchased intangible assets increased by $7.9 million, or 232.8%, compared to the year ended December 31, 2010. The increase in amortization expense for 2011 was the result of our recognition of a full year of amortization expense associated with the purchased intangible assets as part of our November 2010 acquisition of the business of RetailMeNot.com and the addition of purchased intangible assets as part of our acquisition of the business of VoucherCodes.co.uk in August 2011. These increases were partially offset by decreases in amortization expense resulting from the expiration of the useful life of certain of the purchased intangible assets from the acquisitions we made in November 2009.
Other Operating Expenses
| Nine Months Ended September 30, |
||||||||
| 2012 | 2013 | |||||||
| (dollars in thousands) | ||||||||
| Impairment of purchased intangible assets |
$ | 1,962 | $ | — | ||||
| Deferred compensation |
649 | 1,301 | ||||||
| Assets disposal gain |
— | (2 | ) | |||||
|
|
|
|
|
|||||
| Total other operating expenses |
$ | 2,611 | $ | 1,299 | ||||
|
|
|
|
|
|||||
Nine months Ended September 30, 2013 Compared to Nine months Ended September 30, 2012. In the first quarter of 2012, we determined that we would no longer support one of our websites, CheapStingyBargains.com. We redirected traffic from CheapStingyBargains.com to Deals2Buy.com. As a result of this impairment indicator, we determined that a complete impairment of the remaining unamortized intangible assets related to this website was warranted, resulting in an impairment charge of $2.0 million. We did not record any intangible asset impairment charges during the nine months ended September 30, 2013. During the nine months ended September 30, 2013 and 2012, we recognized $1.3 million and $0.6 million, respectively, in deferred compensation charges for our May 2012 acquisition of the businesses of Web.Bons-de-Reduction.com and Poulpeo.com in
64
Table of Contents
connection with our issuance of promissory notes with an aggregate principal amount of $3.5 million to the sellers of those businesses. Our obligations to repay the outstanding amounts under these notes are contingent upon the continued employment of the selling stockholders and, as a result, have been recorded as deferred compensation, which we amortize over the term of the compensation arrangements with the sellers.
| Year Ended December 31, | ||||||||||||
| 2010 | 2011 | 2012 | ||||||||||
| (dollars in thousands) | ||||||||||||
| Impairment of purchased intangible assets |
$ | — | $ | — | $ | 4,924 | ||||||
| Deferred compensation |
— | — | 1,082 | |||||||||
| Assets disposal (gain) or loss |
— | 35 | — | |||||||||
|
|
|
|
|
|
|
|||||||
| Total other operating expenses |
$ | — | $ | 35 | $ | 6,006 | ||||||
|
|
|
|
|
|
|
|||||||
In 2012, we determined that we would no longer support three of our websites, Coupon7.com, Couponshare.com and CheapStingyBargains.com. We have redirected traffic from CheapStingyBargains.com to Deals2Buy.com and refer visitors from Coupon7.com and Couponshare.com to RetailMeNot.com. As a result of this impairment indicator, we determined that a complete impairment of the remaining unamortized intangible assets related to these websites was warranted, resulting in an impairment charge of $4.9 million. We did not record any intangible asset impairment charges during the years ended December 31, 2010 and 2011. We also recognized $1.1 million in deferred compensation charges for our acquisition of the businesses of Web.Bons-de-Reduction.com and Poulpeo.com in connection with our issuance of promissory notes with an aggregate principal amount of $3.5 million to the sellers of those businesses. Our obligations to repay the outstanding amounts under these notes are contingent upon the continued employment of the selling stockholders and, as a result, have been recorded as deferred compensation, which we amortize over the term of the compensation arrangements with the sellers.
Other Income (Expense)
| Nine Months Ended March 31, |
||||||||
| 2012 | 2013 | |||||||
| (dollars in thousands) | ||||||||
| Interest expense, net |
$ | (2,519 | ) | $ | (2,410 | ) | ||
| Fair value change of common stock warrant |
— | — | ||||||
| Fair value change of contingent consideration, net |
— | — | ||||||
| Other income (expense), net |
49 | 451 | ||||||
Nine months Ended September 30, 2013 Compared to Nine months Ended September 30, 2012. The decrease in interest expense, net, for the nine months ended September 30, 2013 is primarily the result of a decrease in average outstanding principal on our senior debt facility and the repayment during 2012 of our seller notes issued in connection with our acquisitions of the business of RetailMeNot.com in November 2010 and an internet domain name in April 2010. This decrease was partially offset by a $0.6 million write-off of the remaining unamortized deferred financing costs of our prior senior debt facility following the amendment of such senior debt facility in July 2013 and an increase in interest expense for seller notes issued in connection with our acquisition of the businesses of Web.Bons-de-Reduction.com and Poulpeo.com during May 2012 and Ma-Reduc.com in July 2013.
| Year Ended December 31, | ||||||||||||
| 2010 | 2011 | 2012 | ||||||||||
| (dollars in thousands) | ||||||||||||
| Interest expense, net |
$ | (930 | ) | $ | (7,784 | ) | $ | (3,221 | ) | |||
| Fair value change of common stock warrant |
— | (2,103 | ) | — | ||||||||
| Fair value change of contingent consideration, net |
1,994 | — | — | |||||||||
| Other income (expense), net |
(16 | ) | (129 | ) | 77 | |||||||
65
Table of Contents
2012 Compared to 2011. The decrease in net interest expense for the year ended December 31, 2012 is the result of the repayment of our subordinated debt facility during October 2011 and a decrease in both the outstanding principal and interest rate on our senior debt facility. This decrease was partially offset by an increase in interest expense for seller notes issued in connection with our acquisitions of the businesses of VoucherCodes.co.uk during August 2011, and Web.Bons-de-Reduction.com and Poulpeo.com during May 2012. Other income and expenses primarily reflect the fair value changes of the derivative liabilities of a common stock warrant and an interest rate swap for the year ended December 31, 2011.
2011 Compared to 2010. The increase in net interest expense for the year ended December 31, 2011 is the result of the recognition of a full year of interest expense and other financing costs during 2011 associated with the indebtedness incurred in connection with our acquisition of the business of RetailMeNot.com in November 2010, as compared to only a partial year of such expenses in 2010 as well as interest expense on notes payable issued in connection with our acquisition of VoucherCodes.co.uk in August 2011. The fair value change of the common stock warrant reflects the change in value of this derivative liability for the year ended December 31, 2011. As of December 31, 2011, the common stock warrant was no longer classified as a liability. Fair value change of contingent consideration recognized for the year ended December 31, 2010 reflects the change in fair value of earn-outs recorded in connection with our acquisitions in November 2009.
Income Taxes
| Nine Months Ended September 30, |
||||||||
| 2012 | 2013 | |||||||
| (dollars in thousands) | ||||||||
| Provision for income taxes |
$ | (11,201 | ) | $ | (10,959 | ) | ||
| Percentage of net revenues |
(12.0 | %) | (8.3 | %) | ||||
Nine months Ended September 30, 2013 Compared to Nine months Ended September 30, 2012. Our income tax expense for the nine months ended September 30, 2013 was $11.0 million, or a decrease of 2.2%, compared to income tax expense of $11.2 million for the nine months ended September 30, 2012. Our effective tax rate was 38.3% and 38.0% during the nine months ended September 30, 2013 and 2012, respectively, and differed from the statutory rate primarily due to non-deductible stock-based compensation charges and the effect of different statutory tax rates in foreign jurisdictions.
| Year Ended December 31, | ||||||||||||
| 2010 | 2011 | 2012 | ||||||||||
| (dollars in thousands) | ||||||||||||
| Provision for income taxes |
$ | (1,533 | ) | $ | (11,502 | ) | $ | (16,360 | ) | |||
| Percentage of net revenues |
(9.1 | %) | (14.3 | %) | (11.3 | %) | ||||||
2012 Compared to 2011. Our income tax expense for the year ended December 31, 2012 was $16.4 million, or an increase of 42.2%, compared to income tax expense of $11.5 million for the year ended December 31, 2011. Our effective tax rate during the two years differed from our anticipated long-term effective tax rate due to non-deductible expenses primarily associated with financing and acquisition activities and the impact of foreign tax rates.
2011 Compared to 2010. Our income tax expense for the year ended December 31, 2011 was $11.5 million, or an increase of 650.3%, compared to income tax expense of $1.5 million for the year ended December 31, 2010. Our effective tax rate during the two years differed from our anticipated long-term effective tax rate due to non-deductible expenses primarily associated with financing and acquisition activities, as well as the impact of foreign tax rates for the year ended December 31, 2011.
66
Table of Contents
Quarterly Results of Operations
The following tables present the unaudited consolidated statements of operations data for the eight quarters in the period ended September 30, 2013, in dollars and as a percentage of net revenues. This quarterly information has been prepared on the same basis as our audited consolidated financial statements and, in the opinion of our management, reflects all adjustments necessary for a fair representation of the information for the periods presented. This data should be read in conjunction with our audited consolidated financial statements and the related notes included in this prospectus. Operating results for any quarter apply to that quarter only and are not necessarily indicative of results for any future period.
| For the Three Months Ended: | ||||||||||||||||||||||||||||||||
| Dec. 31, 2011 |
March 31, 2012 |
June 30, 2012 |
Sept. 30, 2012 |
Dec. 31, 2012 |
March 31, 2013 |
June 30, 2013 |
September 30, 2013 |
|||||||||||||||||||||||||
| (in thousands, except per share amounts) | ||||||||||||||||||||||||||||||||
| Consolidated Statements of Operations: |
||||||||||||||||||||||||||||||||
| Net revenues |
$ | 33,661 | $ | 29,647 | $ | 30,088 | $ | 34,160 | $ | 50,790 | $ | 40,561 | $ | 43,401 | $ | 47,350 | ||||||||||||||||
| Costs and expenses: |
||||||||||||||||||||||||||||||||
| Cost of net revenues |
1,648 | 1,707 | 2,270 | 2,498 | 2,638 | 2,588 | 2,872 | 3,275 | ||||||||||||||||||||||||
| Product development |
2,038 | 2,399 | 3,093 | 3,834 | 5,155 | 5,950 | 6,939 | 8,214 | ||||||||||||||||||||||||
| Sales and marketing |
7,054 | 5,969 | 7,136 | 9,438 | 18,129 | 11,190 | 14,085 | 15,699 | ||||||||||||||||||||||||
| General and administrative |
2,356 | 3,035 | 3,763 | 3,979 | 4,981 | 5,366 | 7,303 | 7,250 | ||||||||||||||||||||||||
| Amortization of purchased intangible assets |
3,871 | 3,414 | 3,608 | 3,222 | 2,914 | 2,830 | 2,787 | 3,056 | ||||||||||||||||||||||||
| Other operating expenses |
35 | 1,962 | 233 | 416 | 3,395 | 430 | 428 | 441 | ||||||||||||||||||||||||
|
|
|
|
|
|
|
|
|
|
|
|
|
|
|
|
|
|||||||||||||||||
| Total costs and expenses |
17,002 | 18,486 | 20,103 | 23,387 | 37,212 | 28,354 | 34,414 | 37,935 | ||||||||||||||||||||||||
|
|
|
|
|
|
|
|
|
|
|
|
|
|
|
|
|
|||||||||||||||||
| Income from operations |
16,659 | 11,161 | 9,985 | 10,773 | 13,578 | 12,207 | 8,987 | 9,415 | ||||||||||||||||||||||||
| Other income (expense): |
||||||||||||||||||||||||||||||||
| Interest expense, net |
(2,718 | ) | (1,002 | ) | (774 | ) | (743 | ) | (702 | ) | (649 | ) | (605 | ) | (1,156 | ) | ||||||||||||||||
| Fair value change of common stock warrant |
(340 | ) | — | — | — | — | — | — | — | |||||||||||||||||||||||
| Fair value change of contingent consideration, net |
— | — | — | — | — | — | — | — | ||||||||||||||||||||||||
| Other income (expense), net |
(97 | ) | 9 | 25 | 15 | 28 | (64 | ) | 42 | 473 | ||||||||||||||||||||||
|
|
|
|
|
|
|
|
|
|
|
|
|
|
|
|
|
|||||||||||||||||
| Income before income taxes |
13,504 | 10,168 | 9,236 | 10,045 | 12,904 | 11,494 | 8,424 | 8,732 | ||||||||||||||||||||||||
| Provision for income taxes |
(5,330 | ) | (3,935 | ) | (3,795 | ) | (3,471 | ) | (5,159 | ) | (4,519 | ) | (3,301 | ) | (3,139 | ) | ||||||||||||||||
|
|
|
|
|
|
|
|
|
|
|
|
|
|
|
|
|
|||||||||||||||||
| Net income |
$ | 8,174 | $ | 6,233 | $ | 5,441 | $ | 6,574 | $ | 7,745 | $ | 6,975 | $ | 5,123 | $ | 5,593 | ||||||||||||||||
|
|
|
|
|
|
|
|
|
|
|
|
|
|
|
|
|
|||||||||||||||||
| Preferred stock dividends on participating preferred stock |
(55,313 | ) | (6,092 | ) | (6,108 | ) | (6,188 | ) | (6,189 | ) | (6,054 | ) | (6,122 | ) | (7,752 | ) | ||||||||||||||||
|
|
|
|
|
|
|
|
|
|
|
|
|
|
|
|
|
|||||||||||||||||
| Total undistributed earnings (loss) |
$ | (47,139 | ) | $ | 141 | $ | (667 | ) | $ | 386 | $ | 1,556 | $ | 921 | $ | (999 | ) | $ | (2,159 | ) | ||||||||||||
| Undistributed earnings allocated to participating preferred stock |
— | (139 | ) | — | (378 | ) | (1,525 | ) | (901 | ) | — | — | ||||||||||||||||||||
|
|
|
|
|
|
|
|
|
|
|
|
|
|
|
|
|
|||||||||||||||||
| Net income (loss) attributable to common stockholders |
$ | (47,139 | ) | $ | 2 | $ | (667 | ) | $ | 8 | $ | 31 | $ | 20 | $ | (999 | ) | $ | (2,159 | ) | ||||||||||||
|
|
|
|
|
|
|
|
|
|
|
|
|
|
|
|
|
|||||||||||||||||
| Net income (loss) per share attributable to common stockholders: |
||||||||||||||||||||||||||||||||
| Basic and diluted |
$ | (62.68 | ) | $ | 0.00 | $ | (0.81 | ) | $ | 0.01 | $ | 0.03 | $ | 0.02 | $ | (0.68 | ) | $ | (0.06 | ) | ||||||||||||
|
|
|
|
|
|
|
|
|
|
|
|
|
|
|
|
|
|||||||||||||||||
| Weighted-average number of shares used in computing net income (loss) per share: |
||||||||||||||||||||||||||||||||
| Basic |
752 | 767 | 824 | 871 | 899 | 1,000 | 1,466 | 38,235 | ||||||||||||||||||||||||
|
|
|
|
|
|
|
|
|
|
|
|
|
|
|
|
|
|||||||||||||||||
| Diluted |
752 | 2,228 | 824 | 2,657 | 2,928 | 2,965 | 1,466 | 38,235 | ||||||||||||||||||||||||
|
|
|
|
|
|
|
|
|
|
|
|
|
|
|
|
|
|||||||||||||||||
67
Table of Contents
| For the Three Months Ended: | ||||||||||||||||||||||||||||||||
| Dec. 31, 2011 |
March 31, 2012 |
June 30, 2012 |
Sept. 30, 2012 |
Dec. 31, 2012 |
March 31, 2013 |
June 30, 2013 |
September 30, 2013 |
|||||||||||||||||||||||||
| Consolidated Statements of Operations as a Percentage of Net Revenues: |
||||||||||||||||||||||||||||||||
| Net revenues |
100.0 | % | 100.0 | % | 100.0 | % | 100.0 | % | 100.0 | % | 100.0 | % | 100.0 | % | 100.0 | % | ||||||||||||||||
| Costs and expenses: |
||||||||||||||||||||||||||||||||
| Cost of net revenues |
4.9 | 5.8 | 7.5 | 7.3 | 5.2 | 6.4 | 6.6 | 6.9 | ||||||||||||||||||||||||
| Product development |
6.1 | 8.1 | 10.3 | 11.2 | 10.1 | 14.7 | 16.0 | 17.3 | ||||||||||||||||||||||||
| Sales and marketing |
21.0 | 20.1 | 23.7 | 27.6 | 35.7 | 27.6 | 32.5 | 33.2 | ||||||||||||||||||||||||
| General and administrative |
7.0 | 10.2 | 12.5 | 11.6 | 9.8 | 13.2 | 16.8 | 15.3 | ||||||||||||||||||||||||
| Amortization of purchased intangible assets |
11.5 | 11.5 | 12.0 | 9.4 | 5.7 | 7.0 | 6.4 | 6.5 | ||||||||||||||||||||||||
| Other operating expenses |
0.1 | 6.7 | 0.8 | 1.2 | 6.7 | 1.0 | 1.0 | 0.9 | ||||||||||||||||||||||||
|
|
|
|
|
|
|
|
|
|
|
|
|
|
|
|
|
|||||||||||||||||
| Total costs and expenses |
50.5 | 62.4 | 66.8 | 68.5 | 73.3 | 69.9 | 79.3 | 80.1 | ||||||||||||||||||||||||
|
|
|
|
|
|
|
|
|
|
|
|
|
|
|
|
|
|||||||||||||||||
| Income from operations |
49.5 | 37.6 | 33.2 | 31.5 | 26.7 | 30.1 | 20.7 | 19.9 | ||||||||||||||||||||||||
| Other income (expense): |
||||||||||||||||||||||||||||||||
| Interest expense, net |
(8.1 | ) | (3.4 | ) | (2.6 | ) | (2.2 | ) | (1.4 | ) | (1.6 | ) | (1.4 | ) | (2.4 | ) | ||||||||||||||||
| Fair value change of common stock warrant |
(1.0 | ) | — | — | — | — | — | — | — | |||||||||||||||||||||||
| Fair value change of contingent consideration, net |
— | — | — | — | — | — | — | — | ||||||||||||||||||||||||
| Other income (expense), net |
(0.3 | ) | — | 0.1 | — | 0.1 | (0.2 | ) | 0.1 | 0.9 | ||||||||||||||||||||||
|
|
|
|
|
|
|
|
|
|
|
|
|
|
|
|
|
|||||||||||||||||
| Income before income taxes |
40.1 | 34.3 | 30.7 | 29.4 | 25.4 | 28.3 | 19.4 | 18.4 | ||||||||||||||||||||||||
| Provision for income taxes |
(15.8 | ) | (13.3 | ) | (12.6 | ) | (10.2 | ) | (10.2 | ) | (11.1 | ) | (7.6 | ) | (6.6 | ) | ||||||||||||||||
|
|
|
|
|
|
|
|
|
|
|
|
|
|
|
|
|
|||||||||||||||||
| Net income |
24.3 | % | 21.0 | % | 18.1 | % | 19.2 | % | 15.2 | % | 17.2 | % | 11.8 | % | 11.8 | % | ||||||||||||||||
|
|
|
|
|
|
|
|
|
|
|
|
|
|
|
|
|
|||||||||||||||||
| For the Three Months Ended: | ||||||||||||||||||||||||||||||||
| Dec. 31, 2011 |
March 31, 2012 |
June 30, 2012 |
Sept. 30, 2012 |
Dec. 31, 2012 |
March 31, 2013 |
June 30, 2013 |
September 30, 2013 |
|||||||||||||||||||||||||
| (in thousands, except net revenues per visit) | ||||||||||||||||||||||||||||||||
| Key Financial and Operating Metrics:(1) |
||||||||||||||||||||||||||||||||
| Financial Metrics |
||||||||||||||||||||||||||||||||
| Net revenues |
$ | 33,661 | $ | 29,647 | $ | 30,088 | $ | 34,160 | $ | 50,790 | $ | 40,561 | $ | 43,401 | $ | 47,350 | ||||||||||||||||
| Adjusted EBITDA(2) |
20,946 | 17,277 | 15,624 | 15,756 | 21,716 | 18,234 | 15,715 | 16,408 | ||||||||||||||||||||||||
| Operating Metrics |
||||||||||||||||||||||||||||||||
| Visits |
124,557 | 102,240 | 102,099 | 111,463 | 148,439 | 122,560 | 121,154 | 132,226 | ||||||||||||||||||||||||
| Net revenues per visit |
$ | 0.27 | $ | 0.29 | $ | 0.30 | $ | 0.31 | $ | 0.34 | $ | 0.33 | $ | 0.36 | $ | 0.36 | ||||||||||||||||
| (1) | See the section titled “Management’s Discussion and Analysis of Financial Condition and Results of Operations—Key Financial and Operating Metrics” on page 54 for definitions of key financial and operating metrics. |
68
Table of Contents
| (2) | See footnote 2 on page 48 to the table in the section titled “Selected Consolidated Financial and Other Data” for additional discussion of adjusted EBITDA. The following table provides a reconciliation of adjusted EBITDA to net income: |
| For the Three Months Ended: | ||||||||||||||||||||||||||||||||
| Dec. 31, 2011 |
March 31, 2012 |
June 30, 2012 |
Sept. 30, 2012 |
Dec. 31, 2012 |
March 31, 2013 |
June 30, 2013 |
September 30, 2013 |
|||||||||||||||||||||||||
| (dollars in thousands) | ||||||||||||||||||||||||||||||||
| Adjusted EBITDA: |
||||||||||||||||||||||||||||||||
| Net income |
$ | 8,174 | $ | 6,233 | $ | 5,441 | $ | 6,574 | $ | 7,745 | $ | 6,975 | $ | 5,123 | $ | 5,593 | ||||||||||||||||
| Depreciation and amortization expense(a) |
4,014 | 3,584 | 3,842 | 3,512 | 3,254 | 3,263 | 3,266 | 3,547 | ||||||||||||||||||||||||
| Stock-based compensation expense(b) |
240 | 570 | 934 | 1,055 | 1,489 | 2,140 | 2,311 | 2,617 | ||||||||||||||||||||||||
| Third-party acquisition-related costs |
— | — | 630 | — | — | 194 | 723 | 388 | ||||||||||||||||||||||||
| Other operating expenses |
35 | 1,962 | 233 | 416 | 3,395 | 430 | 428 | 441 | ||||||||||||||||||||||||
| Interest expense, net |
2,718 | 1,002 | 774 | 743 | 702 | 649 | 605 | 1,156 | ||||||||||||||||||||||||
| Fair value change of common stock warrant |
340 | — | — | — | — | — | — | — | ||||||||||||||||||||||||
| Other (income) expense, net |
97 | (9 | ) | (25 | ) | (15 | ) | (28 | ) | 64 | (42 | ) | (473 | ) | ||||||||||||||||||
| Income taxes |
5,330 | 3,935 | 3,795 | 3,471 | 5,159 | 4,519 | 3,301 | 3,139 | ||||||||||||||||||||||||
|
|
|
|
|
|
|
|
|
|
|
|
|
|
|
|
|
|||||||||||||||||
| Adjusted EBITDA |
$ | 20,948 | $ | 17,277 | $ | 15,624 | $ | 15,756 | $ | 21,716 | $ | 18,234 | $ | 15,715 | $ | 16,408 | ||||||||||||||||
|
|
|
|
|
|
|
|
|
|
|
|
|
|
|
|
|
|||||||||||||||||
| For the Three Months Ended: | ||||||||||||||||||||||||||||||||
| Dec. 31, 2011 |
March 31, 2012 |
June 30, 2012 |
Sept. 30, 2012 |
Dec. 31, 2012 |
March 31, 2013 |
June 30, 2013 |
September 30, 2013 |
|||||||||||||||||||||||||
| (dollars in thousands) | ||||||||||||||||||||||||||||||||
| (a) Depreciation expense |
||||||||||||||||||||||||||||||||
| Cost of net revenues |
$ | 34 | $ | 10 | $ | 15 | $ | 20 | $ | 54 | $ | 61 | $ | 67 | $ | 71 | ||||||||||||||||
| Product development |
44 | 52 | 79 | 105 | 144 | 182 | 195 | 193 | ||||||||||||||||||||||||
| Sales and marketing |
44 | 77 | 103 | 122 | 80 | 121 | 145 | 150 | ||||||||||||||||||||||||
| General and administrative |
21 | 31 | 37 | 43 | 62 | 68 | 72 | 77 | ||||||||||||||||||||||||
|
|
|
|
|
|
|
|
|
|
|
|
|
|
|
|
|
|||||||||||||||||
| Total |
$ | 143 | $ | 170 | $ | 234 | $ | 290 | $ | 340 | $ | 432 | $ | 479 | $ | 491 | ||||||||||||||||
|
|
|
|
|
|
|
|
|
|
|
|
|
|
|
|
|
|||||||||||||||||
| For the Three Months Ended: | ||||||||||||||||||||||||||||||||
| Dec. 31, 2011 |
March 31, 2012 |
June 30, 2012 |
Sept. 30, 2012 |
Dec. 31, 2012 |
March 31, 2013 |
June 30, 2013 |
September 30, 2013 |
|||||||||||||||||||||||||
| (dollars in thousands) | ||||||||||||||||||||||||||||||||
| (b) Stock-based compensation expense |
||||||||||||||||||||||||||||||||
| Cost of net revenues |
$ | 15 | $ | 22 | $ | 28 | $ | 31 | $ | 75 | $ | 158 | $ | 135 | $ | 156 | ||||||||||||||||
| Product development |
90 | 147 | 266 | 300 | 431 | 540 | 504 | 597 | ||||||||||||||||||||||||
| Sales and marketing |
58 | 105 | 226 | 261 | 402 | 492 | 516 | 560 | ||||||||||||||||||||||||
| General and administrative |
77 | 296 | 414 | 463 | 581 | 950 | 1,156 | 1,304 | ||||||||||||||||||||||||
|
|
|
|
|
|
|
|
|
|
|
|
|
|
|
|
|
|||||||||||||||||
| Total |
$ | 240 | $ | 570 | $ | 934 | $ | 1,055 | $ | 1,489 | $ | 2,140 | $ | 2,311 | $ | 2,617 | ||||||||||||||||
|
|
|
|
|
|
|
|
|
|
|
|
|
|
|
|
|
|||||||||||||||||
Seasonality and Quarterly Results
Our overall operating results fluctuate from quarter to quarter as a result of a variety of factors, including seasonal factors and economic cycles that influence consumer purchasing of retail products. Historically, we have experienced the highest levels of visitors to our websites and net revenues in the fourth quarter of the year, which coincides with the winter holiday season in the U.S. and Europe. During the fourth quarter of 2012, we
69
Table of Contents
generated net revenues of $50.8 million, which represented 35.1% of our net revenues for 2012. This seasonality may not be fully evident in our historical business performance because of our significant growth and the timing of our acquisitions. For instance, we have entered new markets through international acquisitions and increased the number of paid retailer and performance marketing network relationships. These changes have contributed to the substantial growth in our net revenues and corresponding increases in our operating costs and expenses to support our growth. Our investments have led to uneven quarterly operating results due to increases in personnel costs, product and technology enhancements and the impact of our acquisitions and other strategic projects. The return on these investments is generally achieved in future periods and, as a result, these investments can adversely impact near term results.
Our business is directly affected by the behavior of consumers. Economic conditions and competitive pressures can impact, both positively and negatively, the types of digital coupons featured on our websites and the rates at which they are utilized by consumers. Consequently, the results of any prior quarterly or annual periods should not be relied upon as indications of our future operating performance.
Liquidity and Capital Resources
Since our inception, we have funded our operations and acquisitions primarily through private placements of our preferred stock, the issuance of equity securities through our initial public offering, bank borrowings and cash flows from operations. Of the approximately $295.8 million of net proceeds we received through the sale of preferred stock, we used $70.0 million of these proceeds to redeem shares of preferred stock. We generated positive cash flow from operations for the years ended December 31, 2010, 2011 and 2012, and the nine months ended September 30, 2013. As of September 30, 2013, we had $136.4 million in cash and cash equivalents, compared to $97.1 million at December 31, 2012.
The following table summarizes our cash flows for the periods indicated:
| Year Ended December 31, | Nine Months Ended September 30, |
|||||||||||||||||||
| 2010 | 2011 | 2012 | 2012 | 2013 | ||||||||||||||||
| (dollars in thousands) | ||||||||||||||||||||
| Net cash provided by operating activities |
$ | 2,612 | $ | 29,365 | $ | 42,253 | $ | 34,266 | $ | 34,966 | ||||||||||
| Net cash used in investing activities |
(131,480 | ) | (34,411 | ) | (13,379 | ) | (12,368 | ) | (21,411 | ) | ||||||||||
| Net cash provided by (used in) financing activities |
141,615 | 78,606 | (20,082 | ) | (17,882 | ) | 25,508 | |||||||||||||
| Effects of foreign currency exchange rate on cash |
— | (111 | ) | 116 | 78 | 203 | ||||||||||||||
|
|
|
|
|
|
|
|
|
|
|
|||||||||||
| Net change in cash and cash equivalents |
12,747 | 73,449 | 8,908 | 4,094 | 39,266 | |||||||||||||||
| Cash and cash equivalents at beginning of the period |
2,038 | 14,785 | 88,234 | 88,234 | 97,142 | |||||||||||||||
|
|
|
|
|
|
|
|
|
|
|
|||||||||||
| Cash and cash equivalents at end of the period |
$ | 14,785 | $ | 88,234 | $ | 97,142 | $ | 92,328 | $ | 136,408 | ||||||||||
|
|
|
|
|
|
|
|
|
|
|
|||||||||||
Net Cash Provided by Operating Activities
| Year Ended December 31, | Nine Months Ended September 30, |
|||||||||||||||||||
| 2010 | 2011 | 2012 | 2012 | 2013 | ||||||||||||||||
| (dollars in thousands) | ||||||||||||||||||||
| Net income |
$ | 2,344 | $ | 16,961 | $ | 25,993 | $ | 18,248 | $ | 17,691 | ||||||||||
| Depreciation and amortization expense |
3,460 | 11,556 | 14,192 | 10,938 | 10,076 | |||||||||||||||
| Stock-based compensation expense |
68 | 471 | 4,048 | 2,559 | 7,068 | |||||||||||||||
| Non-cash interest expense |
933 | 3,662 | 816 | 680 | 900 | |||||||||||||||
| Deferred income tax (benefit) expense |
1,245 | 1,204 | (1,796 | ) | (1,680 | ) | (2,853 | ) | ||||||||||||
| Changes in operating assets and liabilities |
(3,600 | ) | (7,107 | ) | (7,506 | ) | 938 | 705 | ||||||||||||
| Other non-cash expense, net |
(1,838 | ) | 2,618 | 6,506 | 2,583 | 1,379 | ||||||||||||||
|
|
|
|
|
|
|
|
|
|
|
|||||||||||
| Net cash provided by operating activities |
$ | 2,612 | $ | 29,365 | $ | 42,253 | $ | 34,266 | $ | 34,966 | ||||||||||
|
|
|
|
|
|
|
|
|
|
|
|||||||||||
70
Table of Contents
Cash provided by operating activities primarily consists of our net income adjusted for certain non-cash items, including depreciation and amortization, stock-based compensation, non-cash impairment of intangible assets, deferred income taxes, non-cash interest expense, fair value adjustments associated with other financing arrangements and the effect of changes in working capital and other items. Net cash provided by operating activities was $2.6 million, $29.4 million, $42.3 million, $34.3 million and $35.0 million during the years ended December 31, 2010, 2011 and 2012, and the nine months ended September 30, 2012 and 2013, respectively.
During the nine months ended September 30, 2013, cash flows from operating activities were primarily generated through net income of $17.7 million, including the impact of depreciation and amortization expense of $10.1 million, stock-based compensation expense of $7.1 million, amortization of deferred compensation of $1.3 million, non-cash interest expense of $0.9 million, other non-cash charges of $0.1 million, net, and $0.7 million from changes in cash flows associated with working capital, offset by a deferred income tax benefit of $2.9 million. The changes in cash flows associated with working capital were primarily driven by a decrease in accounts receivable of $2.3 million due to a seasonal decrease in revenues following the fourth quarter, which was partially offset by other working capital changes of $1.6 million.
During the nine months ended September 30, 2012, cash flows from operating activities were primarily generated through net income of $18.2 million, including the impact of depreciation and amortization expense of $10.9 million, stock-based compensation expense of $2.6 million, impairment expense of $2.0 million, non-cash interest expense of $0.7 million, other non-cash charges of $0.6 million, and $0.9 million from changes in cash flows associated with working capital, offset by a deferred income tax benefit of $1.7 million. The most significant change in cash flows from working capital was a decrease in accounts receivable of $3.7 million due to a seasonal decrease in revenues following the fourth quarter, which was partially offset by $2.8 million of other working capital changes.
During 2012, cash flows from operating activities were generated through net income of $26.0 million, adding back depreciation and amortization of $14.2 million, stock-based compensation expense of $4.0 million, non-cash interest expense of $0.8 million, other non-cash expense and fair value change in liabilities of $(0.1) million, impairment of assets of $4.9 million and amortization of deferred compensation of $1.1 million, partially offset by deferred income tax expense of $1.8 million and a decrease in cash flows associated with changes in working capital of $7.5 million. The increase in working capital was primarily caused by an increase in accounts receivable of $9.3 million due to our growth of net revenues.
During 2011, cash flows from operating activities were generated through net income of $17.0 million, adding back depreciation and amortization of $11.6 million, non-cash interest expense of $3.7 million, charges associated with the fair value changes of a common stock warrant of $2.1 million, a deferred income tax benefit of $1.2 million and stock-based compensation expense of $0.5 million. These positive cash flows were partially offset by a $7.1 million decrease in cash flows associated with changes in working capital, primarily driven by the growth of our business resulting in an increase in accounts receivable of $13.7 million, which were partially offset by an increase in accrued expenses and other current liabilities of $6.5 million.
During 2010, cash flows from operating activities were generated through net income of $2.3 million, adding back depreciation and amortization of $3.5 million, a deferred income tax benefit of $1.2 million and non-cash interest expense of $0.9 million. These positive cash flows were partially offset by gains associated with the fair value changes of contingent consideration of $2.0 million and a $3.6 million decrease in cash flows associated with changes in working capital, primarily driven by the growth of our business resulting in an increase in accounts receivable of $3.0 million and a decrease in accrued expenses and other current liabilities of $0.6 million.
71
Table of Contents
Net Cash Used in Investing Activities
| Year Ended December 31, | Nine Months Ended September 30, | |||||||||||||||||||
| 2010 | 2011 | 2012 | 2012 | 2013 | ||||||||||||||||
| (dollars in thousands) | ||||||||||||||||||||
| Payments for acquisition of businesses, net of cash acquired |
$ | (131,250 | ) | $ | (32,603 | ) | $ | (10,290 | ) | $ | (10,290 | ) | $ | (16,400 | ) | |||||
| Purchase of property and equipment |
(230 | ) | (1,808 | ) | (3,089 | ) | (2,078 | ) | (4,160 | ) | ||||||||||
| Purchase of other assets |
— | — | — | — | (851 | ) | ||||||||||||||
|
|
|
|
|
|
|
|
|
|
|
|||||||||||
| Net cash used in investing activities |
$ | (131,480 | ) | $ | (34,411 | ) | $ | (13,379 | ) | $ | (12,368 | ) | $ | (21,411 | ) | |||||
|
|
|
|
|
|
|
|
|
|
|
|||||||||||
Our primary investing activities consist of business acquisitions and purchases of property and equipment. Net cash used in investing activities was $131.5 million, $34.4 million, $13.4 million, $12.4 million and $21.4 million during the years ended December 31, 2010, 2011 and 2012 and the nine months ended September 30, 2012 and 2013, respectively. We used $14.5 million to acquire the business of Ma-Reduc.com and $1.9 million to acquire the business of Actiepagina.nl in 2013, $10.3 million for our acquisitions of the businesses Web.Bons-de-Reduction.com and Poulpeo.com during 2012, $32.6 million to acquire the business of VoucherCodes.co.uk during 2011 and $131.3 million to acquire the business of RetailMeNot.com during 2010. The remainder of our investing activities during these periods was comprised of purchases of computer equipment and software, office furniture and fixtures and leasehold improvements. As we expand our business and facilities, we intend to purchase additional technology resources and invest in our operating facilities. We may have acquisitions in the future that could have a material impact on our cash flows and operations.
Net Cash Provided by (Used in) Financing Activities
| Year Ended December 31, | Nine Months Ended September 30, | |||||||||||||||||||
| 2010 | 2011 | 2012 | 2012 | 2013 | ||||||||||||||||
| (dollars in thousands) | ||||||||||||||||||||
| Proceeds from notes payable, net of issuance costs |
$ | 55,349 | $ | — | $ | — | $ | — | $ | 8,094 | ||||||||||
| Payments on notes payable |
— | (29,427 | ) | (20,333 | ) | (18,108 | ) | (12,200 | ) | |||||||||||
| Proceeds from issuance of preferred stock, net of issuance costs |
86,215 | 177,860 | — | — | — | |||||||||||||||
| Payments for repurchase of preferred stock |
— | (70,000 | ) | — | — | — | ||||||||||||||
| Proceeds from exercise of options and warrants to purchase common stock |
51 | 173 | 251 | 226 | 1,652 | |||||||||||||||
| Excess income tax benefit from stock-based compensation |
— | — | — | 1,287 | ||||||||||||||||
| Payments of preferred stock dividends |
— | — | — | — | (58,682 | ) | ||||||||||||||
| Proceeds from initial public offering, net of offering costs |
— | — | — | — | 85,365 | |||||||||||||||
| Payments of principal on capital lease arrangements |
— | — | — | — | (8 | ) | ||||||||||||||
|
|
|
|
|
|
|
|
|
|
|
|||||||||||
| Net cash provided by (used in) financing activities |
$ | 141,615 | $ | 78,606 | $ | (20,082 | ) | $ | (17,882 | ) | $ | 25,508 | ||||||||
|
|
|
|
|
|
|
|
|
|
|
|||||||||||
Our primary financing activities consist of net proceeds from the issuance of shares of our common and preferred stock, the exercise of stock options by employees and borrowings and repayments of senior debt and subordinated debt and notes payable issued in connection with acquisitions. Net cash provided by financing activities was $141.6 million and $78.6 million during the years ended December 31, 2010 and 2011, respectively. Net cash used in financing activities was $20.1 million and $17.9 million for the year ended December 31, 2012 and the nine months ended September 30, 2012, respectively. Net cash provided by financing activities was $25.5 million for the nine months ended September 31, 2013.
72
Table of Contents
During the nine months ended September 30, 2013, we received approximately $85.4 million of net proceeds, after deducting underwriting discounts and commissions and offering expenses, from the sale of shares of our common stock by us in our initial public offering. With the proceeds to us of our initial public offering, we (i) paid in full accumulated dividends on our previously outstanding shares of preferred stock, which totaled approximately $52.5 million, and (ii) repaid the outstanding principal and accrued interest on seller notes issued in connection with our acquisition of eConversions Limited in 2011, which totaled approximately $6.6 million. We also paid approximately $6.1 million in deemed dividends to investors in exchange for voting in favor of the conversion of preferred stock to common stock in connection with our initial public offering. We borrowed $8.1 million, net of issuance costs, in connection with the amendment of our senior debt, and used $4.5 million to repay a portion of our senior debt and $1.7 million to repay a portion of the seller notes issued in connection with our acquisition of the businesses of Web.Bons-de-Reduction.com and Poulpeo.com during 2012.
During 2012, we used $20.3 million to repay a portion of our senior debt and extinguish certain notes payable, $18.1 million of which was paid during the nine months ended September 30, 2012. During 2011, we raised $177.9 million, net of issuance costs, through the sale of shares of our preferred stock and used $70.0 million to repurchase outstanding shares of our preferred stock. We also used $29.4 million to extinguish our outstanding subordinated debt and a portion of our senior debt and notes payable. During November 2010, we raised $86.2 million, net of issuance costs, through the sale of shares of our preferred stock and borrowed $55.3 million, net of issuance costs, through bank borrowings.
Capital Resources
We believe that our existing cash, cash equivalents and cash generated from operations will be sufficient to satisfy our currently anticipated cash requirements through at least the next 12 months.
On July 24, 2013, we completed our initial public offering of 10,454,544 shares of Series 1 common stock, at a price of $21.00 per share, before underwriting discounts and commissions. We sold 4,545,454 of such shares and existing stockholders sold an aggregate of 5,909,090 of such shares, including 1,363,636 shares sold by selling stockholders as a result of the underwriters’ exercise of their over-allotment option to purchase additional shares. Our initial public offering generated net proceeds to us of approximately $85.4 million, after deducting underwriting discounts, commissions and expenses. Expenses incurred by us for our initial public offering were approximately $3.4 million and were recorded against the net proceeds received by us from our initial public offering. We did not receive any proceeds from the sale of shares by the selling stockholders in our initial public offering.
With the net proceeds to us of our initial public offering, we (i) paid in full accumulated dividends on our previously outstanding shares of preferred stock, which totaled approximately $52.5 million, (ii) repaid the outstanding principal and accrued interest on seller notes issued in connection with our acquisition of eConversions Limited in 2011, which totaled approximately $6.6 million, (iii) repaid $1.75 million of our senior debt in October 2013, and (iv) acquired the business of YSL Ventures, Inc. in October 2013 for approximately $17.8 million in initial cash consideration.
Our future capital requirements will depend on many factors, including our rate of net revenues growth, the expansion of our marketing and sales initiatives, the timing and extent of spending to support product development efforts, the timing of introductions of new products and services and enhancements to existing products and services, potential acquisitions and the continuing market acceptance of our products and services. We may need to raise additional capital through future debt or equity financing to the extent necessary to fund such activities. Additional financing may not be available at all or on terms favorable to us. We may enter into arrangements in the future with respect to investments in, or acquisitions of, similar or complementary businesses, products, services or technologies, which could also require us to seek additional debt or equity financing.
In November 2010, in connection with the acquisition of the business of RetailMeNot.com, we entered into a term loan agreement with certain lenders and issued secured promissory notes in the aggregate principal amount of $45.0 million, or Prior Senior Debt. At our option, borrowings under this term loan agreement bore
73
Table of Contents
interest at either the base rate (as more fully described in the term loan agreement) plus 450 basis points or LIBOR (with a floor of 100 basis points) plus 550 basis points when our funded debt to EBITDA ratio (as more fully described in the term loan agreement) is greater than or equal to 2.00:1.00. As the funded debt to EBITDA ratio decreased, the number of basis points was reduced by as much as 100 basis points to equal 350 and 450 basis points, respectively. Interest was payable quarterly in arrears for base rate borrowings and on the last day of the advance for any LIBOR based borrowings. Principal payments of $2.2 million were due on the first day of each quarter with any remaining balance due on November 23, 2015. Certain mandatory prepayments included proceeds from certain asset sales, 100% of the proceeds of any subordinated debt and 50% of the proceeds of certain equity transactions.
The term loan agreement also had a requirement for us to enter into an interest rate swap agreement sufficient, at the minimum, to cover 50% of the aggregate outstanding principal amount for a three-year period. Accordingly, in January 2011 we entered into an interest rate swap agreement with a notional amount of $22.5 million using a principal amortization schedule determined by our lenders, resulting in a declining balance subject to the interest rate swap through January 2014. The interest rate swap agreement added 75 basis points to the LIBOR-based borrowing rate but caps the maximum rate for LIBOR-based borrowings at 7.25% per annum. The impact of the interest rate swap agreement was not material to our consolidated balance sheets, statements of operations or cash flows.
The Prior Senior Debt had priority in repayment to all other outstanding debt and, in connection with the Prior Senior Debt and the related term loan agreement, we had granted our lenders a security interest in substantially all of our assets, including intellectual property, pursuant to a security agreement and an intellectual property security agreement. Under the Prior Senior Debt, we were subject to complying with certain financial covenants, including minimum trailing twelve month EBITDA levels, funded debt to EBITDA ratio, senior debt to EBITDA ratio and a fixed charge coverage ratio (each as more fully described in our term loan agreement). The term loan agreement contains customary affirmative and negative covenants and prohibits, among other things and subject to certain exceptions, the incurrence of additional debt, payment of other debt obligations, incurrence of liens, acquisitions of businesses or capital expenditures, sales of businesses or assets, payment of dividends, making loans or advances and certain other restrictions. The term loan agreement also contained customary events of default including, among others, payment defaults, breaches of covenants, bankruptcy and insolvency events, cross defaults with certain material indebtedness, judgment defaults, change of control and breaches of representations and warranties. During 2012 and 2011, the term loan agreement was amended to, among other things, (i) incorporate certain preferred stock financing activities, (ii) allow the acquisitions of the businesses of Web.Bons-de-Reduction.com and Poulpeo.com and VoucherCodes.co.uk, (iii) allow the prepayment of certain subordinated debt, (iv) allow the amendment of a note payable, (v) redefine the limit of permitted acquisitions and (vi) eliminate previously existing mandatory prepayment provisions attributable to excess cash flow (each as more fully described in our term loan agreement). We were in compliance with all covenants as of December 31, 2012 and September 30, 2013.
On July 1, 2013, we entered into an amended and restated revolving credit and term loan agreement with certain lenders, or Current Senior Debt. The Current Senior Debt consists of a $115.0 million revolving credit facility and a $35.0 million term loan facility. The term loan facility was fully borrowed on July 1, 2013, and was used, in part, to fully prepay the borrowings under the Prior Senior Debt, which obligations were repaid in full effective upon closing of the Current Senior Debt. There are no amounts currently outstanding under the revolving credit facility. On September 30, 2013, we had $73.5 million available for borrowings under the revolving credit facility.
74
Table of Contents
We pay a quarterly revolving credit facility fee of 50 basis points. At our option, borrowings under both the term loan facility and the revolving credit facility bear interest at either the base rate or a eurodollar-based rate (each as more fully described in the amended and restated revolving credit and term loan agreement) plus an applicable margin as determined based on the funded debt to EBITDA ratio (as more fully described in the amended and restated revolving credit and term loan agreement). These rates are summarized in the following table:
| Basis for Pricing |
Level I | Level II | ||
| Consolidated Funded Debt/EBITDA |
<1.00:1.00 | ³1.00:1.0 | ||
| Revolving Credit Eurodollar Margin (LIBOR) |
200 basis points | 250 basis points | ||
| Revolving Credit Base Rate Margin |
100 basis points | 150 basis points | ||
| Term Loan Eurodollar Margin (LIBOR) |
262.5 basis points | 312.5 basis points | ||
| Term Loan Base Rate Margin |
162.5 basis points | 212.5 basis points |
Interest is payable quarterly in arrears for base rate borrowings and on the last day of the applicable eurodollar-interest period for any eurodollar-based borrowings. Principal payments on the term loan facility of $1.75 million are due on the first day of each quarter beginning October 1, 2013, with any remaining balance due in July 2018. Borrowings under the revolving credit facility are automatically converted to five-year term loans at any time such outstanding amounts are greater than or equal to $25.0 million and carry the same maturity date as the initial $35.0 million term loan. Mandatory prepayments include net cash proceeds from certain asset sales, 100% of the net cash proceeds of any subordinated debt and 50% of the net cash proceeds of certain equity transactions other than an initial public offering consummated on or before June 30, 2014 and any equity interests issued under certain stock option or employer incentive plans.
The Current Senior Debt has priority in repayment to all other outstanding debt. We have granted our lenders a security interest in substantially all of our assets, including intellectual property, pursuant to a security agreement and an intellectual property security agreement, except that the security interest shall apply only after the funded debt to EBITDA ratio is greater than or equal to 1:00 to 1:00. We are subject to complying with certain financial covenants, including minimum trailing twelve month EBITDA levels, funded debt to EBITDA ratio and a fixed charge coverage ratio (each as more fully described in the amended and restated revolving credit and term loan agreement). The amended and restated revolving credit and term loan agreement contains customary affirmative and negative covenants and prohibits, among other things and subject to certain exceptions, the incurrence of additional debt, payment of other debt obligations, incurrence of liens, acquisitions of businesses or capital expenditures, sales of businesses or assets, payment of dividends, making loans or advances and certain other restrictions. The amended and restated revolving credit and term loan agreement also contains customary events of default including, among others, payment defaults, breaches of covenants, bankruptcy and insolvency events, cross defaults with certain material indebtedness, judgment defaults, change of control and breaches of representations and warranties.
Contractual Obligations
The following table summarizes our future contractual obligations as of September 30, 2013:
| Payments due by period | ||||||||||||||||||||
| Contractual obligations |
Total | Less than 1 Year |
1-3 Years | 3-5 Years | More than 5 years |
|||||||||||||||
| (dollars in thousands) | ||||||||||||||||||||
| Debt obligations (including short-term debt)(1) |
$ | 42,972 | $ | 14,972 | $ | 28,000 | $ | — | $ | — | ||||||||||
| Operating lease obligations(2) |
25,178 | 2,333 | 6,539 | 6,945 | 9,362 | |||||||||||||||
| Purchase obligations(3) |
743 | 674 | 69 | — | — | |||||||||||||||
| Capital lease obligation(4) |
22 | 12 | 10 | — | — | |||||||||||||||
|
|
|
|
|
|
|
|
|
|
|
|||||||||||
| Total |
$ | 68,916 | $ | 17,991 | $ | 34,618 | $ | 6,945 | $ | 9,362 | ||||||||||
|
|
|
|
|
|
|
|
|
|
|
|||||||||||
75
Table of Contents
| (1) | Reflects the principal payments on the Prior Senior Debt and notes payable. These amounts exclude estimated cash interest payments of approximately $0.6 million in the fourth quarter of 2013, $1.9 million in 2014 and $1.3 million in 2015 (based on applicable interest rates as of September 30, 2013, in the case of variable interest rate debt). |
| (2) | We lease our principal office facilities, including our headquarters in Austin, Texas, under non-cancellable operating leases. Certain leases contain periodic rent escalation adjustments and renewal and expansion options. We recognize rent expense on a straight-line basis over the lease periods. Operating lease obligations expire at various dates with the latest maturity in 2020. We are also responsible for certain real estate taxes, utilities, and maintenance costs on our office facilities. |
| (3) | Purchase obligations primarily represent non-cancelable contractual obligations related to content licensing and technology agreements. |
| (4) | Some of our office equipment leases such as printers and copiers are treated as capital leases. |
Off-Balance Sheet Arrangements
For the years ended December 31, 2010, 2011 and 2012, and the nine months ended September 30, 2013, we did not, and we do not currently, have any off-balance sheet arrangements.
Quantitative and Qualitative Disclosures about Market Risk
We have both U.S. and international operations, and we are exposed to market risks in the ordinary course of our business, including the effect of foreign currency fluctuations, interest rate changes and inflation. Information relating to quantitative and qualitative disclosures about these market risks is set forth below.
Foreign Currency Exchange Risk
We transact business in various currencies other than the U.S. dollar, principally the British pound sterling and the Euro, which exposes us to foreign currency risk. Net revenues and related expenses generated from our international operations are denominated in the functional currencies of the corresponding country. The functional currency of each of our non-U.S. subsidiaries that either operate or support these markets is generally the same as the corresponding local currency. Although we have experienced and will continue to experience fluctuations in our net income as a result of the consolidation of our international operations due to transaction gains (losses) related to revaluing certain cash balances and trade accounts receivable that are denominated in currencies other than the U.S. dollar, we believe such a change will not have a material impact on our results of operations.
We assess our market risk based on changes in foreign currency exchange rates utilizing a sensitivity analysis that measures the potential impact in earnings, fair values and cash flows based on a hypothetical 10% change (increase and decrease) in currency rates. We use a current market pricing model to assess the changes in the value of the U.S. dollar on foreign currency denominated monetary assets and liabilities.
The primary assumption used in these models is a hypothetical 10% weakening or strengthening of the U.S. dollar against all of our currency exposures as of September 30, 2013, assuming instantaneous and parallel shifts in exchange rates. As of September 30, 2013, our working capital surplus (defined as current assets less current liabilities) subject to foreign currency translation risk was $7.2 million. The potential decrease in net current assets from a hypothetical 10.0% adverse change in quoted foreign currency exchange rates would be $0.7 million.
Interest Rate Risk
As of September 30, 2013, we had total notes payable of $43.0 million, including $35.0 million of variable interest rate debt based on 3-month LIBOR. We have effectively fixed our interest rate on $7.4 million of our variable rate debt through January 2, 2014 with the use of an interest rate swap agreement. Our remaining
76
Table of Contents
variable interest rate debt is subject to interest rate risk, because our interest payments will fluctuate with movements in the underlying 3-month LIBOR rate. A 100 basis point change in LIBOR rates would result in an increase in our interest expense of $0.3 million for the next twelve months based on current outstanding borrowings.
The fair value of our interest rate swap agreement (excluding accrued interest) was a net obligation of approximately $26,000 as of September 30, 2013. The fair value of this agreement was estimated using projected discounted cash flows based on market observable interest rate yield curves commensurate with the term of each instrument as of September 30, 2013.
Our exposure to market risk on our cash and cash equivalents for changes in interest rates is limited because nearly all of our cash and cash equivalents have a short-term maturity and are used primarily for working capital purposes.
Impact of Inflation
We believe that our results of operations are not materially impacted by moderate changes in the inflation rate. Inflation and changing prices did not have a material effect on our business, financial condition or results of operations in 2010, 2011, 2012 or the first nine months of 2013.
Critical Accounting Policies and Estimates
The preparation of our consolidated financial statements in conformity with GAAP requires estimates, judgments and assumptions that affect the reported amounts and classifications of assets and liabilities, net revenues and expenses and the related disclosures of contingent liabilities in our consolidated financial statements and accompanying notes. The SEC has defined a company’s critical accounting policies as the ones that are most important to the portrayal of the company’s financial condition and results of operations, and which require the company to make its most difficult and subjective judgments, often as a result of the need to make estimates of matters that are inherently uncertain. Based on this definition, we have identified the following critical accounting policies and estimates addressed below.
We also have other key accounting policies, which involve the use of estimates, judgments, and assumptions that are significant to understanding our results. See Note 2 “Summary of Significant Accounting Policies” to the consolidated financial statements included in this prospectus. Of those policies, we believe that the accounting policies discussed below involve the greatest degree of complexity and exercise of judgment by our management. We evaluate our estimates, judgments and assumptions on an ongoing basis, and while we believe that our estimates, judgments and assumptions are reasonable, they are based upon information available at the time. Actual results may differ significantly from these estimates under different assumptions, judgments or conditions.
Business Combinations and the Recoverability of Goodwill and Long-Lived Intangible Assets
A significant component of our growth strategy has been to acquire and integrate businesses that complement our existing operations. We account for business combinations using the purchase method of accounting and allocate the purchase price of each acquired business to the tangible and intangible assets acquired and liabilities assumed based upon their estimated fair value at the purchase date. The difference between the purchase price and the fair value of the net assets acquired is recorded as goodwill.
In determining the fair value of assets acquired and liabilities assumed in a business combination, we use recognized valuation methods, including the income approach, market approach and cost approach, and apply present value modeling. Our significant estimates in the income, market or cost approach include identifying business factors such as size, growth, profitability, risk and return on investment and assessing comparable net revenues and operating income multiples in estimating the fair value. We also make certain assumptions specific to the present value modeling valuation techniques which include risk-adjusted discount rates, future commission rates, rates of increase in operating expenses, weighted-average cost of capital, long-term growth rate assumptions and the future effective income tax rates.
77
Table of Contents
Most of the businesses we have acquired did not have a significant amount of tangible assets. As a result, our acquisitions have resulted in the majority of the purchase price being allocated to identifiable intangible assets and goodwill. The long-lived intangible assets we have identified in each acquisition include customer relationships and marketing-related, contract-related and technology-based intangible assets. All of our long-lived intangible assets have a definite life that ranges from one year to fifteen years, which we have determined reflects our best estimate of the pattern in which the economic benefit of the related intangible asset will be utilized. As of September 30, 2013, we had $79.3 million in intangible assets (net of accumulated amortization) and $168.6 million of goodwill.
The valuations of our acquired businesses have been performed by valuation specialists under our management’s supervision. We believe that the estimated fair value assigned to the assets acquired and liabilities assumed are based on reasonable assumptions and estimates that marketplace participants would use. However, such assumptions are inherently uncertain and actual results could differ from those estimates. Future changes in our assumptions or the interrelationship of those assumptions may negatively impact future valuations. In future measurements of fair value, adverse changes in discounted cash flow assumptions could result in an impairment of goodwill or intangible assets that would require a non-cash charge to the consolidated statements of operations and may have a material effect on our financial condition and operating results.
We perform our annual impairment testing of goodwill as of October 1 of each year, and whenever events or circumstances indicate that impairment may have occurred. Events or circumstances that could trigger an impairment review include, but are not limited to, a significant adverse change in legal factors or in the business climate, an adverse action or assessment by a regulator, unanticipated competition, a loss of key personnel, significant changes in our use of the acquired assets or the strategy for our overall business, significant negative industry or economic trends, or significant underperformance relative to expected historical or projected future results of operations. For purposes of performing the required impairment test, we derive enterprise fair value utilizing the income approach, whereby current and future estimated discounted cash flows are utilized to calculate an operating value of our company on a controlling interest basis. We then compare the derived fair value with the balance of goodwill. We have determined that we have one reporting unit, and we have made assumptions about net revenues, expenses, and growth rates, based on our forecasts, business plans, economic projections, anticipated future cash flows and marketplace data. The fair value of our single reporting unit significantly exceeded its carrying value, including goodwill, as of the impairment test date of October 1, 2012 and our fiscal year end of December 31, 2012. As a result, we passed Step 1 of the goodwill impairment analysis and no further evaluation was required. Due to the significant excess of the fair value of our single reporting unit over its carrying value, a 10% decrease to the estimated fair value of that reporting unit would not have had an impact on the conclusion of our goodwill impairment testing for that reporting unit. The assumptions used in our evaluation of goodwill as of the valuation date of October 1, 2012 are consistent with the assumptions used in our evaluation of our common stock as of September 30, 2012, as described elsewhere in this prospectus.
Long-lived assets, including intangible assets, are reviewed for impairment whenever events or changes in circumstances indicate that the carrying amount of the asset may not be recoverable. When such events occur, we compare the carrying amounts of the assets to their undiscounted expected future cash flows. If this comparison indicates that there is impairment, the amount of the impairment is calculated as the difference between the carrying value and fair value.
In 2012, we determined that we would no longer support three of our websites, Coupon7.com, Couponshare.com and CheapStingyBargains.com. We have redirected traffic from CheapStingyBargains.com to Deals2Buy.com and refer visitors from Coupon7.com and Couponshare.com to RetailMeNot.com. We do not expect these sites to provide additional income. As a result of this impairment indicator, we determined that a complete impairment of the remaining unamortized intangible assets related to these websites was warranted, resulting in an impairment charge of $4.9 million. We did not record any intangible asset impairment charges during the years ended December 31, 2010 and 2011 or the nine months ended September 30, 2013.
78
Table of Contents
Revenue Recognition
We recognize revenue when persuasive evidence of an arrangement exists, services have been rendered, the fee to our customers is fixed or determinable and collectability of the resulting receivable is reasonably assured. For commission revenues, which represent the significant majority of our net revenues, revenue recognition generally occurs when a consumer, having visited one of our websites and clicked on a digital coupon for a paid retailer, makes a purchase with such paid retailer, and completion of the order is reported to us by such paid retailer, either directly or through a performance marketing network. Certain paid retailers do not provide reporting until a cash payment is made. In those cases, which have historically not been significant, we record commission revenues on a cash basis. We estimate and record a reserve, based upon historical experience, to provide for end-user cancelations or product returns, which may not be reported by the retailer or performance marketing network until a subsequent date. Net revenues are reported net of sales taxes, where applicable.
Income Taxes
We are subject to income taxes in both the U.S. and foreign jurisdictions. Significant judgment is required in evaluating our tax positions and determining our provision for income taxes. During the ordinary course of business, there are many transactions and calculations for which the ultimate tax determination is uncertain. For example, our effective tax rate could be adversely affected by differences between our anticipated and the actual mix of earnings generated across different tax jurisdictions which have higher or lower statutory tax rates, by changes in the valuation of our deferred tax assets and liabilities, by changes in foreign currency exchange rates or by changes in the relevant tax, accounting and other laws, regulations, principles and interpretations.
We account for income taxes using the asset and liability method, under which deferred income tax assets and liabilities are recognized based upon anticipated future tax consequences attributable to differences between financial statement carrying values of assets and liabilities and their respective tax bases. Deferred tax assets and liabilities are measured using enacted tax rates expected to apply to taxable income in the years in which those temporary differences are expected to be reversed or settled. We regularly review deferred tax assets to assess their potential realization and establish a valuation allowance for portions of such assets to reduce the carrying value if we do not consider it to be more likely than not that the deferred tax assets will be realized. Any change in the valuation allowance would be charged to income in the period such determination was made. We recognize a tax benefit from an uncertain tax position in the financial statements only when it is more likely than not that the position will be sustained.
We are subject to audit in various jurisdictions, and such jurisdictions may assess additional income taxes against us. Although we believe our tax estimates are reasonable, the final determination of any tax audits and any related litigation could be materially different from historical income tax provisions and accruals. The results of an audit or litigation could have a material effect on our operating results or cash flows in the period or periods for which that determination is made.
Stock-Based Compensation
We measure stock-based compensation expense at fair value net of estimated forfeitures and generally recognize the corresponding compensation expense on a straight-line basis over the service period during which awards are expected to vest. Forfeiture rates are estimated at grant date based on historical experience and adjusted in subsequent periods for differences in actual forfeitures from those estimates.
We use the Black-Scholes-Merton option-pricing model to determine the fair value of stock options. The determination of the grant date fair value of options using an option-pricing model is affected by our estimates of a number of complex and subjective variables. These variables include the fair value of our common stock, as well as the following variables:
| • | Fair Value of Our Common Stock. Because our stock was not publicly traded prior to our initial public offering, the fair value of our common stock underlying our stock options was previously determined by our board of directors, which intended all options to be exercisable at a price per share not less than |
79
Table of Contents
| the per share value of our common stock underlying those options on the date of grant. Following the completion of our initial public offering our common stock was valued by reference to its publicly traded price. |
| • | Expected Term. The expected term represents the period of time the stock options are expected to be outstanding and is based on the “simplified method” allowed under applicable SEC guidance. We used the “simplified method” due to the lack of sufficient historical exercise data to provide a reasonable basis upon which to otherwise estimate the expected life of the stock options. |
| • | Expected Volatility. Since we do not have a significant trading history for our Series 1 common stock, the expected stock price volatility was estimated by taking the average historical price volatility for publicly-traded options of comparable industry peers similar in size, stage of life cycle and financial leverage, based on daily price observations over a period equivalent to the expected term of the stock option grants. We did not rely on implied volatilities of traded options in our industry peers’ common stock because the volume of activity was relatively low. We intend to continue to consistently apply this process using the same or similar public companies until a sufficient amount of historical information regarding the volatility of our Series 1 common stock share price becomes available, or unless circumstances change such that the identified companies are no longer similar to us, in which case more suitable companies whose share prices are publicly available would be utilized in the calculation. |
| • | Dividend Yield. We do not presently plan to pay cash dividends on our Series 1 common stock in the foreseeable future. Consequently, we used an expected dividend yield of zero. |
| • | Risk-free Interest Rate. The risk-free interest rate is based on the yields of U.S. Treasury securities with maturities similar to the expected term of the options for each option group. |
The following table presents the weighted-average assumptions used to estimate the fair value of options granted during the years ended December 31, 2010, 2011 and 2012, and the nine months ended September 30, 2013:
|
Year Ended December 31, |
Nine Months Ended September 30, 2013 |
|||||||||||||||
| Assumptions used for options’ valuation |
2010 | 2011 | 2012 | |||||||||||||
| Expected Term (in years) |
5.90 | 6.02 | 5.97 | 6.01 | ||||||||||||
| Expected Volatility |
77.2 | % | 72.9 | % | 64.5 | % | 60.7 | % | ||||||||
| Expected Dividend Yield |
— | % | — | % | — | % | — | % | ||||||||
| Risk-Free Rate of Return |
2.53 | % | 1.83 | % | 0.95 | % | 1.22 | % | ||||||||
If any of the assumptions used in the Black-Scholes-Merton option-pricing model change significantly, stock-based compensation costs for future awards may differ materially as compared to the cost of our current awards.
We recorded stock-based compensation expense of $0.1 million, $0.5 million and $4.0 million for fiscal years 2010, 2011 and 2012, respectively, and $7.1 million for the nine-month period September 30, 2013.
Recently Issued and Adopted Accounting Pronouncements
In May 2011, FASB issued new guidance that amends some of the fair value measurement principles and disclosure requirements. The new guidance clarifies how a principal market is determined, how and when the valuation premise of highest and best use applies, and how premiums and discounts are applied, as well as requiring new disclosures. We adopted these provisions as of January 1, 2012, which did not have a material impact on our consolidated financial statements.
In June 2011, FASB issued new guidance related to the presentation of comprehensive income. The new guidance eliminates the current option to present components of other comprehensive income as part of the statement of changes in stockholders’ equity and requires an entity to present either one continuous statement of net income and other comprehensive income or two separate, but consecutive statements. We adopted these
80
Table of Contents
provisions as of January 1, 2012, which only affected how, and in what specific financial statements, we present the components of comprehensive income. The adoption of these provisions had no impact on our financial position, results of operations, or cash flow.
In September 2011, FASB issued new guidance that will allow entities to use a qualitative approach to test goodwill for impairment. After assessment of certain qualitative factors, if it is determined to be more likely than not that the fair value of a reporting unit is less than its carrying value, entities must perform the currently prescribed two-step goodwill impairment test. Otherwise, the two-step impairment test is not required. We did not elect to utilize the qualitative goodwill impairment testing approach.
In July 2012, FASB issued amended guidance that simplifies how entities test indefinite-lived intangible assets other than goodwill for impairment. After assessment of certain qualitative factors, if it is determined to be more likely than not that an indefinite-lived asset is impaired, entities must perform the quantitative impairment test. Otherwise, the quantitative test becomes optional. We did not elect to utilize the qualitative indefinite-lived intangible asset impairment testing approach.
In February 2013, the FASB issued new guidance that amends the presentation of items reclassified from accumulated other comprehensive income to net income. The guidance requires that information regarding such reclassifications is presented by component and reported in one place within the financial statements. We adopted these provisions on January 1, 2013, which only affect how we present information about reclassifications from accumulated other comprehensive income to net income. The adoption of these provisions had no impact on our financial position, results of operations or cash flows.
JOBS Act
The JOBS Act contains provisions that, among other things, reduce certain reporting requirements for qualifying public companies. As defined in the JOBS Act, a public company whose initial public offering of common equity securities occurred after December 8, 2011 and whose annual gross revenues are less than $1.0 billion will, in general, qualify as an “emerging growth company” until the earliest of:
| • | the last day of its fiscal year following the fifth anniversary of the date of its initial public offering of common equity securities; |
| • | the last day of its fiscal year in which it has annual gross revenue of $1.0 billion or more; |
| • | the date on which it has, during the previous three-year period, issued more than $1.0 billion in non-convertible debt; and |
| • | the date on which it is deemed to be a “large accelerated filer,” which will occur at such time as the company (a) has an aggregate worldwide market value of common equity securities held by non-affiliates of $700 million or more as of the last business day of its most recently completed second fiscal quarter, (b) has been required to file annual and quarterly reports under the Exchange Act for a period of at least 12 months and (c) has filed at least one annual report pursuant to the Securities Act of 1934, as amended. |
Under this definition, we are an “emerging growth company” and could remain one until as late as December 31, 2018.
As an “emerging growth company” we have chosen to rely on such exemptions and are therefore not required to, among other things, (i) provide an auditor’s attestation report on our system of internal controls over financial reporting pursuant to Section 404, (ii) provide all of the compensation disclosure that may be required of non-emerging growth public companies under the Dodd-Frank Wall Street Reform and Consumer Protection Act, (iii) comply with any requirement that may be adopted by the PCAOB regarding mandatory audit firm rotation or a supplement to the auditor’s report providing additional information about the audit and the financial statements (auditor discussion and analysis) and (iv) disclose certain executive compensation-related items such as the correlation between executive compensation and performance and comparisons of the Chief Executive Officer’s compensation to median employee compensation.
81
Table of Contents
Company Overview
We operate the world’s largest digital coupon marketplace, connecting consumers with leading retailers and brands. In 2012, our marketplace featured digital coupons from over 60,000 retailers and brands, and according to our internal data compiled using Google Analytics, we had more than 450 million total visits to our desktop and mobile websites. As of December 31, 2012, we had contracts with more than 10,000 paid retailers. We own and operate the largest digital coupon marketplaces in the U.S. (RetailMeNot.com) and the U.K. (VoucherCodes.co.uk) and the largest portfolio of digital coupon websites in France (Web.Bons-de-Reduction.com, Poulpeo.com and Ma-Reduc.com).
We are the leading digital coupon destination for consumers. In 2013, our marketplace featured more than 500,000 digital coupons in each month. Digital coupons are coupons, coupon codes and brand or category specific discounts made available online or through mobile applications that are used by consumers to make online or in-store purchases directly from retailers. Our websites, mobile applications, email newsletters and alerts and social media presence enable consumers to search for, discover and redeem hundreds of thousands of relevant digital coupons from retailers and brands. Our marketplace features digital coupons across multiple product categories, including clothing; electronics; health and beauty; home and office; travel, food and entertainment; personal and business services; and shoes. We believe our investments in digital coupon content quality, product innovation and direct retailer relationships allow us to offer a compelling experience to consumers looking to save money, whether online or in-store.
We believe we are a trusted partner to retailers and brands. During 2010, 2011 and 2012, our paid retailers realized over $0.2 billion, $1.2 billion and $2.4 billion, respectively, in sales attributable to consumer traffic from our marketplace. We estimate that during the five-day period from November 22, 2012, Thanksgiving Day, through November 26, 2012, commonly known as Cyber Monday, sales attributable to consumer traffic from digital coupons in our marketplace accounted for approximately 2% of retail e-commerce spending in the U.S. We provide our retailers and brands access to a large and engaged consumer audience. We help retailers and brands drive sales and acquire new customers, online through our websites and mobile applications and in-store by displaying a digital coupon on our mobile applications. In addition, our pay-for-performance model enables us to have a mutually beneficial relationship with our paid retailers, as they pay a commission to us only after a sale is made.
We believe our marketplace benefits from network effects. As more consumers use our marketplace, we are better able to obtain high quality digital coupons from retailers and brands, which in turn attracts a larger consumer audience. We seek to reinforce our position as the leading digital coupon destination by continuing to increase consumer traffic and growing the breadth and depth of our digital coupons, as well as our retailer and brand relationships.
Since we entered the digital coupon market in 2009, we have experienced significant growth. Our net revenues increased from $16.9 million in 2010 to $144.7 million in 2012, representing a 192.9% compound annual growth rate, or CAGR. In the same period, our net income increased from $2.3 million to $26.0 million, representing a 233.0% CAGR, and adjusted EBITDA increased from $6.8 million in 2010 to $70.4 million in 2012, representing a 221.7% CAGR. Our historic growth has been driven organically and through acquisitions. From 2011 to 2012, our consolidated net revenues grew from $80.4 million to $144.7 million. During this period, net revenues from RetailMeNot.com grew organically from $60.5 million to $113.4 million. This $52.9 million increase in net revenues from RetailMeNot.com represents 82.3% of our consolidated net revenues growth. During the nine months ended September 30, 2013, we generated net revenues of $131.3 million, representing a 39.8% increase from the $93.9 million in net revenues we generated during the nine months ended September 30, 2012. Net income changed from $18.2 million for the nine months ended September 30, 2012 to $17.7 million for the nine months ended September 30, 2013, representing a 2.7% decrease from the nine months ended September 30, 2012. Adjusted EBITDA for the nine months ended September 30, 2013 grew to $50.4 million, a
82
Table of Contents
3.5% increase from the $48.7 million in adjusted EBITDA generated during the nine months ended September 30, 2012. From the nine months ended September 30, 2012 to the nine months ended September 30, 2013, organic net revenues grew from $93.9 million to $126.9 million. This $33.0 million increase represented 88.1% of our consolidated net revenues growth. For further discussion regarding adjusted EBITDA, our use of this measure, the limitations of this measure and a reconciliation of adjusted EBITDA to net income, see the section titled “Selected Consolidated Financial and Other Data” on page 47.
In 2012 and the first nine months of 2013, we generated 82.9% and 79.4% of our net revenues, respectively, in the U.S. and the balance in the U.K., France, Canada, Germany and the Netherlands. As of September 30, 2013, we had 414 full-time employees and operations in the U.S., U.K., France, Germany and the Netherlands.
The below charts set forth the growth in our visits, net revenues, net income and adjusted EBITDA for the years ended December 31, 2010, 2011 and 2012:
|
|
|
Our Industry
The retail industry is large and e-commerce and mobile commerce are growing rapidly.
According to data compiled by Euromonitor International, a provider of strategy research for consumer markets, the worldwide retail industry, excluding grocery retailers, was $7.7 trillion in 2012, of which $2.9 trillion was in the markets in which we operate. We estimate that consumers spent more than $570.0 billion using coupons globally in 2012. Further, technology-enabled commerce online and through mobile devices has experienced rapid growth as consumers change how and where they research products, make purchase decisions and ultimately make purchases. According to the Worldwide New Media Market Model published in July 2013 by IDC, a provider of market intelligence for the IT, telecommunications and consumer technology markets, the consumer e-commerce market in 2012 was $992.6 billion globally, of which $289.1 billion was in the U.S. and is projected to grow at a CAGR of 16.7% globally, and 9.2% in the U.S., between 2012 and 2017. Over the same period, the number of Internet consumers globally is expected to nearly double, from 967.5 million in 2012 to 1.9 billion in 2017.
The proliferation of smartphone devices and tablets makes business to consumer mobile commerce, or m-commerce, one of the fastest growing retailing channels. The IDC Worldwide New Media Market Model estimates that m-commerce represented $64.5 billion globally in 2012, and expects it to grow at a 35.5% CAGR between 2012 and 2017.
Consumers are increasingly using the Internet and mobile devices to inform purchase decisions.
The Internet and mobile devices have become an integral part of the consumer purchase decision process online and in-store. According to a June 2012 report entitled “US Cross-Channel Retail Forecast, 2011 to 2016,” Forrester Research, Inc. a research and advisory firm, estimates that by 2016, 44% of total retail sales in the U.S., representing $1.7 trillion of offline retail commerce, will be influenced by online research.
83
Table of Contents
Consumer adoption of digital coupons on mobile devices is disruptive and growing.
According to the IDC Worldwide Smartphone 2013—2017 Forecast, worldwide smartphone shipments are projected to exceed one billion units in 2014 and 1.7 billion units by 2017. We believe this rapid adoption of mobile devices is changing the way consumers shop, both online and in-store. The rise of mobile-optimized websites and mobile coupon applications have enabled consumers to use digital coupons for purchases through their mobile devices or for in-store redemption at checkout. In a January 2013 article, eMarketer, a provider of digital marketing and media research, estimates that, in 2013, 32.0% of adult smartphone users in the U.S. will redeem a coupon obtained from a mobile device, up from 13.0% in 2010. We believe that the adoption of location-based technologies will further contribute to this growth. According to an August 2012 study conducted by the e-tailing group, an e-commerce consulting group, of consumers with smartphones, 42% use their smartphone’s GPS capability to find stores near their location.
Consumers have a mindset for savings.
We believe consumers love to save money and increasingly start shopping online with a mindset to search and discover digital coupons. In a January 2013 article, eMarketer estimated that 48.0% of U.S. adult Internet users redeemed a digital coupon for online shopping or offline shopping in the past year. In a December 2011 study titled “Optimizing the Affiliate Channel for Deal-Driven Customers,” Forrester Research, Inc. found that affiliate deal sites are now beginning to dominate coupon related shopping traffic and are therefore exerting much greater influence on the consumer shopping experience, and consumers perceive deals offered on affiliate sites as superior to deals offered on retailers’ own websites.
Retailers are shifting promotional activities online and to pay-for-performance channels like digital coupons.
Retailers and brands are recognizing the need to expand their online and mobile advertising initiatives. We believe many retailers are re-allocating their budgets to the channels in which consumers are spending more of their time before making purchase decisions.
Internet and mobile advertising are the fastest-growing advertising mediums worldwide. In 2012, worldwide advertising spend totaled $650.0 billion and is projected to grow at a 4.1% CAGR between 2012 and 2017, worldwide Internet advertising spend totaled $101.1 billion in 2012 and is projected to grow at a 11.9% CAGR during the period and worldwide mobile advertising spend totaled $10.0 billion in 2012 and is projected to grow at a 39.2% CAGR during the period, according to the IDC Worldwide New Media Market Model.
Retailers are focused on the return on investment, or ROI, of their marketing spend and are adopting solutions, like digital coupons, that allow them to measure and optimize the impact of their promotional campaigns. We believe that the direct response nature of digital coupons, which allow for better consumer segmentation, targeting, tracking of redemptions and automated attribution to specific promotional campaign spend better facilitate retailers’ ability to measure the ROI compared to more traditional advertising channels.
In addition, the speed and adaptability of the online model for digital coupons allows retailers to reach consumers whenever and wherever they are shopping. Further retailers are able to post digital coupons quickly, edit and iterate on-the-go and modify the scale of campaigns dynamically based on consumer interest and marketing budgets. This compares favorably to traditional print couponing, which requires longer lead times and is a more manual and expensive process due to the additional overhead associated with printing and distributing physical coupons.
Industry Challenges
Within this large addressable market, consumers and retailers face various challenges that represent barriers to increased retail commerce activity, online and in-store.
84
Table of Contents
Challenges for Consumers
| • | Difficult to find relevant digital coupons. Digital coupons are most valuable to consumers when they relate to products and brands that consumers want. Consumers face a fragmented landscape as digital coupons are available in many different formats across a large number of distribution channels. Traditional coupons are available in newspapers, magazines and direct mail, while digital coupons are available on the websites of retailers and brands, digital coupon websites, in emails or embedded as advertising. Many digital coupon websites and other distribution channels lack the breadth and depth to offer a relevant digital coupon when a consumer wants it. In addition, few digital coupon websites have the retail relationships and resources to build a comprehensive offering of digital coupons for consumers. Consumers often have to resort to visiting multiple websites to check if a relevant digital coupon from their preferred retailer is available. |
| • | Unreliable digital coupons. Many digital coupon websites provide unreliable digital coupons that may be declined by retailers, causing consumer frustration and disappointment. These websites lack the infrastructure and technology to review and validate digital coupons that appear on their website, resulting in digital coupons that can expire without notice or are invalid. |
| • | Inconvenience associated with traditional coupons. Traditional coupons distributed via fragmented offline media such as newspapers and circulars are hard to discover, search and organize, and carry expiration dates which are difficult to track. They are often not easily available on-demand when a consumer is shopping and can rarely be redeemed across multiple channels, such as online and in-store. |
Challenges for Retailers
| • | Difficulty reaching consumers at scale. The increasing amount of digital content and the proliferation of mobile devices creates significant audience fragmentation. This fragmentation makes it difficult for retailers and brands to reach their target audience at scale and at a time when their purchase behavior can be influenced. |
| • | Difficulty engaging consumers across channels. With a shift of consumer engagement towards online, mobile and social channels, retailers need an integrated multichannel solution to optimize their promotional efforts. Creating consistent and integrated consumer engagement across their online, mobile and offline retail presence can represent a challenge for many retailers. Additionally, if consumers have a poor experience with a coupon it may negatively impact consumers’ image of the brand. |
| • | Ineffective and difficult to measure marketing solutions. Retailers are looking to maximize the returns on their promotional campaigns. Many traditional marketing options do not allow retailers to effectively measure the ROI of their marketing spend or collect behavioral consumer data to optimize their campaigns. Therefore, retailers seek a solution that can provide pay-for-performance and transparency into the effectiveness of their promotional campaigns. |
Our Solution
We operate the world’s largest digital coupon marketplace, connecting consumers with leading retailers and brands. Consumers are able to visit a trusted destination that allows them to search for, discover and redeem digital coupons from leading retailers, online or in-store. We aggregate digital coupons from retailers, performance marketing networks, our large user community, our employees and outsourced providers. Retailers are able to drive sales and acquire new customers by effectively attracting and engaging a large audience of consumers who are shopping across multiple channels. Our solution enables retailers to better manage their customer acquisition spend and effectively measure their marketing ROI.
85
Table of Contents
Solutions for Consumers
In 2012, we provided consumers with digital coupons that were redeemed in more than 22.0 million purchase transactions. Key elements of our solution for consumers include:
| • | Save money with a broad selection of coupons: Our breadth and depth of digital coupon inventory enables consumers to save money on their everyday purchases. We aggregate digital coupons available from retailers, performance marketing networks and our large user community. In 2013, we featured more than 500,000 digital coupons in each month from retailers and brands across multiple product categories including clothing; electronics; health and beauty; home and office; travel, food and entertainment; personal and business services; and shoes. |
| • | Depth of coupon selection from leading retailers within each category: In 2012, our websites featured digital coupons from over 60,000 retailers and brands. In 2012, we offered thousands of digital coupons per category. Our strong relationships with leading retailers allow us to offer digital coupons exclusive to our marketplace. |
| • | Reliability and curation of digital coupon content: Our merchandizing team actively monitors our most frequently visited digital coupon content in our marketplace to ensure content quality and curates such digital coupon content by updating and changing the display and description of digital coupons. Additionally, we leverage feedback from our large user community and our proprietary algorithms to measure performance and relevancy of our digital coupons. These efforts are designed to ensure that the best quality digital coupons rise to the top of our pages, while lower quality or expired digital coupons are displayed lower on our pages and are eventually filtered out of our content. Our merchandising team monitors the comments submitted by consumers for additional feedback on digital coupons, such as whether or not the description of the digital coupon contains an error, and updates our digital coupon content accordingly. Our focus on digital coupon quality and curation is intended to provide a high-quality experience for consumers. |
| • | Relevance and personalization: By having a selection of digital coupons from thousands of large and small retailers, we can present more comprehensive and relevant content for our large and engaged user community. Consumers can sign up for alerts for digital coupons for specific retailers they have a personal affinity for that come from us via email or submit their brand “likes” and otherwise engage with us on Facebook. We then maintain and use this information to keep our users informed via email or Facebook whenever a digital coupon from their preferred retailer becomes available through our marketplace. |
| • | Anytime, anywhere availability, online and in-store: Consumers can search for and discover our digital coupons at virtually any time via our websites, mobile applications, email newsletters and alerts or social media presence, whether on their desktop devices, mobile phone or tablet. Our mobile applications provide access to the select online and in-store digital coupons found in our marketplace, allowing consumers to search and discover the digital coupons they need and use them to shop whenever and wherever they want. Consumers can also share our digital coupons socially via Facebook, Google+, Twitter, Pinterest, email or text message, or save or print them for later use. In addition, by utilizing location-based technology, the RetailMeNot iPhone application notifies our consumers of savings opportunities when they are shopping near one of more than 3,000 geo-fenced shopping malls and centers by sending alerts for digital coupons that can be used in these malls. |
Solutions for Retailers
We believe we are a trusted partner to retailers and brands. During 2010, 2011 and 2012, our paid retailers realized over $0.2 billion, $1.2 billion and $2.4 billion, respectively, in sales attributable to consumer traffic from our marketplace. We provide our retailers and brands access to a large and engaged consumer audience during their shopping experience. Key elements of our solution for retailers include:
| • | Access to large consumer audience: We provide retailers access to the largest marketplace dedicated to digital coupons, offering a large and engaged audience of consumers with intent to purchase. In |
86
Table of Contents
| 2012, we had on average over 24.2 million monthly unique visitors to our websites, more traffic than the majority of our retailers’ own websites attract. Unique visitors are visitors who have visited one of our websites or mobile optimized websites at least once in a given month. According to comScore data, we are the largest web property focused on digital coupons as measured by unique visitors. The scale of our platform increases our ability to drive conversion by rapidly disseminating and promoting digital coupons to an engaged consumer audience at scale. |
| • | Multichannel engagement with consumers: Our websites and mobile applications offer retailers access to consumers who are shopping online and in-store. In 2012, we had over 450 million visits to our websites. We have had more than eight million mobile application downloads and have more than 13 million email subscribers. Our in-store solutions help retailers drive more in-store traffic and sales by increasing consumer awareness of discounts and promotions available to them. Other outlets, such as our social media channels, including our Facebook Page and Twitter feeds, provide two-way engagement with consumers. |
| • | Trusted partnerships and strategic dialogues: We maintain ongoing strategic dialogues and develop long-term relationships with our retailers. Our sales and partner management teams work closely with the marketing teams of our paid retailers to optimize the performance of their digital coupons. We proactively work with our paid retailers to curate their digital coupons to drive sales and build consumer trust. We believe our marketplace provides a consistent, high-quality user experience, which reflects positively on the brand image of our paid retailers. |
| • | Measurable ROI and pay-for-performance: We believe retailers focus on channels with clearly quantifiable return on investment and pay-for-performance transactional models. Our paid retailers pay a commission to us only after a consumer has made a purchase. Retailers are also able to track the performance of their digital coupons in order to monitor and control key aspects of their campaign. Our quantifiable, pay-for-performance model allows retailers to effectively measure ROI while acquiring new customers, increasing sales and driving brand loyalty. |
Our Competitive Strengths
We operate the world’s largest digital coupon marketplace, connecting consumers with leading retailers and brands. Our competitive strengths include:
| • | Global leader with strong scale and brands: According to comScore data, we are the largest web property focused on digital coupons as measured by unique visitors. We believe our strong brand recognition has allowed our marketplace to become a leading destination for consumers looking to save money on retail purchases. As a result, over 90% of traffic to our websites was generated from unpaid sources in 2012. In addition to RetailMeNot.com, our international brand portfolio includes VoucherCodes.co.uk in the U.K., Web.Bons-de-Reduction.com, Poulpeo.com and Ma-Reduc.com in France, Actiepagina.nl in the Netherlands, Deals.com in Germany and RetailMeNot.ca in Canada. |
| • | Trusted partner to leading retailers: In 2012, we maintained relationships with more than 10,000 paid retailers, including 367 of the 2012 IR500. Additionally, our relationships with our top paid retailers are growing. Our top 500 paid retailers paid us, on average, total commission revenues of $231,044 in 2012, demonstrating growth from 2011, when we had paid relationships with 488 of these same retailers, with average total commission revenues of $121,523. During the twelve-month period ended September 30, 2013, we had paid relationships with 498 of these same retailers, with average total commission revenues of $274,811. We help retailers drive sales and acquire new customers through our multichannel marketplace. We also help our paid retailers optimize their digital coupon campaigns to provide a consistent, high-quality user experience, which we believe reflects positively on the brand image of these retailers. As evidence of our successful partnerships with retailers, we have been able to grow over time the number of exclusive digital coupons we offer to consumers. These exclusive digital coupons often involve more compelling offers, and therefore drive heightened consumer interest and |
87
Table of Contents
| help portray our marketplace as the leading destination for digital coupons. Our pay-for-performance model enables us to have a mutually beneficial relationship with our paid retailers, as they pay a commission to us only after a sale is made. This model also allows our paid retailers to effectively measure marketing ROI. |
| • | Network effects: As more consumers use our websites and mobile applications, we attract more retailers and brands to our platform looking for a large audience to drive sales. As the number of retailers and brands in our marketplace increases, we are able to offer more digital coupons to consumers, which in turn attracts a larger consumer audience. As our consumer audience grows, retailers and brands are more willing to enter into paid relationships with us and provide us with exclusive digital coupons to attract our audience of consumers. |
| • | Large community of actively engaged users: According to comScore data, we are the largest web property focused on digital coupons as measured by unique visitors. We foster and support a passionate user community that contributes to our websites by submitting digital coupons and helps curate the content on our websites. We leverage our community’s passion for savings and their participation in curating the content that we provide to deliver compelling and relevant coupon selection to our broad consumer audience. This occurs through community moderation of digital coupons with the ability to filter and rank coupons on our websites that consumers find the most compelling and relevant. We believe that this engagement by our consumers increases the quality of our content, while lowering our costs to curate and moderate that content ourselves. |
| • | Strong technology platform and proprietary data: Our technology platform is designed to provide the reliability and security necessary to support a large and growing base of consumers, retailers and brands in our marketplace. As engagement in our marketplace increases, we are able to collect more proprietary data on consumer shopping behavior, which allows us to further develop and improve our marketplace to better serve consumers and offer more value to our paid retailers. This data is difficult to replicate and enables us to offer retailers insight into their digital coupon performance. Additionally, our technology serves as a basis to design and support innovative solutions and to further automate and standardize our processes. |
| • | Attractive business model with compelling value proposition: In the last three years, we have achieved a compelling combination of growth and profitability. Our net revenues increased from $16.9 million in 2010 to $144.7 million in 2012, representing a 192.9% CAGR. In the same period, our net income increased from $2.3 million to $26.0 million, representing a 233.0% CAGR, and adjusted EBITDA increased from $6.8 million in 2010 to $70.4 million in 2012, representing a 221.7% CAGR. Our historic growth has been driven organically and through acquisitions. From 2011 to 2012, our consolidated net revenues grew from $80.4 million to $144.7 million. During this period, net revenues from RetailMeNot.com grew organically from $60.5 million to $113.4 million. This $52.9 million increase in net revenues from RetailMeNot.com represents 82.3% of our consolidated net revenues growth. During the nine months ended September 30, 2013, we generated net revenues of $131.3 million, representing a 39.8% increase from the $93.9 million in net revenues we generated during the nine months ended September 30, 2012. Net income changed from $18.2 million for the nine months ended September 30, 2012 to $17.7 million for the nine months ended September 30, 2013, resulting in a 2.7% decrease from the nine months ended September 30, 2012. Adjusted EBITDA for the nine months ended September 30, 2013 grew to $50.4 million, a 3.5% increase from the $48.7 million in adjusted EBITDA generated during the nine months ended September 30, 2012. From the nine months ended September 30, 2012 to the nine months ended September 30, 2013, organic net revenues grew from $93.9 million to $126.9 million. This $33.0 million increase represented 88.1% of our consolidated net revenues growth. We believe our strong financial performance is in part a result of our mutually beneficial relationship with our paid retailers: we generate revenues on a commission basis when retailers complete a sale and consumers save money. Our high brand awareness enables us to benefit from low traffic acquisition costs through unpaid organic search as the breadth, depth and quality of our content as well as consumer engagement contribute to natural placement at or near the |
88
Table of Contents
| top of search results. For further discussion regarding adjusted EBITDA, our use of this measure, the limitations of this measure and a reconciliation of adjusted EBITDA to net income, see the section titled “Selected Consolidated Financial and Other Data” on page 47. |
Our Growth Strategy
Our objective is to expand our position as the largest digital coupon marketplace, connecting consumers and leading retailers and brands. Our strategies to achieve this goal include:
Increase traffic and monetization. To drive increased consumer traffic and net revenues, we intend to continue to invest in marketing to increase brand awareness. We deploy targeted and measured email newsletters and alerts, social media presence, and select display advertising, as well as other offline media efforts to increase the frequency of visits to our properties. Given our scale, we also benefit from our network effects to increase traffic and conversion as more digital coupons drive more consumer traffic and retail commerce activity, which in turn attracts more digital coupons to our marketplace. We also intend to obtain more exclusive digital coupons to attract more consumers.
Grow depth of paid relationships with retailers. We continue to dedicate significant resources to our experienced sales and partner management teams in order to deepen our relationships with existing paid retailers and attract new paid retailers worldwide. During 2010, 2011 and 2012, our paid retailers realized over $0.2 billion, $1.2 billion and $2.4 billion, respectively, in sales attributable to consumer traffic from our marketplace. We believe that this value proposition will help us grow our share of marketing promotional spending among our large retailer base and attract new paid retailers to our marketplace. We also aim to further strengthen our value proposition for retailers by expanding our retailer solutions, including sponsored category listings and advertising opportunities.
Enhance mobile solutions and in-store enablement. During the first three quarters of 2012 and the first three quarters of 2013, we had 47.3 million and 94.5 million visits to our websites originating from smartphones and tablets, from which we recognized net revenues of $4.3 million and $14.9 million, respectively. Currently, visits do not include interactions through our mobile applications. During the first three quarters of 2012 and the first three quarters of 2013, we had 8.5 million and 92.7 million sessions in our mobile applications, respectively. We intend to further develop our mobile optimized websites and invest in our mobile technology for smartphones and tablets, including geo-fencing capabilities, in order to increase consumer use and monetization of our solutions from mobile devices. We believe that this technology will allow us to introduce new solutions and grow the number of consumers and retailers using our mobile solutions.
Invest in technology and innovation. Innovation is a key element of our strategy, and we will continue to make significant investments in research and development to further improve our user interface, solution and platform integration, features and functionality, as well as our online and mobile technologies. Our product innovation initiatives are designed to minimize friction in consumers’ shopping experience with digital coupons from start to finish. Our key technology investment strategies include: further integrating our online and mobile product offerings; developing personalization tools to further tailor digital coupons on our websites and applications; and leveraging data and analytics to enhance our understanding of consumer behavior and help retailers measure the effectiveness of their marketing spend, across online, mobile and in-store channels. We also intend to increase the efficiency and scalability of our international operations through standardization of certain components of our technology.
Expand internationally. We have successfully leveraged our established business model to expand into attractive new geographies, including the U.K., France, Germany, the Netherlands and Canada. We intend to further grow our international presence in these markets and continue our geographic expansion efforts in markets with attractive commerce profiles and trends.
89
Table of Contents
Pursue strategic acquisitions. Since 2009, we have completed eleven acquisitions. We intend to continue pursuing expansion opportunities in existing and new markets, as well as in core and adjacent categories through strategic acquisitions.
Our Products and Services
We offer products and services to create our marketplace, where consumers save money and retailers generate sales.
Products and Services for Consumers
Our product development approach is centered on building products that enable consumers to discover quality digital coupons, virtually anytime and anywhere, and redeem them online or in-store. Our products and services for consumers are free of charge and available through our websites and mobile applications.
Websites. As the largest digital coupon marketplace, we offer our consumers hundreds of thousands of digital coupons from tens of thousands of retailers and brands across multiple product categories. Consumers visiting our marketplace search for and discover digital coupons based on retailer name, product, category, digital coupon type, popularity, success rate and other characteristics. Once a consumer discovers a relevant digital coupon, the consumer clicks on that digital coupon and is directed to the website of the respective retailer, where the consumer is able to purchase products and redeem the digital coupon.
The RetailMeNot website allows consumers to discover digital coupons and make purchases on the websites of retailers:
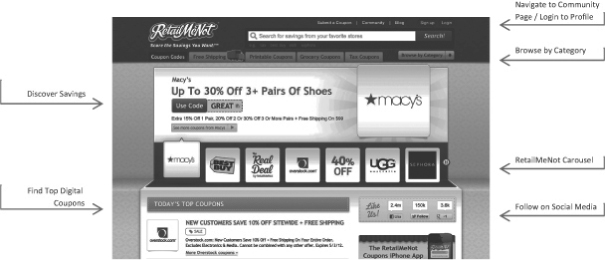
90
Table of Contents
Example of a typical retailer store page:

91
Table of Contents
Examples of Web.Bons-de-Reduction.com and VoucherCodes.co.uk:
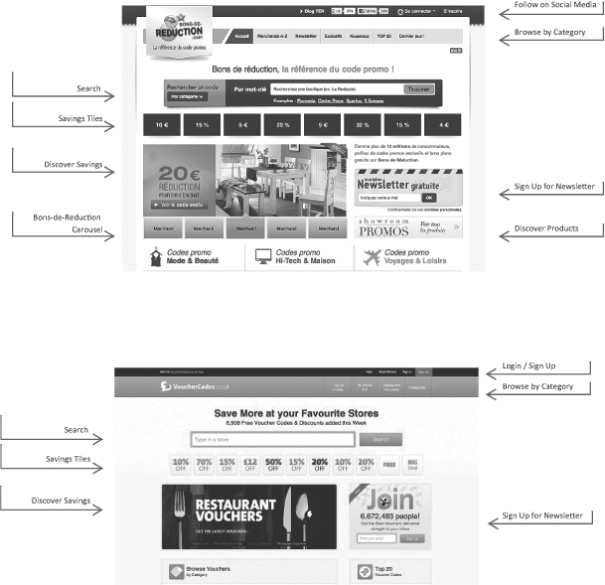
Mobile Applications. Our mobile applications allow consumers to shop when they want, where they want. Consumers use our mobile applications to discover, store for use later and access the digital coupons they want and to redeem them both online and in-store. They can browse top digital coupons, popular stores and product category listings. Our mobile applications, which have been downloaded by consumers more than eight million times, also allow users to share digital coupons with others via email, text message or through social media channels. In addition, utilizing location-based technology, the RetailMeNot iPhone application notifies consumers of savings opportunities when they are shopping near one of more than 3,000 geo-fenced shopping malls and centers by sending consumers alerts for digital coupons that can be used in these malls. Consumers can redeem these digital coupons by simply scanning the barcode at the retailer’s register or by having the sales associate enter the promotional code shown on the consumer’s mobile screen into their point-of-sale system.
92
Table of Contents
Using our geo-location technology, users that opt in receive an alert when they are near a shopping mall. The alert lists digital coupons that can be redeemed at certain stores within that mall. The mobile application also allows consumers to discover and redeem digital coupons online and to find nearby stores where the digital coupon can be utilized.
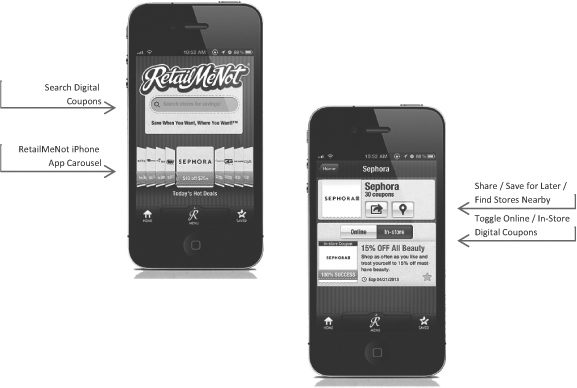
Email Newsletters and Alerts. Consumers can subscribe to receive our periodic email newsletter and alerts. Our email newsletter allows consumers to stay informed about featured digital coupons, while our alerts notify consumers when digital coupons from their preferred retailers become available. As of September 30, 2013, we had over 13 million subscribers to our free email newsletters and alerts.
| • | Email newsletters: Our newsletters are generally sent two to three times a week and typically include our top 20 digital coupons for the week, a digital coupon for a featured retailer or a weekly feature of top in-store digital coupons. In 2012, we sent consumers an average of approximately 1.9 million newsletters per week. |
| • | Alerts: Our alerts provide consumers with new digital coupons for their favorite retailers, as they become available. In 2012, we sent an average of approximately 91,000 aggregate alerts per day to our consumers. |
93
Table of Contents
Social Media. Consumers can engage with us on social media channels, such as Facebook, Google+, Pinterest and Twitter, to receive promotional messages from retailers and brands. As of September 30, 2013, we had over 2.9 million Facebook fans and 195,000 Twitter followers. We maintain an active social media presence by tweeting savings opportunities each day and recommending digital coupons to consumers through our Facebook application based on consumers’ brand likes. In addition, we engage consumers through social and gamification features in the “Community” section of RetailMeNot.com, including the ability to earn points, track dollars users have helped others save, view rankings, earn badges and win prizes.
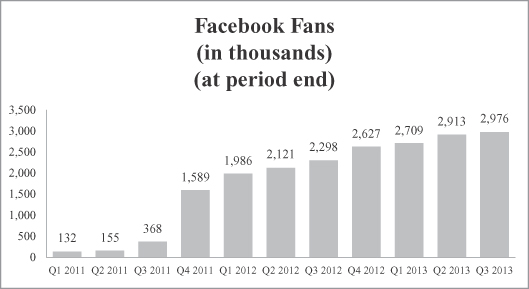
Products and Services for Retailers
We provide our retailers with access to a large and engaged consumer audience.
Multichannel Access to Consumers. We provide retailers and brands with access to new customers through multiple channels online on our websites and mobile applications, by email newsletters and alerts and our social media presence, and in-store by displaying a digital coupon on a mobile device or presenting a printed coupon. We allow retailers to provide consistent digital coupons across these multiple channels.
Advertising. We provide our paid retailers with a variety of paid premium placement opportunities to increase the impact of their digital coupon campaigns. Our most common premium placement opportunities include prominent placement within the top coupon carousel of our homepage, the side rail of our category pages, our weekly email newsletter, solo retailer newsletter campaigns and on the landing screen of our mobile applications. We typically charge a flat fee for these enhanced advertising tools on a campaign basis for a given period of time. Advertising rates may vary depending upon seasonality, placement, traffic and the length of time a retailer runs an advertisement through our marketplace.
94
Table of Contents
Our Clients
We have paid relationships with thousands of retailers across a broad range of industry verticals. In each of 2011, 2012 and the first nine months of 2013, our largest paid retailer represented less than 2% of our net revenues. The following table sets forth a selected list of our paid retailers in 2012 and is not intended to be representative of our full paid retailer list:
| Aéropostale |
eBay | Hewlett-Packard | Overstock | |||
| Best Buy |
Expedia | Hotels.com | Pacific Sunwear | |||
| Brooks Brothers |
Finish Line | Macy’s | Sephora | |||
| Dell |
GoDaddy | Orbitz | Travelocity | |||
| UGG |
The following case studies illustrate how retailers use our marketplace:
Case Study #1: We converted a leading women’s apparel brand to a paid relationship by helping monetize surplus inventory through our marketplace.
We approached a leading women’s apparel brand in an attempt to convert it to a paid retailer. At the time, the retailer was evaluating an advertising campaign in order to monetize excess inventory by promoting a “gift with purchase” offer. We convinced the retailer to conduct a test with us to validate that our marketplace was a superior alternative to its contemplated advertising campaign.
We worked with the retailer to promote an exclusive offer through our marketplace during the holiday season in 2010 to help the retailer monetize surplus inventory. We promoted the retailer’s “gift with a purchase” offer in our newsletter, on our RetailMeNot store page and through our Facebook Page and Twitter feed.
The exposure through our marketplace enabled the retailer to achieve its target of monetizing 8,500 units of excess inventory in five days, alleviating the need to conduct the separate contemplated advertising campaign. Following the success of this and a subsequent test, the retailer established a paid relationship with us. During the first 12 months of the paid relationship, our marketplace facilitated $27.6 million of sales for this retailer.
Case Study #2: We helped a casual apparel retailer to embrace multichannel digital coupon offers and generate online and in-store sales.
In 2012, a retailer of casual apparel and accessories wanted to test a multichannel digital coupon with us to determine whether the retailer could drive sales both online and in-store through our marketplace, without cannibalizing in-store sales.
The retailer coordinated with us to implement a test that would allow consumers to save money whether shopping online, from a mobile device or in-store with the goal of increasing sales both online and in-store with the same offer.
During the first six months of 2012, utilizing this multichannel approach, sales for this retailer facilitated by our marketplace increased by 393%, compared to the same six-month period in the prior year, during which the retailer used an online-only approach in our marketplace.
As a result of this test, the retailer has been making digital coupons available across multiple channels of our marketplace, allowing consumers to choose their preferred digital coupon redemption method and engage with the retailer whenever and wherever they want, while effectively generating sales for the retailer.
Case Study #3: Increased audience exposure through our marketplace led to more traffic and sales for a leading e-commerce retailer, resulting in an expansion of the use of our marketplace for other product categories.
In late 2012, a leading e-commerce retailer evaluated our marketplace as an alternate consumer traffic source to build incremental sales volume for selected product categories. The retailer challenged us to increase the retailer’s sales originating from visitors to our marketplace by 150% and consumer traffic to its website by 200%.
95
Table of Contents
We designed a two-phased test that ran during a three-month period from late 2012 through early 2013. The first phase was designed to drive sales to product-specific and branded digital coupons. In the second phase, the retailer featured exclusive offers for apparel, watches and jewelry categories in our marketplace. We gave the digital coupons premium exposure in each of the channels of our marketplace to encourage consumer traffic to the retailer’s website and drive incremental sales for the retailer.
During the three-month test period, the retailer’s sales originating from visitors to our marketplace increased $6.2 million, or 188%, and consumer traffic increased by 216%. Based on these results, the retailer made introductions to additional product categories. By expanding our footprint within the organization and proving value across multiple product categories, the retailer has reported to us that we have become one of the retailer’s trusted partners.
Case Study #4: Exclusive offers through our marketplace drove incremental sales volume and new customer acquisition for a beauty retailer listed in the Internet Retailer 2012 Top 500 Guide.
We proposed a three-month test campaign to a beauty retailer listed in the Internet Retailer 2012 Top 500 Guide, designed to demonstrate that running exclusive digital coupons through our marketplace would drive incremental sales volume and new customer acquisition for the beauty retailer. We worked with the beauty retailer to develop four digital coupons for a multichannel campaign available exclusively through our marketplace, which included premium placements on RetailMeNot.com and in our newsletter, Facebook Page and Twitter feeds. The four digital coupons were live for eight to 18 days each over a three-month period in 2012. During the period each digital coupon was live, consumers who clicked on such digital coupons were offered free shipping or a free product giveaway with their purchase.
For each exclusive digital coupon, the retailer measured the number of new customers acquired and the total incremental sales realized. The retailer reported to us that it realized $0.9 million, or an increase of approximately 81%, in aggregate incremental sales from the test periods with us compared to same periods in 2011. The retailer also reported to us that during the test periods, approximately 30% of orders originating from these digital coupons were with new online customers for the retailer approximately two-thirds of which had not previously purchased from the retailer online or in-store.
Due to the success of these tests from both incremental sales and new customers, the retailer has run additional exclusive digital coupons with RetailMeNot on a monthly basis, and we have increased our commission revenues from the retailer.
2012 Top 500 Paid Retailer Cohort Analysis
We have performed an analysis of our top 500 paid retailers in 2012, which paid retailers we refer to as the 2012 Top 500 Cohort. We identified the paid retailers from the 2012 Top 500 Cohort with which we had a contract through one or more of our websites in 2011 or 2012, as well as the commission revenues that we realized from those arrangements during each year. The below table provides a summary of the results of our analysis of the 2012 Top 500 Cohort, where the average commission revenues per paid retailer is calculated by dividing the total commission revenues for all 2012 Top 500 Cohort paid retailers with which we had a contract in a given period by the number of such 2012 Top 500 Cohort paid retailers for that period.
| Year Ended December 31, | Twelve Months Ended September 30, |
|||||||||||||||
| 2011 | 2012 | 2012 | 2013 | |||||||||||||
| Number of paid retailers |
488 | 500 | 499 | 498 | ||||||||||||
| Total commission revenues (millions) |
$ | 59.3 | $ | 115.5 | $ | 100.0 | $ | 136.9 | ||||||||
| Average commission revenues per paid retailer |
$ | 121,523 | $ | 231,044 | $ | 200,345 | $ | 274,811 | ||||||||
96
Table of Contents
We increased the number of paid retailers in our 2012 Top 500 Cohort that paid us over $100,000 in annual commission revenues from 157 in 2011 to 291 in 2012, and from 257 during the twelve-month period ended September 30, 2012 to 326 during the twelve-month period ended September 30, 2013. We also grew our number of 2012 Top 500 Cohort paid retailer accounts with over $1,000,000 in annual commission revenues from five in 2011 to 20 in 2012, and from 17 during the twelve-month period ended September 30, 2012 to 26 during the twelve-month period ended September 30, 2013, as summarized in the table below.
| Number of Paid Retailers | ||||||||||||||||
| Year Ended December 31, | Twelve Months Ended September 30, | |||||||||||||||
| Commission Revenues |
2011 | 2012 | 2012 | 2013 | ||||||||||||
| Greater than $100,000 |
157 | 291 | 257 | 326 | ||||||||||||
| Greater than $500,000 |
28 | 50 | 44 | 72 | ||||||||||||
| Greater than $1,000,000 |
5 | 20 | 17 | 26 | ||||||||||||
During 2012, commission revenues from the 2012 Top 500 Cohort accounted for 79.8% of our total net revenues, and no individual paid retailer generated more than 2% of our net revenues. As these top paid retailers represent the significant majority of our net revenues, our sales and partner management teams currently focus their efforts on strengthening our relationships with these paid retailers. However, we also attempt to convert certain retailers in our marketplace that are not paid retailers into paid retailer relationships. We cannot assure you that we will continue to experience similar outcomes in future periods. Because we are an early-stage company with limited operating history and our contracts with paid retailers are short term, we are unable to predict the duration or growth of our relationships with paid retailers, or the rate at which we will attract new paid retailers in future periods. We also cannot predict whether commission revenues from this, or other cohorts, will remain stable or grow in the future. We encourage you to read our consolidated financial statements that are included in this prospectus.
Our Websites and Brands
We operate a portfolio of digital coupon websites that span multiple geographic locations and languages. We acquired the majority of the websites we operate today and have typically maintained the brand name we acquired in each local market given the brand awareness of each website created prior to our acquisition. Each of these websites provides the same core set of solutions: consumers use these websites at no charge to search for and discover digital coupons they can redeem online or in-store with leading retailers and brands.
In 2013, we launched our corporate rebranding in the U.S. from WhaleShark Media to RetailMeNot. Currently, we use the RetailMeNot brand in the U.S., including RetailMeNot.com, our mobile optimized website and the RetailMeNot mobile applications currently available for free for iPhone and Android, and in Canada, through RetailMeNot.ca. We acquired the business of RetailMeNot.com in 2010. In 2012 and the nine months ended September 30, 2013, our RetailMeNot websites accounted for the majority of our traffic, with mobile traffic representing 11.7% and 18.9% of that traffic, respectively. We expect to continue to focus our efforts on building the RetailMeNot brand in the U.S. and Canada.
We acquired the business of VoucherCodes.co.uk. in August 2011, which is our brand in the U.K. The VoucherCodes.co.uk. brand includes the VoucherCodes.co.uk. website and mobile applications currently available for free for iPhone and Android. In May 2012, we re-launched our website Deals.com to serve consumers and retailers in German-speaking markets. Also in May 2012, we acquired the businesses of Web.Bons-de-Reduction.com and Poulpeo.com in France. The Web.Bons-de-Reduction.com brand includes the Web.Bons-de-Reduction.com website and mobile application currently available for free for iPhone. As of March 1, 2013, we established operations in the Netherlands through the acquisition of the business of Actiepagina.nl. In June 2013, we launched our website RetailMeNot.ca to serve English-speaking consumers and retailers in Canada. In July 2013, we expanded our presence in France through the acquisition of the business of Ma-Reduc.com. As a result of this acquisition, we operate the largest portfolio of digital coupon websites in France (Web.Bons-de-Reduction.com, Poulpeo.com and Ma-Reduc.com).
97
Table of Contents
Our primary websites include:
| Website |
Mobile Applications | Geographic Location |
Language | Focus | ||||
| Retailmenot.com | iPhone & Android | U.S. | English | Online and In-Store Coupons | ||||
| VoucherCodes.co.uk | iPhone & Android | U.K. | English | Online and In-Store Coupons | ||||
| Web.Bons-de-Reduction.com | iPhone | France | French | Online Coupons | ||||
| Poulpeo.com | iPhone & Android | France | French | Online Coupons with Cash Back | ||||
| Ma-Reduc.com | None | France | French | Online Coupons | ||||
| Actiepagina.nl | None | Netherlands | Dutch | Online Coupons | ||||
| Deals.com | None | Germany | German | Online Coupons | ||||
| RetailMeNot.ca | None | Canada | English | Online Coupons |
Business Operations
Website Operations. Our website operations team, composed of approximately 16 employees as of September 30, 2013, is focused on validating and enriching the quality of the most frequently visited digital coupon content we receive from retailers, their performance marketing networks and our user community by sourcing additional digital coupon content and moderating, adding metadata and editing digital coupon content for publication through our marketplace. We believe this focus makes our marketplace the highest quality and most comprehensive destination for digital coupon content. In addition to our full-time employees on premise, we also contract offshore teams in India and Madagascar to help source and manage our digital coupon content. Our website operations team also provides email support to consumers and quality assurance support for our retailers’ promotions.
Merchandising. Our category-and channel-based merchandising team, composed of approximately 47 employees as of September 30, 2013, leverages in-house experts to improve traffic monetization, enhance consumer experience and deliver insights to paid retailers. This team is responsible for updating and changing the display of our digital coupon content for publication through our marketplace. In addition, the team manages and curates digital coupons for specific categories and channels and, as a result, develops deep category and channel expertise. This curation process results in higher quality coupons on our websites and mobile applications and enhances the consumer experience.
Sales and Partner Management
Our sales and partner management departments are responsible for acquiring, managing, and optimizing relationships with retailers and their performance marketing agents and providing retailers with insights they can use to evaluate and adjust their promotional campaigns. Typically, our sales and partner management teams specialize in specific categories and retailer relationships in order to provide enhanced knowledge and service to our paid retailers. Our sales and partner management teams are responsible for negotiating commission rates that impact our revenues, offering premium advertising placements throughout our properties to reach more consumers and introducing new digital coupon solutions that we develop. Together with our merchandising team, our partner management team continually works to develop and improve content strategies for paid retailers. Performance marketing networks provide us with a portion of our digital coupon content as well as affiliate tracking links, which enable retailers to credit a sale to us.
We seek to deepen the relationships we have with our existing paid retailers and expand the number of paid retailers that advertise through our marketplace. Our sales and partner management teams work with our product, marketing and business development teams to identify new products and services to further monetize consumer traffic that we deliver to our retailers. To strengthen our relationships with our existing paid retailers, we have historically hosted an annual partner summit in Austin, Texas. We expect to continue to do so in the future, and in 2013 we expect to host our first partner summit in Europe. In 2013, we began hosting periodic advisory board meetings that will include many of our top paid retailers. These events allow us to meet individually with our
98
Table of Contents
largest paid retailers to discuss industry and consumer shopping trends and methods to improve consumer acquisition and digital coupon optimization strategies. Our teams also attend and participate in industry association trade shows, events and conferences to further increase our presence and awareness in the digital coupon industry and to engage retailers and performance marketing networks for potential distribution arrangements.
Marketing
The main objectives of our marketing team are to increase and diversify sources of consumer traffic to and retail commerce activity in our marketplace, increase awareness of and engagement with our brands, and to invest in initiatives that help increase repeat consumer visits to our websites.
Our global marketing team leverages multiple channels to increase the reach of our coupon marketplace. To drive more repeat visits and increase the volume of consumer purchases, our marketing team focuses on acquiring users through our websites, mobile applications, email newsletters and alerts and social media presence including Facebook Page and Twitter feeds. We also acquire traffic through search engine optimization and paid search by bidding on advertising placements for certain search keywords on leading Internet search engines that we deem relevant to our business. In addition, we operate the RetailMeNot Blogger Network, an exclusive network of bloggers in the U.S., which attracts users to our websites. In 2012, over 90% of traffic to our websites was generated from unpaid sources.
We also actively conduct media public relations campaigns to share insights on consumer shopping trends and to promote our editorial content and personnel to the consumer and trade media. RetailMeNot spokespersons are routinely featured in newspapers, magazines and in broadcast media, and are promoted to and are featured as expert commentators on major broadcast and cable news programs and talk radio. In 2012 in the U.S. alone, RetailMeNot and its affiliated websites were referenced in over 5,700 media exposures generating approximately 450 million impressions. Our spokespersons, websites and mobile applications were featured in over 1,600 television and radio segments, including The Today Show, CNBC Squawk Box, CNN and Bloomberg TV. RetailMeNot has also appeared in approximately 3,700 print (newspaper, magazine) and online media articles, including The New York Times, The Wall Street Journal, USA Today, Huffington Post and TechCrunch. We also invested in prize promotion integration opportunities within network television entertainment programming and consumer magazines, where RetailMeNot.com was featured on Wheel of Fortune, The Price is Right, The View (ABC), The Talk (CBS), Anderson Live and magazines including Shape, Parenting and SELF.
Our marketing department also interacts with our business analytics team, which supports a variety of functional groups to understand strategies and issues and provide information that support business decisions. The insights provided by our business analytics team is used to make informed, data-driven decisions regarding the optimization of our websites and existing products and services, as well as the development of new opportunities for our business. Our team utilizes a suite of web analytics tools including to help identify potential revenue opportunities, segment traffic to identify high-value web visitors, determine how visitors navigate within our website, and identify critical success metrics for online marketing.
Technology and Infrastructure
Product development and innovation are core pillars of our strategy. Our product team works to regularly deliver innovative products and features in an effort to provide the best possible consumer experience and deliver on our business strategy. The responsibilities of our product team span the lifecycle of identifying consumer needs, defining and designing products, testing, developing go-to-market strategies, and measuring the performance of new products and features. The team is focused on enhancing our core solutions, optimizing the user experience for consumers, and building better business results for our retailers. We provide our online and mobile solutions using a combination of in-house and third-party technology solutions and products.
99
Table of Contents
We have developed proprietary systems architecture for use in creating, maintaining and operating our websites. This technology consists of internal development by our staff of designers, developers and engineers and makes use of software acquired or licensed from outside developers and companies. Our systems are designed to serve consumers and our retailers’ operations teams in an automated and scalable fashion. While we use a variety of technologies, the majority of our software systems are written in PHP and Java by engineers employed or contracted by us. Our product development expenses were $0.7 million, $4.4 million, $14.5 million and $21.1 million in 2010, 2011, 2012 and the nine months ended September 30, 2013, respectively. Our software is broken into five major areas:
| • | public facing websites; |
| • | content quality management systems; |
| • | mobile; |
| • | data management and reporting; and |
| • | infrastructure tools. |
Our websites are hosted in the U.S., U.K., France, Germany and the Netherlands using a combination of third-party co-location hosting centers and cloud-based hosting services. Our systems architecture has been designed to manage increases in traffic on our websites through the addition of server and network hardware without making software changes. Our third-party data centers provide our websites and online tools with scalable and redundant Internet connectivity and redundant power and cooling to our hosting environments. We use security methods in an effort to ensure the integrity of our networks and to protect confidential data collected and stored on our servers. For example, we use firewall technology to protect access to our networks and to our servers and databases on which we store confidential data. We have developed and use internal policies and procedures to protect the personal information of our users. We test for unauthorized external access to the network daily using automated services and conduct periodic audits performed by outsourced security consultants.
Competition
The market to attract consumers seeking to save money on purchases online and in-store, and retailers and brands seeking to drive sales and acquire new customers is highly competitive, fragmented and rapidly changing with limited barriers to entry.
Our competition for traffic from consumers seeking to save money on online or in-store purchases includes digital coupon websites and mobile applications, cash back and loyalty websites, retailers, search engines, social networks, comparison shopping websites, newspapers and direct mail campaigns. We believe that our primary competition is from other digital coupon websites, including dealspl.us, bradsdeals, dealnews, savings.com, Tech Bargains and Coupon Cabin. In addition to such competitors, we are experiencing increasing competition from other large businesses that offer digital coupons similar to ours as an add-on to their core business. For example, Groupon and Living Social are now offering digital coupons, and Google and PayPal are now offering digital coupons for in-store purchases. While many of our actual and potential competitors enjoy substantial competitive advantages over us, such as superior name recognition, substantially greater financial, technical and other resources and longer history of competing in relevant geographies, we believe that we compete favorably based on our leadership position in digital coupons, our strong brand awareness, our broad selection and quality of digital coupons from leading retailers and brands, our trusted partnerships with retailers, our network effects and our large community of actively engaged users.
Retailers have a number of marketing options to choose from when deciding how to reach consumers. Our competition for retailer marketing spend includes digital coupon sites that offer a pay-for-performance model, search engines and social networks that compete for online advertising spend and television, magazines and newspapers that compete for offline advertising spend. We believe the principal factors that make us appealing in
100
Table of Contents
the competition for retailers’ marketing spend include our large and engaged audience of consumers, our multichannel engagement across online, mobile, social and in-store, our trusted marketplace that protects retailers’ brands, and our pay-for-performance model that provides retailers measurable ROI, reporting and analytics.
Intellectual Property
Our intellectual property includes the content of our websites, our registered domain names, our registered and unregistered trademarks and our patent applications. We believe that our intellectual property is an important asset of our business and that our RetailMeNot.com, Deal2Buy.com, VoucherCodes.co.uk, Web.Bons-de-Reduction.com, Poulpeo.com, Ma-Reduc.com, Actiepagina.nl, Deals.com, RetailMeNot.ca and other domain names and our technology infrastructure give us a competitive advantage in the digital coupon market. We rely on a combination of trademark, copyright and trade secret laws in the U.S. and Europe, as well as contractual provisions, to protect our proprietary technology and our brands. We currently have trademarks registered or pending in the U.S., Europe, Australia, Canada, South Korea, Singapore and China for our name and certain words and phrases that we use in our business. We also rely on copyright laws to protect software relating to our websites and our proprietary technologies, although we have not registered for copyright protection to date. We have registered numerous Internet domain names related to our business in order to protect our proprietary interests. As of September 30, 2013, we had 31 patent applications pending related to the use and operation of discount websites and related mobile applications as well as the provision and redemption of digital coupons, including one provisional patent application. We also enter into confidentiality agreements with our employees and consultants and seek to control access to and distribution of our proprietary information in a commercially prudent manner. In addition, we license third-party technologies that are incorporated into some elements of our solutions.
The efforts we have taken to protect our intellectual property rights may not be sufficient or effective, and, despite these precautions, it may be possible for other parties to copy or otherwise obtain and use the content of our websites without authorization. We may be unable to prevent competitors from acquiring domain names or trademarks that are similar to, infringe upon or diminish the value of our domain names, trademarks, service marks and our other proprietary rights. Failure to protect our proprietary rights adequately could significantly harm our competitive position and operating results.
Companies in the Internet and technology industries, and other patent and trademark holders seeking to profit from royalties in connection with grants of licenses, own large numbers of patents, copyrights, trademarks and trade secrets and frequently enter into litigation based on allegations of infringement or other violations of intellectual property rights. We have received in the past and may in the future receive notices that claim we have misappropriated or misused other parties’ intellectual property rights. There may be intellectual property rights held by others, including issued or pending patents and trademarks, that cover significant aspects of our technologies, content, branding or business methods. Any intellectual property claim against us, regardless of merit, could be time consuming and expensive to settle or litigate and could divert our management’s attention and other resources. These claims also could subject us to significant liability for damages and could result in our having to stop using technology, content, branding or business methods found to be in violation of another party’s rights. We might be required or may opt to seek a license for rights to intellectual property held by others, which may not be available on commercially reasonable terms, or at all. Even if a license is available, we could be required to pay significant royalties, which would increase our operating expenses. We may also be required to develop alternative non-infringing technology, content, branding or business methods, which could require significant effort and expense and which we may not be able to perform efficiently or at all. If we cannot license or develop technology, content, branding or business methods for any allegedly infringing aspect of our business, we may be unable to compete effectively.
101
Table of Contents
Legal and Regulatory
From time to time, we may become involved in litigation related to claims arising from the ordinary course of our business. We believe that there are no claims or actions pending or threatened against us, the ultimate disposition of which would have a material adverse effect on us.
There have been and continue to be regulatory developments that affect our business. For example, states in which we operate may implement regulations requiring retailers to collect and remit sales tax on sales made to the residents of that state if the retailer or performance marketing network which facilitated that sale is domiciled in that state. New York, Illinois and California have implemented regulations of this type and other states have proposed similar regulations. None of these sales tax requirements have had a material impact on our results of operations to date; however, if the state of Texas or any other state in which we operate were to pass a similar regulation and we were unable to relocate before its effectiveness, we believe a substantial number of our paid retailers would cease using our solutions or significantly alter the manner in which they pay us.
In addition, as Internet commerce continues to evolve, increasing regulation by U.S. and foreign governments and agencies becomes more likely. Increased regulation in the fields of data privacy, and laws and regulations applying to the solicitation, collection, processing or use of personal or consumer information could affect our ability to use and share data, potentially reducing demand for our solutions and restricting our ability to store, process and share data.
Employees
As of September 30, 2013, we had 414 employees. Of these employees, 285 were based in the U.S., 75 were based in the U.K., nine were based in Germany, 39 were based in France and six were based in the Netherlands. We consider our current relationship with our employees to be good. Other than our French employees, none of our employees is represented by a labor union or is a party to a collective bargaining agreement.
Culture
We believe that a critical component of our success has been our corporate culture, which we believe fosters innovation, encourages teamwork, cultivates creativity and promotes a focus on execution. We have nurtured this culture since our inception and maintained an environment designed to promote openness, honesty, responsibility, mutual respect and the pursuit of common goals. We believe our culture gives us a competitive advantage in recruiting talent in the highly competitive fields that are critical to our success.
Facilities
Our principal executive offices are located in Austin, Texas, where we lease approximately 55,515 square feet of office space under a lease that expires on July 31, 2020. The terms of the lease provide for the expansion of the space leased to a total of approximately 75,526 square feet by January 2014. We also lease office space in London, England; Paris, France; Vannes, France; Amsterdam, the Netherlands; and Berlin, Germany. Our primary data centers are located in Virginia and California. We believe our current and planned office facilities and data center space will be adequate for our needs for the foreseeable future.
102
Table of Contents
Executive Officers and Directors
The following table sets forth information regarding our executive officers and directors.
| Name |
Age | Position | ||
| G. Cotter Cunningham |
51 | Chief Executive Officer, President and Chairman of the Board | ||
| Kelli A. Beougher |
43 | Chief Operating Officer | ||
| Douglas C. Jeffries |
57 | Chief Financial Officer | ||
| Paul M. Rogers |
45 | Chief Technology Officer | ||
| Louis J. Agnese, III |
35 | General Counsel and Secretary | ||
| Jillian L. Balis |
42 | Senior Vice President, Marketing | ||
| Jagjit S. Bath |
36 | Senior Vice President, Product | ||
| Steven T. Pho |
36 | Senior Vice President, Corporate Development | ||
| C. Thomas Ball(1)(3) |
46 | Director | ||
| Jeffrey M. Crowe(2)(3) |
56 | Director | ||
| Karim B. Faris |
42 | Director | ||
| Jules A. Maltz(2)(3) |
34 | Director | ||
| Gokul Rajaram(1) |
39 | Director | ||
| Greg J. Santora(2) |
62 | Director | ||
| Brian H. Sharples(1) |
53 | Director |
| (1) | Member of Compensation Committee |
| (2) | Member of Audit Committee |
| (3) | Member of Nominating and Corporate Governance Committee |
Executive Officers
G. Cotter Cunningham is our Founder, President, Chief Executive Officer and Chairman of the Board, and has overseen our growth from inception. Previously, Mr. Cunningham served in various positions with Bankrate (RATE) from April 2000 through April 2007, most recently as Chief Operating Officer. During this time, Bankrate underwent its initial public offering. He also previously served as CEO-in-Residence at Austin Ventures, Vice President and General Manager of VML, Vice President of Block Financial Corporation and Assistant Vice President of H&R Block. He holds an M.B.A. from Vanderbilt University and a B.B.A. in business economics from the University of Memphis. Mr. Cunningham’s perspective as our Founder and Chief Executive Officer makes him a critical member of our board of directors.
Kelli A. Beougher has served with us since December 2009, and was promoted to Chief Operating Officer in May 2012. Prior to joining us, Ms. Beougher served in various positions at Rakuten LinkShare from December 2001 to May 2009, most recently as Senior Vice President of Services. Before that time, she served in various capacities at GE Capital. Ms. Beougher holds a B.B.A. in marketing from the University of Texas.
Douglas C. Jeffries has served as our Chief Financial Officer since December 2012. Prior to joining us, Mr. Jeffries served as Executive Vice President & Chief Financial Officer of Taleo (TLEO) from October 2010 to June 2012, where he helped guide the company through its acquisition by Oracle (ORCL). Previously, he worked as Chief Financial Officer at Palm (PALM) from December 2008 through the completion of the acquisition of Palm by Hewlett Packard (HPQ) in August 2010, Chief Financial Officer of Pacific Ethanol from June 2007 to July 2007 and Vice President of Finance and Chief Accounting Officer of eBay (EBAY) from October 2003 to June 2007. He holds an M.B.A. from the University of Southern California and a B.S. in accounting from California State University, Chico.
103
Table of Contents
Paul M. Rogers has served as our Chief Technology Officer since June 2011. Previously, he worked as Engineering Director with Google (GOOG) from February 2008 to May 2011. Prior to that time, he led the engineering team at Bazaarvoice (BV). He also held multiple development and technical management roles at Trilogy Software. Mr. Rogers holds a B.A. in psychology and managerial studies from Rice University.
Louis J. Agnese, III has served as our General Counsel since October 2011 and Secretary since December 2011. Previously, he worked as an attorney at DLA Piper from September 2007 through October 2011, where he represented a wide range of private and public companies in various transactions, including multiple initial public offerings. Prior to joining DLA Piper, Mr. Agnese was an attorney at Akin Gump Strauss Hauer & Feld from September 2003 to September 2007. Mr. Agnese holds a J.D. from the University of Texas and a B.B.A. in international business from the University of the Incarnate Word.
Jillian L. Balis has served as our Senior Vice President of Marketing since August 2011. Prior to joining us, Ms. Balis was Executive Vice President and Managing Director of SMG Search at Starcom MediaVest Group from February 2008 to August 2011, overseeing a team of 100 search marketing and social media experts. Previously, she served in various marketing leadership positions with Orbitz Worldwide (OWW) from August 2001 to January 2008. She holds an M.B.A. from Northwestern University’s Kellogg School of Management and a B.A. in political science from the University of Pennsylvania.
Jagjit S. Bath has served as our Senior Vice President of Product since March 2011. Previously, he held several executive positions with Gilt Groupe from February 2009 to March 2011, including Vice President of Product Management and Engineering, Acting Chief Information Officer and Vice President of Strategy and New Business. Prior to joining Gilt Groupe, Mr. Bath held various management positions at WeightWatchers.com (WTW) from November 2001 through February 2009 in product management, international expansion, marketing and global business development. He holds a B.S. in business information technology from Bournemouth University, England.
Steven T. Pho has served with us since April 2011 and was promoted to Senior Vice President of Corporate Development in October 2013. Prior to joining us, Mr. Pho was an investment banker at Thomas Weisel Partners (now Stifel Nicolaus Weisel) in San Francisco from November 2003 to March 2005 and from July 2007 to March 2011, where he served as Vice President of Internet and New Media investment banking. Prior to that, he was a member of the technology investment banking group at Houlihan Lokey Howard & Zukin in San Francisco from March 2000 to October 2003. He holds an M.B.A. from the University of Southern California and a B.S.B.A. in finance from the University of Denver.
Board of Directors
C. Thomas Ball has been a member of our board of directors since September 2007. Mr. Ball is a General Partner at Austin Ventures, a venture capital firm, which he joined as a Venture Partner in April 2005. From November 2001 to December 2004, Mr. Ball was Chief Executive Officer and co-founder of Openfield Technologies, a provider of e-commerce and business management software and technology solutions. Mr. Ball was also a founder of eCoupons.com, where he served as Chief Executive Officer from January 1999 through December 2000. Mr. Ball serves on a number of private company boards, including Social Gaming Network, Adometry and Boundless Network, and also served on the board of Convio from December 2006 through February 2011. Mr. Ball holds an M.B.A. from the Stanford Graduate School of Business and a B.S. in finance from the University of Florida. We have determined that Mr. Ball’s experience in the online coupon industry as founder of eCoupons.com, as well as his experience in both managing and evaluating companies as an officer, board member and investor makes him a valuable member of our board of directors, our compensation committee and our nominating and corporate governance committee.
Jeffrey M. Crowe has been a member of our board of directors since November 2010. Mr. Crowe was CEO-in-residence with Norwest Venture Partners from January 2002 to December 2003, joined the firm as a Venture
104
Table of Contents
Partner in January 2004, became a General Partner in January 2005 and became Managing Partner of the firm in January 2013. He focuses on investments in the software, internet and consumer arenas. Mr. Crowe currently serves on the boards of AdChina, Badgeville, deCarta, Echo Nest, InfoArmy, Lending Club, Nano-Tex, Extole, SocialVibe and Turn. He previously served on the boards of Admeld, Jigsaw and Tuvox. From December 1999 to April 2001, Mr. Crowe served as President, Chief Operating Officer and Director of DoveBid, a privately held business auction firm. From May 1990 to November 1999, Mr. Crowe served as Chief Executive Officer of Edify Corporation (EDFY), a publicly traded enterprise software company. Mr. Crowe holds an M.B.A. from Stanford Graduate School of Business and a B.A. in history from Dartmouth College. We have determined that the breadth and depth of Mr. Crowe’s operational background and experience as an investor, director and officer in a number of technology companies make him an effective member of our board of directors, our audit committee and our nominating and corporate governance committee.
Karim B. Faris has served as a member of our board of directors since May 2012. Mr. Faris is a General Partner with Google Ventures. Before joining Google Ventures in April 2010, Mr. Faris served as a member of the corporate development team of Google (GOOG) from September 2008 to April 2010. Prior to Google, Mr. Faris was a venture capitalist at Atlas Venture from July 2002 to January 2007, where he worked on investments in software and internet infrastructure. Mr. Faris currently serves on the boards of CliQr Technologies, Duo Security, Egnyte and Rumble Entertainment. Mr. Faris holds an M.B.A. from Harvard Business School, an M.S. in electrical engineering from the University of Michigan and a B.S. in computer engineering from Brown University. We believe that Mr. Faris’ diverse experience with technology companies makes him a valuable member of our board of directors.
Gokul Rajaram has served as a member of our board of directors since October 2013. Mr. Rajaram is the Product Engineering Lead at Square, the commerce company based in San Francisco, CA. Before joining Square in July 2013, Mr. Rajaram was Product Director, Ads at Facebook (FB) from September 2010 to June 2013. Mr. Rajaram was Co-Founder and Chief Executive Officer of Chai Labs, a semantic technology startup, from December 2007 until its acquisition by Facebook in September 2010. Prior to Facebook, Mr. Rajaram served as Product Management Director for Google AdSense (GOOG) from January 2003 to November 2007. Mr. Rajaram holds an M.B.A. from the Massachusetts Institute of Technology Sloan School of Management, a M.S. in computer science from the University of Texas and a B. Tech in computer science from the Indian Institute of Technology Kanpur. We have determined that Mr. Rajaram’s knowledge and experience with product development and innovation at Internet and technology companies makes him a valuable member of our board of directors and compensation committee.
Jules A. Maltz has served as a member of our board of directors since October 2011. Mr. Maltz is a General Partner at Institutional Venture Partners, which he joined in August 2008, and focuses on investments in rapidly growing Internet and software companies. In addition to his service on our board of directors, Mr. Maltz serves on the board of directors of Yext and previously served on the board of directors of Buddy Media and H5. He is actively involved in a number of other portfolio companies of Institutional Venture Partners. Mr. Maltz received an M.B.A. from Stanford University and a B.A. in economics from Yale University. We have determined that Mr. Maltz’s knowledge and experience with growth-stage Internet and software companies, as well as his financial expertise, makes him an integral member of our board of directors, our nominating and corporate governance committee and our audit committee.
Greg J. Santora has served as a member of our board of directors since May 2013. Mr. Santora has worked as an independent management consultant since September 2005. Prior to that time, he served as Chief Financial Officer of Shopping.com, a provider of internet-based comparison shopping resources, from December 2003 through September 2005. From January 1997 through December 2002, he served as Chief Financial Officer of Intuit. Mr. Santora currently serves on the board of directors of Align Technology (ALGN) and Savo Group. He previously served on the board of directors of Taleo Corporation (TLEO) and Digital Insight Corporation (DGIN). He holds an M.B.A. from San Jose State University and a B.A. in accounting from the University of Illinois. We have determined that Mr. Santora’s experience as a financial leader, his financial reporting and audit
105
Table of Contents
expertise and his current service on public and private company boards allows him to bring valuable insight to our board of directors and our audit committee.
Brian H. Sharples has served as a member of our board of directors since July 2011. Mr. Sharples is one of the co-founders of HomeAway (AWAY) and has served as its President, Chief Executive Officer and board member since its inception in April 2004. Prior to co-founding HomeAway, Mr. Sharples was an angel investor from 2001 until 2004 and also served as Chief Executive Officer of Elysium Partners from 2002 until 2003. Mr. Sharples served as President and Chief Executive Officer of IntelliQuest Information Group, a supplier of marketing data and research to Fortune 500 technology companies, from 1996 to 2001, as President from 1991 to 1996, and as Senior Vice President from 1989 to 1991. Prior to IntelliQuest, Mr. Sharples was Chief Executive Officer of Practical Productions, an event-based automotive distribution business, from 1988 to 1989 and a consultant with Bain & Co. from 1986 to 1988. Mr. Sharples has served on the board of directors of Kayak Software (KYAK), an online travel resource aggregator, since December 2011. He received an M.B.A. from the Stanford Graduate School of Business and a B.S. in math and economics from Colby College. We have determined that Mr. Sharples’ current and previous tenures in executive positions at various public and private technology companies and his experience with online aggregation service companies allow him to bring valuable insight to our board of directors and our compensation committee.
Our executive officers are elected by, and serve at the discretion of, our board of directors. There are no family relationships among any of our directors or executive officers.
In addition to the information presented above regarding each director’s specific experience, qualifications, attributes and skills, we also believe that all of our directors have demonstrated business acumen, ethical integrity and an ability to exercise sound judgment, as well as a commitment of service to us and our board of directors.
Board Composition and Structure
Our board of directors currently consists of eight members.
In accordance with our amended and restated certificate of incorporation and our amended and restated bylaws our board of directors is divided into three classes with staggered three-year terms. At each annual meeting of stockholders, the successors to directors whose terms then expire will be elected to serve from the time of election and qualification until the third annual meeting following election. The authorized number of directors may be changed by resolution of the board of directors. Vacancies on our board of directors can be filled by a majority vote of the board of directors.
The division of our board of directors into three classes with staggered three-year terms may delay or prevent a change of our management or a change of control. Messrs. Ball, Crowe and Faris are the Class I directors, and their terms will expire in 2014. Messrs. Maltz and Sharples are the Class II directors, and their terms will expire in 2015. Messrs. Cunningham, Rajaram and Santora are the Class III directors, and their terms will expire in 2016.
Director Independence
In March, May and October 2013, our board of directors undertook a review of the independence of the directors and considered whether any director has a material relationship with us that could compromise his or her ability to exercise independent judgment in carrying out his or her responsibilities. As a result of these reviews, our board of directors determined that Messrs. Ball, Crowe, Maltz, Rajaram, Santora and Sharples are “independent directors” as defined under the rules of the NASDAQ Global Select Market and SEC rules and regulations.
106
Table of Contents
Risk Management
Our risk management function is overseen by our board of directors. Through our management reports, our internal risk management committee and company policies, such as our corporate governance guidelines, our code of business conduct and ethics and our audit committee’s and compensation committee’s review of financial and other risks, we keep our board of directors apprised of material risks and provide our directors access to all information necessary for them to understand and evaluate how these risks interrelate, how they affect us and how our management addresses those risks. Mr. Cunningham, as our Chief Executive Officer, works with our independent directors and with management when material risks are identified by the board of directors or management to address such risk. If the identified risk poses an actual or potential conflict with management, our independent directors conduct an assessment by themselves.
Committees of Our Board of Directors
Our board of directors has an audit committee, a compensation committee and a nominating and corporate governance committee, which have the composition and responsibilities described below.
Audit Committee
Our audit committee is responsible for, among other things:
| • | appointing, compensating, retaining and overseeing our independent auditors; |
| • | approving the audit and non-audit services to be performed by our independent auditors; |
| • | reviewing, with our independent auditors, all critical accounting policies and procedures; |
| • | reviewing with management the adequacy and effectiveness of our internal control structure and procedures for financial reports; |
| • | reviewing and discussing with management and the independent auditor our annual audited financial statements and any certification, report, opinion or review rendered by the independent auditor; |
| • | reviewing and investigating conduct alleged to be in violation of our code of conduct; |
| • | preparing the audit committee report required in our annual proxy statement; and |
| • | reviewing and evaluating, at least annually, its own performance and the adequacy of the committee charter. |
Our audit committee is composed of Messrs. Crowe, Maltz and Santora. Mr. Santora serves as the chairperson of our audit committee. Our board of directors has determined that each of Mr. Maltz and Mr. Santora is independent under the applicable requirements of the NASDAQ Global Select Market and SEC rules and regulations. Our board of directors has determined that each of Messrs. Crowe, Maltz and Santora meet the requirements for financial literacy and sophistication under the applicable requirements of the NASDAQ Global Select Market and SEC rules and regulations, and that Mr. Santora qualifies as an “audit committee financial expert,” under the applicable requirements of the NASDAQ Global Select Market and SEC rules and regulations. The composition of our audit committee complies with all applicable requirements of the SEC and the listing requirements of the NASDAQ Global Select Market and a majority of our audit committee members are independent directors, and after the phase in period under the applicable requirements of the SEC and the listing requirements of the NASDAQ Global Select Market, upon which we rely, all members of our audit committee will be independent directors.
Our board of directors has adopted an audit committee charter. We believe that the composition of our audit committee, and our audit committee’s charter and functioning, complies with the applicable requirements of the NASDAQ Global Select Market and SEC rules and regulations. We intend to comply with future requirements to the extent they become applicable to us.
107
Table of Contents
Compensation Committee
Our compensation committee is responsible for, among other things:
| • | reviewing and approving corporate goals and objectives relevant to compensation of our Chief Executive Officer and other executive officers; |
| • | reviewing and approving the following for our Chief Executive Officer and our other executive officers: salaries, bonuses, incentive compensation, equity awards benefits and perquisites; |
| • | recommending the establishment and terms of our incentive compensation plans and equity compensation plans, and administering such plans; |
| • | recommending compensation programs for directors; |
| • | preparing disclosures regarding executive compensation and any related reports required by the rules of the SEC; |
| • | making and approving grants of options and other equity awards to all executive officers, directors and all other eligible individuals; and |
| • | reviewing and evaluating, at least annually, its own performance and the adequacy of the committee charter. |
Our compensation committee is currently composed of Messrs. Ball, Rajaram and Sharples, each of whom is a non-employee member of our board of directors. Mr. Ball has been appointed to serve as the chairperson of our compensation committee. In March and October 2013, our board of directors determined that each member of our compensation committee is independent under the applicable requirements of the NASDAQ Global Select Market and SEC rules and regulations, is a non-employee director, as defined by Rule 16b-3 promulgated under the Exchange Act, and is an outside director, as defined pursuant to Section 162(m) of the Internal Revenue Code.
Our board of directors has adopted a compensation committee charter. We believe that the composition of our compensation committee, and our compensation committee’s charter and functioning, complies with the applicable requirements of the NASDAQ Global Select Market and SEC rules and regulations. We intend to comply with future requirements to the extent they become applicable to us.
Nominating and Corporate Governance Committee
Our nominating and corporate governance committee is responsible for, among other things:
| • | assisting our board of directors in identifying qualified director nominees and recommending nominees for each annual meeting of stockholders; |
| • | developing, recommending and reviewing corporate governance principles and a code of conduct applicable to us; |
| • | assisting the board in its evaluation of the performance of our board of directors and each committee thereof; |
| • | recommending corporate governance principles and a code of conduct; and |
| • | reviewing and evaluating, at least annually, its own performance and the adequacy of the committee charter. |
Our nominating and corporate governance committee is composed of Messrs. Ball, Crowe and Maltz. Mr. Maltz serves as the chairperson of our nominating and corporate governance committee. In March 2013, our board of directors determined that each of these individuals is independent under the applicable requirements of the NASDAQ Global Select Market and SEC rules and regulations.
108
Table of Contents
Our board of directors has adopted a nominating and corporate governance committee charter. We believe that the composition of our nominating and corporate governance committee, and our nominating and corporate governance committee’s charter and functioning, complies with the applicable requirements of the NASDAQ Global Select Market and SEC rules and regulations. We intend to comply with future requirements to the extent they become applicable to us.
The full text of our audit committee, compensation committee and nominating and corporate governance committee charters are posted on the investor relations portion of our website at http://www.retailmenot.com. We do not incorporate the information contained on, or accessible through, our corporate website into this prospectus, and you should not consider it part of this prospectus.
Code of Business Conduct and Ethics
Our board of directors has adopted a code of business conduct and ethics. The code applies to all of our employees, officers (including our principal executive officer, principal financial officer, principal accounting officer or controller, or persons performing similar functions), directors and consultants. The full text of our code of conduct is posted on the investor relations portion of our website at http://www.retailmenot.com. We do not incorporate the information contained on, or accessible through, our corporate website into this prospectus, and you should not consider it part of this prospectus.
Director Compensation
In the last completed fiscal year, no director received cash compensation for his or her services as a director or as a member of a committee. Prior to the implementation of our director compensation policy described below, we granted an option to each of Brian H. Sharples and Greg J. Santora. Since the completion of our initial public offering, our non-employee directors are entitled to receive a $30,000 annual retainer fee. The audit committee chairperson receives an annual fee of $20,000 and members of the audit committee receive an annual fee of $10,000. The compensation committee chairperson receives an annual fee of $10,000 and members of the compensation committee receive an annual fee of $5,000. The nominating and corporate governance committee chairperson receives an annual fee of $7,500 and the members of the nominating and corporate governance committee receive an annual fee of $3,500. Non-employee directors generally receive an initial (i) option grant entitling the director to purchase that number of shares of our Series 1 common stock equal to $150,000 divided by the then current Black-Scholes-Merton value of our Series 1 common stock and (ii) restricted stock unit grant entitling the director to receive that number of shares of our Series 1 common stock equal to $150,000 divided by the then current share price of our Series 1 common stock. These grants vest on the first anniversary of the grant, provided that the non-employee director continues to serve as a director through such vesting date. In addition, in subsequent years, non-employee directors receive an annual (i) option grant entitling each director to purchase that number of shares of our Series 1 common stock equal to $60,000 divided by the then current Black-Scholes-Merton value of our Series 1 common stock and (ii) restricted stock unit grant entitling the director to receive that number of shares of our Series 1 common stock equal to $60,000 divided by the then current share price of our Series 1 common stock. These grants vest on the first anniversary of the grant, provided that the non-employee director continues to serve as a director through such vesting date.
Compensation Committee Interlocks and Insider Participation
None of the members of our compensation committee is an officer or employee of our company. None of our executive officers currently serves, or in the past year has served, as a member of the board of directors or compensation committee of any entity that has one or more executive officers serving on our board of directors or compensation committee.
109
Table of Contents
2012 Summary Compensation Table
The following table presents compensation information for fiscal 2012 paid to or accrued for our principal executive officer and our two other most highly compensated persons serving as executive officers as of December 31, 2012. We refer to these executive officers as our “named executive officers.”
| Name and Principal Position |
Salary(1) | Option Awards(2) |
Non-Equity Incentive Plan Compensation(3) |
All Other Compensation(4) |
Total | |||||||||||||||
| G. Cotter Cunningham |
$ | 279,168 | $ | 432,525 | $ | 261,000 | $ | 16,616 | $ | 989,309 | ||||||||||
| President and Chief Executive Officer |
||||||||||||||||||||
| Kelli A. Beougher |
239,063 | 221,250 | 125,606 | 13,665 | 599,584 | |||||||||||||||
| Chief Operating Officer |
||||||||||||||||||||
| Douglas C. Jeffries |
1,308 | 4,464,326 | — | — | 4,465,634 | |||||||||||||||
| Chief Financial Officer |
||||||||||||||||||||
| (1) | Mr. Jeffries was hired December 31, 2012. His annual salary as of December 31, 2012 was $340,000. |
| (2) | Amounts represent the aggregate grant date fair value of stock options granted during the year computed in accordance with FASB ASC Topic 718. Assumptions used in calculating these are described in Note 10 to our consolidated financial statements included elsewhere in this prospectus. |
| (3) | Includes amounts earned under our 2012 Bonus Plan for Officers, or the 2012 Bonus Plan. Payments due under the 2012 Bonus Plan were made in February 2013. These payments were calculated in accordance with the provisions of the 2012 Bonus Plan, which provided for the amounts earned to be based wholly upon consolidated gross profit performance, as defined in the 2012 Bonus Plan, compared to the annual budget approved by our board of directors at the beginning of the year. The Bonus Plan contained a component for achieving the budgeted gross profit as well as an overachievement component for exceeding the budgeted gross profit. The payments included an overachievement amount based on the actual gross profit having exceeded the budgeted gross profit. |
| (4) | Consists of premiums paid for medical, dental, short-term disability, long term disability, life and accidental death and dismemberment insurance, Health Savings Account contributions, 401(k) contributions and additional taxable awards. |
Outstanding Equity Awards at December 31, 2012
The following table sets forth information regarding outstanding option awards held by our named executive officers at December 31, 2012.
| Option Awards | ||||||||||||||||
| Name |
Number of Securities Underlying Unexercised Options Exercisable(1) |
Number of Securities Underlying Unexercised Options Unexercisable(1) |
Option Exercise Price |
Option Expiration Date |
||||||||||||
| G. Cotter Cunningham |
268,348 | (2) | — | $ | 2.08 | 7/1/2021 | ||||||||||
| 144,230 | (2) | — | 2.08 | 7/1/2021 | ||||||||||||
| 140,847 | (3) | — | 2.08 | 8/23/2021 | ||||||||||||
| 62,500 | (4) | — | 10.36 | 6/12/2022 | ||||||||||||
| Kelli A. Beougher |
87,500 | (5) | — | 1.12 | 6/25/2020 | |||||||||||
| 17,500 | (6) | — | 2.08 | 6/8/2021 | ||||||||||||
| 20,000 | (7) | — | 5.32 | 10/19/2021 | ||||||||||||
| 15,174 | (8) | 22,326 | 10.36 | 5/31/2022 | ||||||||||||
| Douglas C. Jeffries |
350,966 | (9) | — | 14.64 | 12/31/2022 | |||||||||||
| 13,660 | (10) | 20,490 | 14.64 | 12/31/2022 | ||||||||||||
110
Table of Contents
| (1) | Shares of Series 1 common stock. |
| (2) | This option grant is fully exercisable, and vests as to 1/48 of the total option grant monthly, beginning August 1, 2011. |
| (3) | This option grant is fully exercisable, and vests as to 1/48 of the total option grant monthly, beginning October 1, 2011. |
| (4) | This option grant is fully exercisable, and vests as to 1/48 of the total option grant monthly, beginning July 12, 2012. |
| (5) | This option grant is fully exercisable, and vests as to 1/4 of the total option grant on December 1, 2010, and thereafter as to 1/48 of the total option grant monthly. |
| (6) | This option grant is fully exercisable, and vests as to 1/4 of the total option grant on April 1, 2012, and thereafter as to 1/48 of the total option grant monthly. |
| (7) | This option grant is fully exercisable, and vests as to 1/4 of the total option grant on October 1, 2012, and thereafter as to 1/48 of the total option grant monthly. |
| (8) | This option grant vests as to 1/48 of the total option grant monthly, beginning May 31, 2012. The option grant becomes exercisable for 9,652 shares of Series 1 common stock on each of January 1, 2013, January 1, 2014 and January 1, 2015, and becomes exercisable for the remaining 3,022 shares of Series 1 common stock on January 1, 2016. |
| (9) | This option grant is fully exercisable, and vests as to 1/4 of the total option grant on December 31, 2013, and thereafter as to 1/48 of the total option grant monthly. |
| (10) | This option grant vests as to 1/4 of the total option grant on December 31, 2013, and thereafter as to 1/48 of the total option grant monthly. The option grant becomes exercisable for 6,830 shares of Series 1 common stock on each of January 1, 2014, January 1, 2015 and January 1, 2016. |
Agreements with Named Executive Officers
Each of our named executive officers is subject to certain obligations relating to non-competition, non-solicitation, proprietary information and assignment of inventions. Pursuant to these obligations, each named executive officer has agreed (i) not to solicit our employees or customers during employment and for a period of 12 months (24 months with respect to customers) after the termination of employment, (ii) not to compete with us or assist any other person to compete with us during employment and a period of 12 months after the termination of employment and (iii) to protect our confidential and proprietary information and to assign to us intellectual property developed during the course of employment.
Employment Agreements
The following is a summary of the employment agreements with our named executive officers as currently in effect.
G. Cotter Cunningham is party to an employment agreement with us effective March 1, 2013. This employment agreement has no specific term and constitutes at-will employment. Mr. Cunningham’s current annual base salary is $400,000. Mr. Cunningham is also eligible to receive benefits that are substantially similar to those of our other employees. His employment agreement sets forth his target bonus, which is set at 100% of Mr. Cunningham’s then current base salary. Payment of any bonus to Mr. Cunningham is subject to approval by our board of directors.
Pursuant to this agreement, in the event Mr. Cunningham is terminated for any reason (other than for cause (as such term is defined in the 2007 Stock Plan), as a result of his death or disability or of his own volition and not for good reason) or resigns of his own volition for good reason (as such term is defined in his employment agreement), (i) we will be obligated to pay him 100% of his then current monthly base salary for 12 months, (ii) we will be obligated to pay him 12 months of monthly premiums for his then current health benefits in a single lump sum and (iii) 100% of his then unvested options will become vested in full. In the event Mr. Cunningham voluntarily terminates his employment with us for good reason or is terminated without cause,
111
Table of Contents
either within 60 days prior to or within 12 months following a change in control, we will be obligated to pay him (i) 100% of his then current monthly base salary for 12 months and 100% of his then current bonus, and (ii) 12 months of monthly premiums for his then current health benefits in a single lump sum. Each of the severance benefits described above is contingent on Mr. Cunningham (i) executing a mutual release of claims and (ii) continuing to protect our confidential and proprietary information. In addition, in the event of a change in control in which Mr. Cunningham’s employment is not terminated, 50% of Mr. Cunningham then unvested options will become vested in full, so long as Mr. Cunningham continues his employment with us through the date of such change in control.
Kelli A. Beougher is party to an employment agreement with us effective March 1, 2013. This employment agreement has no specific term and constitutes at-will employment. Ms. Beougher’s current annual base salary is $320,000. Ms. Beougher is also eligible to receive benefits that are substantially similar to those of our other employees. Her employment agreement sets forth her target bonus, which is set at 55% of Ms. Beougher’s then current base salary. Payment of any bonus to Ms. Beougher is subject to approval by our board of directors.
Pursuant to this agreement, in the event Ms. Beougher is terminated for any reason (other than for cause (as such term is defined in the 2007 Stock Plan), as a result of her death or disability or of her own volition and not for good reason), we will be obligated to pay her (i) 100% of her then current monthly base salary for six months and (ii) six months of monthly premiums for her then current health benefits in a single lump sum. In the event Ms. Beougher voluntarily terminates her employment with us for good reason (as specifically defined in her employment agreement), or is terminated without cause, either within 60 days prior to or within 12 months following a change in control, (i) we will be obligated to pay her 100% of her then current monthly base salary for 12 months and 100% of her then current bonus, (ii) we will be obligated to pay her 12 months of monthly premiums for her then current health benefits in a single lump sum and (iii) 100% of her then unvested options will become vested in full. Each of the severance benefits described above is contingent on Ms. Beougher (i) executing a mutual release of claims and (ii) continuing to protect our confidential and proprietary information. In addition, in the event of a change in control in which Ms. Beougher’s employment is not terminated, 25% of Ms. Beougher’s then unvested options will become vested in full, so long as Ms. Beougher continues her employment with us through the date of such change in control.
Douglas C. Jeffries is party to an employment agreement with us effective March 1, 2013. This employment agreement has no specific term and constitutes at-will employment. Mr. Jeffries’ current annual base salary is $340,000. Mr. Jeffries is also eligible to receive benefits that are substantially similar to those of our other employees. His employment agreement sets forth his target bonus, which is set at 60% of Mr. Jeffries’ then current base salary. Payment of any bonus to Mr. Jeffries is subject to approval of our board of directors.
Pursuant to this agreement, in the event Mr. Jeffries is terminated for any reason (other than for cause (as such term is defined in the 2007 Stock Plan), as a result of his death or disability or of his own volition and not for good reason), we will be obligated to pay him (i) 100% of his then current monthly base salary for six months and (ii) six months of monthly premiums for his then current health benefits in a single lump sum. In the event Mr. Jeffries voluntarily terminates his employment with us for good reason (as specifically defined in his employment agreement), or is terminated without cause, either within 60 days prior to or within 12 months following a change in control, (i) we will be obligated to pay him 100% of his then current monthly base salary for 12 months and 100% of his then current bonus, (ii) we will be obligated to pay him 12 months of monthly premiums for his then current health benefits in a single lump sum and (iii) 100% of his then unvested options will become vested in full. Each of the severance benefits described above is contingent on Mr. Jeffries (i) executing a mutual release of claims and (ii) continuing to protect our confidential and proprietary information. In addition, in the event of a change in control in which Mr. Jeffries’ employment is not terminated, 50% of Mr. Jeffries then unvested options will become vested in full, so long as Mr. Jeffries continues his employment with us through the date of such change in control.
112
Table of Contents
Limitations of Liability; Indemnification of Directors and Officers
Section 145 of the Delaware General Corporation Law authorizes a corporation’s board of directors to grant, and authorizes a court to award, indemnity to officers, directors and other corporate agents. As permitted by Delaware law, our amended and restated certificate of incorporation provides that, to the fullest extent permitted by Delaware law, no director will be personally liable to us or our stockholders for monetary damages for breach of fiduciary duty as a director. Pursuant to Delaware law such protection would be not available for liability:
| • | for any breach of a duty of loyalty to us or our stockholders; |
| • | for acts or omissions not in good faith or that involve intentional misconduct or a knowing violation of law; |
| • | for any transaction from which the director derived an improper benefit; or |
| • | for an act or omission for which the liability of a director is expressly provided by an applicable statute, including unlawful payments of dividends or unlawful stock repurchases or redemptions as provided in Section 174 of the Delaware General Corporation Law. |
Our amended and restated certificate of incorporation also provides that if Delaware law is amended after the approval by our stockholders of the amended and restated certificate of incorporation to authorize corporate action further eliminating or limiting the personal liability of directors, then the liability of our directors will be eliminated or limited to the fullest extent permitted by Delaware law.
Our amended and restated certificate of incorporation and amended and restated bylaws further provide that we must indemnify our directors and officers to the fullest extent permitted by Delaware law. Our amended and restated bylaws also authorize us to indemnify any of our employees or agents and authorize us to secure insurance on behalf of any officer, director, employee or agent for any liability arising out of his or her action in that capacity, whether or not Delaware law would otherwise permit indemnification.
In addition, our amended and restated bylaws provide that we are required to advance expenses to our directors and officers as incurred in connection with legal proceedings against them for which they may be indemnified and that the rights conferred in the amended and restated bylaws are not exclusive.
The limitation of liability and indemnification provisions in our amended and restated certificate of incorporation and bylaws may discourage stockholders from bringing a lawsuit against our directors and officers for breach of their fiduciary duty. They may also reduce the likelihood of derivative litigation against our directors and officers, even though an action, if successful, might benefit us and other stockholders. Further, a stockholder’s investment may be adversely affected to the extent that we pay the costs of settlement and damage awards against directors and officers as required by these indemnification provisions.
At present, there is no pending litigation or proceeding involving any of our directors, officers or employees for which indemnification is sought, and we are not aware of any threatened litigation that may result in material claims for indemnification. We believe that our indemnity agreements and our amended and restated certificate of incorporation and bylaw provisions are necessary to attract and retain qualified persons as directors and executive officers.
Indemnity Agreements
We have entered into indemnity agreements with each of our directors and executive officers. These agreements, among other things, require us to indemnify each director and officer to the fullest extent permitted by Delaware law and our amended and restated certificate of incorporation and bylaws for expenses such as, among other things, attorneys’ fees, judgments, fines and settlement amounts incurred by the director or executive officer in any action or proceeding, including any action by or in our right, arising out of the person’s services as our director or executive officer or as the director or executive officer of any subsidiary of ours or any other company or enterprise to which the person provides services at our request. We also maintain directors’ and officers’ liability insurance.
113
Table of Contents
Benefit Plans
2007 Stock Plan
Our 2007 Stock Plan, as amended, was adopted by our board of directors and approved by our stockholders on September 19, 2007. Our 2007 Stock Plan provides for the grant of incentive stock options, nonstatutory stock options and stock purchase rights to our employees, directors and consultants who provide services to us. As of September 30, 2013, options to purchase 5,439,551 shares of Series 1 common stock were outstanding and no shares of Series 1 common stock were reserved for future grant under this plan. No awards have been granted under the 2007 Stock Plan other than incentive stock options and nonqualified stock options.
Subsequent to our initial public offering, we have not granted any additional awards under our 2007 Stock Plan. Instead, we now grant equity awards under our 2013 Equity Incentive Plan. However, our 2007 Stock Plan will continue to govern the terms and conditions of all outstanding equity awards granted under the 2007 Stock Plan.
The standard form of option agreement under the 2007 Stock Plan provides that options will vest 25% on the first anniversary of the vesting commencement date with the remainder vesting ratably over the next 36 months, subject to continued service through each applicable date. Under our 2007 Stock Plan, our board of directors, or its designated committee, has the authority to grant options with early exercise rights and to provide for accelerated vesting. In the event of a change in control, if the options are (i) not assumed or continued by the successor corporation, (ii) not exercised by the holder prior to the transaction or (iii) not cashed out at the time of the transaction, then the options will terminate effective as of the time of the change in control.
Our 2007 Stock Plan provides that our board of directors, or its designated committee, may equitably and proportionally adjust or substitute outstanding options upon certain events, including, without limitation, changes in our capitalization through stock splits, recapitalizations, mergers or consolidations. The standard form of option agreement under our 2007 Stock Plan provides that the participants will not offer, sell, contract to sell, pledge, hypothecate, grant any option to purchase or make any short sale of, or otherwise dispose of any shares of our stock or any rights to acquire our stock for 180 days following our initial public offering
2013 Equity Incentive Plan
Our 2013 Equity Incentive Plan was approved by our board of directors and our stockholders in July 2013. It is intended to make available incentives that will assist us to attract, retain and motivate employees (including officers), consultants and directors. We have thus far provided these incentives through the grant of stock options and restricted stock units, and may in the future provide these incentives through the grant of stock appreciation rights, restricted stock, restricted stock units, performance shares and units and other cash-based or stock-based awards.
As of September 30, 2013, options to purchase 115,948 shares of Series 1 common stock were outstanding and 4,089,786 shares of Series 1 common stock were reserved for future grant under the 2013 Equity Incentive Plan. This reserve will automatically increase on January 1, 2014 and each subsequent anniversary through 2023, by an amount equal to the smaller of (a) 4% of the number of shares of combined Series 1 and Series 2 common stock issued and outstanding on the immediately preceding December 31, or (b) an amount determined by the board. This reserve will be increased to include any shares remaining available under our 2007 Stock Plan at the time of its termination or issuable upon exercise of options granted under our 2007 Stock Plan that expire or terminate without having been exercised in full.
Appropriate adjustments will be made in the number of authorized shares and other numerical limits in the 2013 Equity Incentive Plan and in outstanding awards to prevent dilution or enlargement of participants’ rights in the event of a stock split or other change in our capital structure. Shares subject to awards which expire or are cancelled or forfeited will again become available for issuance under the 2013 Equity Incentive Plan. The shares available will not be reduced by awards settled in cash or by shares withheld to satisfy tax withholding
114
Table of Contents
obligations; the net number of shares issued upon the exercise of stock appreciation rights or options exercised by means of a net exercise or by tender of previously owned shares will be deducted from the shares available under the 2013 Equity Incentive Plan.
The 2013 Equity Incentive Plan is generally administered by the compensation committee of our board of directors. Subject to the provisions of the 2013 Equity Incentive Plan, the compensation committee determines in its discretion the persons to whom and the times at which awards are granted, the sizes of such awards and all of their terms and conditions. The compensation committee has the authority to construe and interpret the terms of the 2013 Equity Incentive Plan and awards granted under it. The 2013 Equity Incentive Plan provides, subject to certain limitations, for indemnification by us of any director, officer or employee against all judgments, amounts paid in settlement, and reasonable expenses, including attorneys’ fees, incurred in connection with any legal action arising from such person’s action or failure to act in administering the 2013 Equity Incentive Plan.
The 2013 Equity Incentive Plan authorizes the compensation committee, without further stockholder approval, to provide for the cancellation of stock options or stock appreciation rights with exercise prices in excess of the fair market value of the underlying shares of Series 1 common stock in exchange for new options or other equity awards with exercise prices equal to the fair market value of the underlying Series 1 common stock or a cash payment.
Awards may be granted under the 2013 Equity Incentive Plan to our employees, (including officers), directors or consultants or those of any present or future parent or subsidiary corporation or other affiliated entity. Each award is evidenced by a written agreement between us and the holder of the award and may include any of the following:
| • | Stock options. We may grant nonstatutory stock options or incentive stock options (as described in Section 422 of the Internal Revenue Code), each of which gives its holder the right, during a specified term (not exceeding 10 years) and subject to any specified vesting or other conditions, to purchase a number of shares of our Series 1 common stock at an exercise price per share determined by the administrator, which may not be less than the fair market value of a share of our Series 1 common stock on the date of grant. |
| • | Stock appreciation rights. A stock appreciation right gives its holder the right, during a specified term (not exceeding 10 years) and subject to any specified vesting or other conditions, to receive the appreciation in the fair market value of our Series 1 common stock between the date of grant of the award and the date of its exercise. We may pay the appreciation in shares of our Series 1 common stock or in cash, except that a stock appreciation right granted in tandem with a related option is payable only in stock. |
| • | Restricted stock. The administrator may grant restricted stock awards either as a bonus or as a purchase right at such price as the administrator determines. Shares of restricted stock remain subject to forfeiture until vested, based on such terms and conditions as the administrator specifies. Holders of restricted stock will have the right to vote the shares and to receive any dividends paid, except that the dividends may be subject to the same vesting conditions as the related shares. |
| • | Restricted stock units. Restricted stock units represent rights to receive shares of our Series 1 common stock (or their value in cash) at a future date without payment of a purchase price (unless required under applicable state corporate laws), subject to vesting or other conditions specified by the administrator. Holders of restricted stock units have no voting rights or rights to receive cash dividends unless and until shares of Series 1 common stock are issued in settlement of such awards. However, the administrator may grant restricted stock units that entitle their holders to dividend equivalent rights. |
| • | Performance shares and performance units. Performance shares and performance units are awards that will result in a payment to their holder only if specified performance goals are achieved during a specified performance period. The administrator establishes the applicable performance goals based on one or more measures of business performance enumerated in the 2013 Equity Incentive Plan, such as |
115
Table of Contents
| net revenues, gross margin, net income or total stockholder return. To the extent earned, performance share and unit awards may be settled in cash or in shares of our Series 1 common stock. Holders of performance shares or performance units have no voting rights or rights to receive cash dividends unless and until shares of Series 1 common stock are issued in settlement of such awards. However, the administrator may grant performance shares that entitle their holders to dividend equivalent rights. |
| • | Cash-based awards and other stock-based awards. The administrator may grant cash-based awards that specify a monetary payment or range of payments or other stock-based awards that specify a number or range of shares or units that, in either case, are subject to vesting or other conditions specified by the administrator. Settlement of these awards may be in cash or shares of our Series 1 common stock, as determined by the administrator. Their holder will have no voting rights or right to receive cash dividends unless and until shares of our Series 1 common stock are issued pursuant to the award. The administrator may grant dividend equivalent rights with respect to other stock-based awards. |
In the event of a change in control as described in the 2013 Equity Incentive Plan, the acquiring or successor entity may assume or continue all or any awards outstanding under the 2013 Equity Incentive Plan or substitute substantially equivalent awards. Any awards which are not assumed or continued in connection with a change in control or are not exercised or settled prior to the change in control will terminate effective as of the time of the change in control. The compensation committee may provide for the acceleration of vesting of any or all outstanding awards upon such terms and to such extent as it determines, except that the vesting of all awards held by members of the board of directors who are not employees will automatically be accelerated in full. The 2013 Equity Incentive Plan will also authorize the compensation committee, in its discretion and without the consent of any participant, to cancel each or any outstanding award denominated in shares upon a change in control in exchange for a payment to the participant with respect to each share subject to the cancelled award of an amount equal to the excess of the consideration to be paid per share of Series 1 common stock in the change in control transaction over the exercise price per share, if any, under the award.
The 2013 Equity Incentive Plan will continue in effect until it is terminated by the administrator, provided, however, that all awards will be granted, if at all, within 10 years of its effective date. The administrator may amend, suspend or terminate the 2013 Equity Incentive Plan at any time, provided that without stockholder approval, the plan cannot be amended to increase the number of shares authorized, change the class of persons eligible to receive incentive stock options, or effect any other change that would require stockholder approval under any applicable law or listing rule.
2013 Employee Stock Purchase Plan
In July 2013, our board of directors adopted and our stockholders approved our 2013 Employee Stock Purchase Plan, or the ESPP.
A total of 560,907 shares of our Series 1 common stock are available for sale under our ESPP. In addition, our ESPP provides for annual increases in the number of shares available for issuance under the ESPP on January 1, 2014 and each subsequent anniversary through 2023, equal to the smallest of:
| • | 1,400,000 shares; |
| • | 1% of the issued and outstanding shares of our combined Series 1 and Series 2 common stock on the immediately preceding December 31; or |
| • | such other amount as may be determined by the board. |
Appropriate adjustments will be made in the number of authorized shares and in outstanding purchase rights to prevent dilution or enlargement of participants’ rights in the event of a stock split or other change in our capital structure. Shares subject to purchase rights which expire or are cancelled will again become available for issuance under the ESPP.
116
Table of Contents
The compensation committee of our board of directors will administer the ESPP and have full authority to interpret the terms of the ESPP. The ESPP provides, subject to certain limitations, for indemnification by us of any director, officer or employee against all judgments, amounts paid in settlement and reasonable expenses, including attorneys’ fees, incurred in connection with any legal action arising from such person’s action or failure to act in administering the ESPP.
All of our employees, including our named executive officers, and employees of any of our subsidiaries designated by the compensation committee are eligible to participate if they are customarily employed by us or any participating subsidiary for more than 20 hours per week and more than five months in any calendar year, subject to any local law requirements applicable to participants in jurisdictions outside the U.S. However, an employee may not be granted rights to purchase stock under our ESPP if such employee:
| • | immediately after the grant would own stock or options to purchase stock possessing 5.0% or more of the total combined voting power or value of all classes of our capital stock; or |
| • | holds rights to purchase stock under all of our employee stock purchase plans that would accrue at a rate that exceeds $25,000 worth of our stock for each calendar year in which the right to be granted would be outstanding at any time. |
Our ESPP is intended to qualify under Section 423 of the Code but also permits us to include our non-United States employees in offerings not intended to qualify under Section 423. The ESPP will typically be implemented through consecutive six-month offering periods, generally starting on the first trading day on or after May 15 and November 15 of each year, except for the first such offering period, which will commence on a date to be determined by the administrator. The administrator may, in its discretion, modify the terms of future offering periods, including establishing offering periods of up to 27 months and providing for multiple purchase dates. If the market price per share on an interim purchase date within a multiple purchase date offering period is less than the market price at the beginning of the offering period, then each participant automatically will be withdrawn from the original offering period and enrolled in a new offering period of the same duration beginning immediately after the purchase. The administrator may vary certain terms and conditions of separate offerings for employees of our non-U.S. subsidiaries where required by local law or desirable to obtain intended tax or accounting treatment.
Our ESPP permits participants to purchase Series 1 common stock through payroll deductions of up to 25% of their eligible cash compensation, which includes a participant’s regular base wages or salary and payments of overtime, shift premiums and paid time off before deduction of taxes and certain compensation deferrals.
Amounts deducted and accumulated from participant compensation, or otherwise funded in any participating non-U.S. jurisdiction in which payroll deductions are not permitted, are used to purchase shares of our Series 1 common stock at the end of each offering period. Unless otherwise provided by the administrator, the purchase price of the shares will be 85.0% of the lower of the fair market value of our Series 1 common stock on the first trading day of the offering period or on the purchase date. Participants may end their participation at any time during an offering period and will receive a refund of their account balances not yet used to purchase shares. The administrator may authorize multiple purchase date offerings in which participants are permitted to increase their payroll deduction rate effective with the next interim purchase period. Participation ends automatically upon termination of employment with us.
Each participant in an offering will have an option to purchase up to 600 shares of Series 1 common stock for each six-month purchase period contained in the offering, prorated for purchase periods of other than six months, and except as limited in order to comply with Section 423 of the Code. Prior to the beginning of any offering period, the administrator may alter the maximum number of shares that may be purchased by any participant during the offering period or specify a maximum aggregate number of shares that may be purchased by all participants in the offering period. If insufficient shares remain available under the plan to permit all participants to purchase the number of shares to which they would otherwise be entitled, the administrator will
117
Table of Contents
make a pro rata allocation of the available shares. Any amounts withheld from participants’ compensation in excess of the amounts used to purchase shares will be refunded, without interest unless otherwise required by a participant’s local law.
A participant may not transfer rights granted under the ESPP other than by will, the laws of descent and distribution or as otherwise provided under the ESPP.
In the event of a change in control, an acquiring or successor corporation may assume our rights and obligations under outstanding purchase rights or substitute substantially equivalent purchase rights. If the acquiring or successor corporation does not assume or substitute for outstanding purchase rights, then the purchase date of the offering periods then in progress will be accelerated to a date prior to the change in control.
Our ESPP will continue in effect until terminated by the administrator. The compensation committee has the authority to amend, suspend or terminate our ESPP at any time.
401(k)
We have established a tax-qualified employee savings and retirement plan for all employees who satisfy certain eligibility requirements, including requirements relating to age and length of service. Under our 401(k) plan, employees may elect to reduce their current compensation by up to the statutory limit, $17,000 in 2012, and have us contribute the amount of this reduction to the 401(k) plan. During 2012, we began matching up to 58.3% of employee contributions, but not exceeding $8,750 per employee. Our contributions for the year ended December 31, 2012 and the nine months ended September 30, 2013 were $0.4 million and $0.6 million, respectively. We intend for the 401(k) plan to qualify under Section 401 of the Internal Revenue Code so that contributions by employees or by us to the 401(k) plan, and income earned on plan contributions, are not taxable to employees until withdrawn from the 401(k) plan.
118
Table of Contents
CERTAIN RELATIONSHIPS AND RELATED PARTY TRANSACTIONS
Since December 31, 2009, there has not been, nor is there currently proposed, any transaction or series of similar transactions to which we were or are a party in which the amount involved exceeded or exceeds $120,000 and in which any of our directors, executive officers, holders of more than 5% of any class of our voting securities, or any member of the immediate family of any of the foregoing persons, had or will have a direct or indirect material interest, other than compensation arrangements with directors and executive officers, which are described where required in the section titled “Management,” and the transactions described below.
On May 12, 2010, we sold 312,500 shares of our Series A-1 preferred stock (which shares were later converted into shares of our Series B-1 preferred stock pursuant to our Second Amended and Restated Certificate of Incorporation as filed on November 23, 2010) at a price of $4.00 per share for an aggregate purchase price of $1.25 million, 187,500 of which shares were sold to entities affiliated with certain members of our board of directors or holders of more than 5.0% of any class of our voting securities. The table below summarizes these sales.
| Purchaser |
Shares of Series A-1 Preferred Stock Purchased |
Aggregate Purchase Price |
||||||
| Austin Ventures IX, L.P.(1) |
93,750 | $ | 375,000 | |||||
| Austin Ventures X, L.P.(2) |
93,750 | $ | 375,000 | |||||
|
|
|
|
|
|||||
| Total |
187,500 | $ | 750,000 | |||||
|
|
|
|
|
|||||
| (1) | Austin Ventures IX, L.P. is a holder of more than 5.0% of a class of our voting securities. C. Thomas Ball, an affiliate of Austin Ventures IX, L.P., is a member of our board of directors. |
| (2) | Austin Ventures X, L.P. is a holder of more than 5.0% of a class of our voting securities. C. Thomas Ball, an affiliate of Austin Ventures X, L.P., is a member of our board of directors. |
On November 24, 2010 and in a second closing on May 20, 2011, we sold an aggregate of 20,811,464 shares of our Series B-2 preferred stock at a price of $4.66 per share for an aggregate purchase price of approximately $97.0 million, 20,650,551 which shares were sold to entities affiliated with certain members of our board of directors or holders of more than 5.0% of any class of our voting securities. Additionally, we issued warrants to the purchasers of our Series B-2 preferred stock entitling them to purchase either shares of our Series B-2 preferred stock or Series B-3 preferred stock. The type of stock for which the warrants were exercisable and the exercise price were not fixed at the time the warrants were issued, but were dependent upon the date on which the Company next made an acquisition and the price paid by the Company in connection with that acquisition. The table below summarizes the sales of Series B-2 preferred stock.
| Purchaser |
Shares of Series B-2 Preferred Stock Purchased |
Aggregate Purchase Price |
||||||
| Entities affiliated with Austin Ventures(1) |
7,326,924 | $ | 34,150,001.46 | |||||
| Entities affiliated with Norwest Venture Partners(2) |
8,582,047 | 40,000,000.03 | ||||||
| Entities affiliated with Adams Street Partners(3) |
2,574,613 | 12,000,000.13 | ||||||
| Moose Pond Investments, LP(4) |
21,455 | 100,000.60 | ||||||
| Google Ventures 2011, L.P.(5) |
2,145,512 | 9,999,999.72 | ||||||
|
|
|
|
|
|||||
| Total |
20,650,551 | $ | 96,250,001.94 | |||||
|
|
|
|
|
|||||
| (1) | Consists of 3,663,462 shares purchased by Austin Ventures IX, L.P. and 3,663,462 shares purchased by Austin Ventures X, L.P., each of which constitutes more than 5.0% of a class of our voting securities. These entities are affiliated with Austin Ventures. C. Thomas Ball, also an affiliate of Austin Ventures, is a member of our board of directors. |
119
Table of Contents
| (2) | Consists of 6,436,536 shares purchased by Norwest Venture Partners XI, LP, 1,287,307 shares purchased by Norwest Venture Partners VII-A, LP and 858,204 shares purchased by Norwest Venture Partners VI-A, LP. Entities affiliated with Norwest Venture Partners are holders of more than 5.0% of a class of our voting securities. Jeffrey M. Crowe, an affiliate of Norwest Venture Partners, is a member of our board of directors. |
| (3) | Consists of 536,858 shares purchased by Adams Street 2010 Direct Fund, L.P., 945,084 shares purchased by Adams Street 2009 Direct Fund, L.P. and 1,092,671 shares purchased by Adams Street 2008 Direct Fund, L.P. Entities affiliated with Adams Street Partners are holders of more than 5.0% of a class of our voting securities. |
| (4) | The limited partner of Moose Pond Investments, LP and the sole manager of Moose Pond Mgt., LP, the general partner of Moose Pond Investments, LP, is Brian H. Sharples, a member of our board of directors. |
| (5) | Google Ventures 2011, L.P. is a holder of more than 5.0% of a class of our securities. Karim B. Faris, an affiliate of Google Ventures 2011, L.P., is a member of our board of directors. |
On November 24, 2010, we issued shares of our Series B-2 preferred stock in connection with the acquisition of the assets of RetailMeNot, including 3,003,716 shares of our Series B-2 preferred stock to King Holdings (Vic) Pty Ltd ACN 147 435 970, a holder of more than 5.0% of a class of our voting securities.
The table below summarizes the consideration paid and the shares issued on August 12, 2011 in connection with the exercise of the preferred stock warrants issued in connection with our sale of Series B-2 preferred stock on November 24, 2010 and May 20, 2011 as described above. Each of the warrants was exercised for shares of Series B-2 preferred stock, at an exercise price of $4.66 per share.
| Purchaser |
Shares of Series B-2 Preferred Stock |
Aggregate Exercise Price |
||||||
| Entities affiliated with Austin Ventures(1) |
490,784 | $ | 2,287,498.21 | |||||
| Entities affiliated with Norwest Venture Partners(2) |
2,145,511 | 9,999,998.55 | ||||||
| Entities affiliated with Adams Street Partners(3) |
643,652 | 2,999,998.28 | ||||||
| Moose Pond Investments, LP(4) |
5,363 | 24,999.86 | ||||||
| Google Ventures 2011, L.P.(5) |
536,378 | 2,499,999.93 | ||||||
|
|
|
|
|
|||||
| Total |
3,821,688 | $ | 17,812,494.83 | |||||
|
|
|
|
|
|||||
| (1) | Consists of 245,392 shares purchased by Austin Ventures IX, L.P. and 245,392 shares purchased by Austin Ventures X, L.P. Entities affiliated with Austin Ventures are holders of more than 5.0% of a class of our voting securities. C. Thomas Ball, an affiliate of Austin Ventures, is a member of our board of directors. |
| (2) | Consists of 1,609,134 shares purchased by Norwest Venture Partners XI, LP, 321,826 shares purchased by Norwest Venture Partners VII-A, LP and 214,551 shares purchased by Norwest Venture Partners VI-A, LP. Entities affiliated with Norwest Venture Partners are holders of more than 5.0% of a class of our voting securities. Jeffrey M. Crowe, an affiliate of Norwest Venture Partners, is a member of our board of directors. |
| (3) | Consists of 134,214 shares purchased by Adams Street 2010 Direct Fund, L.P., 236,271 shares purchased by Adams Street 2009 Direct Fund, L.P. and 273,167 shares purchased by Adams Street 2008 Direct Fund, L.P. Entities affiliated with Adams Street Partners are holders of more than 5.0% of a class of our voting securities. |
| (4) | The limited partner of Moose Pond Investments, LP and the sole manager of Moose Pond Mgt., LP, the general partner of Moose Pond Investments, LP, is Brian H. Sharples, a member of our board of directors. |
| (5) | Google Ventures 2011, L.P. is a holder of more than 5.0% of a class of our securities. Karim B. Faris, an affiliate of Google Ventures 2011, L.P., is a member of our board of directors. |
On October 28, 2011, we sold 3,053,747 shares of our Series B-3 preferred stock and 6,107,494 shares of our Series BB-3 preferred stock, each at a price of $16.37 per share for an aggregate purchase price of
120
Table of Contents
approximately $150.0 million, all of which shares were sold to entities affiliated with certain members of our board of directors or holders of more than 5.0% of any class of our voting securities. The table below summarizes these sales.
| Purchaser |
Shares of Series B-3 Convertible Preferred Stock Purchased |
Shares of Series BB-3 Convertible Preferred Stock Purchased |
Aggregate Purchase Price |
|||||||||
| Institutional Venture Partners XIII, L.P.(1) |
3,053,747 | 0 | $ | 49,999,997.23 | ||||||||
| Entities affiliated with J.P. Morgan(2) |
0 | 6,107,494 | 99,999,998.56 | |||||||||
|
|
|
|
|
|
|
|||||||
| Total |
3,053,747 | 6,107,494 | $ | 149,999,995.79 | ||||||||
|
|
|
|
|
|
|
|||||||
| (1) | Institutional Venture Partners XIII, L.P. is a holder of more than 5.0% of a class of our voting securities. Jules A. Maltz, an affiliate of Institutional Venture Partners XIII, L.P., is a member of our board of directors. |
| (2) | Consists of 6,031,151 shares purchased by J.P. Morgan Digital Growth Fund, L.P. and 76,343 shares purchased by 522 Fifth Avenue Fund, L.P. Entities affiliated with J.P. Morgan are holders of more than 5.0% of a class of our voting securities. |
On September 1, 2011, we sold 17,482 shares of our Series B-4 preferred stock at a price of $7.15 per share for an aggregate purchase price of approximately $125,000 to Moose Pond Investments, LP. Brian H. Sharples, a member of our board of directors, is the limited partner of Moose Pond Investments, LP and the sole manager of Moose Pond Mgt., LP, the general partner of Moose Pond Investments, LP.
Option Exercises
Since December 31, 2009, the following executive officers, directors and holders of more than 5% of any class of our voting securities exercised options held by them:
| Exercise Date |
Optionee | Exercise Price | Number of Options Shares Exercised |
Shares of Series 1 Common Stock Issued |
||||||||||
| 10/14/2011 |
Jagjit S. Bath | $ | 2.08 | 48,076 | 48,076 | |||||||||
| 10/24/2011 |
Steven T. Pho | $ | 2.08 | 21,250 | 21,250 | |||||||||
| 7/24/2013 |
Louis J. Agnese, III | $ | 5.32 | 13,375 | 13,375 | |||||||||
| 7/24/2013 |
Jillian A. Balis | $ | 2.08 | 15,250 | 15,250 | |||||||||
| 7/24/2013 |
Kelli A. Beougher | $ | 1.12 | 25,175 | 25,175 | |||||||||
| 7/24/2013 |
G. Cotter Cunningham | $ | 2.08 | 81,559 | 81,559 | |||||||||
| 7/24/2013 |
Paul M. Rogers | $ | 2.08 | 15,850 | 15,850 | |||||||||
Investors’ Rights Agreement
In October 2011, we entered into a third amended and restated investors’ rights agreement, as amended, with certain of our stockholders, including individuals and entities affiliated with Austin Ventures, Norwest Venture Partners, Adams Street Partners, Google Ventures, Institutional Venture Partners, J.P. Morgan and King Holdings (Vic) Pty Ltd ACN 147 435 970. The third amended and restated investors’ rights agreement, as amended, among other things:
| • | grants such stockholders certain registration rights with respect to shares of our common stock; |
| • | obligated us to deliver periodic financial statements to certain stockholders who are parties to the third amended and restated investors’ rights agreement, as amended, including entities affiliated with Austin Ventures, Norwest Venture Partners, Adams Street Ventures, Google Ventures, Institutional Venture Partners, J.P. Morgan and King Holdings (Vic) Pty Ltd CAN 147 435 970; and |
121
Table of Contents
| • | granted a right of first offer with respect to sales of our shares by us, subject to specified exceptions, to certain stockholders, including individuals and entities affiliated with Austin Ventures, Norwest Venture Partners, Adams Street Ventures, Google Ventures, Institutional Venture Partners, J.P. Morgan and King Holdings (Vic) Pty Ltd CAN 147 435 970. |
For more information regarding the registration rights provided in this agreement, please refer to the section titled “Description of Capital Stock—Registration Rights.” Certain provisions of this agreement terminated upon completion of our initial public offering. This summary discusses certain material provisions of the third amended and restated investors’ rights agreement, as amended, and is qualified by the full text of the third amended and restated investors’ rights agreement, as amended, which has been filed with the SEC and is incorporated by reference to the registration statement of which this prospectus is a part.
Voting Agreement
In October 2011, we entered into a third amended and restated voting agreement, as amended, with certain of our stockholders, including individuals and entities affiliated with Austin Ventures, Norwest Venture Partners, Adams Street Partners, Google Ventures, Institutional Venture Partners, J.P. Morgan and King Holdings (Vic) Pty Ltd ACN 147 435 970. The third amended and restated voting agreement, as amended, provided, among other things, for the voting of shares with respect to the constituency of the board of directors and for the voting of shares with respect to certain transactions approved by a majority of the holders of our outstanding preferred stock. This agreement terminated upon completion of our initial public offering. This is not a complete description of the third amended and restated voting agreement, as amended, and is qualified by the full text of the agreement, which has been filed with the SEC and is incorporated by reference to the registration statement of which this prospectus is a part.
Right of First Refusal and Co-Sale Agreement
In October 2011, we entered into a third amended and restated right of first refusal and co-sale agreement, as amended, with certain of our stockholders, including individuals and entities affiliated with Austin Ventures, Norwest Venture Partners, Adams Street Partners, Google Ventures, Institutional Venture Partners, J.P. Morgan and King Holdings (Vic) Pty Ltd ACN 147 435 970. The third amended and restated right of first refusal and co-sale agreement, as amended, among other things, granted our investors certain rights of first refusal and co-sale with respect to proposed transfers of our securities by certain stockholders and granted us certain rights of first refusal with respect to proposed transfers of our securities by certain stockholders. This agreement terminated upon completion of our initial public offering. This is not a complete description of the third amended and restated right of first refusal and co-sale agreement, as amended, and is qualified by the full text of the agreement, which has been filed with the SEC and is incorporated by reference to the registration statement of which this prospectus is a part.
Employment Agreements
Please see the section titled “Executive Compensation—Arrangements with Named Executive Officers—Employment Agreements” for information on compensation and employment arrangements with our named executive officers.
Indemnification of Officers and Directors
Our amended and restated bylaws provide that we indemnify each of our directors and officers to the fullest extent permitted by the Delaware General Corporation Law. Further, we have entered into indemnification agreements with each of our directors and officers. These agreements provide for the indemnification of our directors and officers for all reasonable expenses and liabilities incurred in connection with any action or proceeding brought against them by reason of the fact that they are or were our agents. We believe that these indemnification agreements are necessary to attract and retain qualified persons as directors and officers. We also maintain directors’ and officers’ liability insurance. For further information, see the section titled “Executive Compensation—Limitations of Liability; Indemnification of Directors and Officers.”
122
Table of Contents
Share Repurchases
On November 3, 2011, we repurchased an aggregate of 2,371,277 shares of our Series B-1 preferred stock and 2,118,063 shares of our Series B-2 preferred stock, each at a price of $15.59 per share, for an aggregate repurchase price of approximately $70.0 million, all of which shares were repurchased from related parties. The repurchase price per share was established through negotiation with Institutional Venture Partners and JP Morgan Digital Growth Fund as part of their initial investment in our Series B-3 preferred stock and Series BB-3 preferred stock, respectively, because a significant portion of the proceeds of that financing were to be used to conduct the repurchase. The table below summarizes the repurchases.
| Seller |
Class of Stock Repurchased | Shares of Stock Repurchased |
Aggregate Repurchase Price |
|||||||||
| Austin Ventures IX, L.P. |
Series B-1 preferred stock | 1,101,252 | $ | 17,171,267.41 | ||||||||
| Austin Ventures X, L.P. |
Series B-1 preferred stock | 1,020,025 | 15,904,731.84 | |||||||||
| Norwest Venture Partners XI, LP |
Series B-2 preferred stock | 1,024,869 | 15,980,265.79 | |||||||||
| Norwest Venture Partners VII-A, LP |
Series B-2 preferred stock | 204,974 | 3,196,052.38 | |||||||||
| Norwest Venture Partners VI-A, LP |
Series B-2 preferred stock | 136,649 | 2,130,702.89 | |||||||||
| Adams Street 2008 Direct Fund, L.P. |
Series B-2 preferred stock | 173,983 | 2,712,821.44 | |||||||||
| Adams Street 2009 Direct Fund, L.P. |
Series B-2 preferred stock | 150,483 | 2,346,401.68 | |||||||||
| Adams Street 2010 Direct Fund, L.P. |
Series B-2 preferred stock | 85,482 | 1,332,881.65 | |||||||||
| Google Ventures 2011, L.P. |
Series B-2 preferred stock | 341,623 | 5,326,755.27 | |||||||||
| G. Cotter Cunningham |
Series B-1 preferred stock | 250,000 | 3,898,116.21 | |||||||||
|
|
|
|
|
|||||||||
| Total |
4,489,340 | $ | 69,999,996.56 | |||||||||
|
|
|
|
|
|||||||||
Registration Rights
For more information regarding these agreements, please refer to the section titled “Description of Capital Stock—Registration Rights.” This is not a complete description of the registration rights contained in the investors’ rights agreement and warrant and is qualified by the full text of the investors’ rights agreement, and warrant, each filed with the SEC and is incorporated by reference to the registration statement of which this prospectus is a part.
Other Related Party Transactions
On May 2, 2013, we entered into an agreement with AVP Management Services, Inc. pursuant to which we purchased tickets to the Austin City Limits Festival, a music festival, from AVP Management Services, Inc. for $115,000. We also acquired an option to purchase additional tickets from AVP Management Services, Inc. AVP Management Services, Inc. is an affiliate of Austin Ventures IX, L.P. and Austin Ventures X, L.P.
On July 1, 2013, in connection with the Current Senior Debt, we entered into a $115.0 million revolving credit facility and a $35.0 million term loan facility pursuant to an amended and restated revolving credit and term loan agreement with certain lenders, including JPMorgan Chase Bank, N.A., which is affiliated with J.P. Morgan. For further information on the Current Senior Debt, see the section titled “Management’s Discussion and Analysis of Financial Condition and Results of Operations.” As part of the term loan facility, JPMorgan Chase Bank loaned us a principal amount of $3.5 million, which is currently outstanding, and committed to advancing us up to $11.5 million under the revolving credit facility, none of which is currently advanced. There is a quarterly revolving credit facility fee of 50 basis points. At our option, borrowings under both the term loan facility and the revolving credit facility bear interest at either the base rate or a eurodollar-based rate (each as more fully described in the amended and restated revolving credit and term loan agreement) plus an applicable margin as determined based on the funded debt to EBITDA ratio (as more fully described in the amended and restated revolving credit and term loan agreement). These rates are summarized in the section titled “Management’s Discussion and Analysis of Financial Condition and Results of Operations” and the notes to our consolidated financial statements.
123
Table of Contents
On July 5, 2013, in exchange for agreeing to vote in favor of the conversion of preferred stock to common stock in connection with our initial public offering, we agreed to pay Institutional Venture Partners XIII, L.P. and entities affiliated with J.P. Morgan $2,046,001 and $4,092,002, respectively, upon delivery by us of a written request to such entities to vote to effect such conversion. We delivered such request and such payments were made on July 11, 2013.
Policies and Procedures for Related Party Transactions
As provided by our audit committee charter, our audit committee must review and approve in advance any related party transaction. Pursuant to our Related Party Transactions Policy, all of our directors, officers and employees are required to report to our audit committee any such related party transaction prior to its completion. Prior to the creation of our current audit committee, our full board of directors reviewed related party transactions. Each of the related party transactions described above that was submitted to our board of directors was approved by disinterested members of our board of directors after disclosure of the interest of the related party in the transaction.
124
Table of Contents
PRINCIPAL AND SELLING STOCKHOLDERS
The following table and footnotes set forth information with respect to the beneficial ownership of our common stock as of October 31, 2013, subject to certain assumptions set forth in the footnotes and as adjusted to reflect the sale of the shares of Series 1 common stock offered in the public offering under this prospectus for:
| • | each stockholder, or group of affiliated stockholders, who we know beneficially owns more than 5% of the outstanding shares of our common stock; |
| • | each of our named executive officers; |
| • | each of our current directors; |
| • | all of our current directors and current executive officers as a group; and |
| • | each of the selling stockholders. |
Beneficial ownership of shares is determined under the rules of the SEC and generally includes any shares over which a person exercises sole or shared voting or investment power. Except as indicated by footnote, and subject to applicable community property laws, we believe each person identified in the table possesses sole voting and investment power with respect to all shares of Series 1 common stock and Series 2 common stock beneficially owned by them. Shares of Series 1 common stock subject to options and warrants currently exercisable or exercisable within 60 days of October 31, 2013, are deemed to be outstanding for calculating the number and percentage of outstanding shares of the person holding such options and warrants, but are not deemed to be outstanding for calculating the percentage ownership of any other person.
Applicable percentage ownership in the following table is based on 44,457,399 shares of Series 1 common stock and 6,107,494 shares of Series 2 common stock outstanding as of October 31, 2013.
125
Table of Contents
Unless otherwise indicated and subject to applicable community property laws, to our knowledge, each stockholder named in the following table possesses sole voting and investment power over the shares listed, except for those jointly owned with that person’s spouse. Unless otherwise noted below, the address of each person listed on the table is c/o RetailMeNot, Inc., 301 Congress Avenue, Suite 700, Austin, Texas 78701. Beneficial ownership or voting power representing less than 1% is denoted with an asterisk (*).
| Shares Beneficially Owned Prior to the Offering |
% of Total Voting Power Before the Offering |
Number of Shares Offered |
Shares Beneficially Owned After the Offering |
Number of Shares to be Sold if Underwriters’ Option is Exercised in Full |
Shares Beneficially Owned After the Offering if Underwriters’ Option is Exercised in Full |
% of Total Voting Power After The Offering | ||||||||||||||||||||||||||||||||||||||||||||||||||||
| Series 1 | Series 2 | Series 1 | Series 2 | Series 1 | Series 2 | Series 1 | Series 2 | |||||||||||||||||||||||||||||||||||||||||||||||||||
| Shares | % | Shares | % | Shares | % | Shares | % | Shares | Shares | Shares | % | Shares | % | |||||||||||||||||||||||||||||||||||||||||||||
| 5% Stockholders: |
||||||||||||||||||||||||||||||||||||||||||||||||||||||||||
| Entities affiliated with Adams Street Partners(1) |
2,555,569 | 5.7 | % | — | — | 5.1 | % | — | — | — | — | — | ||||||||||||||||||||||||||||||||||||||||||||||
| Entities affiliated with Austin Ventures(2) |
12,090,733 | 27.2 | % | — | — | 23.9 | % | — | — | — | — | — | ||||||||||||||||||||||||||||||||||||||||||||||
| Institutional Venture Partners XIII, L.P.(3) |
3,175,897 | 7.1 | % | — | — | 6.3 | % | — | — | — | — | — | ||||||||||||||||||||||||||||||||||||||||||||||
| Entities affiliated with J.P. Morgan(4) |
152,687 | 0.3 | % | 6,107,494 | 100.0 | % | 12.4 | % | 6,107,494 | 100.0 | % | — | 6,107,494 | 100.0 | % | |||||||||||||||||||||||||||||||||||||||||||
| King Holdings (Vic) Pty Ltd ACN 147 435 970(5) |
2,499,175 | 5.6 | % | — | — | 4.9 | % | — | — | — | — | — | ||||||||||||||||||||||||||||||||||||||||||||||
| Entities affiliated with Norwest Venture Partners(6) |
7,788,661 | 17.5 | % | — | — | 15.4 | % | — | — | — | — | — | ||||||||||||||||||||||||||||||||||||||||||||||
| Directors and Named Executive Officers |
||||||||||||||||||||||||||||||||||||||||||||||||||||||||||
| C. Thomas Ball(7) |
12,090,733 | 27.2 | % | — | — | 23.9 | % | — | — | — | — | — | ||||||||||||||||||||||||||||||||||||||||||||||
| Jeffrey M. Crowe(8) |
7,788,661 | 17.5 | % | — | — | 15.4 | % | — | — | — | — | — | ||||||||||||||||||||||||||||||||||||||||||||||
| Karim B. Faris(9) |
— | * | — | — | * | — | — | — | — | — | ||||||||||||||||||||||||||||||||||||||||||||||||
| Jules A. Maltz(10) |
3,175,897 | 7.1 | % | — | — | 6.3 | % | — | — | — | — | — | ||||||||||||||||||||||||||||||||||||||||||||||
| Gokul Rajaram(11) |
— | * | — | — | * | * | — | — | — | * | — | — | ||||||||||||||||||||||||||||||||||||||||||||||
| Greg J. Santora(12) |
24,275 | * | — | — | * | * | — | — | — | * | — | — | ||||||||||||||||||||||||||||||||||||||||||||||
| Brian H. Sharples(13) |
96,120 | * | — | — | * | * | — | — | — | * | — | — | ||||||||||||||||||||||||||||||||||||||||||||||
| G. Cotter Cunningham(14) |
1,394,863 | 3.1 | % | — | — | 2.7 | % | — | — | — | — | — | ||||||||||||||||||||||||||||||||||||||||||||||
| Kelli A. Beougher(15) |
204,247 | * | — | — | * | * | — | — | — | * | — | — | ||||||||||||||||||||||||||||||||||||||||||||||
| Douglas C. Jeffries(16) |
364,626 | * | — | — | * | * | — | — | — | * | — | — | ||||||||||||||||||||||||||||||||||||||||||||||
| All Directors and Executive Officers as a group (15 persons)(17) |
25,707,814 | 55.4 | % | — | — | 49.0 | % | — | — | — | — | — | ||||||||||||||||||||||||||||||||||||||||||||||
| Other Selling Stockholders |
||||||||||||||||||||||||||||||||||||||||||||||||||||||||||
| Arbor Green II, LP(18) |
58,799 | * | — | — | * | * | — | — | — | * | — | — | ||||||||||||||||||||||||||||||||||||||||||||||
| Clark/Kirk Holdings Pty Ltd ACN 147 455 767, as trustee for the Clark/Kirk Holdings Trust(19) |
1,071,075 | 2.4 | % | — | — | 2.1 | % | — | — | — | — | — | ||||||||||||||||||||||||||||||||||||||||||||||
| Google Ventures 2011, L.P. (20) |
2,001,610 | 4.5 | % | 4.0 | % | |||||||||||||||||||||||||||||||||||||||||||||||||||||
| Thomas Aylor(21) |
29,936 | * | * | * | * | |||||||||||||||||||||||||||||||||||||||||||||||||||||
| Jillian L. Balis(22) |
137,250 | * | — | — | * | * | — | — | — | * | — | — | ||||||||||||||||||||||||||||||||||||||||||||||
126
Table of Contents
| Shares Beneficially Owned Prior to the Offering |
% of Total Voting Power Before the Offering |
Number of Shares Offered |
Shares Beneficially Owned After the Offering |
Number of Shares to be Sold if Underwriters’ Option is Exercised in Full |
Shares Beneficially Owned After the Offering if Underwriters’ Option is Exercised in Full |
% of Total Voting Power After The Offering | ||||||||||||||||||||||||||||||||||||||||||||||||||||
| Series 1 | Series 2 | Series 1 | Series 2 | Series 1 | Series 2 | Series 1 | Series 2 | |||||||||||||||||||||||||||||||||||||||||||||||||||
| Shares | % | Shares | % | Shares | % | Shares | % | Shares | Shares | Shares | % | Shares | % | |||||||||||||||||||||||||||||||||||||||||||||
| Jagjit S. Bath(23) |
137,250 | * | — | — | * | * | — | — | — | * | — | — | ||||||||||||||||||||||||||||||||||||||||||||||
| John Faith(24) |
101,250 | * | — | — | * | * | — | — | — | * | — | — | ||||||||||||||||||||||||||||||||||||||||||||||
| Matthew Howitt(25) |
68,388 | * | — | — | * | * | — | — | — | * | — | — | ||||||||||||||||||||||||||||||||||||||||||||||
| INVENTUZ(26) |
65,673 | * | — | — | * | * | — | — | — | * | — | — | ||||||||||||||||||||||||||||||||||||||||||||||
| Peter Morse |
14,133 | * | * | * | * | |||||||||||||||||||||||||||||||||||||||||||||||||||||
| MOUVEO(27) |
98,510 | * | — | — | * | * | — | — | — | * | — | — | ||||||||||||||||||||||||||||||||||||||||||||||
| Steven T. Pho(28) |
68,229 | * | — | — | * | * | — | — | — | * | — | — | ||||||||||||||||||||||||||||||||||||||||||||||
| Paul M. Rogers(29) |
142,650 | * | — | — | * | * | — | — | — | * | — | — | ||||||||||||||||||||||||||||||||||||||||||||||
| Justin Halloran |
101,613 | * | — | — | * | * | — | — | — | * | — | — | ||||||||||||||||||||||||||||||||||||||||||||||
| MTG Portfolio, Ltd(30). |
167,357 | * | — | — | * | * | — | — | — | — | — | |||||||||||||||||||||||||||||||||||||||||||||||
| (1) | Represents 1,084,588 shares held by Adams Street 2008 Direct Fund, L.P., or AS 2008, 938,094 shares held by Adams Street 2009 Direct Fund, L.P., or AS 2009, and 532,887 shares held by Adams Street 2010 Direct Fund, L.P., or AS 2010. Adams Street Partners, LLC, or ASP, is the managing member of the general partner of AS 2008, AS 2009 and AS 2010, and may be deemed to share voting and dispositive powers over the shares held by each of AS 2008, AS 2009 and AS 2010. Thomas D. Berman, David Brett, Jeffrey T. Diehl, Elisha P. Gould, III, Michael S. Lynn, Robin P. Murray, Sachin Tulyani, Craig D. Waslin and David Welsh are partners of ASP (or a subsidiary thereof), and may be deemed to share voting and/or dispositive power of the shares held by AS 2008, AS 2009 and AS 2010. Such persons and entities disclaim beneficial ownership of shares held by AS 2008, AS 2009 and AS 2010, except to the extent of any pecuniary interest therein. AS 2008, AS 2009 and AS 2010 are each entitled to board observer rights pursuant to a management rights letter with the Company. The address of each of AS 2008, AS 2009 and AS 2010 is One North Wacker Drive, Suite 2200, Chicago, Illinois 60606. For a discussion of our material relationships with AS 2008, AS 2009, AS 2010 and ASP, see the section titled “Certain Relationships and Related Party Transactions. |
| (2) | Represents 6,276,850 shares held by Austin Ventures IX, L.P., or AV IX, and 5,813,883 shares held by Austin Ventures X, L.P., or AV X. AV Partners IX, L.P., or AVP IX LP, the general partner of AV IX, and AV Partners IX, LLC, or AVP IX LLC, the general partner AVP IX LP, may be deemed to share voting and dispositive powers over the shares held by AV IX. AV Partners X, L.P., or AVP X LP, the general partner of AV X, and AV Partners X, LLC, or AVP X LLC, the general partner of AVP X LP, may be deemed to share voting and dispositive powers over shares held by AV X. Joseph C. Aragona, Kenneth P. DeAngelis, John D. Thornton, Christopher A. Pacitti, C. Thomas Ball and Philip S. Siegel are members of or are associated with AVP IX LLC and AVP X LLC and may be deemed to share voting and dispositive power over the shares held by AV IX and AV X. Such persons and entities disclaim beneficial ownership of shares held by AV IX and AV X, except to the extent of any pecuniary interest therein. Mr. Ball is a member of our board of directors. Mr. Siegel is a former member of our board of directors. Excludes 781 shares and 1,719 shares exercisable within 60 days of October 31, 2013 held by a family member of Mr. Aragona. The address of each of AV IX and AV X is 300 West 6th Street, Suite 2300, Austin, Texas 78701. For a discussion of our material relationships with AVIX, AVX, AVP IX LP, AVP X LP, AVP IX LLC and AVP X LLC, see the section titled “Certain Relationships and Related Party Transactions.” |
| (3) | Todd C. Chaffee, Norman A. Fogelsong, Stephen J. Harrick, J. Sanford Miller, Dennis B. Phelps, and Jules A. Maltz are general partners of Institutional Venture Partners XIII, L.P., or IVP XIII, and share voting and dispositive power over the shares held by IVP XIII. The address for IVP XIII is 3000 Sand Hill Road, Building 2, Suite 250, Menlo Park, California 94025. For a discussion of our material relationships with IVP XIII, see the section titled “Certain Relationships and Related Party Transactions.” |
| (4) | Represents 76,343 shares of Series 2 common stock held by 522 Fifth Avenue Fund, L.P., or 522 Fund, 152,687 shares of Series 1 common stock held by J.P. Morgan Secondary Private Equity Investors II, L.P., or SPEI, and 6,031,151 shares of Series 2 common stock held by J.P. Morgan Digital Growth Fund, L.P., or Digital Growth. Voting and dispositive power with respect to the shares held by each of 522 Fund, SPEI and Digital Growth reside with J.P. Morgan Investment Management. The address of each of 522 Fund, SPEI and Digital Growth is 270 Park Avenue, 25th Floor, New York, New York 10017. For a discussion of our material relationships with 522 Fund, SPEI and Digital Growth, see the section titled “Certain Relationships and Related Party Transactions.” |
| (5) | These shares are held by King Holdings (Vic) Pty Ltd ACN 147 435 970, or King ACN, in its capacity as trustee for the King Holdings Trust. Guy P. King is the sole director and shareholder of King ACN, and may be deemed to share voting and dispositive power over the shares held by King ACN. The address for King ACN is 1120 N.W. Couch Street, 10th Floor, Portland, Oregon 97209. Mr. King is an affiliate of a broker-dealer. King ACN acquired the securities in the ordinary course of business and did not, at the time of acquisition of our |
127
Table of Contents
| securities, have any agreement, understanding or arrangement with any other person, either directly or indirectly, to dispose of the securities. For a discussion of our material relationships with King ACN, see the section titled “Certain Relationships and Related Party Transactions.” |
| (6) | Represents 778,867 shares held by Norwest Venture Partners VI-A, LP, or NVP VI, 1,168,301 shares held by Norwest Venture Partners VII-A, LP, or NVP VII, and 5,841,493 shares held by Norwest Venture Partners XI, LP, or NVP XI. NVP Associates, LLC, or NVP Associates, is the managing member of the general partner of each of NVP VI, NVP VII and NVP XI, and may be deemed to share voting and dispositive powers over the shares held by each of NVP VI, NVP VII and NVP XI. Promod Haque, Matthew Howard, Joshua C. Goldman and Jeffrey M. Crowe are each officers of NVP Associates and may be deemed to share voting and dispositive power over the shares held by each of NVP VI, NVP VII and NVP XI. Such persons and entities each disclaim beneficial ownership of shares held by NVP VI, NVP VII and NVP XI, except to the extent of any pecuniary interest therein. Mr. Crowe is a member of our board of directors. Mr. Goldman is a former member of our board of directors. The address of each of NVP VI, NVP VII and NVP XI is 525 University Avenue, Suite 800, Palo Alto, California 94301. For a discussion of our material relationships with NVP VI, NVP VII and NVP XI, see the section titled “Certain Relationships and Related Party Transactions.” |
| (7) | Represents 6,276,850 shares held by AV IX and 5,813,883 shares held by AV X. Mr. Ball is associated with each of AVP IX LLC and AVP X LLC and may thus be deemed to share voting and dispositive power over the shares held by AV IX and AV X. Mr. Ball disclaims beneficial ownership of shares held by AV IX and AV X, except to the extent of his pecuniary interest therein. Mr. Ball’s address is 300 West 6th Street, Suite 2300, Austin, Texas 78701. Mr. Ball is a member of our board of directors. For a discussion of our material relationships with Mr. Ball, see the section titled “Certain Relationships and Related Party Transactions.” |
| (8) | Represents 778,867 shares held by NVP VI, 1,168,301shares held by NVP VII, and 5,841,493 shares held by NVP XI. Mr. Crowe is an officer of NVP Associates and as such, may be deemed to share voting and dispositive power over the shares held by each of NVP VI, NVP VII and NVP XI. Mr. Crowe disclaims beneficial ownership of shares held by each of NVP VI, NVP VII and NVP XI, except to the extent of his pecuniary interest therein. Mr. Crowe is a member of our board of directors. Mr. Crowe’s address is 525 University Avenue, Suite 800, Palo Alto, CA 94301. For a discussion of our material relationships with Mr. Crowe, see the section titled “Certain Relationships and Related Party Transactions.” |
| (9) | Mr. Faris’ address is 1600 Amphitheatre Parkway, Mountain View, California 94043. Mr. Faris is an affiliate of Google Ventures 2011, L.P. but is not a member of the Google Ventures investment Committee and does not have voting or dispositive power over the shares held by Google Ventures. Mr. Faris disclaims beneficial ownership of such shares, except to the extent of his pecuniary interest therein. Mr. Faris is a member of our board of directors. For a discussion of our material relationships with Mr. Faris, see the section titled “Certain Relationships and Related Party Transactions.” |
| (10) | Mr. Maltz is a general partner of IVP XIII and as such, may be deemed to share voting and dispositive power over the shares held by IVP XIII. Mr. Maltz’s address is 3000 Sand Hill Road, Building 2, Suite 250, Menlo Park, California 94025. Mr. Maltz is a member of our board of directors. For a discussion of our material relationships with Mr. Maltz, see the section titled “Certain Relationships and Related Party Transactions.” |
| (11) | Mr. Gokul is a member of our board of directors. |
| (12) | Includes 24,275 shares issuable upon the exercise of options within 60 days of October 31, 2013. Mr. Santora is a member of our board of directors. |
| (13) | Represents 39,870 shares held by Moose Pond Investments, LP, an entity controlled by Mr. Sharples, and 56,250 shares issuable upon the exercise of options exercisable within 60 days of October 31, 2013. Mr. Sharples’ is the limited partner of Moose Pond Investments, LP and the sole manager of Moose Pond Mgt., LP, the general partner of Moose Pond Investments, LP and has voting and dispositive power over the shares held by Moose Pond Investments, LP. Mr. Sharples’ address is 1011 W. 5th St., Suite 300, Austin, Texas 78701. Mr. Sharples is a member of our board of directors. For a discussion of our material relationships with Mr. Sharples, see the section titled “Certain Relationships and Related Party Transactions.” |
| (14) | Includes 757,364 shares issuable upon the exercise of options exercisable within 60 days of October 31, 2013. Also includes 471,456 shares held by trusts for the benefit of Mr. Cunningham’s immediate family members. Mr. Cunningham is our President, Chief Executive Officer and Chairman of the Board. For a discussion of our material relationships with Mr. Cunningham, see the section titled “Certain Relationships and Related Party Transactions.” |
| (15) | Represents shares issuable upon the exercise of options exercisable within 60 days of October 31, 2013. Ms. Beougher is our Chief Operating Officer. |
| (16) | Represents shares issuable upon the exercise of options exercisable within 60 days of October 31, 2013. Mr. Jeffries is our Chief Financial Officer. |
| (17) | Includes 1,928,578 shares issuable upon the exercise of options exercisable within 60 days of October 31, 2013. |
| (18) | Thomas P. Borders, M. Carmel Borders and Joshua Borders are members of the board of directors of Midtown Group, Inc., the general partner of Arbor Green II, LP, and share voting and/or dispositive power over the shares held by Arbor Green II, LP. |
| (19) | Bevan Heath Clark is the sole director of Clark/Kirk Holdings Pty Ltd ACN 147 455 767, or Clark/Kirk ACN, and has voting and dispositive power over the shares held by Clark/Kirk ACN, as trustee for the Clark/Kirk Holdings Trust, or the Clark/Kirk Holdings Trust. Such persons and entities disclaim beneficial ownership over the shares held by the Clark/Kirk Holdings Trust, except to the extent of any pecuniary interest therein. Mr. Clark is entitled to board observer rights. Clark/Kirk ACN, as trustee for the Clark/Kirk Holdings Trust, is affiliated with a broker-dealer. Clark/Kirk ACN acquired the securities in the ordinary course of business and did not, at the time of acquisition of our securities, have any agreement, understanding or arrangement with any other person, either directly or indirectly, to dispose of the securities. |
128
Table of Contents
| (20) | Google Ventures 2011 GP, L.L.C. is the general partner of Google Ventures 2011, L.P. Voting and dispositive power with respect to the shares held by Google Ventures 2011, L.P. reside with the Google Ventures Investment Committee. The address of Google Ventures 2011, L.P. is 1600 Amphitheatre Parkway, Mountain View, California 94043. For a discussion of our material relationships with Google Ventures 2011 GP, L.L.C., and Google Ventures 2011, L.P., see the section titled “Certain Relationships and Related Party Transactions. |
| (21) | Represents 29,936 shares issuable upon the exercise of options exercisable within 60 days of October 31, 2013. Mr. Aylor is our Vice President of Finance |
| (22) | Represents 137,250 shares issuable upon the exercise of options exercisable within 60 days of October 31, 2013. Ms. Balis is our Senior Vice President of Marketing. |
| (23) | Includes 104,424 shares issuable upon the exercise of options exercisable within 60 days of October 31, 2013. Mr. Bath is our Senior Vice President of Product. |
| (24) | Represents 101,250 shares issuable upon the exercise of options exercisable within 60 days of October 31, 2013. |
| (25) | Includes 64,638 shares issuable upon the exercise of options exercisable within 60 days of October 31, 2013. |
| (26) | François Larvor is the chief executive officer of INVENTUZ and has voting and dispositive power over the shares held by INVENTUZ. |
| (27) | Olivier David is the chief executive officer of MOUVEO and has voting and dispositive power over the shares held by MOUVEO. |
| (28) | Includes 54,479 shares issuable upon the exercise of options exercisable within 60 days of October 31, 2013. Mr. Pho is our Senior Vice President Corporate Development. |
| (29) | Represents 142,650 shares issuable upon the exercise of options exercisable within 60 days of October 31, 2013. Mr. Rogers is our Chief Technology Officer. |
| (30) | Thomas P. Borders, M. Carmel Borders and Joshua Borders are members of the board of directors of Midtown Group, Inc., the general partner of MTG Portfolio, Ltd., and share voting and/or dispositive power over the shares held by MTG Portfolio, Ltd. |
129
Table of Contents
The following is a summary of our capital stock and certain provisions of our amended and restated certificate of incorporation and amended and restated bylaws. This summary does not purport to be complete and is qualified in its entirety by the provisions of our amended and restated certificate of incorporation and amended and restated bylaws, which have been filed with the SEC and are incorporated by reference to the registration statement of which this prospectus is a part.
Our authorized capital stock consists of 150,000,000 shares of Series 1 common stock, $0.001 par value, 6,107,494 shares of Series 2 common stock, $0.001 par value, and 10,000,000 shares of undesignated preferred stock, $0.001 par value.
Common Stock
As of September 30, 2013, there were 44,453,021 shares of our Series 1 common stock and 6,107,494 shares of our Series 2 common stock outstanding that were held of record by approximately 31 stockholders.
The holders of Series 1 common stock are entitled to one vote per share on all matters submitted to a vote of our stockholders and do not have cumulative voting rights. The holders of Series 2 common stock are entitled to one vote per share on all matters submitted to a vote of our stockholders other than the election of members of the board of directors and do not have cumulative voting rights. Accordingly, holders of a majority of the shares of Series 1 common stock entitled to vote in any election of directors may elect all of the directors standing for election. Subject to preferences that may be applicable to any preferred stock outstanding at the time, the holders of outstanding shares of Series 1 common stock and Series 2 common stock are entitled to receive ratably any dividends declared by our board of directors out of assets legally available. See the section titled “Dividend Policy.” Upon our liquidation, dissolution or winding up, holders of our Series 1 common stock and Series 2 common stock are entitled to share ratably in all assets remaining after payment of liabilities and the liquidation preference of any then outstanding shares of preferred stock. Holders of Series 1 common stock have no preemptive or conversion rights or other subscription rights. Holders of Series 2 common stock have no preemptive or subscriptions rights; shares of Series 2 common stock may be converted into an equal number of shares of Series 1 common stock at any time at the election of the holder thereof. There are no redemption or sinking fund provisions applicable to the common stock. All outstanding shares of common stock are, and all shares of common stock to be outstanding upon completion of this offering will be, fully paid and nonassessable.
Preferred Stock
Pursuant to our amended and restated certificate of incorporation, our board of directors has the authority, without further action by the stockholders, to issue from time to time up to 10,000,000 shares of preferred stock, in one or more series. Our board of directors will determine the rights, preferences, privileges and restrictions of the preferred stock, including dividend rights, conversion rights, voting rights, terms of redemption, liquidation preferences, sinking fund terms and the number of shares constituting any series or the designation of any series, any or all of which may be greater than or senior to the rights of the common stock. The issuance of preferred stock could adversely affect the voting power of holders of common stock and reduce the likelihood that such holders will receive dividend payments and payments upon liquidation, and the likelihood that holders of preferred stock will receive dividend payments and payments upon liquidation may have the effect of delaying, deterring or preventing a change in control, which could depress the market price of our common stock. We have no current plan to issue any shares of preferred stock.
Warrants
As of December 31, 2012, Escalate Capital Partners SBIC I, L.P. held a warrant to purchase 457,796 shares of the Series 1 common stock of the Company at an exercise price of $0.004 per share. Such warrant grants Escalate Capital Partners SBIC I, L.P. the right to demand that we register some or all of the shares subject to the warrant in connection with this offering. The warrant was exercised by Escalate Capital Partners SBIC I, L.P. on March 22, 2013.
130
Table of Contents
Registration Rights
In October 2011, we entered into an investors’ rights agreement, as amended, with certain holders of our common stock. Subject to the terms of this agreement, holders of shares of our common stock have registration rights, which includes demand registration rights, piggyback registration rights and short-form registration rights. The following description of the terms of the investors’ rights agreement is intended as a summary only and is qualified in its entirety by reference to the investors’ rights agreement filed with the SEC and is incorporated by reference to the registration statement of which this prospectus is a part.
The holder of 380,901 shares of our Series 1 common stock has piggyback registration rights pursuant to the terms of a warrant dated November 24, 2010.
The holders of shares of our common stock have waived their rights to demand and piggyback registration of their shares until the expiration of the lock-up period applicable to this offering. See the section titled “Underwriting.”
The registration rights described below, granted pursuant to the investor’s rights agreement, will terminate, with respect to any particular stockholder, upon the earlier of (i) five years after the completion of this offering, or (ii) any time after this offering in which all registrable securities held by the particular stockholder may be sold under Rule 144 without registration under the Securities Act during a 60-day period. Each party to the investor’s rights agreement agreed not to sell or otherwise dispose of any shares of our common stock for a period of 180 days following our initial public offering.
Demand Registration Rights
At any time following our initial public offering, but subject to certain exceptions, the holders of two-thirds of then outstanding registrable securities with demand registration rights may demand that we effect a registration under the Securities Act covering the public offering and sale of all or part of the registrable securities held by those stockholders. Upon any such demand and as soon as practicable, we must effect the registration of the registrable securities that we have been requested to register, together with all other registrable securities that we may have been requested to register by other stockholders pursuant to the piggyback registration rights described below. These registration rights are subject to specified conditions and limitations, including the right of the underwriters, if any, to limit the number of shares included in any such registration under specified circumstances. In addition, we are not obligated to effect a demand registration within 12 months after the effective date of the first demand registration, if we have already effected two demand registrations and the requesting holders are able to register and sell two-thirds of the registrable securities requested to be included in such registration or if the proposed aggregate offering price of the shares to be registered by the holders requesting registration is at least $10.0 million.
We have the ability to delay the filing of a registration statement, subject to certain restrictions, if the board of directors determines in its judgment that it would be materially detrimental to the Company and its stockholders for such registration to be effected at such time.
Piggyback Registration Rights
All parties to the investors’ rights agreement have piggyback registration rights. Under these provisions, if at any time after the consummation of our initial public offering, we propose to register any securities under the Securities Act, excluding pursuant to any stockholder-initiated demand registration, and the registration form to be used may be used for the registration of the registrable securities, these stockholders have the right to include their shares in the registration statement, subject to certain exceptions including a registration related solely to an employee benefit plan. These piggyback registration rights are subject to specified conditions and limitations, including the right of the underwriters to limit the number of shares included in any such registration under specified circumstances. The Company has received waivers of these piggyback registration rights with respect to this offering from the requisite holders.
131
Table of Contents
Pursuant to the terms of the warrant dated November 24, 2010 issued to Escalate Capital Partners SBIC I, L.P., if the Company determines to register any shares of its Series 1 common stock, Escalate shall have the right to include any shares issued pursuant to the exercise of the warrant in such registration, subject to certain exceptions. Escalate has waived its piggyback registration rights with respect to this offering.
Short-Form Registration Rights
Following our initial public offering, the Company is required by the investors’ rights agreement to use all reasonable efforts to qualify for registration on Form S-3. If we become eligible to file registration statements on Form S-3, the holders of at minimum 2,375,000 shares of the then outstanding registrable securities may request in writing that we effect a registration on Form S-3 under the Securities Act, so long as the proposed aggregate offering price of the shares to be registered by the holders requesting registration is at least $2.5 million, subject to certain exceptions.
We have the ability to delay the filing of a registration statement, subject to certain restrictions, if the board of directors determines in its judgment that it would be materially detrimental to the Company and its stockholders for such registration to be effected at such time.
Expenses of Registration
With specified exceptions, we are required to pay all expenses of registration, excluding underwriters’ discounts, commissions and stock transfer taxes.
Anti-Takeover Provisions Under Our Charter and Bylaws and Delaware Law
Certain provisions of Delaware law and our amended and restated certificate of incorporation and amended and restated bylaws, contain provisions that could have the effect of delaying, deferring or discouraging another party from acquiring control of us. These provisions, which are summarized below, may have the effect of discouraging coercive takeover practices and inadequate takeover bids. These provisions are also designed, in part, to encourage persons seeking to acquire control of us to first negotiate with our board of directors. We believe that the benefits of increased protection of our potential ability to negotiate with an unfriendly or unsolicited acquirer outweigh the disadvantages of discouraging a proposal to acquire us because negotiation of these proposals could result in an improvement of their terms.
Amended and Restated Certificate of Incorporation
Undesignated Preferred Stock. As discussed above, our board of directors has the ability to issue preferred stock with voting or other rights or preferences that could impede the success of any attempt to change control of us. These and other provisions may have the effect of deferring hostile takeovers or delaying changes in control or management of our company.
Limitations on the Ability of Stockholders to Act by Written Consent or Call a Special Meeting. Our amended and restated certificate of incorporation provides that our stockholders may not act by written consent. This limit on the ability of our stockholders to act by written consent may lengthen the amount of time required to take stockholder actions. As a result, a holder controlling a majority of our capital stock would not be able to amend our amended and restated bylaws or remove directors without holding a meeting of our stockholders called in accordance with our amended and restated bylaws.
In addition, our amended and restated certificate of incorporation and amended and restated bylaws provide that special meetings of the stockholders may be called only by the chairperson of our board of directors, the chief executive officer or a majority of the board of directors. A stockholder may not call a special meeting, which may delay the ability of our stockholders to force consideration of a proposal or for holders controlling a majority of our capital stock to take any action, including the removal of directors.
132
Table of Contents
Requirements for Advance Notification of Stockholder Nominations and Proposals. Our amended and restated bylaws establish advance notice procedures with respect to stockholder proposals and the nomination of candidates for election as directors, other than nominations made by or at the direction of the board of directors or a committee of the board of directors. However, our amended and restated bylaws may have the effect of precluding the conduct of certain business at a meeting if the proper procedures are not followed. These provisions may also discourage or deter a potential acquirer from conducting a solicitation of proxies to elect the acquirer’s own slate of directors or otherwise attempting to obtain control of our company.
Classified Board. Our amended and restated certificate of incorporation and amended and restated bylaws provide that our board of directors is divided into three classes with staggered three-year terms. As a result, one class (i.e., approximately one-third of our board of directors) will be elected at each annual meeting of stockholders, with the other classes continuing for the remainder of their respective three-year terms. This provision may discourage a potential acquirer from making a tender offer or otherwise attempting to obtain control of us as it is more difficult and time-consuming for stockholders to replace a majority of the directors on a classified board.
Board Vacancies Filled Only by Majority of Directors. Vacancies and newly created seats on our board may be filled only by a majority of the number of then-authorized members of our board of directors. Only our board of directors may determine the number of directors on our board. The inability of stockholders to determine the number of directors or to fill vacancies or newly created seats on our board of directors makes it more difficult to change the composition of our board of directors, but these provisions promote a continuity of existing management.
No Cumulative Voting. The Delaware General Corporation Law provides that stockholders are not entitled to the right to cumulate votes in the election of directors unless our amended and restated certificate of incorporation provides otherwise. Our amended and restated certificate of incorporation provides that there shall be no cumulative voting and our amended and restated bylaws do not expressly provide for cumulative voting.
Directors Removed Only for Cause. Our amended and restated certificate of incorporation provides for the removal of a director only with cause and by the affirmative vote of the holders of at least sixty-six and two-thirds percent (66 2⁄3%) of the shares then entitled to vote at an election of our directors.
Amendment of Charter Provisions. The amendment of the provisions in our amended and restated certificate of incorporation requires approval by holders of at least sixty-six and two-thirds percent (66 2/3%) of our outstanding capital stock entitled to vote generally in the election of directors (in addition to any rights of the holders of our outstanding capital stock to vote on such amendment under the Delaware General Corporation Law). The amendment of the provisions in our amended and restated bylaws requires approval by either a majority of our board of directors or holders of at least sixty-six and two-thirds percent (66 2/3%) of our outstanding capital stock entitled to vote generally in the election of directors (in addition to any rights of the holders of our outstanding capital stock to vote on such amendment under the Delaware General Corporation Law).
Delaware Anti-Takeover Statute. We are subject to Section 203 of the Delaware General Corporation Law which regulates corporate acquisitions of publicly held companies. This law provides that a specified person who, together with affiliates and associates, owns, or within three years did own, 15% or more of the outstanding voting stock of a publicly held Delaware corporation, or an interested stockholder, may not engage in business combinations with the corporation for a period of three years after the date on which the person became an interested stockholder, unless the business combination or the transaction in which the person became an interested stockholder is approved in advance in a manner prescribed by Delaware law. The law does not include interested stockholders prior to the time our Series 1 common stock is listed on the NASDAQ Global Select Market. The law defines the term “business combination” to include mergers, asset sales and other transactions in which the interested stockholder receives or could receive a financial benefit on other than a pro rata basis with
133
Table of Contents
other stockholders. This provision has an anti-takeover effect with respect to transactions not approved in advance by our board of directors, including discouraging takeover attempts that might result in a premium over the market price for the shares of our Series 1 common stock. With approval of our stockholders, we could amend our amended and restated certificate of incorporation in the future to avoid the restrictions imposed by this anti-takeover law.
The provisions of Delaware law and our amended and restated certificate of incorporation could have the effect of discouraging others from attempting hostile takeovers and, as a consequence, they may also inhibit temporary fluctuations in the market price of our Series 1 common stock that often result from actual or rumored hostile takeover attempts. These provisions may also have the effect of preventing changes in our management. It is possible that these provisions could make it more difficult to accomplish transactions that stockholders may otherwise deem to be in their best interests.
Transfer Agent and Registrar
Our transfer agent and registrar for our Series 1 common stock is American Stock Transfer & Trust Company, LLC. The transfer agent’s address is 6201 15th Avenue, Brooklyn, New York 11219, and its telephone number is (718) 921-8200.
Listing
Our Series 1 common stock is listed on the NASDAQ Global Select Market under the symbol “SALE”.
134
Table of Contents
SHARES ELIGIBLE FOR FUTURE SALE
Future sales of substantial amounts of our common stock in the public market could reduce prevailing market prices. Furthermore, since a substantial number of shares will be subject to contractual and legal restrictions on resale as described below, sales of substantial amounts of our common stock in the public market after these restrictions lapse could adversely affect the prevailing market price and our ability to raise equity capital in the future.
Upon completion of this offering, we will have outstanding an aggregate of shares of Series 1 common stock and 6,107,494 shares of Series 2 common stock, assuming no exercise of outstanding options. Of these shares, (i) the 10,454,544 shares issued in our initial public offering are freely tradable without restriction or further registration under the Securities Act and (ii) all of the shares sold in this offering will be freely tradable without restriction or further registration under the Securities Act, unless these shares are purchased by “affiliates,” as that term is defined in Rule 144 under the Securities Act. The remaining shares of Series 1 common stock and 6,107,494 shares of Series 2 common stock held by existing stockholders are “restricted securities,” as that term is defined in Rule 144 under the Securities Act. Restricted securities may be sold in the public market only if registered or if their resale qualifies for an exemption from registration described below under Rules 144 or 701 promulgated under the Securities Act.
As a result of the contractual restrictions described below and the provisions of Rules 144 and 701, the restricted shares will be available for sale in the public market as follows:
| • | 0 shares will be eligible for sale upon completion of this offering; |
| • | shares will be eligible for sale upon the expiration of the lock-up agreements executed in connection with our initial public offering, described below, beginning January 15, 2014; and |
| • | shares will be eligible for sale upon the expiration of the lock-up agreements executed in connection with this offering, described below, beginning 90 days after the date of this prospectus. |
In addition, of the 5,555,499 shares of our Series 1 common stock that were subject to stock options outstanding as of September 30, 2013, options to purchase 1,655,465 shares were vested as of September 30, 2013. Shares issued upon the exercise of such vested options will be eligible for sale at various times after January 15, 2014, which is the date 180 days after the date of the final prospectus related to our initial public offering.
Lock-Up Agreements and Obligations
In connection with our initial public offering, we and all of our officers and directors, as well as the other holders of substantially all shares of common stock outstanding immediately prior to this offering, agreed that, without the prior written consent of Goldman, Sachs & Co. and Morgan Stanley & Co. LLC, on behalf of the underwriters, we and they will not to offer, pledge, sell, contract to sell, sell any option or contract to purchase, purchase any option or contract to sell, grant any option, right, or warrant to purchase, lend or otherwise transfer or dispose of, directly or indirectly, any shares of our common stock or any securities convertible into shares or exercisable or exchangeable for shares of our common stock, or enter into any swap or other arrangement for transfer to another, in whole or in part, any of the economic consequences of ownership of our common stock, until January 15, 2014. The agreement is subject to certain exceptions as set forth in the section titled “Underwriting.”
Each grant agreement under our 2007 Stock Plan and warrant agreement to purchase shares of our capital stock issued by us contains restrictions similar to those set forth in the lock-up agreements described above, limiting the disposition of securities issuable pursuant to those plans and agreements until January 15, 2014, which is the date 180 days after the date of the final prospectus related to our initial public offering.
135
Table of Contents
In addition, in connection with this offering, we and all of our executive officers, directors, as well as all of the selling and certain other stockholders have signed lock-up agreements under which we and they have agreed not to sell, transfer or dispose of, directly or indirectly, any shares of our common stock or any securities convertible into or exercisable or exchangeable for shares of our common stock without the prior written consent of Goldman, Sachs & Co. and Morgan Stanley & Co. LLC for a period of 90 days after the date of this prospectus. These agreements do not apply to sales of up to approximately 25,000 shares of our common stock pursuant to plans established pursuant to Rule 10b5-1 under the Exchange Act by certain of our executive officers. The agreements are also subject to certain exceptions as set forth in the section of this prospectus titled “Underwriting.”
10b5-1 Plans
Certain of our employees, including certain of our executive officers and directors, have entered into written trading plans that are intended to comply with Rule 10b5-1 under the Exchange Act of 1934 . These plans permit the automatic trading of our common stock by an independent person (such as a stock broker) who is not aware of material, nonpublic information at the time of the trade and generally provide for sales to occur from time to time after the expiration of the lock-up period related to our initial public offering, which period is scheduled to expire on January 15, 2014. Sales of shares under those plans by any employee who has entered into a plan who participates as a selling stockholder in this offering, will not be made before March 31, 2014. Sales of shares under these plans by any executive officer who has entered into a plan but who is not a selling stockholder in this offering may be made before March 31, 2014. The maximum number of shares of our common stock that may be sold under these plans by our executive officers before March 31, 2014 is approximately 25,000.
Rule 144
In general, under Rule 144 as currently in effect, a person (or persons whose shares are aggregated) who is not deemed to have been an affiliate of ours at any time during the three months preceding a sale, and who has beneficially owned restricted securities within the meaning of Rule 144 for a least six months (including any period of consecutive ownership of preceding non-affiliated holders) would be entitled to sell those shares, subject only to the availability of current public information about us. A non-affiliated person who has beneficially owned restricted securities within the meaning of Rule 144 for at least one year would be entitled to sell those shares without regard to the provisions of Rule 144.
In general, under Rule 144 as currently in effect, our affiliates or persons selling shares on behalf of our affiliates who own shares that were acquired from us or an affiliate of ours at least six months prior to the proposed sale are entitled to sell upon expiration of the lock-up agreements described above, within any three-month period, a number of shares that does not exceed the greater of:
| • | 1% of the number of shares of Series 1 common stock then outstanding, which will equal approximately shares immediately after this offering; and |
| • | The average weekly trading volume of the Series 1 common stock during the four calendar weeks preceding the filing of a notice on Form 144 with respect to such sale. |
Sales under Rule 144 by our affiliates or persons selling shares on behalf of our affiliates are also subject to certain manner of sale provisions and notice requirements and to the availability of current public information about us.
Rule 701
Rule 701 of the Securities Act, as currently in effect, permits any of our employees, officers, directors or consultants who purchased or received shares from us pursuant to a written compensatory plan or contract to
136
Table of Contents
resell such shares in reliance upon Rule 144, but without compliance with certain restrictions. Subject to any applicable lock-up agreements, Rule 701 provides that affiliates may sell their Rule 701 shares under Rule 144 without complying with the holding period requirement of Rule 144 and that non-affiliates may sell such shares in reliance on Rule 144 without complying with the holding period, public information, volume limitation or notice requirements of Rule 144.
Registration Rights
The holders of an aggregate of shares of our Series 1 common stock (including shares of Series 1 common stock issuable upon conversion of our Series 2 common stock), or their transferees, are entitled to rights with respect to the registration of their shares under the Securities Act. Registration of these shares under the Securities Act would result in these shares becoming freely tradable without restriction under the Securities Act immediately upon the effectiveness of such registration.
Form S-8 Registration Statements
We filed a registration statement on Form S-8 under the Securities Act to register the shares of our Series 1 common stock that are issuable pursuant to our 2007 Stock Plan, 2013 Equity Incentive Plan and 2013 Employee Stock Purchase Plan. See the section titled “Executive Compensation—Benefit Plans.” Subject to the lock-up agreements described above, other contractual lock-up obligations set forth in the grant agreements under each such plan and any applicable vesting restrictions, shares registered under these registration statements became available for resale in the public market immediately upon the effectiveness of the registration statement, except with respect to Rule 144 volume limitations that apply to our affiliates.
137
Table of Contents
MATERIAL U.S. FEDERAL TAX CONSEQUENCES TO NON-U.S. HOLDERS OF SERIES 1 COMMON STOCK
This section summarizes the material U.S. federal income and estate tax consequences of the ownership and disposition of our Series 1 common stock by a non-U.S. holder. For purposes of this summary, a “non-U.S. holder” is any beneficial owner that for U.S. federal income tax purposes is not a U.S. person. The term “U.S. person” means:
| • | an individual citizen or resident of the U.S.; |
| • | a corporation or entity treated as a corporation for U.S. federal income tax purposes, created or organized under the laws of the U.S. or any state, including the District of Columbia or otherwise treated as such for U.S. federal income tax purposes; |
| • | an estate whose income is subject to U.S. federal income tax regardless of source; or |
| • | a trust (i) whose administration is subject to the primary supervision of a court within the U.S. and which has one or more U.S. persons who have authority to control all substantive decisions of the trust or (ii) which has a valid election in effect under applicable U.S. Treasury regulations to be treated as a U.S. person. |
Generally, an individual may be treated as a resident of the U.S. in any calendar year for U.S. federal income tax purposes by, among other ways, being present in the U.S. for at least 31 days in that calendar year and for an aggregate of at least 183 days during a three-year period ending in the current calendar year. For purposes of this calculation, such individual would count all of the days in which the individual was present in the current year, one-third of the days present in the immediately preceding year, and one-sixth of the days present in the second preceding year. Residents are taxed for U.S. federal income tax purposes as if they were citizens of the U.S.
If a partnership, including any entity treated as a partnership for U.S. federal income tax purposes, is a beneficial owner of Series 1 common stock, the tax treatment of a partner in the partnership will depend upon the status of the partner and the activities of the partnership. Partnerships that are beneficial owners of our Series 1 common stock, and partners in such partnerships, should consult their tax advisors regarding the tax consequences to them of the ownership and disposition of our Series 1 common stock.
This summary applies only to non-U.S. holders who acquire our Series 1 common stock pursuant to this offering and who hold our Series 1 common stock as a capital asset (generally property held for investment). This summary generally does not address tax considerations that may be relevant to particular investors because of their specific circumstances, or because they are subject to special rules. Certain former U.S. citizens or long-term residents, controlled foreign corporations, passive foreign investment companies, corporations that accumulate earnings to avoid U.S. federal income tax, life insurance companies, tax-exempt organizations, dealers in securities or currencies, brokers, banks or other financial institutions, certain trusts, hybrid entities, pension funds and investors that hold our Series 1 common stock as part of a hedge, straddle or conversion transaction are among those categories of potential investors that are subject to special rules not covered in this discussion. This summary does not consider the tax consequences for partnerships, entities classified as a partnership for U.S. federal income tax purposes or persons who hold their interests through a partnership or other entity classified as a partnership for U.S. federal income tax purposes. This summary does not address any U.S. federal gift tax consequences, or state or local or non-U.S. tax consequences. This summary does not provide a complete analysis of all potential tax considerations. The information provided below is based on existing authorities. These authorities may change, or the Internal Revenue Service, or IRS, might interpret the existing authorities differently. In either case, the tax considerations of owning or disposing of Series 1 common stock could differ from those described below.
INVESTORS CONSIDERING THE PURCHASE OF SERIES 1 COMMON STOCK SHOULD CONSULT THEIR OWN TAX ADVISORS REGARDING THE APPLICATION OF THE U.S. FEDERAL INCOME AND ESTATE TAX LAWS TO THEIR PARTICULAR SITUATIONS AND THE CONSEQUENCES OF OTHER U.S. FEDERAL, STATE, LOCAL OR NON-U.S. LAWS AND ANY APPLICABLE TAX TREATIES.
138
Table of Contents
Dividends
Payments of cash and other property that we make to our shareholders with respect to our Series 1 common stock will constitute dividends to the extent paid from our current or accumulated earnings and profits, as determined under U.S. federal income tax principles. To the extent those dividends exceed our current and accumulated earnings and profits, the dividends will constitute a return of capital and will first reduce a holder’s basis, but not below zero, and then will be treated as gain from the sale of stock.
The gross amount of any dividend (out of earnings and profits) paid to a non-U.S. holder of Series 1 common stock generally will be subject to U.S. withholding tax at a rate of 30% unless the holder is entitled to an exemption from or reduced rate of withholding under an applicable income tax treaty. In order to receive an exemption or a reduced treaty rate, prior to the payment of a dividend, a non-U.S. holder must provide us with an IRS Form W-8BEN (or successor form) certifying qualification for the exemption or reduced rate.
Dividends received by a non-U.S. holder that are effectively connected with a U.S. trade or business conducted by the non-U.S. holder (and dividends attributable to a non-U.S. holder’s permanent establishment in the U.S. if an income tax treaty applies) are exempt from this withholding tax. To obtain this exemption, prior to the payment of a dividend, a non-U.S. holder must provide us with an IRS Form W-8ECI (or successor form) properly certifying this exemption. Effectively connected dividends (or dividends attributable to a permanent establishment in the U.S. if an income tax treaty applies), although not subject to withholding tax, are taxed at the same graduated rates applicable to U.S. persons, net of certain deductions and credits. In addition, dividends received by a corporate non-U.S. holder that are effectively connected with a U.S. trade or business of the corporate non-U.S. holder (or dividends attributable to a corporate non-U.S. holder’s permanent establishment in the U.S. if an income tax treaty applies) may also be subject to a branch profits tax at a rate of 30% (or such lower rate as may be specified by an applicable income tax treaty).
A non-U.S. holder who provides us with an IRS Form W-8BEN or an IRS Form W-8ECI will be required to periodically update such form.
A non-U.S. holder of Series 1 common stock that is eligible for a reduced rate of withholding tax pursuant to an income tax treaty may obtain a refund of any excess amounts currently withheld if an appropriate claim for refund is timely filed with the IRS.
Gain on Disposition of Series 1 Common Stock
A non-U.S. holder will generally not be subject to U.S. federal income tax on any gains realized on the sale, exchange or other disposition of Series 1 common stock unless:
| • | the gain is effectively connected with a U.S. trade or business of the non-U.S. holder (or attributable to a permanent establishment in the U.S. if an income tax treaty applies), in which case the non-U.S. holder generally will be required to pay tax on the net gain derived from the sale under regular graduated U.S. federal income tax rates and, if the non-U.S. holder is a corporation, the branch profits tax may apply, at a 30% rate or such lower rate as may be specified by an applicable income tax treaty; |
| • | the non-U.S. holder is an individual who is present in the U.S. for a period or periods aggregating 183 days or more during the calendar year in which the sale or disposition occurs and certain other conditions are met, in which case the non-U.S. holder will be required to pay a flat 30% tax (or such lower rate as may be specified by an applicable income tax treaty between the U.S. and such non-U.S. holder’s country of residence) on the net gain derived from the disposition, which tax may be offset by U.S. source capital losses, if any, provided that the non-U.S. holder has timely filed U.S. federal income tax returns with respect to such losses; or |
| • | our Series 1 common stock constitutes a U.S. real property interest by reason of our status as a “U.S. real property holding corporation” for U.S. federal income tax purposes at any time within the shorter |
139
Table of Contents
| of the five-year period preceding the disposition or the holder’s holding period for our Series 1 common stock. We believe that we are not currently, and we are not likely to become, a “U.S. real property holding corporation” for U.S. federal income tax purposes. |
If we become a U.S. real property holding corporation after this offering, so long as our Series 1 common stock is regularly traded on an established securities market and continues to be so traded, a non-U.S. holder will not be subject to U.S. federal income tax on gain recognized from the sale, exchange or other disposition of shares of our Series 1 common stock as a result of such status unless (i) such holder actually or constructively owned more than 5% of our Series 1 common stock at any time during the shorter of (A) the five-year period preceding the disposition, or (B) the holder’s holding period for our Series 1 common stock, and (ii) we were a U.S. real property holding corporation at any time during such period when the more than 5% ownership test was met. If any gain on your disposition is taxable because we are a U.S. real property holding corporation and your ownership of our Series 1 common stock exceeds 5%, you will be taxed on such disposition generally in the manner applicable to U.S. persons. Any such non-U.S. holder that owns or has owned, actually or constructively, more than 5% of our Series 1 common stock is urged to consult that holder’s own tax advisor with respect to the particular tax consequences to such holder for the gain from the sale, exchange or other disposition of shares of our Series 1 common stock if we were to be or to become a U.S. real property holding company.
Backup Withholding and Information Reporting
Generally, we must report annually to the IRS the amount of dividends paid, the name and address of the recipient, and the amount, if any, of tax withheld. A similar report is sent to the recipient. Pursuant to tax treaties or other agreements, the IRS may make its reports available to tax authorities in the non-U.S. holder’s country of residence.
Payments of dividends or of proceeds on the disposition of stock made to a non-U.S. holder may be subject to additional information reporting and backup withholding. Backup withholding will not apply if the non-U.S. holder establishes an exemption, for example, by properly certifying its non-U.S. person status on an IRS Form W-8BEN (or successor form). Notwithstanding the foregoing, backup withholding may apply if either we or our paying agent has actual knowledge, or reason to know, that the holder is a U.S. person.
Backup withholding is not an additional tax. Rather, the U.S. federal income tax liability of persons subject to backup withholding will be reduced by the amount of tax withheld. If withholding results in an overpayment of taxes, a credit or refund may be obtained from the IRS, provided that the required information is furnished to the IRS in a timely manner.
Legislation Relating to Foreign Accounts
Under legislation enacted in 2010, a 30% U.S. federal withholding tax will be imposed on dividends on stock of U.S. corporations, and on the gross proceeds from the disposition of such stock, paid to a “foreign financial institution” (as specially defined for this purpose), unless such institution enters into an agreement with the U.S. Treasury to collect and provide to the U.S. Treasury substantial information regarding its U.S. account holders and certain account holders that are foreign entities with U.S. owners. A 30% U.S. federal withholding tax will also apply to dividends paid on stock of U.S. corporations and on the gross proceeds from the disposition of such stock paid to a non-financial foreign entity unless such entity provides the withholding agent with a certification that it does not have any substantial U.S. owners or a certification identifying the direct and indirect substantial U.S. owners of the entity. The withholding taxes described above generally will apply to dividend payments made after June 30, 2014 and payments of gross proceeds made after December 31, 2016. Under certain circumstances, a non-U.S. holder may be eligible for refunds or credits of such withholding taxes. Investors are urged to consult with their own tax advisors regarding the possible application of these rules to their investment in our Series 1 common stock.
140
Table of Contents
U.S. Federal Estate Tax
The estates of nonresident alien individuals are generally subject to U.S. federal estate tax on property with a U.S. situs. Because we are a U.S. corporation, our Series 1 common stock will be U.S. situs property and therefore will be included in the taxable estate of a nonresident alien decedent. The U.S. federal estate tax liability of the estate of a nonresident alien may be affected by a tax treaty between the U.S. and the decedent’s country of residence.
THE PRECEDING DISCUSSION OF U.S. FEDERAL INCOME TAX CONSIDERATIONS IS FOR GENERAL INFORMATION ONLY. IT IS NOT TAX ADVICE. EACH PROSPECTIVE INVESTOR SHOULD CONSULT ITS OWN TAX ADVISOR REGARDING THE PARTICULAR U.S. FEDERAL, STATE, LOCAL AND NON-U.S. TAX CONSEQUENCES OF PURCHASING, HOLDING AND DISPOSING OF OUR SERIES 1 COMMON STOCK, INCLUDING THE CONSEQUENCES OF ANY PROPOSED CHANGE IN APPLICABLE LAWS.
141
Table of Contents
Under the terms and subject to the conditions in an underwriting agreement dated the date of this prospectus, the underwriters named below, for whom Goldman, Sachs & Co. and Morgan Stanley & Co. LLC and Credit Suisse Securities (USA) LLC are acting as representatives, have severally agreed to purchase, and we and the selling stockholders have agreed to sell to them, severally, the number of shares indicated below:
| Name |
Number of Shares | |
| Goldman, Sachs & Co. |
||
| Morgan Stanley & Co. LLC |
||
| Credit Suisse Securities (USA) LLC |
||
| Jefferies LLC |
||
| RBC Capital Markets Corporation |
||
| Stifel, Nicolaus & Company, Incorporated |
||
| William Blair & Company, L.L.C. |
||
| Total: |
||
|
|
The underwriters and the representatives are collectively referred to as the “underwriters” and the “representatives,” respectively. The underwriters are offering the shares of Series 1 common stock subject to their acceptance of the shares from us and subject to prior sale. The underwriting agreement provides that the obligations of the several underwriters to pay for and accept delivery of the shares of Series 1 common stock offered by this prospectus are subject to the approval of certain legal matters by their counsel and to certain other conditions. The underwriters are obligated to take and pay for all of the shares of Series 1 common stock offered by this prospectus if any such shares are taken. However, the underwriters are not required to take or pay for the shares covered by the underwriters’ option to purchase additional shares described below.
The underwriters initially propose to offer part of the shares of Series 1 common stock directly to the public at the offering price listed on the cover page of this prospectus and part to certain dealers at a price that represents a concession not in excess of $ per share under the public offering price. After the initial offering of the shares of Series 1 common stock, the offering price and other selling terms may from time to time be varied by the representative.
The selling stockholders have granted to the underwriters an option, exercisable for 30 days from the date of this prospectus, to purchase up to an aggregate of additional shares of Series 1 common stock at the public offering price listed on the cover page of this prospectus, less underwriting discounts and commissions. To the extent the option is exercised, each underwriter will become obligated, subject to certain conditions, to purchase about the same percentage of the additional shares of Series 1 common stock as the number listed next to the underwriter’s name in the preceding table bears to the total number of shares of common stock listed next to the names of all underwriters in the preceding table.
The following table shows the per share and total public offering price, underwriting discounts and commissions, and proceeds before expenses to us and the selling stockholders. These amounts are shown assuming both no exercise and full exercise of the underwriters’ option to purchase up to additional shares of Series 1 common stock.
| Per Share | Total | |||||
| No Exercise | Full Exercise | |||||
| Public offering price |
||||||
| Underwriting discounts and commissions to be paid by: |
||||||
| Us |
||||||
| The selling stockholders |
||||||
| Proceeds, before expenses, to us |
||||||
| Proceeds, before expenses, to selling stockholders |
||||||
142
Table of Contents
The estimated offering expenses payable by us, exclusive of the underwriting discounts and commissions, are approximately $0.8 million. We have agreed to reimburse the underwriters for Blue Sky and FINRA-related fees and expenses of the underwriters’ legal counsel, up to $10,000.
The underwriters have informed us that they do not intend sales to discretionary accounts to exceed 5% of the total number of shares of Series 1 common stock offered by them.
Our Series 1 common stock is listed on the NASDAQ Global Select Market under the trading symbol “SALE”.
In connection with our initial public offering, all of our directors and officers and the holders of substantially all of our outstanding stock and stock options entered into and are subject to lock-up agreements which provide that, without the prior written consent of Goldman, Sachs & Co. and Morgan Stanley & Co. LLC, on behalf of the underwriters, prohibit them from disposing of or hedging any of the common stock until January 15, 2014. For the purposes of this offering, Goldman, Sachs & Co. and Morgan Stanley & Co. LLC, on behalf of the underwriters, intend to release the restrictions under these lock-up agreements applicable to us and the selling stockholders to the extent necessary to permit the sale of shares offered in this offering.
In connection with this offering, we, all of our executive officers, directors and the selling and certain other stockholders have agreed that, without the prior written consent of Goldman, Sachs & Co. and Morgan Stanley & Co. LLC, on behalf of the underwriters, will not, during the period ending 90 days after the date of this prospectus:
| • | offer, pledge, sell, contract to sell, sell any option or contract to purchase, purchase any option or contract to sell, grant any option, right or warrant to purchase, lend or otherwise transfer or dispose of, directly or indirectly, any shares of common stock or any securities convertible into or exercisable or exchangeable for shares of common stock; |
| • | make any demand for or exercise any right or file or cause to be filed any registration statement, including any amendments thereto, with the Securities and Exchange Commission relating to the offering of any shares of common stock or any securities convertible into or exercisable or exchangeable for common stock; or |
| • | enter into any swap or other arrangement that transfers to another, in whole or in part, any of the economic consequences of ownership of the common stock. |
whether any such transaction described above is to be settled by delivery of our common stock or such other securities, in cash or otherwise. In addition, we and each such person agrees that, without the prior written consent of Goldman, Sachs & Co. and Morgan Stanley & Co. LLC, on behalf of the underwriters, we or such other person will not, during the restricted period, make any demand for, or exercise any right with respect to, the registration of any shares of our common stock or any security convertible into or exercisable or exchangeable for our common stock.
The restrictions described in the immediately preceding paragraph to do not apply to:
| • | the sale of shares to the underwriters; |
| • | transfers of shares of common stock or any security convertible into common stock as a bona fide gift or charitable contribution; |
| • | transfers of shares of common stock or any security convertible into common stock (i) to an immediate family member, (ii) by will, other testamentary document or intestate succession, (iii) to any trust or partnership for the direct or indirect benefit of the stockholder or immediate family of the stockholder, (iv) to a trustor or beneficiary of a trust, or (v) not involving a change of beneficial ownership; |
| • | transactions relating to shares of common stock or other securities acquired in open market transactions after the completion of this offering; |
143
Table of Contents
| • | transfers or distributions of shares of common stock or any security convertible into common stock to affiliates of the stockholder, including partners, members, managers, stockholders or other principals (or the estates of any such persons) of the stockholder; |
| • | transfers of shares of any security convertible into or exercisable or exchangeable for common stock to us in connection with (A) termination of service of an employee or other service provider and pursuant to agreements that provide the Company with the option to repurchase such shares, or (B) agreements that provide the Company with a right of first refusal with respect to transfers of such shares; |
| • | transfers to us in connection with the exercise of options or warrants; |
| • | the disposition of shares of common stock to us in a transaction exempt from Section 16(b) of the Exchange Act solely in connection with the payment of taxes due; |
| • | the establishment of a trading plan pursuant to Rule 10b5-1 under the Exchange Act for the transfer of shares of common stock, provided that such plan does not provide for the transfer of our common stock during the restricted period and no public announcement or filing under the Exchange Act shall be required or voluntarily made during the restricted period; |
| • | the issuance by us of shares of our common stock upon the exercise of outstanding options or warrants or in connection with the vesting of outstanding restricted stock units, or the conversion of outstanding securities; |
| • | the grant or issuance by us of shares of employee, consultant or director stock options or restricted stock or restricted stock units under stock plans described in this prospectus, provided that in the case of each such grant or issuance, such stock options, restricted stock or restricted stock units shall be subject to the Company’s standard vesting terms and a condition that no filing under the Exchange Act shall be required or shall be voluntarily made during the restricted period; |
| • | the filing by us of a registration statement with the Securities and Exchange Commission relating to the offering of securities in accordance with the terms of a plan described in this prospectus; or |
| • | the issuance by us of shares of common stock in an amount up to 8% of our outstanding shares of common stock in connection with a merger, acquisition, strategic commercial arrangement or other similar transaction; |
provided that in the case of any transfer, distribution grant or issuance as described in the second, third, fifth and thirteenth bullet points above, each recipient agrees to be subject to the restrictions described in the immediately preceding paragraph and any such transfer shall not involve a disposition for value; provided further that in the case of any transfer or distribution described in any of the bullet points above, no filing under Section 16(a) of the Exchange Act, reporting a reduction in beneficial ownership of shares of common stock, is required or shall be voluntarily made during the restricted period referred to above (other than a filing on a Form 5 made when required after the expiration of the restricted period described above). This agreement does not apply to sales of up to approximately 25,000 shares of our common stock pursuant to plans established pursuant to Rule 10b5-1 under the Exchange Act by certain of our executive officers. See the section titled “Shares Eligible for Future Sale” for a discussion of transfer restrictions.
Goldman, Sachs & Co. and Morgan Stanley & Co. LLC, on behalf of the underwriters, may release the common stock and other securities subject to the lock-up agreements described above in whole or in part at any time with or without notice. At least three business days before the effectiveness of any release or waiver of the restrictions described above in connection with any transfer of shares of common stock by an officer or director, Goldman, Sachs & Co. and Morgan Stanley & Co. LLC will notify us of the impending release or waiver of any restriction and we have agreed to announce the impending release or waiver by press release through a major news service at least two business days before the effective date of the release or waiver, except where the release or waiver is effected solely to permit a transfer of common stock that is not for consideration and where the transferee has agreed in writing to be bound by the same terms as the lock-up agreements described above to the extent and for the duration that such terms remain in effect at the time of transfer.
144
Table of Contents
To facilitate the offering of the Series 1 common stock, the underwriters may engage in transactions that stabilize, maintain or otherwise affect the price of the Series 1 common stock. Specifically, the underwriters may sell more shares than they are obligated to purchase under the underwriting agreement, creating a short position. A short sale is covered if the short position is no greater than the number of shares available for purchase by the underwriters under their option to purchase additional shares. The underwriters can close out a covered short sale by exercising their option to purchase additional shares or purchasing shares in the open market. In determining the source of shares to close out a covered short sale, the underwriters will consider, among other things, the open market price of shares compared to the price available under their option to purchase additional shares. The underwriters may also sell shares in excess of their option to purchase additional shares, creating a naked short position. The underwriters must close out any naked short position by purchasing shares in the open market. A naked short position is more likely to be created if the underwriters are concerned that there may be downward pressure on the price of the Series 1 common stock in the open market after pricing that could adversely affect investors who purchase in this offering. As an additional means of facilitating this offering, the underwriters may bid for, and purchase, shares of Series 1 common stock in the open market to stabilize the price of the Series 1 common stock. The underwriters may also impose a penalty bid. Penalty bids permit the underwriters to reclaim a selling concession form a syndicate member when the underwriters repurchase shares originally sold by that syndicate member in order to cover short positions or make stabilizing purchases. These activities may raise or maintain the market price of the Series 1 common stock above independent market levels or prevent or retard a decline in the market price of the Series 1 common stock. The underwriters are not required to engage in these activities and may end any of these activities at any time.
We, the selling stockholders and the underwriters have agreed to indemnify each other against certain liabilities, including liabilities under the Securities Act.
All of the underwriters in this offering were underwriters in our initial public offering.
The underwriters and their respective affiliates are full service financial institutions engaged in various activities, which may include securities trading, commercial and investment banking, financial advisory, investment management, investment research, principal investment, hedging, financing and brokerage activities. Certain of the underwriters and their respective affiliates have, from time to time, performed, and may in the future perform, various financial advisory, investment banking, commercial banking and lending services for the issuer, for which they received or will receive customary fees and expenses. For example, an affiliate of one of the underwriters has acted as a lender in connection with the Current Senior Debt, for which it receives customary fees and expenses.
In the ordinary course of their various business activities, the underwriters and their respective affiliates may make or hold a broad array of investments and actively trade debt and equity securities (or related derivative securities) and financial instruments (including bank loans) for their own account and for the accounts of their customers, and such investment and securities activities may involve securities and/or instruments of the issuer. The underwriters and their respective affiliates may also make investment recommendations and/or publish or express independent research views in respect of such securities or instruments and may at any time hold, or recommend to clients that they acquire, long and/or short positions in such securities and instruments.
A prospectus in electronic format may be made available on websites maintained by one or more underwriters, or selling group members, if any, participating in this offering. The representative may agree to allocate a number of shares of Series 1 common stock to underwriters for sale to their online brokerage account holders. Internet distributions will be allocated by the representative to underwriters that may make Internet distributions on the same basis as other allocations.
145
Table of Contents
Selling Restrictions
European Economic Area
In relation to each Member State of the European Economic Area which has implemented the Prospectus Directive (each, a “Relevant Member State”) an offer to the public of any shares of our Series 1 common stock may not be made in that Relevant Member State, except that an offer to the public in that Relevant Member State of any shares of our Series 1 common stock may be made at any time under the following exemptions under the Prospectus Directive, if they have been implemented in that Relevant Member State:
| (a) | to any legal entity which is a qualified investor as defined in the Prospectus Directive; |
| (b) | to fewer than 100 or, if the Relevant Member State has implemented the relevant provision of the 2010 PD Amending Directive, 150, natural or legal persons (other than qualified investors as defined in the Prospectus Directive), as permitted under the Prospectus Directive, subject to obtaining the prior consent of the representatives for any such offer; or |
| (c) | in any other circumstances falling within Article 3(2) of the Prospectus Directive, provided that no such offer of shares of our Series 1 common stock shall result in a requirement for the publication by us or any underwriter of a prospectus pursuant to Article 3 of the Prospectus Directive. |
For the purposes of this provision, the expression an “offer to the public” in relation to any shares of our Series 1 common stock in any Relevant Member State means the communication in any form and by any means of sufficient information on the terms of the offer and any shares of our Series 1 common stock to be offered so as to enable an investor to decide to purchase any shares of our Series 1 common stock, as the same may be varied in that Member State by any measure implementing the Prospectus Directive in that Member State, the expression “Prospectus Directive” means Directive 2003/71/EC (and amendments thereto, including the 2010 PD Amending Directive, to the extent implemented in the Relevant Member State), and includes any relevant implementing measure in the Relevant Member State, and the expression “2010 PD Amending Directive” means Directive 2010/73/EU.
United Kingdom
Each underwriter has represented and agreed that:
| (a) | it has only communicated or caused to be communicated and will only communicate or cause to be communicated an invitation or inducement to engage in investment activity (within the meaning of Section 21 of the FSMA) received by it in connection with the issue or sale of the shares of our Series 1 common stock in circumstances in which Section 21(1) of the FSMA does not apply to us; and |
| (b) | it has complied and will comply with all applicable provisions of the FSMA with respect to anything done by it in relation to the shares of our Series 1 common stock in, from or otherwise involving the United Kingdom. |
146
Table of Contents
DLA Piper LLP (US), Austin, Texas, will provide us with an opinion as to the validity of the Series 1 common stock offered under this prospectus. Wilson Sonsini Goodrich & Rosati, Professional Corporation, Austin, Texas, will pass upon certain legal matters related to this offering for the underwriters.
Our consolidated financial statements at December 31, 2012 and 2011 and for each of the three years in the period ended December 31, 2012, appearing in this prospectus and registration statement have been audited by Ernst & Young LLP, independent registered public accounting firm, as set forth in their report thereon appearing elsewhere herein, and are included in reliance upon such report given on the authority of such firm as experts in accounting and auditing. The financial statements of eConversions Limited at August 15, 2011 and December 31, 2010, and for the period from January 1, 2011 to August 15, 2011 and the year ended December 31, 2010, appearing in this prospectus and registration statement have been audited by Ernst & Young LLP, independent registered public accounting firm, as set forth in their report thereon appearing elsewhere herein, and are included in reliance upon such report given on the authority of such firm as experts in accounting and auditing.
The divisional financial statements of RetailMeNot.com as of November 24, 2010, and for the period January 1, 2010 through November 24, 2010, appearing in this prospectus and registration statement have been audited by Shinewing Hall Chadwick, independent registered public accounting firm, as set forth in their report thereon appearing elsewhere herein, and are included in reliance upon such report given on the authority of such firm as experts in accounting and auditing.
WHERE YOU CAN FIND ADDITIONAL INFORMATION
We have filed with the SEC a registration statement on Form S-1 under the Securities Act with respect to the shares of Series 1 common stock offered under this prospectus. As permitted under the rules and regulations of the SEC, this prospectus does not contain all of the information in and exhibits and schedules to the registration statement. For further information with respect to us and our Series 1 common stock, we refer you to the registration statement and its exhibits and schedules. Statements contained in this prospectus as to the contents of any contract or any other document referred to are not necessarily complete, and in each instance, we refer you to the copy of the contract or other document filed as an exhibit to the registration statement. Each of these statements is qualified in all respects by this reference. You may inspect a copy of any materials we file with the SEC, including the registration statement, without charge at the SEC’s Public Reference Room at 100 F Street, NE, Washington, D.C. 20549, and copies of all or any part of these documents may be obtained from the Public Reference Room of the SEC, 100 F Street, NE, Washington, DC 20549, upon payment of fees prescribed by the SEC. The SEC maintains an internet site that contains reports, proxy and information statements and other information regarding registrants that file electronically with the SEC. The address of the website is http://www.sec.gov. The public may obtain information on the operation of the Public Reference Room by calling the SEC at 1-800-SEC-0330.
We are subject to the information and reporting requirements of the Securities Exchange Act of 1934, as amended, and are required to file periodic reports, proxy statements and other information with the SEC. These periodic reports, proxy statements and other information are available for inspection and copying at the SEC’s Public Reference Room and the website of the SEC referred to above. We also maintain a website at www.investor.retailmenot.com. You may access these materials free of charge as soon as reasonably practicable after they are electronically filed with, or furnished to, the SEC. Information contained on our website is not a part of this prospectus.
We intend to furnish our stockholders with annual reports containing financial statements audited by our independent registered public accounting firm and quarterly reports for the first three fiscal quarters of each fiscal year containing unaudited interim financial information. Our telephone number is (512) 777-2970.
147
Table of Contents
| Page | ||||
| RetailMeNot, Inc. |
||||
| F-2 | ||||
| F-3 | ||||
| F-4 | ||||
| F-5 | ||||
| F-6 | ||||
| F-7 | ||||
| F-8 | ||||
| eConversions Limited (now known as RetailMeNot UK Ltd) |
||||
| F-37 | ||||
| F-38 | ||||
| F-39 | ||||
| F-40 | ||||
| F-41 | ||||
| F-42 | ||||
| RetailMeNot.com |
||||
| F-49 | ||||
| F-50 | ||||
| F-51 | ||||
| F-52 | ||||
| F-53 | ||||
| F-54 | ||||
F-1
Table of Contents
REPORT OF INDEPENDENT REGISTERED PUBLIC ACCOUNTING FIRM
The Board of Directors and Stockholders of RetailMeNot, Inc.
We have audited the accompanying consolidated balance sheets of RetailMeNot, Inc. as of December 31, 2012 and 2011, and the related consolidated statements of operations, comprehensive income, stockholders’ deficit and cash flows for each of the three years in the period ended December 31, 2012. These financial statements are the responsibility of the Company’s management. Our responsibility is to express an opinion on these financial statements based on our audits.
We conducted our audits in accordance with the standards of the Public Company Accounting Oversight Board (United States). Those standards require that we plan and perform the audit to obtain reasonable assurance about whether the financial statements are free of material misstatement. We were not engaged to perform an audit of the Company’s internal control over financial reporting. Our audits included consideration of internal control over financial reporting as a basis for designing audit procedures that are appropriate in the circumstances, but not for the purpose of expressing an opinion on the effectiveness of the Company’s internal control over financial reporting. Accordingly, we express no such opinion. An audit also includes examining, on a test basis, evidence supporting the amounts and disclosures in the financial statements, assessing the accounting principles used and significant estimates made by management and evaluating the overall financial statement presentation. We believe that our audits provide a reasonable basis for our opinion.
In our opinion, the financial statements referred to above present fairly, in all material respects, the consolidated financial position of RetailMeNot, Inc. at December 31, 2012 and 2011, and the consolidated results of its operations and its cash flows for each of the three years in the period ended December 31, 2012, in conformity with U.S. generally accepted accounting principles.
/s/ Ernst & Young LLP
Austin, Texas
April 5, 2013, except as to Notes 7, 9 and 11, which are as of July 24, 2013
F-2
Table of Contents
CONSOLIDATED BALANCE SHEETS
(in thousands, except share and per share amounts)
| As of December 31, |
As of September 30, 2013 |
|||||||||||
| 2011 | 2012 | |||||||||||
| (unaudited) | ||||||||||||
| Assets |
||||||||||||
| Current assets: |
||||||||||||
| Cash and cash equivalents |
$ | 88,234 | $ | 97,142 | $ | 136,408 | ||||||
| Accounts receivable (net of allowance for doubtful accounts of $295, and $933 and $ 957 (unaudited) at December 31, 2011 and 2012, and September 30, 2103, respectively) |
21,839 | 32,315 | 30,949 | |||||||||
| Prepaids and other current assets, net |
637 | 1,939 | 5,472 | |||||||||
|
|
|
|
|
|
|
|||||||
| Total current assets |
110,710 | 131,396 | 172,829 | |||||||||
| Property and equipment, net |
2,396 | 4,921 | 7,716 | |||||||||
| Intangible assets, net |
89,228 | 77,985 | 79,330 | |||||||||
| Goodwill |
142,917 | 152,755 | 168,626 | |||||||||
| Other assets, net |
2,075 | 3,863 | 3,670 | |||||||||
|
|
|
|
|
|
|
|||||||
| Total assets |
$ | 347,326 | $ | 370,920 | $ | 432,171 | ||||||
|
|
|
|
|
|
|
|||||||
| Liabilities, Redeemable Convertible Preferred Stock and Stockholders’ Equity (Deficit) |
||||||||||||
| Current liabilities: |
||||||||||||
| Accounts payable |
$ | 1,558 | $ | 4,640 | $ | 3,184 | ||||||
| Accrued compensation and benefits |
3,312 | 5,906 | 6,272 | |||||||||
| Accrued expenses and other current liabilities |
2,063 | 4,794 | 6,471 | |||||||||
| Income taxes payable |
5,034 | 1,254 | 808 | |||||||||
| Current maturities of long term debt |
20,112 | 16,650 | 14,972 | |||||||||
|
|
|
|
|
|
|
|||||||
| Total current liabilities |
32,079 | 33,244 | 31,707 | |||||||||
| Deferred tax liability—noncurrent |
6,268 | 6,631 | 8,484 | |||||||||
| Long term debt |
35,425 | 22,275 | 28,000 | |||||||||
| Other noncurrent liabilities |
1,045 | 1,116 | 1,534 | |||||||||
|
|
|
|
|
|
|
|||||||
| Total liabilities |
74,817 | 63,266 | 69,725 | |||||||||
|
|
|
|
|
|
|
|||||||
| Commitments and contingencies |
||||||||||||
| Redeemable convertible preferred stock: |
||||||||||||
| Series B-1: $0.001 par value 9,365,258 shares authorized and 6,993,977 shares issued and outstanding as of December 31, 2011 and 2012. No shares authorized, issued and outstanding as of September 30, 2013 (unaudited) |
28,698 | 30,841 | — | |||||||||
| Series B-2: $0.001 par value 28,964,412 shares authorized and 26,846,339 shares issued and outstanding as of December 31, 2011 and 2012. No shares authorized, issued and outstanding as of September 30, 2013 (unaudited) |
133,644 | 143,682 | — | |||||||||
| Series B-3: $0.001 par value 3,125,000 shares authorized and 3,053,747 shares issued and outstanding as of December 31, 2011 and 2012. No shares authorized, issued and outstanding as of September 30, 2013 (unaudited) |
50,625 | 54,636 | — | |||||||||
| Series BB-3: $0.001 par value 6,107,495 shares authorized and 6,107,494 shares issued and outstanding as of December 31, 2011 and 2012. No shares authorized, issued and outstanding as of September 30, 2013 (unaudited) |
101,251 | 109,273 | — | |||||||||
| Series B-4: $0.001 par value 996,481 shares authorized and 996,479 shares issued and outstanding as of December 31, 2011 and 2012. No shares authorized, issued and outstanding as of September 30, 2013 (unaudited) |
7,232 | 7,518 | — | |||||||||
| Series B-5: $0.001 par value 1,250,000 shares authorized and 182,425 shares issued and outstanding as of December 31, 2012. No shares authorized, issued and outstanding as of September 30, 2013 (unaudited) |
— | 3,077 | — | |||||||||
| Stockholders’ equity (deficit): |
||||||||||||
| Preferred stock: $0.001 par value, zero shares authorized, issued or outstanding as of December 31, 2011 and 2012; 10,000,000 shares authorized, zero shares issued and outstanding as of September 30, 2013 (unaudited) |
— | |||||||||||
| Series 1 common stock: $0.001 par value, 58,107,284 shares authorized; 849,729 and 947,953 shares issued and outstanding as of December 31, 2011 and 2012, respectively; 150,000,000 shares authorized, 44,453,021 shares issued and outstanding as of September 30, 2013 (unaudited) |
1 | 1 | 45 | |||||||||
| Series 2 common stock: $0.001 par value, 6,107,495 shares authorized; no shares issued or outstanding as of December 31, 2011 and 2012; 6,107,494 shares authorized, issued and outstanding as of September 30, 2013 (unaudited) |
— | — | 6 | |||||||||
| Additional paid-in capital |
4,176 | 8,579 | 414,068 | |||||||||
| Accumulated other comprehensive loss |
(2,292 | ) | (543 | ) | (91 | ) | ||||||
| Accumulated deficit |
(50,826 | ) | (49,410 | ) | (51,582 | ) | ||||||
|
|
|
|
|
|
|
|||||||
| Total stockholders’ equity (deficit) |
(48,941 | ) | (41,373 | ) | 362,446 | |||||||
|
|
|
|
|
|
|
|||||||
| Total liabilities, redeemable convertible preferred stock and stockholders’ equity (deficit) |
$ | 347,326 | $ | 370,920 | $ | 432,171 | ||||||
|
|
|
|
|
|
|
|||||||
See the accompanying notes, which are an integral part of these Consolidated Financial Statements.
F-3
Table of Contents
CONSOLIDATED STATEMENTS OF OPERATIONS
(in thousands, except per share amounts)
| Year Ended December 31, | Nine Months Ended September 30, | |||||||||||||||||||
| 2010 | 2011 | 2012 | 2012 | 2013 | ||||||||||||||||
| (unaudited) | (unaudited) | |||||||||||||||||||
| Net revenues |
$ | 16,862 | $ | 80,402 | $ | 144,685 | $ | 93,895 | $ | 131,312 | ||||||||||
| Costs and expenses: |
||||||||||||||||||||
| Cost of net revenues |
1,848 | 3,980 | 9,113 | 6,475 | 8,735 | |||||||||||||||
| Product development |
658 | 4,388 | 14,481 | 9,326 | 21,103 | |||||||||||||||
| Sales and marketing |
5,661 | 15,341 | 40,672 | 22,543 | 40,974 | |||||||||||||||
| General and administrative |
2,472 | 6,883 | 15,758 | 10,777 | 19,919 | |||||||||||||||
| Amortization of purchased intangible assets |
3,394 | 11,296 | 13,158 | 10,244 | 8,673 | |||||||||||||||
| Other operating expenses |
— | 35 | 6,006 | 2,611 | 1,299 | |||||||||||||||
|
|
|
|
|
|
|
|
|
|
|
|||||||||||
| Total costs and expenses |
14,033 | 41,923 | 99,188 | 61,976 | 100,703 | |||||||||||||||
|
|
|
|
|
|
|
|
|
|
|
|||||||||||
| Income from operations |
2,829 | 38,479 | 45,497 | 31,919 | 30,609 | |||||||||||||||
| Other income (expense): |
||||||||||||||||||||
| Interest expense, net |
(930 | ) | (7,784 | ) | (3,221 | ) | (2,519 | ) | (2,410 | ) | ||||||||||
| Fair value change of common stock warrant |
— | (2,103 | ) | — | — | — | ||||||||||||||
| Fair value change of contingent consideration, net |
1,994 | — | — | — | — | |||||||||||||||
| Other income (expense), net |
(16 | ) | (129 | ) | 77 | 49 | 451 | |||||||||||||
|
|
|
|
|
|
|
|
|
|
|
|||||||||||
| Income before income taxes |
3,877 | 28,463 | 42,353 | 29,449 | 28,650 | |||||||||||||||
| Provision for income taxes |
(1,533 | ) | (11,502 | ) | (16,360 | ) | (11,201 | ) | (10,959 | ) | ||||||||||
|
|
|
|
|
|
|
|
|
|
|
|||||||||||
| Net income |
$ | 2,344 | $ | 16,961 | $ | 25,993 | $ | 18,248 | $ | 17,691 | ||||||||||
|
|
|
|
|
|
|
|
|
|
|
|||||||||||
| Preferred stock dividends on participating preferred stock |
(3,247 | ) | (64,715 | ) | (24,577 | ) | (18,388 | ) | (19,928 | ) | ||||||||||
|
|
|
|
|
|
|
|
|
|
|
|||||||||||
| Total undistributed earnings (loss) |
(903 | ) | (47,754 | ) | 1,416 | (140 | ) | (2,237 | ) | |||||||||||
| Undistributed earnings allocated to participating preferred stock |
— | — | (1,390 | ) | — | — | ||||||||||||||
|
|
|
|
|
|
|
|
|
|
|
|||||||||||
| Net income (loss) attributable to common stockholders |
$ | (903 | ) | $ | (47,754 | ) | $ | 26 | $ | (140 | ) | $ | (2,237 | ) | ||||||
|
|
|
|
|
|
|
|
|
|
|
|||||||||||
| Net income (loss) per share attributable to common stockholders: |
||||||||||||||||||||
| Basic and diluted |
$ | (1.27 | ) | $ | (64.19 | ) | $ | 0.03 | $ | (0.17 | ) | $ | (0.16 | ) | ||||||
|
|
|
|
|
|
|
|
|
|
|
|||||||||||
| Weighted-average number of common shares used in computing net income (loss) per share: |
||||||||||||||||||||
| Basic |
709 | 744 | 841 | 821 | 13,703 | |||||||||||||||
|
|
|
|
|
|
|
|
|
|
|
|||||||||||
| Diluted |
709 | 744 | 2,277 | 821 | 13,703 | |||||||||||||||
|
|
|
|
|
|
|
|
|
|
|
|||||||||||
See the accompanying notes, which are an integral part of these Consolidated Financial Statements.
F-4
Table of Contents
CONSOLIDATED STATEMENTS OF COMPREHENSIVE INCOME
(in thousands)
| Year Ended December 31, | Nine Months Ended September 30, | |||||||||||||||||||
| 2010 | 2011 | 2012 | 2012 | 2013 | ||||||||||||||||
| (unaudited) | (unaudited) | |||||||||||||||||||
| Net income |
$ | 2,344 | $ | 16,961 | $ | 25,993 | $ | 18,248 | $ | 17,691 | ||||||||||
| Other comprehensive income, net of tax: |
||||||||||||||||||||
| Foreign currency translation adjustments |
— | (2,292 | ) | 1,749 | 1,480 | 452 | ||||||||||||||
|
|
|
|
|
|
|
|
|
|
|
|||||||||||
| Comprehensive income |
$ | 2,344 | $ | 14,669 | $ | 27,742 | $ | 19,728 | $ | 18,143 | ||||||||||
|
|
|
|
|
|
|
|
|
|
|
|||||||||||
See the accompanying notes, which are an integral part of these Consolidated Financial Statements.
F-5
Table of Contents
CONSOLIDATED STATEMENTS OF STOCKHOLDERS’ EQUITY (DEFICIT)
(in thousands, except share amounts)
| Series 1 Common Stock | Series 2 Common Stock | |||||||||||||||||||||||||||||||
| Number of Shares |
Amount | Number of Shares |
Amount | Additional Paid-In Capital |
Accumulated Deficit |
Accumulated Other Comprehensive Income (Loss) |
Total Stockholder’s Deficit |
|||||||||||||||||||||||||
| Balance at December 31, 2009 |
687,500 | $ | 1 | — | $ | — | $ | 2 | $ | (2,169 | ) | $ | — | $ | (2,166 | ) | ||||||||||||||||
| Net income |
— | — | — | — | — | 2,344 | — | 2,344 | ||||||||||||||||||||||||
| Issuances of common stock |
31,458 | — | — | — | 35 | — | — | 35 | ||||||||||||||||||||||||
| Exercise of unvested stock options |
45,477 | — | — | — | — | — | — | — | ||||||||||||||||||||||||
| Stock—based compensation expense |
— | — | — | — | 68 | — | — | 68 | ||||||||||||||||||||||||
| Accretion of preferred stock dividends |
— | — | — | — | — | (3,247 | ) | — | (3,247 | ) | ||||||||||||||||||||||
|
|
|
|
|
|
|
|
|
|
|
|
|
|
|
|
|
|||||||||||||||||
| Balance at December 31, 2010 |
764,435 | 1 | — | — | 105 | (3,072 | ) | — | (2,966 | ) | ||||||||||||||||||||||
| Net income |
— | — | — | — | — | 16,961 | — | 16,961 | ||||||||||||||||||||||||
| Foreign currency translation adjustment |
— | — | — | — | — | — | (2,292 | ) | (2,292 | ) | ||||||||||||||||||||||
| Exercise of stock options |
85,294 | — | — | — | 23 | — | — | 23 | ||||||||||||||||||||||||
| Reclassification of common stock warrant |
— | — | — | — | 3,577 | — | — | 3,577 | ||||||||||||||||||||||||
| Stock—based compensation expense |
— | — | — | — | 471 | — | — | 471 | ||||||||||||||||||||||||
| Preferred stock dividend from repurchase of preferred stock |
— | — | — | — | — | (49,927 | ) | — | (49,927 | ) | ||||||||||||||||||||||
| Accretion of preferred stock dividends |
— | — | — | — | — | (14,788 | ) | — | (14,788 | ) | ||||||||||||||||||||||
|
|
|
|
|
|
|
|
|
|
|
|
|
|
|
|
|
|||||||||||||||||
| Balance at December 31, 2011 |
849,729 | 1 | — | — | 4,176 | (50,826 | ) | (2,292 | ) | (48,941 | ) | |||||||||||||||||||||
| Net income |
— | — | — | — | — | 25,993 | 25,993 | |||||||||||||||||||||||||
| Foreign currency translation adjustment |
— | — | — | — | — | — | 1,749 | 1,749 | ||||||||||||||||||||||||
| Exercise of stock options |
98,224 | — | — | — | 355 | — | — | 355 | ||||||||||||||||||||||||
| Stock—based compensation expense |
— | — | — | — | 4,048 | — | — | 4,048 | ||||||||||||||||||||||||
| Accretion of preferred stock dividends |
— | — | — | — | — | (24,577 | ) | — | (24,577 | ) | ||||||||||||||||||||||
|
|
|
|
|
|
|
|
|
|
|
|
|
|
|
|
|
|||||||||||||||||
| Balance at December 31, 2012 |
947,953 | 1 | — | — | 8,579 | (49,410 | ) | (543 | ) | (41,373 | ) | |||||||||||||||||||||
| Net income (unaudited) |
— | — | — | — | — | 17,691 | — | 17,691 | ||||||||||||||||||||||||
| Issuance of common stock upon initial public offering, net of offering costs (unaudited) |
4,545,454 | 5 | — | — | 85,360 | — | — | 85,365 | ||||||||||||||||||||||||
| Conversion of preferred stock to common stock upon initial public offering (unaudited) |
38,072,967 | 38 | 6,107,494 | 6 | 310,165 | — | — | 310,209 | ||||||||||||||||||||||||
| Foreign currency translation adjustment (unaudited) |
— | — | — | — | — | — | 452 | 452 | ||||||||||||||||||||||||
| Exercise of common stock warrant (unaudited) |
457,796 | 1 | — | — | 1 | — | — | 2 | ||||||||||||||||||||||||
| Exercise of stock options (unaudited) |
428,851 | — | — | — | 1,608 | — | — | 1,608 | ||||||||||||||||||||||||
| Stock-based compensation expense (unaudited) |
— | — | — | — | 7,068 | — | — | 7,068 | ||||||||||||||||||||||||
| Excess income tax benefit from stock-based compensation (unaudited) |
— | — | — | — | 1,287 | — | — | 1,287 | ||||||||||||||||||||||||
| Accretion of preferred stock dividends (unaudited) |
— | — | — | — | — | (19,863 | ) | — | (19,863 | ) | ||||||||||||||||||||||
|
|
|
|
|
|
|
|
|
|
|
|
|
|
|
|
|
|||||||||||||||||
| Balance at September 30, 2013 (unaudited) |
44,453,021 | $ | 45 | 6,107,494 | $ | 6 | $ | 414,068 | $ | (51,582 | ) | $ | (91 | ) | $ | 362,446 | ||||||||||||||||
|
|
|
|
|
|
|
|
|
|
|
|
|
|
|
|
|
|||||||||||||||||
See the accompanying notes, which are an integral part of these Consolidated Financial Statements.
F-6
Table of Contents
CONSOLIDATED STATEMENTS OF CASH FLOWS
(in thousands)
| Year Ended December 31, | Nine Months Ended September 30, |
|||||||||||||||||||
| 2010 | 2011 | 2012 | 2012 | 2013 | ||||||||||||||||
| (unaudited) | (unaudited) | |||||||||||||||||||
| Cash flows from operating activities: |
||||||||||||||||||||
| Net income |
$ | 2,344 | $ | 16,961 | $ | 25,993 | $ | 18,248 | $ | 17,691 | ||||||||||
| Adjustments to reconcile net income to net cash provided by operating activities: |
||||||||||||||||||||
| Depreciation and amortization expense |
3,460 | 11,556 | 14,192 | 10,938 | 10,076 | |||||||||||||||
| Stock-based compensation expense |
68 | 471 | 4,048 | 2,559 | 7,068 | |||||||||||||||
| Deferred income tax (benefit) expense |
1,245 | 1,204 | (1,796 | ) | (1,680 | ) | (2,853 | ) | ||||||||||||
| Non-cash interest expense |
933 | 3,662 | 816 | 680 | 900 | |||||||||||||||
| Impairment of assets |
— | — | 4,924 | 1,962 | — | |||||||||||||||
| Amortization of deferred compensation |
— | — | 1,082 | 650 | 1,301 | |||||||||||||||
| Other non-cash expense and fair value change in liabilities, net |
(1,895 | ) | 2,405 | (104 | ) | (59 | ) | (64 | ) | |||||||||||
| Provision for doubtful accounts receivable |
57 | 213 | 604 | 30 | 142 | |||||||||||||||
| Changes in operating assets and liabilities: |
||||||||||||||||||||
| Accounts receivable, net |
(3,023 | ) | (13,696 | ) | (9,285 | ) | 3,736 | 2,323 | ||||||||||||
| Prepaid expenses and other current assets, net |
(96 | ) | (272 | ) | (983 | ) | (661 | ) | (1,723 | ) | ||||||||||
| Accounts payable |
105 | 798 | 2,975 | 318 | (1,347 | ) | ||||||||||||||
| Accrued expenses and other current liabilities |
(580 | ) | 6,479 | (251 | ) | (2,525 | ) | 1,982 | ||||||||||||
| Other noncurrent assets and liabilities |
(6 | ) | (416 | ) | 38 | 70 | (530 | ) | ||||||||||||
|
|
|
|
|
|
|
|
|
|
|
|||||||||||
| Net cash provided by operating activities |
2,612 | 29,365 | 42,253 | 34,266 | 34,966 | |||||||||||||||
|
|
|
|
|
|
|
|
|
|
|
|||||||||||
| Cash flows from investing activities: |
||||||||||||||||||||
| Payments for acquisition of businesses, net of acquired cash |
(131,250 | ) | (32,603 | ) | (10,290 | ) | (10,290 | ) | (16,400 | ) | ||||||||||
| Purchase of property and equipment |
(230 | ) | (1,808 | ) | (3,089 | ) | (2,078 | ) | (4,160 | ) | ||||||||||
| Purchase of other assets |
— | — | — | — | (851 | ) | ||||||||||||||
|
|
|
|
|
|
|
|
|
|
|
|||||||||||
| Net cash used in investing activities |
(131,480 | ) | (34,411 | ) | (13,379 | ) | (12,368 | ) | (21,411 | ) | ||||||||||
|
|
|
|
|
|
|
|
|
|
|
|||||||||||
| Cash flows from financing activities: |
||||||||||||||||||||
| Proceeds from notes payable, net of issuance costs |
55,349 | — | — | — | 8,094 | |||||||||||||||
| Payments on notes payable |
— | (29,427 | ) | (20,333 | ) | (18,108 | ) | (12,200 | ) | |||||||||||
| Proceeds from issuance of preferred stock, net of issuance costs |
86,215 | 177,860 | — | — | — | |||||||||||||||
| Payments for repurchase of preferred stock |
— | (70,000 | ) | — | — | — | ||||||||||||||
| Proceeds from exercise of options and warrants to purchase common stock |
51 | 173 | 251 | 226 | 1,652 | |||||||||||||||
| Excess income tax benefit from stock-based compensation |
— | — | — | 1,287 | ||||||||||||||||
| Payments of preferred stock dividends |
— | — | — | — | (58,682 | ) | ||||||||||||||
| Proceeds from initial public offering, net of offering costs |
— | — | — | — | 85,365 | |||||||||||||||
| Payments of principal on capital lease arrangements |
— | — | — | — | (8 | ) | ||||||||||||||
|
|
|
|
|
|
|
|
|
|
|
|||||||||||
| Net cash (used in) provided by financing activities |
141,615 | 78,606 | (20,082 | ) | (17,882 | ) | 25,508 | |||||||||||||
|
|
|
|
|
|
|
|
|
|
|
|||||||||||
| Effect of foreign currency exchange rate on cash |
— | (111 | ) | 116 | 78 | 203 | ||||||||||||||
|
|
|
|
|
|
|
|
|
|
|
|||||||||||
| Change in cash and cash equivalents |
12,747 | 73,449 | 8,908 | 4,094 | 39,266 | |||||||||||||||
| Cash and cash equivalents, beginning of period |
2,038 | 14,785 | 88,234 | 88,234 | 97,142 | |||||||||||||||
|
|
|
|
|
|
|
|
|
|
|
|||||||||||
| Cash and cash equivalents, end of period |
$ | 14,785 | $ | 88,234 | $ | 97,142 | $ | 92,328 | $ | 136,408 | ||||||||||
|
|
|
|
|
|
|
|
|
|
|
|||||||||||
| Supplemental disclosure of cash flow information |
||||||||||||||||||||
| Cash interest payments |
$ | — | $ | 4,188 | $ | 2,136 | $ | 1,645 | $ | 1,777 | ||||||||||
| Income tax payments |
$ | 88 | $ | 6,682 | $ | 22,080 | $ | 17,749 | $ | 12,479 | ||||||||||
| Supplemental disclosure of non-cash investing activities |
||||||||||||||||||||
| Issuance of common stock in connection with acquisition |
$ | 35 | $ | — | $ | — | $ | — | $ | — | ||||||||||
| Issuance of preferred stock in connection with acquisition |
$ | 20,000 | $ | 7,000 | $ | 3,000 | $ | 3,000 | $ | — | ||||||||||
| Issuance of notes payable in connection with acquisition |
$ | 11,924 | $ | 6,000 | $ | 3,500 | $ | 3,500 | $ | 6,085 | ||||||||||
| Supplemental disclosure of non-cash financing activities |
||||||||||||||||||||
| Issuance and reclassification of common stock warrant |
$ | (1,474 | ) | $ | 3,577 | $ | — | $ | — | $ | — | |||||||||
| Accretion of preferred stock dividends |
$ | 3,247 | $ | 14,788 | $ | 24,577 | $ | 18,388 | $ | 19,928 | ||||||||||
| Issuance and exercise of preferred stock warrants |
$ | (2,704 | ) | $ | 2,704 | $ | — | $ | — | $ | — | |||||||||
See the accompanying notes, which are an integral part of these Consolidated Financial Statements.
F-7
Table of Contents
Notes to Consolidated Financial Statements
1. Description of Business
We operate the world’s largest digital coupon marketplace, including the largest digital coupon marketplace in the U.S., RetailMeNot.com, and in the U.K., VoucherCodes.co.uk, connecting consumers with leading retailers and brands. Our websites, mobile applications, email newsletters and alerts and social media presence enable consumers to search for, discover and redeem relevant digital coupons from retailers and brands. Our marketplace features digital coupons across multiple product categories, including clothing; electronics; health and beauty; home and office; travel, food and entertainment; personal and business services; and shoes. We believe our investments in digital coupon content quality, product innovation and direct retailer relationships allow us to offer a compelling experience to consumers looking to save money, whether online or in-store.
2. Summary of Significant Accounting Policies
Basis of Presentation and Principles of Consolidation
The consolidated financial statements include the accounts of the Company and our wholly owned subsidiaries and have been prepared in accordance with accounting principles generally accepted in the United States of America, or U.S. GAAP. All significant intercompany transactions and balances have been eliminated.
Unaudited Interim Financial Information
The accompanying interim consolidated balance sheet as of September 30, 2013, the consolidated statements of operations, comprehensive income and cash flows for the nine months ended September 30, 2012 and 2013, and the consolidated statement of stockholders’ equity (deficit) for the nine months ended September 30, 2013 are unaudited. These unaudited interim consolidated financial statements have been prepared in accordance with U.S. GAAP. In our opinion, the unaudited interim consolidated financial statements have been prepared on the same basis as the audited consolidated financial statements and include all adjustments necessary for a fair presentation. The results of operations for the nine months ended September 30, 2013 are not necessarily indicative of the results to be expected for the year ending December 31, 2013 or for any other period.
Significant Estimates and Judgments
The preparation of our consolidated financial statements in conformity with U.S. GAAP requires management to make estimates and assumptions that affect the reported amounts of assets, liabilities and the disclosure of contingent assets and liabilities at the date of the financial statements and the reported amount of net revenues and expenses during the reporting periods. These estimates and assumptions could have a material effect on our future results of operations and financial position. Significant items subject to our estimates and assumptions include stock-based compensation, income taxes, valuation of acquired goodwill and intangible assets, allowance for doubtful accounts, derivative liabilities, acquisition-related contingent liabilities and the useful lives of property and equipment and intangible assets. As a result, actual amounts could differ from those presented herein.
Business Segment
We have one operating and reporting segment consisting of various products and services that are all related to our marketplace for digital coupons. Our chief operating decision maker is our Chief Executive Officer. Our Chief Executive Officer allocates resources and assesses performance of the business and other activities at a single reporting segment level.
Cash and Cash Equivalents
All highly-liquid investments with an original maturity of three months or less at the date of purchase are considered to be cash equivalents. As of December 31, 2011 and 2012, we maintained all cash and cash equivalent balances in operating, savings and a U.S. money market deposit account with two banks.
F-8
Table of Contents
Accounts Receivable, Net
Accounts receivable, net represent amounts due from retailers, through various performance marketing networks, for commissions earned on consumer purchases. We record an allowance for doubtful accounts in an amount equal to the estimated probable losses net of recoveries, which are based on an analysis of historical bad debt, current receivables aging and expected future write-offs of uncollectible accounts, as well as an assessment of specific identifiable accounts considered at risk or uncollectible. The following table summarizes our allowance for doubtful accounts (in thousands):
| Beginning Balance |
Additions Charged to Expense |
Write-offs | Acquisitions | Ending Balance |
||||||||||||||||
| Allowance for doubtful accounts: |
||||||||||||||||||||
| Year ended December 31, 2010 |
$ | 23 | 105 | (46 | ) | — | $ | 82 | ||||||||||||
| Year ended December 31, 2011 |
82 | 199 | (2 | ) | 16 | 295 | ||||||||||||||
| Year ended December 31, 2012 |
295 | 626 | (1 | ) | 13 | 933 | ||||||||||||||
Property and Equipment, Net
Property and equipment, net includes assets such as furniture and fixtures, leasehold improvements, computer hardware, and office and telephone equipment. We record property and equipment at cost less accumulated depreciation and amortization. Ordinary maintenance and repairs are charged to expense, while expenditures that extend the physical or economic life of the assets are capitalized. Property and equipment are depreciated over their estimated economic lives, which range from three to five years, using the straight-line method. Leasehold improvements are amortized over the shorter of the estimated useful lives of the improvements or the lease term. We perform reviews for the impairment of property and equipment when it believes events or circumstances indicate the carrying amount of an asset may not be recoverable.
Goodwill and Other Intangible Assets
Goodwill arises from business combinations and is measured as the excess of the cost of the business acquired over the sum of the acquisition-date fair values of tangible and identifiable intangible assets acquired, less any liabilities assumed.
We evaluate goodwill for impairment annually, during the fourth quarter of each year, or more frequently when an event occurs or circumstances change that indicates the carrying value may not be recoverable. The events and circumstances we consider include the business climate, legal factors, operating performance indicators and competition.
We evaluate the recoverability of goodwill using a two-step impairment process tested at our sole reporting segment level. In the first step, the fair value for the sole reporting unit is compared to our book value including goodwill. In the case that the fair value is less than the book value, a second step is performed that compares the implied fair value of goodwill to the book value of the goodwill. The fair value for the implied goodwill is determined based on the difference between the fair value of the sole reporting segment and the net fair value of the identifiable assets and liabilities excluding goodwill. If the implied fair value of the goodwill is less than the book value, the difference is recognized as an impairment charge in the consolidated statements of operations. We did not record any goodwill impairment charges during the years ended December 31, 2010, 2011 and 2012. We noted no events or circumstances that indicated the carrying value of goodwill might not be recoverable and did not record any goodwill impairment charges during the nine months ended September 30, 2013 (unaudited).
We determined the fair value of the sole reporting unit from the use of valuations which utilized the income approach, whereby current and future estimated discounted cash flows were utilized to calculate an operating value of the Company on a controlling interest basis.
F-9
Table of Contents
Identifiable intangible assets consist of acquired customer intangible assets, marketing-related intangible assets, contract-based intangible assets, and technology-based intangible assets. Intangible assets with definite lives are amortized over their estimated useful lives on a straight-line or accelerated basis. See Note 4, “Goodwill and Other Intangible Assets”. The method of amortization applied represents our best estimate of the distribution of the economic value of the identifiable intangible assets. The factors we considered in determining the useful lives of identifiable intangible assets included the extent to which expected future cash flows would be affected by our intent and ability to retain use of these assets, including the period of time that would capture 90% or more of the assets value on a perpetuity basis.
Intangible assets are reviewed for impairment whenever events or changes in circumstances indicate the carrying amount of intangible assets may not be recoverable. Conditions that would necessitate an impairment assessment include a significant decline in the observable market value of an asset, a significant change in the extent or manner in which an asset is used, or any other significant adverse change that would indicate that the carrying amount of an asset or group of assets may not be recoverable. We evaluate the recoverability of intangible assets by comparing their carrying amounts to future net undiscounted cash flows expected to be generated by the intangible assets. If such intangible assets are considered to be impaired, the impairment to be recognized is measured by the amount by which the carrying amount of the intangible assets exceeds the fair value of the assets. We determine fair value based on either market quotes, if available, or discounted cash flows using a discount rate commensurate with the risk inherent in our current business model for the specific intangible asset being valued.
Deferred Financing Costs
We capitalize underwriting, legal and other direct costs incurred related to the issuance of debt, which are recorded as deferred charges and amortized to interest expense over the term of the related debt using the effective interest method. Upon the extinguishment of the related debt, any unamortized capitalized deferred financing costs are recorded to interest expense.
Lease Obligations
We categorize leases at their inception as either operating or capital leases, and may receive renewal or expansion options, rent holidays, leasehold improvement allowances and other incentives on certain lease agreements. We recognize operating lease costs on a straight-line basis over the term of the agreement taking into account adjustments for market provisions, such as free or escalating base monthly rental payments, or deferred payment terms, such as rent holidays, that defer the commencement date of required payments. We record rent expense associated with operating lease obligations in general and administrative expenses in the consolidated statements of operations.
Warrants
Warrants or similar instruments to acquire shares of redeemable convertible preferred stock are classified as liabilities. We issued warrants for the purchase of Series B preferred stock in conjunction with the issuance of our Series B-2 preferred stock in November 2010 and May 2011. The proceeds from the sale were allocated to the preferred stock warrants based on their fair value and the residual was allocated to preferred stock. We recorded the fair value of the preferred stock warrants as a liability with an offsetting charge to additional paid-in capital. We re-measured the fair value of the preferred stock warrants at each applicable reporting period and recorded any change in fair value in the consolidated statement of operations in non-operating expense. All of the preferred stock warrants were exercised in August 2011.
We issued a detachable common stock warrant in connection with a subordinated promissory note issued in November 2010. Applicable accounting guidance requires that proceeds from the issuance of a debt instrument with detachable stock purchase warrants (detachable call options) are allocated to the warrants based on fair
F-10
Table of Contents
value, with the residual allocated to the debt. Since the number of shares issuable upon exercise of the warrant was not fixed at the time of issuance, we recorded the fair value of the warrant of $1.5 million as a derivative liability. We also recorded the debt at its full face amount with a contra component, a debt discount, of $1.5 million, which was being accreted to zero over the life of the underlying debt. The accretion was accounted for as non-cash interest expense using the effective interest rate. We re-measured the fair value of the warrant liability at each reporting period and recorded any change in fair value to earnings. During the year ended December 31, 2011, we recorded a $2.1 million charge to earnings for the change in fair value of the common stock warrant. In October 2011, the number of shares issuable upon exercise of the warrant became fixed and the carrying value of the common stock warrant liability of $3.6 million was reclassified to additional paid-in capital. The common stock warrant was exercised in March 2013.
Costs of Equity Transactions
The direct costs of equity transactions, including underwriting discounts and commissions, accounting and legal fees, printing costs and taxes, are treated as a reduction of proceeds. The total costs of $2.5 million associated with our preferred stock issuances were recorded as a discount on preferred shares.
Revenue Recognition
We recognize revenue when persuasive evidence of an arrangement exists, services have been rendered, the fee to the paid retailer is fixed or determinable and collectability of the resulting receivable is reasonably assured. For commission revenues, which represent the significant majority of our net revenues, revenue recognition generally occurs when a consumer, having visited one of our websites and clicked on a digital coupon for a paid retailer, defined as a retailer with which we have a contract, makes a purchase with such paid retailer, and completion of the order is reported to us by such paid retailer, either directly or through a performance marketing network. The reporting by the paid retailer includes the amount of commissions the paid retailer has calculated as owing to us. Certain paid retailers do not provide reporting until a commission payment is made. In those cases, which have historically not been significant, we record commission revenues on a cash basis. We estimate and record a reserve, based upon actual, historical return rates as reported to us by the paid retailers, to provide for end-user cancelations or product returns, which may not be reported by the paid retailer or performance marketing network until a subsequent date. As such, we report commission revenues net of the estimated returns reserve. Net revenues are reported net of sales taxes, where applicable. The following table summarizes our revenue returns reserve (in thousands):
| Beginning Balance |
Provision for Returns |
Returns | Ending Balance |
|||||||||||||
| Revenue returns reserve: |
||||||||||||||||
| Year ended December 31, 2011 |
$ | — | $ | 3,433 | $ | (2,763 | ) | $ | 670 | |||||||
| Year ended December 31, 2012 |
670 | $ | 6,337 | $ | (5,780 | ) | 1,227 | |||||||||
The activity in our revenue returns reserve was not significant in 2010.
Our arrangements with paid retailers are both direct and through performance marketing networks, which act as intermediaries between the paid retailers and us. No paid retailers individually accounted for more than 10% of net revenues or accounts receivable for any of the years ended December 31, 2010, 2011 and 2012 or the nine months ended September 30, 2013 (unaudited).
Cost of Revenue
Cost of revenue is composed of direct and indirect costs incurred to generate revenue. These costs consist of personnel costs of our salaried merchandising and technology support employees and fees paid to third-party contractors engaged in the operation and maintenance of our existing websites and mobile applications. Such technology costs also include website hosting and internet service costs. Other costs include allocated facility and general information technology costs.
F-11
Table of Contents
Sales and Marketing Expenses
Our sales and marketing expenses consist of personnel costs for our sales, marketing, search engine optimization, search engine marketing and business intelligence employees, as well as online, brand and other marketing expenses. Our online, brand and other marketing costs include search engine fees, advertising on social networks, television advertising, display advertisements, creative development fees, public relations, email campaigns, trade shows and other general marketing costs. Other costs include allocated facility and general information technology costs.
Advertising Expenses
We expense all advertising costs as incurred. Advertising expenses included in sales and marketing expense were $0.2 million, $1.7 million and $13.2 million for the years ended December 31, 2010, 2011 and 2012, respectively.
Product Development
Our product development expense consists primarily of personnel costs of our product management and software engineering teams, as well as fees paid to third-party contractors and consultants engaged in the design, development, testing and improvement of the functionality and user experience of our websites and mobile applications. We expense all internal product and development costs as we do not track and separately identify costs with identifiable development activities from costs of maintenance and related activities.
General and Administrative Expenses
Our general and administrative expenses represent personnel costs for employees involved in general corporate functions, including finance, accounting, legal and human resources, among others. Additional costs included in general and administrative expenses include professional fees for legal, audit and other consulting services, travel and entertainment, charitable contributions, recruiting, allocated facility and general information technology costs and other general corporate overhead expenses.
Stock-Based Compensation Expense
Stock-based compensation expense is measured at the grant date based on the estimated fair value of the award, net of estimated forfeitures. We recognize these compensation costs on a straight-line basis over the requisite service period of the award. Forfeiture rates are estimated at grant date based on historical experience and adjusted in subsequent periods for differences in actual forfeitures from those estimates. We include stock-based compensation expense in cost of net revenues and operating expenses in our consolidated statements of operations, consistent with the respective employees’ cash compensation. We determine the fair value of stock options on the grant date using the Black-Scholes-Merton valuation model.
Fair Value of Financial Instruments
The carrying amounts of our financial instruments, including cash and cash equivalents, accounts receivable, accounts payable, accrued liabilities and notes payable, approximate fair value due to the instruments’ short-term maturities or, in the case of the long-term notes payable, based on the variable interest rate feature. We record contingent consideration, warrant liabilities and derivative liabilities at fair value.
Income Taxes
The provision for income taxes is determined using the asset and liability method. Deferred tax assets and liabilities are calculated based upon the temporary differences between the financial statement carrying amounts of existing assets and liabilities and their respective tax bases using the enacted tax rates that are applicable in a given year. The deferred tax assets are recorded net of a valuation allowance when, based on the available supporting evidence, we believe it is more likely than not that some portion or all of the recorded deferred tax assets will not be realized in future periods.
F-12
Table of Contents
We utilize a two-step approach to recognize and measure uncertain tax positions. The first step is to evaluate the tax position for recognition by determining if the weight of available evidence indicates it is more likely than not that the position will be sustained on audit, including resolution of related appeals or litigation processes. The second step is to measure the tax benefit as the largest amount which is more than 50% likely to be realized upon ultimate settlement. We consider many factors when evaluating and estimating our tax positions and tax benefits, which may require periodic adjustments and which may not accurately forecast actual outcomes. We include interest and penalties related to uncertain tax positions in the provision for income taxes on our consolidated statements of operations. See Note 13, “Income Taxes.”
Foreign Currency
Our operations outside of the U.S. generally use the local currency as their functional currency. Assets and liabilities for these operations are translated at exchange rates in effect at the balance sheet date. Income and expense accounts are translated at average exchange rates for the period. Foreign currency translation adjustments are recorded in accumulated other comprehensive income (loss). Gains and losses from foreign currency denominated transactions, which were not significant, are recorded in other income (expense), net in our consolidated statements of operations.
Derivative Financial Instruments
We use an interest rate swap agreement to hedge interest rate exposure on a portion of our Prior Senior Debt (as defined below in Note 7, “Notes Payable”). This derivative is recorded at fair value on the balance sheet. This derivative does not qualify for hedge accounting treatment. We recognize the change in the instrument’s fair value and the net payments from the swap agreement in interest expense. We recognized other expense of $0.2 million in the year ended December 31, 2011, and other income of $0.1 million in the year ended December 31, 2012, related to this agreement. The agreement was entered into during the year ended December 31, 2011, and therefore no corresponding other income (expense) was recognized in the year ended December 31, 2010. See Note 7, “Notes Payable.”
Contingent Consideration
Contingent consideration paid in connection with a business combination is recognized at fair value at the acquisition date, classified as a liability, and is subsequently remeasured each reporting period, with changes in fair value recorded in fair value change of contingent consideration, net in our consolidated statements of operations. We remeasured the fair value of contingent consideration liabilities at each reporting period and accounted for changes in fair value by recording an increase to earnings of $2.0 million for the year ended December 31, 2010. There was no change in fair value of the contingent liabilities for the year ended December 31, 2011, during which period these liabilities were paid in full.
Recent Accounting Pronouncements
In May 2011, the Financial Accounting Standards Board, or FASB, issued new guidance that amends some fair value measurement principles and disclosure requirements. The new guidance clarifies how a principal market is determined, how and when the valuation premise of highest and best use applies, and how premiums and discounts are applied, as well as requiring new disclosures. We adopted these provisions as of January 1, 2012, which did not have a material impact on our consolidated financial statements.
In June 2011, the FASB issued new guidance related to the presentation of comprehensive income. The new guidance eliminates the option to present components of other comprehensive income as part of the statement of changes in stockholders’ equity and requires an entity to present either one continuous statement of net income and other comprehensive income or two separate, but consecutive statements. We adopted these provisions as of January 1, 2012, which only affected how, and in what specific financial statements, we present the components of comprehensive income. The adoption of these provisions had no impact on our financial position, results of operations or cash flows.
F-13
Table of Contents
In September 2011, the FASB issued new guidance that allows entities to use a qualitative approach to test goodwill for impairment. After assessment of certain qualitative factors, if it is determined to be more likely than not that the fair value of a reporting unit is less than its carrying value, entities must perform the prescribed two-step goodwill impairment test. Otherwise, the two-step impairment test is not required. We did not utilize the qualitative approach to test goodwill for impairment in performing our annual goodwill impairment analysis.
In July 2012, the FASB issued amended guidance that simplifies how entities test indefinite-lived intangible assets other than goodwill for impairment. After assessment of certain qualitative factors, if it is determined to be more likely than not that an indefinite-lived asset is impaired, entities must perform the quantitative impairment test. Otherwise, the quantitative test becomes optional. At December 31, 2011 and 2012, we did not have any indefinite-lived intangible assets to test for potential impairment.
In February 2013, the FASB issued new guidance that amends the presentation of items reclassified from accumulated other comprehensive income to net income. The guidance requires that information regarding such reclassifications is presented by component and reported in one place within the financial statements. We adopted these provisions on January 1, 2013, which only affect how we present information about reclassifications from accumulated other comprehensive income to net income. The adoption of these provisions had no impact on our financial position, results of operations or cash flows.
3. Acquisitions
The following table summarizes our acquisitions during the years ended December 31, 2010, 2011 and 2012 and the nine months ended September 30, 2013, with amounts shown below at fair value at each respective acquisition date (dollars in thousands):
| RetailMeNot.com | VoucherCodes.co.uk | Miwim (Web.Bons-de- Reduction.com and Poulpeo.com) |
Actiepagina.nl | Ma-Reduc.com | ||||||||||||||||
| Year acquired |
2010 | 2011 | 2012 | 2013 | 2013 | |||||||||||||||
| (unaudited) | (unaudited) | |||||||||||||||||||
| Cash acquired |
$ | — | $ | 1,266 | $ | 558 | $ | 64 | $ | 530 | ||||||||||
| Other tangible assets acquired |
— | 3,523 | 1,697 | 2 | 1,337 | |||||||||||||||
| Identifiable intangible assets |
||||||||||||||||||||
| Customer relationships |
5,118 | 4,451 | 475 | 192 | 296 | |||||||||||||||
| Marketing-related |
41,509 | 10,756 | 4,035 | 896 | 6,231 | |||||||||||||||
| Contract-based |
16,041 | 697 | 142 | 187 | 263 | |||||||||||||||
| Technology-based |
385 | 3,622 | 811 | 207 | 564 | |||||||||||||||
| Goodwill |
95,763 | 30,327 | 8,727 | 1,597 | 13,745 | |||||||||||||||
|
|
|
|
|
|
|
|
|
|
|
|||||||||||
| Total assets acquired |
158,816 | 54,642 | 16,445 | 3,145 | 22,966 | |||||||||||||||
| Total liabilities assumed |
— | (7,773 | ) | (3,197 | ) | — | (3,033 | ) | ||||||||||||
|
|
|
|
|
|
|
|
|
|
|
|||||||||||
| Total |
$ | 158,816 | $ | 46,869 | $ | 13,248 | $ | 3,145 | $ | 19,933 | ||||||||||
|
|
|
|
|
|
|
|
|
|
|
|||||||||||
Tangible assets, which include cash and cash equivalents and accounts receivable, were valued at their respective carrying amounts, which we believe approximate their fair values at the respective acquisition dates. The liabilities assumed in connection with these acquisitions, which were recorded at their fair value at the acquisition dates, include accrued liabilities, accounts payable and deferred tax liabilities. For all acquisitions, goodwill represents the excess of the purchase price over the aggregate fair value of the net identifiable assets acquired. In connection with our acquisitions we incurred approximately $0.4 million, $1.4 million, $0.6 million and $1.3 million (unaudited) in direct acquisition costs in the years ended December 31, 2010, 2011 and 2012 and the nine months ended September 30, 2013, respectively, all of which were expensed as incurred and are included in general and administrative expenses on the consolidated statements of operations.
F-14
Table of Contents
Goodwill resulted primarily from acquiring a business in a market characterized by high profitability, numerous participants, with none having a dominant market position and specialized processes and procedures, none of which qualify as a separate intangible asset.
The valuation of identifiable intangible assets acquired reflects our estimates based on, among other factors, use of established valuation methods. The value of customer relationships was determined using the income approach. The value of marketing-related intangible assets was determined using the relief from royalty method. Contract-based intangible assets have been valued based on an income-based approach, specifically the with/without method. The value of acquired technology was determined based on a cost-to-recreate methodology. Identifiable intangible assets with definite lives are amortized over the period of estimated benefit using the straight-line or accelerated method and the estimated useful lives of one to fifteen years. The method of amortization applied represents our best estimate of the distribution of the economic value of the identifiable intangible assets.
The acquired marketing-related intangible assets consist primarily of trade names, domain names and well-developed traffic acquisition strategies. These trade and domain names play a pivotal role in generating visits and consumer leads for retailers. In addition, the traffic acquisition methodologies such as search engine optimization processes and techniques, email subscriber lists and campaign processes and other direct marketing capabilities also contribute significantly to generating consumer leads and visits. Our intent is to use the brand and domain names for the foreseeable future and to build upon the established traffic-acquisition methodologies. Accordingly, we utilized a fifteen year useful life to both determine the value of these assets and the selection of a useful life.
The acquired customer-related intangible assets consist solely of contracts with retailers. The businesses we acquired typically had relationships with a substantial portion of the major online retailers that offered digital coupons through affiliate marketing relationships. The customer relationships were valued predominantly using an income approach (multi-period excess earnings method.) Based on the attrition factors applied, the expected useful life of customer relationships from this income approach is fifteen years. Although the contracts we enter into with retailers are cancelable upon short or no notice and without penalty, we determined the useful life of these relationships to be longer-term in nature based upon consideration of several factors. These factors included the fact that couponing has been used in-store by retailers for an extended period; the growth in revenues of the acquired businesses which indicated growing use of coupons by retailers and consumers; the higher level of retailer relationship management that we provide as compared to the periods prior to acquisition; and historically low attrition rates. Based on these factors, we determined that the useful life of these relationships would extend to the foreseeable future and, accordingly, utilized a period of fifteen years both to value and amortize these assets.
Ma-Reduc.com (unaudited)
On July 1, 2013, our wholly owned subsidiary, RetailMeNot, France, acquired 100% of the outstanding capital stock of ABCYNE, a private company and the operator of Ma-Reduc.com, a digital coupon website in France. The total initial purchase price of $19.9 million was comprised of: (i) $15.0 million initial cash consideration and (ii) notes payable issued by RetailMeNot, France, with an aggregate principal amount of $4.9 million to the shareholders, bearing interest at a rate of 3.0% per annum and due in 2014. Of the $15.0 million of initial cash consideration, $0.2 million is provisional and subject to adjustment based upon a final determination of the amount of ABCYNE’s working capital as of July 1, 2013.
The goodwill resulting from the acquisition of Ma-Reduc.com is not deductible for tax purposes.
Actiepagina.nl (unaudited)
On March 1, 2013, we acquired certain assets and liabilities of Actiepagina B.V. associated with Actiepagina.nl, its website based in the Netherlands. The total purchase price of $3.1 million was comprised of: (i) $2.0 million cash consideration and (ii) a $1.1 million note payable issued to the seller, due in 2014.
The resulting goodwill from the acquisition of Actiepagina.nl is not deductible for tax purposes.
F-15
Table of Contents
Web.Bons-de-Reduction.com and Poulpeo.com
On May 10, 2012, we acquired 100% of the outstanding capital stock of Miwim, a private company and the operator of Web.Bons-de-Reduction.com and Poulpeo.com, two websites in France. The total purchase price of $13.2 million was comprised of: (i) $10.1 million initial cash consideration, (ii) 182,425 shares of our Series B-5 preferred stock with an aggregate value of $3.0 million, based on a per share fair value of approximately $16.45 per share and (iii) additional cash consideration for working capital of $0.1 million.
In conjunction with the acquisition of Web.Bons-de-Reduction.com and Poulpeo.com, we entered into deferred compensation arrangements with the former owners, at which time we issued promissory notes to such individuals with a principal amount totaling $3.5 million bearing interest at 5.0% annually. Principal is to be repaid in equal annual installments of $1.75 million over a two-year period along with accompanying accrued interest, contingent on the continued employment of the former owners. We recorded an associated asset for the deferred compensation arrangement, which is included in other noncurrent assets in the amount of $3.5 million as of December 31, 2012. This asset is being amortized ratably to general and administrative expense over the two-year term of the required employment period. During 2012, we recognized $1.1 million of compensation expense related to these agreements.
The resulting goodwill from the Web.Bons-de-Reduction.com and Poulpeo.com acquisition is not deductible for tax purposes.
The pro forma impact of this acquisition on consolidated net revenues and operating income was immaterial.
VoucherCodes.co.uk
On August 15, 2011, our wholly owned subsidiary, RetailMeNot Limited, or RMNL, acquired 100% of the outstanding capital stock of eConversions Limited, a private company and the operator of VoucherCodes.co.uk, a website based in the United Kingdom. The total purchase price of $46.9 million was comprised of: (i) $33.0 million initial cash consideration, (ii) notes payable issued by RMNL with an aggregate principal amount of $13.0 million to the shareholders and option holders, bearing interest at a rate of 5.0% per annum and due in 2013 and (iii) additional cash consideration for working capital of $0.9 million.
Shortly after the acquisition date, these notes payable were extinguished and replaced with notes payable we issued in the aggregate principal amount of $6.0 million, bearing interest at a rate of 5.0% per annum and due in 2013, and 978,998 shares of our Series B-4 preferred stock with an aggregate value of $7.0 million based on a per share price of approximately $7.15 per share.
The resulting goodwill from the VoucherCodes.co.uk acquisition is not deductible for tax purposes.
RetailMeNot.com
On November 24, 2010, we acquired certain assets of Stateless Systems Pty Ltd. associated with its website RetailMeNot.com. The total purchase price of $158.8 million was comprised of: (i) $130.0 million initial cash consideration, (ii) $20.0 million of Series B-2 preferred stock based upon the issuance of 4,291,022 shares at a value of $4.66 per share and (iii) a $10.0 million note payable to the sellers with an estimated fair value of $8.8 million. The contract-based intangible assets acquired with RetailMeNot.com consist of five-year non-compete agreements with the two individuals that together owned 100% of the selling entity.
The resulting goodwill from the RetailMeNot.com acquisition is deductible for tax purposes.
Purchase of an internet domain name
During April 2010, we purchased an internet domain name for (i) $5.0 million cash consideration payable in four equal annual installments beginning in April 2010 and (ii) 31,458 shares of Series 1 common stock. The
F-16
Table of Contents
purchase was recorded at the fair value of the required payments plus the fair market value of the Series 1 common stock issued to the seller, or an aggregate amount of $4.4 million. The related asset is being amortized over four years and is included in intangible assets on our consolidated balance sheets.
Pro forma Results (Unaudited)
The following unaudited pro forma supplemental information presents an aggregated summary of our results of operations for the years ended December 31, 2010 and 2011, assuming the completion of the 2010 acquisition of RetailMeNot.com and the completion of the 2011 acquisition of VoucherCodes.co.uk occurred on January 1, 2010. The pro forma impact of our 2012 acquisitions of Web.Bons-de-Reduction.com and Poulpeo.com and our 2013 acquisitions of Actiepagina.nl and Ma-Reduc.com on consolidated net revenues and operating income was not material.
The unaudited pro forma supplemental information presented below is based on estimates and assumptions that we believe are reasonable. The average foreign exchange rate during 2011 was used in preparing the supplemental information pertaining to our VoucherCodes.co.uk acquisition. The unaudited pro forma supplemental information that we have prepared is not necessarily indicative of the results of income in future periods or the results that actually would have been realized had the acquired businesses been combined with our operations during the specified periods.
| Year Ended December 31, | ||||||||
| 2010 | 2011 | |||||||
| Net revenues |
$ | 55.4 million | $ | 90.4 million | ||||
| Operating income |
$ | 29.4 million | $ | 42.1 million | ||||
4. Goodwill and Other Intangible Assets
Changes in our goodwill balance for the years ended December 31, 2011 and 2012 and the nine months ended September 30, 2013 are summarized in the table below (in thousands).
| Balance at December 31, 2010 |
$ | 113,826 | ||
| Acquired in business combinations |
30,508 | |||
| Foreign currency translation adjustment |
(1,417 | ) | ||
|
|
|
|||
| Balance at December 31, 2011 |
142,917 | |||
| Acquired in business combinations |
8,727 | |||
| Foreign currency translation adjustment |
1,111 | |||
|
|
|
|||
| Balance at December 31, 2012 |
152,755 | |||
| Acquired in business combinations (unaudited) |
15,342 | |||
| Foreign currency translation adjustment (unaudited) |
529 | |||
|
|
|
|||
| Balance at September 30, 2013 (unaudited) |
$ | 168,626 | ||
|
|
|
Intangible assets consisted of the following as of December 31, 2011 and 2012 and September 30, 2013 (in thousands):
| Estimated Useful Life (Months) |
December 31, 2011 | |||||||||||||||||
| Gross | Accumulated Amortization |
Impairment | Net | |||||||||||||||
| Customer relationships |
180 | $ | 17,987 | $ | (1,675 | ) | $ | — | $ | 16,312 | ||||||||
| Marketing-related |
48-180 | 63,520 | (6,624 | ) | — | 56,896 | ||||||||||||
| Contract-based |
33-60 | 18,357 | (4,485 | ) | — | 13,872 | ||||||||||||
| Technology-based |
12 | 4,199 | (2,051 | ) | — | 2,148 | ||||||||||||
|
|
|
|
|
|
|
|
|
|||||||||||
| Total intangible assets |
$ | 104,063 | $ | (14,835 | ) | $ | — | $ | 89,228 | |||||||||
|
|
|
|
|
|
|
|
|
|||||||||||
F-17
Table of Contents
| Weighted- average amortization period |
Estimated Useful Life (Months) |
December 31, 2012 | ||||||||||||||||||
| Gross | Accumulated Amortization |
Impairment | Net | |||||||||||||||||
| Customer relationships |
180 | 180 | $ | 18,654 | $ | (2,827 | ) | $ | (2,498 | ) | $ | 13,329 | ||||||||
| Marketing-related |
173 | 48-180 | 68,142 | (12,049 | ) | (2,058 | ) | 54,035 | ||||||||||||
| Contract-based |
60 | 33-60 | 18,529 | (8,260 | ) | (368 | ) | 9,901 | ||||||||||||
| Technology-based |
12 | 12 | 5,767 | (5,047 | ) | — | 720 | |||||||||||||
|
|
|
|
|
|
|
|
|
|||||||||||||
| Total intangible assets |
$ | 111,092 | $ | (28,183 | ) | $ | (4,924 | ) | $ | 77,985 | ||||||||||
|
|
|
|
|
|
|
|
|
|||||||||||||
| Weighted- average amortization period |
Estimated Useful Life (Months) |
September 30, 2013 | ||||||||||||||||||
| (unaudited) | ||||||||||||||||||||
| Gross | Accumulated Amortization |
Impairment | Net | |||||||||||||||||
| Customer relationships |
180 | 180 | $ | 16,131 | $ | (3,083 | ) | $ | — | $ | 13,048 | |||||||||
| Marketing-related |
167 | 48-180 | 73,611 | (15,479 | ) | — | 58,132 | |||||||||||||
| Contract-based |
58 | 12-60 | 18,077 | (10,453 | ) | — | 7,624 | |||||||||||||
| Technology-based |
12 | 12 | 6,350 | (5,824 | ) | — | 526 | |||||||||||||
|
|
|
|
|
|
|
|
|
|||||||||||||
| Total intangible assets |
$ | 114,169 | $ | (34,839 | ) | $ | — | $ | 79,330 | |||||||||||
|
|
|
|
|
|
|
|
|
|||||||||||||
In 2012, we determined that we would no longer support three of our websites, Coupon7.com, Couponshare.com and CheapStingyBargains.com. We have migrated all traffic from these websites to RetailMeNot.com and Deals2buy.com, and do not expect these sites to provide additional income. As a result of this impairment indicator, we determined that a complete impairment of the remaining unamortized intangible assets related to these websites was warranted, resulting in an impairment charge of $4.9 million, which is included in other operating expenses. We did not record any intangible asset impairment charges during the years ended December 31, 2010 and 2011 or the nine months ended September 30, 2013 (unaudited).
As of December 31, 2011 and 2012, the weighted-average amortization period for definite-lived intangible assets was 14.1 and 10.4 years, respectively. Estimated amortization of intangible assets for the five years subsequent to December 31, 2012 and thereafter is as follows (in thousands):
| 2013 |
$ | 10,524 | ||
| 2014 |
9,072 | |||
| 2015 |
8,265 | |||
| 2016 |
5,300 | |||
| 2017 |
5,264 | |||
| Thereafter |
39,560 | |||
|
|
|
|||
| $ | 77,985 | |||
|
|
|
F-18
Table of Contents
5. Property and Equipment, Net
Property and equipment consists of the following (in thousands):
| Estimated Useful Life (Years) |
December 31, | |||||||||
| 2011 | 2012 | |||||||||
| Computer hardware |
3 | $ | 508 | $ | 1,158 | |||||
| Purchased software |
3 | 150 | 954 | |||||||
| Office equipment |
3 | 133 | 233 | |||||||
| Office furniture and fixtures |
5 | 773 | 1,578 | |||||||
| Leasehold improvements |
5 | 1,149 | 2,415 | |||||||
|
|
|
|
|
|||||||
| 2,713 | 6,338 | |||||||||
| Less: Accumulated amortization and depreciation |
(317 | ) | (1,417 | ) | ||||||
|
|
|
|
|
|||||||
| Net property and equipment |
$ | 2,396 | $ | 4,921 | ||||||
|
|
|
|
|
|||||||
Depreciation and amortization expense related to property and equipment was $0.1 million, $0.3 million and $1.0 million for the years ended December 31, 2010, 2011 and 2012, respectively. We recorded no impairment of property and equipment and recorded no significant gains or losses on the disposal of property and equipment during the years ended December 31, 2010, 2011 and 2012, respectively.
6. Accrued Expenses and Other Current Liabilities
Accrued expenses and other current liabilities consisted of the following (in thousands):
| December 31, | ||||||||
| 2011 | 2012 | |||||||
| Marketing and professional services |
$ | 772 | $ | 1,369 | ||||
| Taxes other than income taxes |
681 | 998 | ||||||
| Interest payable |
596 | 990 | ||||||
| Other |
14 | 1,437 | ||||||
|
|
|
|
|
|||||
| $ | 2,063 | $ | 4,794 | |||||
|
|
|
|
|
|||||
7. Long Term Debt
Long term debt as of December 31, 2011 and 2012, consisted of the following (in thousands):
| December 31, | ||||||||
| 2011 | 2012 | |||||||
| Senior secured note due 2015 |
$ | 38,325 | $ | 29,425 | ||||
| Unsecured seller note due 2012 |
9,837 | — | ||||||
| Unsecured seller note due 2012 |
1,375 | — | ||||||
| Unsecured seller note due 2013 |
6,000 | 6,000 | ||||||
| Unsecured promissory notes due 2013 |
— | 3,500 | ||||||
|
|
|
|
|
|||||
| 55,537 | 38,925 | |||||||
| Less current maturities |
(20,112 | ) | (16,650 | ) | ||||
|
|
|
|
|
|||||
| Total long term debt |
$ | 35,425 | $ | 22,275 | ||||
|
|
|
|
|
|||||
F-19
Table of Contents
Prior Senior Debt
In November 2010, in connection with the acquisition of the business of RetailMeNot.com, we entered into a term loan agreement with certain lenders and issued secured promissory notes in the aggregate principal amount of $45.0 million, or Prior Senior Debt. At our option, borrowings under this term loan agreement bear interest at either the base rate (as more fully described in this term loan agreement) plus 450 basis points or LIBOR (with a floor of 100 basis points) plus 550 basis points when our funded debt to EBITDA ratio (as more fully described in this term loan agreement) is greater than or equal to 2.00:1.00. As the funded debt to EBITDA ratio decreases, the number of basis points is reduced by as much as 100 basis points to equal 350 and 450 basis points, respectively. Interest is payable quarterly in arrears for base rate borrowings and on the last day of the advance for any LIBOR based borrowings. Principal payments of $2.2 million are due on the first day of each quarter with any remaining balance due on November 23, 2015. Certain mandatory prepayments include proceeds from certain asset sales, 100% of the proceeds of any subordinated debt and 50% of the proceeds of certain equity transactions.
The term loan agreement also has a requirement for us to enter into an interest rate swap agreement sufficient, at the minimum, to cover 50% of the aggregate outstanding principal amount for a three-year period. Accordingly, in January 2011 we entered into an interest rate swap agreement with a notional amount of $22.5 million using a principal amortization schedule determined by our lenders, resulting in a declining balance subject to the interest rate swap through January 2014. The interest rate swap agreement adds 75 basis points to the LIBOR-based borrowing rate but caps the maximum rate for LIBOR-based borrowings at 7.25% per annum. The impact of the interest rate swap agreement is not material to our consolidated balance sheets, statements of operations or cash flows.
The Prior Senior Debt has priority in repayment to all other outstanding debt and, in connection with the Prior Senior Debt and the related term loan agreement, we have granted our lenders a security interest in substantially all of our assets, including intellectual property, pursuant to a security agreement and an intellectual property security agreement. We are subject to complying with certain financial covenants, including minimum trailing twelve-month EBITDA levels, funded debt to EBITDA ratio, senior debt to EBITDA ratio and a fixed charge coverage ratio (each as more fully described in our term loan agreement). The term loan agreement contains customary affirmative and negative covenants and prohibits, among other things and subject to certain exceptions, the incurrence of additional debt, payment of other debt obligations, incurrence of liens, acquisitions of businesses or capital expenditures, sales of businesses or assets, payment of dividends, making loans or advances and certain other restrictions. The term loan agreement also contains customary events of default including, among others, payment defaults, breaches of covenants, bankruptcy and insolvency events, cross defaults with certain material indebtedness, judgment defaults, change of control and breaches of representations and warranties. During 2012 and 2011, the term loan agreement was amended to, among other things, (i) incorporate certain preferred stock financing activities, (ii) allow the acquisitions of the businesses of Web.Bons-de-Reduction.com and Poulpeo.com and VoucherCodes.co.uk, (iii) allow the prepayment of certain subordinated debt, (iv) allow the amendment of a note payable, (v) redefine the limit of permitted acquisitions and (vi) eliminate previously existing mandatory prepayment provisions attributable to excess cash flow (each as more fully described in our term loan agreement). We were in compliance with all covenants as of December 31, 2012.
Current Senior Debt
On July 1, 2013, we entered into an amended and restated revolving credit and term loan agreement with certain lenders, including an entity related to a stockholder of the Company, or Current Senior Debt. The Current Senior Debt consists of a $115.0 million revolving credit facility and a $35.0 million term loan facility. The term loan facility was used, in part, to fully repay the $25.0 million of borrowings outstanding as of June 30, 2013 under the Prior Senior Debt. The obligations were paid in full effective upon closing of the Current Senior Debt. We will pay quarterly revolving credit facility fees of 50 basis points per annum. At our option, borrowings
F-20
Table of Contents
under both the term loan facility and the revolving credit facility bear interest at either the base rate or a eurodollar-based rate (each as more fully described in the amended and restated revolving credit and term loan agreement) plus an applicable margin as determined based on the funded debt to EBITDA ratio (as more fully described in the amended and restated revolving credit and term loan agreement). These rates are summarized in the following table:
| Basis for Pricing |
Level I |
Level II | ||
| Consolidated Funded Debt/EBITDA |
<1.00:1.00 | >1.00:1.00 | ||
| Revolving Credit Eurodollar Margin (LIBOR) |
200 basis points | 250 basis points | ||
| Revolving Credit Base Rate Margin |
100 basis points | 150 basis points | ||
| Term Loan Eurodollar Margin (LIBOR) |
262.5 basis points | 312.5 basis points | ||
| Term Loan Base Rate Margin |
162.5 basis points | 212.5 basis points |
Interest is payable quarterly in arrears for base rate borrowings and on the last day of the applicable eurodollar-interest period for any eurodollar-based borrowings. Principal payments on the term loan facility of $1.75 million are due on the first day of each quarter beginning October 1, 2013, with any remaining balance due in July 2018. Borrowings under the revolving credit facility are automatically converted to five-year term loans at any time such outstanding amounts are greater than or equal to $25.0 million and carry the same maturity date as the initial $35.0 million term loan. Total borrowings under the revolving credit facility may not exceed a borrowing availability limit based on a multiple of EBITDA for the trailing twelve months (as more fully described in the amended and restated revolving credit and term loan agreement). Mandatory prepayments include net cash proceeds from certain asset sales, 100% of the net cash proceeds of any subordinated debt and 50% of the net cash proceeds of certain equity transactions and any equity interests issued under certain stock option or employee incentive plans.
The Current Senior Debt has priority in repayment to all other outstanding debt. We have granted our lenders a security interest in substantially all of our assets, including intellectual property, pursuant to a security agreement and an intellectual property security agreement, except that the security interest shall apply only after the funded debt to EBITDA ratio is greater than or equal to 1:00 to 1:00. We are subject to complying with certain financial covenants, including minimum trailing twelve month EBITDA levels, funded debt to EBITDA ratio and a fixed charge coverage ratio (each as more fully described in the amended and restated revolving credit and term loan agreement). The amended and restated revolving credit and term loan agreement contains customary affirmative and negative covenants and prohibits, among other things and subject to certain exceptions, the incurrence of additional debt, payment of other debt obligations, incurrence of liens, acquisitions of businesses or capital expenditures in excess of stated amounts, sales of businesses or assets, payment of dividends, making loans or advances and certain other restrictions. The amended and restated revolving credit and term loan agreement also contains customary events of default including, among others, payment defaults, breaches of covenants, bankruptcy and insolvency events, cross defaults with certain material indebtedness, judgment defaults, change of control and breaches of representations and warranties.
Subordinated Debt
In November 2010, we entered into a loan and security agreement with a lender and issued a secured promissory note in the aggregate principal amount of $13.0 million, or the Subordinated Note, and a warrant to purchase our Series 1 common stock, or the Common Stock Warrant. The Subordinated Note bore interest at a rate of 12.5% per annum, with interest payable monthly in arrears, and with an original maturity date of November 30, 2015. In October 2011, we repaid the full amount of the Subordinated Note. The Common Stock Warrant was exercised in full in March 2013.
The Common Stock Warrant was exercisable for 457,796 shares of Series 1 common stock at an exercise price of $0.004 per share. In the event any amount of the borrowing under the Subordinated Note had been unpaid on the third anniversary of the borrowing, the number of shares for which the Common Stock Warrant was exercisable would have increased by 70,571 shares. The Common Stock Warrant was assigned an original
F-21
Table of Contents
fair value of $1.5 million, or $3.28 per share, estimated using the Black-Scholes-Merton valuation model. The following assumptions were used to determine the fair value of the Common Stock Warrant for the year ended December 31, 2010: a term of ten years less the time passed since the original issuance, a risk-free interest rate of 1.26%, volatility of 66.33% and dividend yield of zero. As the number of shares of Series 1 common stock issuable upon exercise of this Common Stock Warrant was not fixed on the date of grant, the fair value of the Common Stock Warrant was recorded as a warrant liability with an offsetting amount recorded as a discount to the Subordinated Note on our consolidated balance sheet. This discount was being accreted to non-cash interest expense over the five-year term of the Subordinated Note using the effective interest rate. Interest expense recognized relating to the Subordinated Note discount was $0.2 million during the year ended December 31, 2011.
We re-measured the fair value of this warrant liability at each reporting period and recorded any change in fair value to earnings. During 2011, the fair value of the Common Stock Warrant increased by $2.1 million, which was recorded as a charge to earnings and an increase to the carrying value of the warrant liability. The following assumptions were used to determine the fair value of the Common Stock Warrant during the year ended December 31, 2011: a term of ten years, less the time passed since the original issuance, a risk-free interest rate of 0.23%, volatility of 54.02% and dividend yield of zero.
In October 2011, as a result of the repayment of the Subordinated Note, the carrying value of the note discount of $1.2 million was extinguished, which resulted in a charge to non-cash interest expense. Also, as the number of shares of Series 1 common stock issuable upon exercise of the Common Stock Warrant became fixed, the carrying value of the derivative liability of $3.6 million was reclassified to additional paid-in capital. The Common Stock Warrant was exercised on March 22, 2013.
Seller Notes
In August 2011, we issued seller notes payable, or the VoucherCodes Notes, in connection with our acquisition of eConversions Limited. The VoucherCodes Notes have an aggregate principal amount of $6.0 million, mature on August 17, 2013, and bear interest at a rate of 5.0% annually. The carrying value of the VoucherCodes Notes of $6.0 million is included in short-term notes payable as of December 31, 2012.
In November 2010, we issued a seller note payable, or the RetailMeNot.com Note, in connection with our acquisition of RetailMeNot.com. The RetailMeNot.com Note had a face amount of $10.0 million with a maturity date of February 28, 2012 and no stated interest rate. The RetailMeNot.com Note was recorded at its estimated fair value of $8.8 million at the acquisition date, and imputed interest was accreted to non-cash interest expense to the maturity date, using a 10% interest rate. The RetailMeNot.com Note was repaid in full in 2012.
In April 2010, we issued a seller note payable, or the Domain Note, in connection with the acquisition of an internet domain name. The Domain Note had an original face amount of $5.0 million, payable in four equal annual installments beginning in April 2010 and ending in April 2013, with no stated interest rate. The Domain Note was recorded at its estimated fair value of $4.4 million at the acquisition date, and imputed interest was being accreted to non-cash interest expense to the maturity date, using a 10% interest rate. In December 2011, we amended the agreement to reduce the then outstanding payment obligation of $2.5 million by $0.3 million and to accelerate the repayment of the remaining balance of $2.2 million to three equal payments due in December 2011, February 2012 and April 2012. The Domain Note was repaid in full in 2012.
Other Notes
In conjunction with our acquisition of Miwim (Web.Bons-de-Reduction.com and Poulpeo.com), we entered into deferred compensation arrangements with the former owners of Miwim, at which time we issued promissory notes, or the Miwim Notes, with an aggregate principal amount $3.5 million bearing interest at 5.0% annually. Principal is to be repaid in equal annual installments of $1.75 million over a two-year period along with accompanying accrued interest. As of December 31, 2012, $1.75 million of the Miwim Notes are included in short-term notes payable.
F-22
Table of Contents
Future maturities of debt are as follows (in thousands):
| Year Ended December 31, |
||||
| 2013 |
$ | 16,650 | ||
| 2014 |
10,650 | |||
| 2015 |
11,625 | |||
|
|
|
|||
| $ | 38,925 | |||
|
|
|
Debt Issuance Costs
We incurred aggregate debt issuance costs of $2.7 million in connection with our senior debt, subordinated debt and seller notes. These costs are being amortized to non-cash interest expense over the terms of the related indebtedness using the effective interest method. These costs were $0.1 million, $1.2 million and $0.6 million during the years ended December 31, 2010, 2011 and 2012, respectively.
Estimated amortization of these debt issuance costs through the maturity of the related borrowings is as follows (in thousands):
| Year Ended December 31, |
||||
| 2013 |
$ | 430 | ||
| 2014 |
269 | |||
| 2015 |
104 | |||
|
|
|
|||
| $ | 803 | |||
|
|
|
8. Commitments and Contingencies
Operating Leases
We lease office space, including our corporate headquarters in Austin, Texas under non-cancelable operating leases. Rent expense under these operating leases was $0.1 million, $0.3 million, $1.4 million and $2.2 million (unaudited) for the years ended December 31, 2010, 2011 and 2012 and the nine months ended September 30, 2013, respectively.
Certain of these lease arrangements have renewal or expansion options and adjustments for market provisions, such as free or escalating base monthly rental payments. Amounts reported in the table below are reported net of rent concessions. We recognize rent expense under such lease arrangements on a straight-line basis over the initial term of the lease. The difference between the straight-line expense and the cash paid for rent has been recorded as deferred rent.
We are responsible for paying our proportionate share of the actual operating expenses and real estate taxes under certain of these lease agreements. These operating expenses are not included in the table below. Future minimum lease payments under non-cancelable operating leases (including rent escalation clauses) with terms in excess of one year as of December 31, 2012 are as follows (in thousands):
| Year Ended December 31, |
||||
| 2013 |
$ | 1,550 | ||
| 2014 |
2,590 | |||
| 2015 |
2,981 | |||
| 2016 |
2,981 | |||
| 2017 |
3,057 | |||
| Thereafter |
7,804 | |||
|
|
|
|||
| $ | 20,963 | |||
|
|
|
F-23
Table of Contents
Contractual Obligations
As of December 31, 2012, we had purchase obligations of approximately $0.6 million that primarily relate to contracts for non-cancellable services. The obligations are primarily due and payable in 2013.
Legal Matters
From time to time, we may be involved in litigation relating to claims arising in the ordinary course of business. Management believes that there are no claims or actions pending or threatened against the Company, the ultimate disposition of which would have a material impact on our consolidated financial position, results of operations or cash flows.
Employment Agreements
We have entered into employment and change of control arrangements with certain of our executive officers and with certain employees in Europe.
Indemnification
In the normal course of business, to facilitate transactions related to our operations, we indemnify certain parties, including lessors, service providers and, from time to time, retailers and performance marketing networks with respect to certain matters. We have agreed to hold certain parties harmless against losses arising from a breach of representations or covenants, or other claims, including intellectual property infringement claims made against those certain parties by third parties. These agreements may limit the time within which an indemnification claim can be made and the amount of the claim. In addition, we have entered into indemnification agreements with our officers and directors, and our bylaws contain similar indemnification obligations.
9. Redeemable Convertible Preferred Stock
Reverse Stock Split
On June 5, 2013, our Board of Directors approved, and on June 12, 2013 we affected, a four-for-one reverse stock split of our common and preferred stock. All share and per share information for all periods presented has been adjusted to reflect the effect of such reverse stock split. On July 24, 2013, we amended our certificate of incorporation to adjust the amount of our authorized shares to: 150,000,000 shares (unaudited) of Series 1 common stock, 6,107,494 shares (unaudited) of Series 2 common stock, and 10,000,000 shares (unaudited) of preferred stock. The common and preferred stock have a par value of $0.001 per share.
Initial Public Offering
On July 24, 2013, we completed our initial public offering of 10,454,544 shares of Series 1 common stock, at a price of $21.00 per share, before underwriting discounts and commissions. We sold 4,545,454 of such shares and existing stockholders sold an aggregate of 5,909,090 of such shares, including 1,363,636 shares sold by selling stockholders as a result of the underwriters’ exercise of their over-allotment option to purchase additional shares. Our initial public offering generated net proceeds to us of approximately $85.4 million, after deducting underwriting discounts and commissions. Expenses incurred by us for our initial public offering were approximately $3.4 million and were recorded against the net proceeds received by us from our initial public offering. We did not receive any proceeds from the sale of shares by the selling stockholders in our initial public offering.
With the net proceeds of our initial public offering, we (i) paid in full accumulated dividends on our previously outstanding shares of preferred stock, which totaled approximately $52.5 million, (ii) repaid the outstanding principal and accrued interest on seller notes issued in connection with our acquisition of eConversions Limited in 2011, which totaled approximately $6.6 million (unaudited), (iii) repaid $1.75 million (unaudited) of our senior debt in October 2013, and (iv) acquired the business of YSL Ventures, Inc. in October 2013 for approximately $17.8 million (unaudited) in initial cash consideration.
F-24
Table of Contents
Prior to our initial public offering, we had outstanding 6,993,977 shares of Series B-1 preferred stock, 26,846,339 shares of Series B-2 preferred stock, 3,053,747 shares of Series B-3 preferred stock, 6,107,494 shares of Series BB-3 preferred stock, 996,479 shares of Series B-4 preferred stock and 182,425 shares of Series B-5 preferred stock. The outstanding shares of redeemable convertible preferred stock converted on a one-to-one basis into shares of common stock concurrent with the closing of our initial public offering. All of the outstanding shares of our Series B-1, Series B-2, Series B-3, Series B-4 and Series B-5 preferred stock automatically converted into an aggregate of 38,072,967 shares of Series 1 common stock and all of the outstanding shares of our Series BB-3 preferred stock automatically converted into an aggregate of 6,107,494 shares of Series 2 common stock. Following the closing of our initial public offering, there were no shares of preferred stock outstanding.
Redeemable Convertible Preferred Stock
On May 9, 2012, our Board of Directors and stockholders approved an amended and restated certificate of incorporation that authorized 49,808,646 shares of preferred stock (of which 9,365,258 shares were designated Series B-1 preferred stock, 28,964,412 shares were designated Series B-2 preferred stock, 3,125,000 shares were designated Series B-3 preferred stock, 6,107,495 shares were designated as Series BB-3 preferred stock, 996,481 shares were designated Series B-4 preferred stock and 1,250,000 shares were designated Series B-5 preferred stock) (collectively referred to as “Series B preferred stock”).
On November 23, 2010, our Board of Directors and stockholders approved an amended and restated certificate of incorporation that converted each share of Series A-1 preferred stock into 1.13 shares (9,365,254 shares in the aggregate) of Series B-1 preferred stock.
In November 2010, we issued 22,956,974 shares of Series B-2 preferred stock at a price of $4.66 per share. These shares were issued for an aggregate of $107.0 million, less issuance costs of $2.2 million. These shares include 4,291,022 shares of Series B-2 preferred stock issued in connection with the acquisition of RetailMeNot.com for an aggregate of $20.0 million.
In May 2011, we issued 2,145,512 shares of Series B-2 preferred stock at a price of $4.66 per share for an aggregate of $10.0 million.
In August 2011, we issued 3,861,916 shares of Series B-2 preferred stock at a price of $4.66 per share. These shares were issued upon the exercise of outstanding warrants for an aggregate of $18.1 million.
In August 2011, we issued 978,998 shares of Series B-4 preferred stock at a price of $7.15 per share for an aggregate of $7.0 million in connection with the acquisition of eConversions Limited. In September 2011, we issued an additional 17,482 shares of Series B-4 preferred stock at a price of $7.15 per share for an aggregate of $0.1 million.
In October 2011, we issued 3,053,747 shares of Series B-3 preferred stock and 6,107,494 shares of Series BB-3 preferred stock, in each case at a price of $16.37 per share. These shares were issued for an aggregate consideration of $150.0 million, less issuance costs of $0.2 million.
In November 2011, we repurchased 2,371,277 shares of Series B-1 preferred stock and 2,118,063 shares of Series B-2 preferred stock, in each case at a repurchase price of $15.59 per share for an aggregate of $70.0 million. The repurchase resulted in the accretion of the associated unamortized preferred stock issuance costs of $0.2 million and a premium of $49.9 million recorded as an increase to accumulated deficit for the excess of the repurchase price over the carrying value of the preferred stock and associated issuance costs.
In May 2012, we issued 182,425 shares of Series B-5 preferred stock at a price of $16.45 per share in connection with the acquisition of Miwim (Web.Bons-de-Reduction.com and Poulpeo.com). These shares were issued for an aggregate value of $3.0 million.
F-25
Table of Contents
Preferred Stock Rights
The rights, preferences, privileges and restrictions granted to and imposed on the Series B-1 preferred stock, Series B-2 preferred stock, Series B-3 preferred stock, Series BB-3 preferred stock, Series B-4 preferred stock and Series B-5 preferred stock, which were in effect prior to the conversion of our redeemable convertible preferred stock into shares of common stock concurrent with the closing of our initial public offering, were as set forth below.
Dividends
The holders of our preferred stock were entitled to cumulative dividends, which accrued at the rate of $0.31 per share per annum for Series B-1 preferred stock, $0.37 per share per annum for Series B-2 preferred stock, $1.31 per share per annum for both Series B-3 and BB-3 preferred stock, $0.29 per share per annum for Series B-4 preferred stock and $0.66 per share per annum for Series B-5 preferred stock.
Holders of our Series B-1 preferred stock, Series B-2 preferred stock, Series B-3 preferred stock and Series BB-3 preferred stock (together, the “Senior Preferred”) were entitled to receive, on a pari passu basis, cumulative dividends prior to and in preference to any dividends declared or paid on Series B-4 preferred stock, Series B-5 preferred stock and our common stock. Holders of our Series B-4 preferred stock and Series B-5 preferred stock (together, the “Junior Preferred”) were entitled to receive, on a pari passu basis, cumulative dividends prior to and in preference to any dividends declared or paid on our common stock.
Dividends in arrears have been recorded as deemed dividends and were $14.2 million and $38.8 million as of December 31, 2011 and 2012, respectively.
Liquidation Preference
In the event of any voluntary or involuntary liquidation, dissolution or winding up of the Company or a Deemed Liquidation Event (as defined in our certificate of incorporation), the holders of the then outstanding Senior Preferred were entitled to receive, prior and in preference to any payments to the holders of Junior Preferred or common stock, an amount equal to, for each series of Senior Preferred, the greater of (i) the applicable Series B Preferred Stock Original Issue Price (as defined below) for such series of Senior Preferred plus any accrued or declared but unpaid dividends thereon, or (ii) such amount per share as would have been payable had all shares of the applicable series of Senior Preferred been converted into the applicable series of common stock (including all dividends payable in connection with such conversion) immediately prior to such liquidation, dissolution or winding up. After the payment of all preferential amounts required to be paid to the holders of Senior Preferred, the holders of then-outstanding Junior Preferred were then entitled to receive, prior and in preference to any payment to the holders of common stock, an amount equal to, for each series of Junior Preferred, the greater of (i) the applicable Series B Preferred Stock Original Issue Price for such series of Junior Preferred plus any accrued or declared but unpaid dividends thereon, or (ii) such amount per share as would have been payable had all shares of the applicable series of Junior Preferred been converted into Series 1 common stock (including all dividends payable in connection with such conversion) immediately prior to such liquidation, dissolution or winding up. After the payment of all preferential amounts required to be paid to the holders of the preferred stock, the remaining assets available for distribution to stockholders were to be distributed pro rata among the holders of common stock.
Redemption
At any time after the fifth anniversary of the date of the initial issuance of the Series B-3 preferred stock, upon the written request of the holders of a majority of the outstanding shares of Series B preferred stock, we were required to redeem all outstanding shares of Series B preferred stock. For each series of preferred stock, the per share redemption price would equal the greater of (i) the applicable Series B Preferred Stock Original Issue Price plus any accrued or declared but unpaid dividends thereon, and (ii) the fair market value of a single share of
F-26
Table of Contents
such series of preferred stock as of the date of our receipt of the redemption request. The fair market value of each series of preferred stock would be determined by mutual agreement of the Company and a certain percentage of the holders of such series or, if no mutual agreement is achieved, by a third-party appraiser selected by mutual agreement of the Company and a certain percentage of the holders of such series.
Based on the estimated fair market value of the Company’s stock as of December 31, 2011 and 2012, the redemption price of each series of the Series B preferred stock would exceed the applicable Series B Preferred Stock Original Issue Price plus all accrued dividends as of the first possible redemption date. However, we did not provide for accretion beyond the Series B Preferred Stock Original Issue Price plus accrued dividends, as we believed it was not probable the Series B preferred stock would become redeemable as of December 31, 2012.
Conversion
As of December 31, 2012, each share of Series B-1 preferred stock, Series B-2 preferred stock, Series B-3 preferred stock, Series B-4 preferred stock and Series B-5 preferred stock was convertible into 1.0 share of Series 1 common stock, and each share of Series BB-3 preferred stock was convertible into 1.0 share of Series 2 common stock.
With the exception of the Series BB-3 preferred stock, each share of Series B preferred stock was convertible at any time at the option of the holder into a number of fully-paid shares of Series 1 common stock as determined by dividing the applicable Series B Preferred Stock Original Issue Price by the applicable Conversion Price (as defined below) in effect at the time of conversion.
Each share of Series BB-3 preferred stock was convertible at any time at the option of the holder into a number of fully-paid shares of Series 2 common stock as determined by dividing the applicable Series B Preferred Stock Original Issue price by the applicable Conversion Price. As of December 31, 2012, the Series B Preferred Stock Original Issue Price and Conversion Price are both defined as follows:
| Per Share Amount |
||||
| Series B-1 |
$ | 3.82 | ||
| Series B-2 |
$ | 4.66 | ||
| Series B-3 |
$ | 16.37 | ||
| Series BB-3 |
$ | 16.37 | ||
| Series B-4 |
$ | 7.15 | ||
| Series B-5 |
$ | 16.45 | ||
The Series B-1 preferred stock, Series B-2 preferred stock, Series B-3 preferred stock, Series B-4 preferred stock and Series B-5 preferred stock would automatically convert into Series 1 common stock at the applicable conversion rate then in effect, and the Series BB-3 preferred stock would automatically convert into Series 2 common stock (or, if subsequently elected by the holder, Series 1 common stock) at the applicable conversion rate then in effect upon (i) the closing of the sale of shares of common stock to the public at a minimum price per share equal to the greater of (a) $24.56 per share (subject to appropriate adjustment in the event of any stock dividend, stock split, combination or other similar recapitalization with respect to the common stock) or (b) the Series B-3 Liquidation Amount (as defined in our certificate of incorporation) in a firm-commitment underwritten public offering pursuant to an effective registration statement under the Securities Act of 1933, as amended, resulting in at least $75.0 million of proceeds, net of the underwriting discount and commissions, to the Company, or (ii) the date or occurrence of an event, specified by vote or written consent of the holders of a majority of the then outstanding shares of preferred stock, a majority of the then outstanding shares of Series B-3 preferred stock and a majority of the then outstanding shares of Series BB-3 preferred stock.
F-27
Table of Contents
A total of 44.2 million shares of common stock were reserved for issuance upon the conversion of the preferred stock. The following table is a summary of preferred stock as of December 31, 2012 (in thousands, except share amounts):
| Shares Authorized |
Shares Issued and Outstanding |
Conversion Rate |
Value of Outstanding Shares Based on Series B Original Issuance Price |
Accumulated Dividends As of December 31, 2012 |
Liquidation Value As of December 31, 2012 |
|||||||||||||||||
| Series B-1 |
9,365,258 | 6,993,977 | 1:1 | $ | 26,722 | $ | 4,497 | $ | 31,219 | |||||||||||||
| Series B-2 |
28,964,412 | 26,846,339 | 1:1 | 125,128 | 19,715 | 144,843 | ||||||||||||||||
| Series B-3 |
3,125,000 | 3,053,747 | 1:1 | 50,000 | 4,712 | 54,712 | ||||||||||||||||
| Series BB-3 |
6,107,495 | 6,107,494 | 1:1 | 100,000 | 9,425 | 109,425 | ||||||||||||||||
| Series B-4 |
996,481 | 996,479 | 1:1 | 7,125 | 393 | 7,518 | ||||||||||||||||
| Series B-5 |
1,250,000 | 182,425 | 1:1 | 3,000 | 77 | 3,077 | ||||||||||||||||
|
|
|
|
|
|
|
|
|
|
|
|||||||||||||
| 49,808,646 | 44,180,461 | $ | 311,975 | $ | 38,819 | $ | 350,794 | |||||||||||||||
|
|
|
|
|
|
|
|
|
|
|
|||||||||||||
We evaluated various components of the Series B preferred stock, including redemption features, dividend and voting rights, protective covenants and conversion rights. We concluded that the Series B preferred stock was redeemable at the option of the holders as of December 31, 2011 and 2012, and classified the Series B preferred stock in mezzanine equity.
Voting
The holders of the Series B preferred stock were entitled to vote on matters presented to our stockholders, and were entitled to cast a number of votes equal to the number of shares of Series 1 common stock into which their preferred stock was convertible at the time of such vote, except that the holders of Series BB-3 preferred stock were not entitled to vote in the election of directors.
Pursuant to a voting agreement, the directors appointed by the Series B-1 preferred stock, Series B-2 preferred stock and Series B-3 preferred stock, were entitled to designate two members of our Board of Directors, one seat of which was vacant as of December 31, 2012. Austin Ventures was entitled to designate two members of our Board of Directors. Norwest Venture Partners was entitled to designate two members of our Board of Directors. Institutional Venture Partners was entitled to designate one member of our Board of Directors. Our Board of Directors, as a whole, was entitled to designate one member to the Board of Directors.
10. Stockholders’ Equity (Deficit) and Stock-Based Compensation
Common Stock
On September 3, 2012, our Board of Directors approved an amendment to our certificate of incorporation that (a) increased the authorized common stock to 64,214,779 shares, designating 58,107,284 shares as Series 1 common stock and 6,107,495 shares as Series 2 common stock (collectively referred to as the common stock). The common stock has a par value of $0.001 per share. As of December 31, 2011 and 2012, 849,729 and 947,953 shares of Series 1 common stock were outstanding, respectively. There were no shares of Series 2 common stock outstanding as of December 31, 2011 and 2012.
As of December 31, 2011 and 2012, we had contractual rights to repurchase 272,135 and 100,260 shares of common stock (in addition to exercised unvested shares under our 2007 Stock Plan) respectively, upon the holder’s termination from the Company with cause or the holder’s attempt to transfer said shares, other than as permitted under the repurchase agreement. Our repurchase right with respect to such shares will lapse in a series of 32 equal monthly installments, subject to the holder’s completion of each additional complete month of
F-28
Table of Contents
service to the Company after November 24, 2010. As of December 31, 2011 and 2012, we had contractual rights to repurchase 96,990 and 29,900 shares, respectively, of exercised unvested shares under our 2007 Stock Plan. As of December 31, 2011 and 2012, we had repurchased 4,375 shares of exercised unvested shares. As of December 31, 2011 and 2012, we had a liability of $0.2 million and $0.1 million, respectively, associated with exercised unvested shares.
The voting, dividend and liquidation rights of the holders of the common stock are subject to and qualified by the rights, powers and preferences of the holders of our preferred stock, if any. Each share of common stock is entitled to one vote at all meetings of stockholders, except each share of Series 2 common stock is not entitled to vote in connection with the election of the members of our Board of Directors. The number of authorized shares of common stock may be increased or decreased (but not below the number of shares thereof then outstanding) by the affirmative vote of the holders of shares of capital stock of the Company representing a majority of the votes represented by all outstanding shares of capital stock of the Company entitled to vote. The holders of common stock are also entitled to receive dividends, when, if and as declared by our Board of Directors, whenever funds are legally available therefore, subject to the priority rights of any outstanding preferred stock. Each share of Series 2 common stock is convertible, at the option of the holder, into one fully paid and nonassessable share of Series 1 common stock.
On August 7, 2013 we registered 10,262,195 shares (unaudited) of our Series 1 common stock that we have issued or may issue under our 2007 Stock Plan, 2013 Equity Incentive Plan or 2013 Employee Stock Purchase Plan.
Common Stock Warrant
In connection with the November 2010 issuance of Subordinated Debt, discussed in Note 7, “Notes Payable,” we issued a Common Stock Warrant, exercisable for 457,796 shares of Series 1 common stock at an exercise price of $0.004 per share. The Common Stock Warrant was exercised on March 22, 2013.
Stock-Based Compensation
2013 Equity Incentive Plan (unaudited)
Our 2013 Equity Incentive Plan, or 2013 Plan, was approved by our board of directors and our stockholders in July 2013, and replaces our 2007 Stock Plan, as amended, or Prior Plan. Subsequent to our initial public offering, we have not granted, and will not grant in the future, any additional awards under our Prior Plan. However, our Prior Plan will continue to govern the terms and conditions of all outstanding equity awards granted under our Prior Plan.
2007 Stock Option Plan
Options granted under the Prior Plan are either incentive stock options or nonstatutory stock options. Our Board of Directors determines the term of the option, option price, number of shares for which each option is granted, whether restrictions will be imposed on the shares subject to the option, and the vesting period for each option. Generally, options become 25% vested after one year of service, with the remaining 75% vesting on a pro-rata monthly basis over the remaining three years. The term of each option is ten years.
Stock-based compensation expense for all employee share-based payment awards is based upon the grant date fair value. We recognize compensation costs, net of estimated forfeitures, on a straight-line basis over the requisite service period of the award. Forfeiture rates are estimated at grant date based on historical experience and adjusted in subsequent periods for differences in actual forfeitures from our previous estimates. We recorded $0.1 million, $0.5 million, $4.0 million and $7.1 million (unaudited) of stock-based compensation expense, for the years ended December 31, 2010, 2011 and 2012 and the nine months ended September 30, 2013, respectively. We include stock-based compensation expense in cost and expense consistent with the classification of respective employees’ cash compensation in the consolidated statements of operations.
F-29
Table of Contents
The fair value of common stock options granted during the years ended December 31, 2010, 2011 and 2012 and the nine months ended September 30, 2013 was estimated on the grant date using the Black-Scholes-Merton option pricing model. The weighted-average assumptions for stock options granted are outlined in the following table:
| Year Ended December 31, | Nine Months Ended September 30, 2013 |
|||||||||||||||
| 2010 | 2011 | 2012 | ||||||||||||||
| (unaudited) | ||||||||||||||||
| Expected volatility |
77.23 | % | 73.00 | % | 64.46 | % | 60.74 | % | ||||||||
| Expected term (in years) |
5.90 | 6.02 | 5.97 | 6.01 | ||||||||||||
| Risk-free rate of return |
2.53 | % | 1.84 | % | 0.95 | % | 1.22 | % | ||||||||
| Expected dividend yield |
— | — | — | — | ||||||||||||
Expected volatility is based on the volatility of comparable publicly traded entities. The expected term represents the period of time the stock options are expected to be outstanding and is based on the “simplified method”. We used the “simplified method” due to the lack of sufficient historical exercise data to provide a reasonable basis upon which to otherwise estimate the expected life of the stock options. The risk-free interest rate assumptions we use are based on observed market interest rates appropriate for the term of our employee options.
The following table summarizes the activity of our Prior Plan and 2013 Plan for the years ended December 31, 2010, 2011 and 2012 and the nine months ended September 30, 2013:
| Stock Options |
Number of Options |
Weighted- Average Exercise Price |
Weighted- Average Remaining Contractual Life |
Aggregate Intrinsic Value (in thousands) |
Weighted- Average Fair Value (per share) |
|||||||||||||||
| Outstanding at December 31, 2009 |
25,063 | $ | 0.38 | 8.14 | $ | 19 | $ | 0.22 | ||||||||||||
| Granted |
533,075 | 1.12 | 0.75 | |||||||||||||||||
| Exercised |
(45,477 | ) | 1.12 | 0.76 | ||||||||||||||||
| Forfeited |
(24,375 | ) | 1.12 | 0.75 | ||||||||||||||||
|
|
|
|
|
|
|
|||||||||||||||
| Outstanding at December 31, 2010 |
488,286 | $ | 1.08 | 9.36 | $ | 487 | $ | 0.73 | ||||||||||||
| Granted |
2,081,920 | 2.96 | 1.92 | |||||||||||||||||
| Exercised |
(85,294 | ) | 2.08 | 1.36 | ||||||||||||||||
| Forfeited |
(9,700 | ) | 1.28 | 0.85 | ||||||||||||||||
|
|
|
|
|
|
|
|||||||||||||||
| Outstanding at December 31, 2011 |
2,475,212 | $ | 2.63 | 9.36 | $ | 8,443 | $ | 1.71 | ||||||||||||
| Granted |
2,441,553 | 11.59 | 6.70 | |||||||||||||||||
| Exercised |
(102,599 | ) | 2.45 | 1.61 | ||||||||||||||||
| Forfeited |
(141,656 | ) | 4.28 | 2.56 | ||||||||||||||||
|
|
|
|
|
|
|
|||||||||||||||
| Outstanding at December 31, 2012 |
4,672,510 | $ | 7.26 | 9.00 | $ | 52,588 | $ | 4.29 | ||||||||||||
| Granted (unaudited) |
1,585,298 | 19.78 | 11.07 | |||||||||||||||||
| Exercised (unaudited) |
(429,425 | ) | 3.84 | 2.40 | ||||||||||||||||
| Forfeited (unaudited) |
(272,884 | ) | 10.05 | 5.84 | ||||||||||||||||
|
|
|
|
|
|
|
|||||||||||||||
| Outstanding at September 30, 2013 (unaudited) |
5,555,499 | $ | 10.96 | 8.63 | $ | 136,722 | $ | 6.30 | ||||||||||||
|
|
|
|
|
|
|
|
|
|
|
|||||||||||
| Vested at December 31, 2012 and expected to vest |
3,424,475 | $ | 8.37 | 9.19 | $ | 34,631 | ||||||||||||||
| Vested at September 30, 2013 and expected to vest (unaudited) |
3,669,874 | 12.99 | 8.90 | $ | 82,880 | |||||||||||||||
| Exercisable at December 31, 2012 |
1,076,349 | $ | 3.48 | 8.36 | $ | 16,016 | ||||||||||||||
| Exercisable at September 30, 2013 (unaudited) |
1,692,921 | $ | 6.34 | 8.02 | $ | 49,486 | ||||||||||||||
F-30
Table of Contents
The aggregate intrinsic value in the table above represents the total pre-tax intrinsic value that would have been received by the option holders had all option holders exercised their options on December 31, 2010, 2011 and 2012 and September 30, 2013, respectively. The aggregate intrinsic value is determined by the fair value of our common stock and the per-share grant price. The aggregate intrinsic value of stock options exercised, represented in the stock option activity table above, was $0.8 million and $7.9 million (unaudited) for the year ended December 31, 2012 and the nine months ended September 30, 2013, respectively. The total fair value of employee options vested during the years ended December 31, 2010, 2011 and 2012 and the nine months ended September 30, 2013 was approximately $0.1 million, $0.3 million, $2.3 million and $5.1 million (unaudited), respectively. Outstanding unvested options in the table above were 470,781, 2,265,192, 3,634,895 and 3,900,034 (unaudited) as of December 31, 2010, 2011 and 2012 and September 30, 2013, respectively, with 931,844 and 1,067,603 (unaudited) vesting during the year ended December 31, 2012 and the nine months ended September 30, 2013, respectively. The weighted-average grant date fair value of shares that vested during the year ended December 31, 2012 and the nine months ended September 30, 2013 was $2.43 per share and $4.81 per share (unaudited), respectively. Unvested shares as of December 31, 2012 and September 30, 2013 have a weighted average grant date fair value of $4.90 per share and $7.38 per share (unaudited), respectively.
The following table summarizes information about stock options outstanding at December 31, 2012:
| Options Outstanding | Options Exercisable | |||||||||||||||
| Exercise Price |
Number Outstanding |
Weighted- Average Remaining Contractual Life (Years) |
Number Exercisable |
Weighted- Average Remaining Contractual Life (Years) |
||||||||||||
| $0.38 |
25,063 | 5.14 | 25,063 | 5.14 | ||||||||||||
| $1.12 |
361,283 | 7.48 | 262,291 | 7.48 | ||||||||||||
| $2.08 |
1,350,013 | 8.52 | 471,830 | 8.52 | ||||||||||||
| $5.32 |
541,950 | 8.80 | 153,627 | 8.80 | ||||||||||||
| $6.04 |
210,375 | 9.05 | 17,279 | 9.05 | ||||||||||||
| $10.36 |
960,411 | 9.36 | 135,804 | 9.35 | ||||||||||||
| $11.40 |
398,064 | 9.62 | 5,871 | 9.62 | ||||||||||||
| $14.64 |
825,351 | 9.96 | 4,584 | 9.92 | ||||||||||||
|
|
|
|
|
|
|
|
|
|||||||||
| 4,672,510 | 9.00 | 1,076,349 | 8.36 | |||||||||||||
|
|
|
|
|
|
|
|
|
|||||||||
As of December 31, 2012 and September 30, 2013, $21.1 million and $29.4 million (unaudited), respectively, of total unrecognized compensation cost related to stock options is expected to be recognized over weighted-average periods of 3.0 years and 2.8 years (unaudited) as of December 31, 2012 and September 30, 2013, respectively. As of December 31, 2012 and September 30, 2013, 1,090,161 and 4,089,786 shares (unaudited), respectively, of our Series 1 common stock were available for grant under the Prior Plan and 2013 Plan.
11. Earnings (Loss) Per Share
Basic and diluted net income (loss) per common share is presented in conformity with the two-class method required for participating securities. Prior to our initial public offering, holders of Series B-1, Series B-2, Series B-3, Series BB-3, Series B-4 and Series B-5 preferred stock were each entitled to receive cumulative dividends at the annual rate of $0.31, $0.37, $1.31, $1.31, $0.29 and $0.66 per share per annum, respectively, payable prior and in preference to any dividends on any shares of our common stock. In the event a dividend was paid on common stock, the holders of preferred stock were entitled to a proportionate share of any such dividend as if they were holders of common stock (on an as-if converted basis). Accordingly, all of our outstanding series of preferred stock were considered to be participating securities. The holders of our preferred stock did not have a contractual obligation to share in our losses; therefore, no amount of total undistributed loss is allocated to preferred stock.
F-31
Table of Contents
The rights of the holders of Series 1 and Series 2 common stock are identical, except with respect to voting. Each share of Series 1 and Series 2 common stock is entitled to one vote per share; however holders of Series 2 common stock are not entitled to vote in connection with the election of the members of our Board of Directors. Shares of Series 2 common stock may be converted into shares of Series 1 common stock at any time at the option of the stockholder.
Under the two-class method, basic net income (loss) per share attributable to common stockholders is computed by dividing the net income (loss) attributable to common stockholders by the weighted-average number of shares of common stock outstanding during the period. Net income (loss) attributable to common stockholders is determined by allocating undistributed earnings, calculated as net income less current period preferred stock dividends, between common stock and preferred stock. In computing diluted net income (loss) attributable to common stockholders, undistributed earnings are re-allocated to reflect the potential impact of dilutive securities. Diluted net income per share attributable to common stockholders is computed by dividing the net income attributable to common stockholders by the weighted-average number of shares of common stock outstanding, including potential dilutive shares of common stock assuming the dilutive effect of outstanding stock options and warrants using the treasury stock method or if-converted method, whichever is more dilutive.
On July 5, 2013, in exchange for agreeing to vote in favor of the conversion of preferred stock to common stock in connection with our initial public offering, we agreed to pay Institutional Venture Partners XIII, L.P. and entities affiliated with J.P. Morgan $2,046,001 and $4,092,002, respectively, upon delivery by us of a written request to such entities to vote to effect such conversion. We delivered such request and such payments were made on July 11, 2013. These payments had no impact on net income as the amounts are recognized within equity; however, these amounts are reflected as deemed dividends on preferred stock and, as such, impact net income (loss) attributable to common stockholders and basic and diluted net income (loss) per share attributable to common stockholders.
The following table sets forth the computation of basic and diluted earnings (loss) per share of common stock (in thousands, except per share amounts):
| Year Ended December 31, | Nine Months Ended September 30, | |||||||||||||||||||
| 2010 | 2011 | 2012 | 2012 | 2013 | ||||||||||||||||
| (unaudited) | (unaudited) | |||||||||||||||||||
| Net income |
$ | 2,344 | $ | 16,961 | $ | 25,993 | $ | 18,248 | $ | 17,691 | ||||||||||
| Preferred stock dividends on participating preferred stock |
(3,247 | ) | (64,715 | ) | (24,577 | ) | (18,388 | ) | (19,928 | ) | ||||||||||
|
|
|
|
|
|
|
|
|
|
|
|||||||||||
| Total undistributed earnings (loss) |
(903 | ) | (47,754 | ) | 1,416 | (140 | ) | (2,237 | ) | |||||||||||
| Undistributed earnings allocated to participating preferred stock |
— | — | (1,390 | ) | — | — | ||||||||||||||
|
|
|
|
|
|
|
|
|
|
|
|||||||||||
| Net income (loss) attributable to common stockholders |
$ | (903 | ) | $ | (47,754 | ) | $ | 26 | $ | (140 | ) | $ | (2,237 | ) | ||||||
|
|
|
|
|
|
|
|
|
|
|
|||||||||||
| Weighted average number of common shares used in computing net income (loss) per share: |
||||||||||||||||||||
| Basic |
709 | 744 | 841 | 821 | 13,703 | |||||||||||||||
| Diluted |
709 | 744 | 2,277 | 821 | 13,703 | |||||||||||||||
| Net income (loss) per share attributable to common stockholders: |
||||||||||||||||||||
| Basic and diluted |
$ | (1.27 | ) | $ | (64.19 | ) | $ | 0.03 | $ | (0.17 | ) | $ | (0.16 | ) | ||||||
|
|
|
|
|
|
|
|
|
|
|
|||||||||||
F-32
Table of Contents
The following common equivalent shares were excluded from the diluted net loss per share calculation as their inclusion would have been anti-dilutive (in thousands):
| Year Ended December 31, | Nine Months Ended September 30, | |||||||||||||||||||
| 2010 | 2011 | 2012 | 2012 | 2013 | ||||||||||||||||
| (unaudited) | (unaudited) | |||||||||||||||||||
| Stock options |
302 | 1,353 | — | 773 | 2,091 | |||||||||||||||
| Common and preferred stock warrants |
394 | 2,592 | — | 458 | 134 | |||||||||||||||
| Convertible preferred stock |
10,646 | 36,459 | — | — | — | |||||||||||||||
|
|
|
|
|
|
|
|
|
|
|
|||||||||||
| Total |
11,342 | 40,404 | — | 1,231 | 2,225 | |||||||||||||||
|
|
|
|
|
|
|
|
|
|
|
|||||||||||
12. Fair Value Measurements
Fair value is defined as the exit price, or the amount that would be received to sell an asset or paid to transfer a liability in an orderly transaction between market participants as of the measurement date. Generally accepted accounting principles set forth a three-tier fair value hierarchy, which prioritizes the inputs used in measuring fair value. The three tiers are Level 1, defined as observable inputs such as quoted prices in active markets; Level 2, defined as inputs other than quoted prices in active markets that are either directly or indirectly observable; and Level 3, defined as unobservable inputs in which little or no market data exists, therefore requiring an entity to develop our own assumptions.
Assets and liabilities measured at fair value on a recurring basis are summarized below (in thousands):
| Fair Value Measurements at December 31, 2011 | ||||||||||||||||
| Level 1 | Level 2 | Level 3 | Total | |||||||||||||
| Assets: |
||||||||||||||||
| Money market deposit account |
$ | 75,867 | $ | — | $ | — | $ | 75,867 | ||||||||
| Liabilities: |
||||||||||||||||
| Interest rate swap agreement |
$ | — | $ | 183 | $ | — | $ | 183 | ||||||||
| Fair Value Measurements at December 31, 2012 | ||||||||||||||||
| Level 1 | Level 2 | Level 3 | Total | |||||||||||||
| Assets: |
||||||||||||||||
| Money market deposit account |
$ | 871 | $ | — | $ | — | $ | 871 | ||||||||
| Liabilities: |
||||||||||||||||
| Interest rate swap agreement |
$ | — | $ | 85 | $ | — | $ | 85 | ||||||||
| Fair Value Measurements at September 30, 2013 (unaudited) | ||||||||||||||||
| Level 1 | Level 2 | Level 3 | Total | |||||||||||||
| Assets: |
||||||||||||||||
| Money market deposit account |
$ | 872 | $ | — | $ | — | $ | 872 | ||||||||
| Liabilities: |
||||||||||||||||
| Interest rate swap agreement |
$ | — | $ | 26 | $ | — | $ | 26 | ||||||||
Prior to its reclassification to additional paid-in capital, the fair value of the Common Stock Warrant issued in November 2010 increased by $2.1 million during the year ended December 31, 2011. During 2011, there was no change in the fair value of acquisition-related contingent consideration or preferred stock warrants. The number of shares exercisable by the warrant became fixed in 2011, and accordingly, the liability was re-classed to additional paid-in capital.
Money market funds are reported as cash and cash equivalents, and warrants and interest rate swap agreements are reported as derivatives liabilities on our consolidated balance sheets. Fair value of our interest
F-33
Table of Contents
rate swap derivative has been determined using the present value of expected cash flows based on market observable interest rate yield curves commensurate with the term of the instrument. Fair values of the acquisition-related contingent consideration have been determined using projected discounted cash flows or the price of comparable securities issued near the date of acquisition, as applicable, based on the type of contingent consideration. Fair values of the warrants have been determined using an option pricing model.
Our other financial instruments consist primarily of accounts receivable, accounts payable, accrued liabilities and notes payable. The carrying value of these assets and liabilities approximate their respective fair values as of December 31, 2011 and 2012 and September 30, 2013 (unaudited) due to the short-term maturities, or in the case of our long-term notes payable, based on the variable interest rate feature. As of December 31, 2010, 2011 and 2012 and September 30, 2013 (unaudited), no significant fair value adjustments were required for nonfinancial assets and liabilities.
13. Income Taxes
The components of pretax income for the years ended December 31, 2010, 2011 and 2012 were as follows (in thousands):
| Year Ended December 31, | ||||||||||||
| 2010 | 2011 | 2012 | ||||||||||
| Domestic |
$ | 3,877 | $ | 26,623 | $ | 38,595 | ||||||
| Foreign |
— | 1,840 | 3,758 | |||||||||
|
|
|
|
|
|
|
|||||||
| Total |
$ | 3,877 | $ | 28,463 | $ | 42,353 | ||||||
|
|
|
|
|
|
|
|||||||
The components of the provision for income taxes attributable to continuing operations are as follows (in thousands):
| Year Ended December 31, | ||||||||||||
| 2010 | 2011 | 2012 | ||||||||||
| Current: |
||||||||||||
| Federal |
$ | 200 | $ | 8,848 | $ | 14,773 | ||||||
| State |
88 | 507 | 836 | |||||||||
| Foreign |
— | 943 | 2,546 | |||||||||
| Deferred: |
||||||||||||
| Federal |
1,064 | 1,604 | (550 | ) | ||||||||
| State |
181 | 55 | — | |||||||||
| Foreign |
— | (455 | ) | (1,245 | ) | |||||||
|
|
|
|
|
|
|
|||||||
| Total provision for income taxes |
$ | 1,533 | $ | 11,502 | $ | 16,360 | ||||||
|
|
|
|
|
|
|
|||||||
Our provision for income taxes attributable to continuing operations differs from the expected tax expense amount computed by applying the statutory federal income tax rate of 34%, 35% and 35%, respectively, to income before income taxes as a result of the following (in thousands):
| Year Ended December 31, | ||||||||||||
| 2010 | 2011 | 2012 | ||||||||||
| Tax at U.S. statutory rate |
$ | 1,318 | $ | 9,962 | $ | 14,824 | ||||||
| State tax provision, net of federal benefit |
208 | 330 | 543 | |||||||||
| Permanent differences and other |
7 | 1,210 | 993 | |||||||||
|
|
|
|
|
|
|
|||||||
| Income tax provision |
$ | 1,533 | $ | 11,502 | $ | 16,360 | ||||||
|
|
|
|
|
|
|
|||||||
F-34
Table of Contents
Deferred income taxes reflect the net tax effects of temporary differences between the carrying amounts of assets and liabilities for financial reporting purposes and the amounts used for income tax purposes. Significant components of deferred taxes are as follows (in thousands):
| 2011 | 2012 | |||||||
| Deferred tax assets: |
||||||||
| Current deferred tax assets |
||||||||
| Reserves and allowances |
$ | 97 | $ | 309 | ||||
| Accrued expenses and deferred rent |
29 | 21 | ||||||
|
|
|
|
|
|||||
| Net current deferred tax assets |
126 | 330 | ||||||
| Noncurrent deferred tax assets |
||||||||
| Deferred rent and other |
245 | 663 | ||||||
| Deferred tax liabilities: |
||||||||
| Noncurrent deferred tax liabilities |
||||||||
| Property and equipment |
(740 | ) | (1,022 | ) | ||||
| Intangibles |
(5,735 | ) | (6,272 | ) | ||||
| Other |
(38 | ) | — | |||||
|
|
|
|
|
|||||
| Total noncurrent deferred tax liabilities |
(6,513 | ) | (7,294 | ) | ||||
|
|
|
|
|
|||||
| Net noncurrent deferred tax liability |
(6,268 | ) | (6,631 | ) | ||||
|
|
|
|
|
|||||
| Net deferred tax liability |
$ | (6,142 | ) | $ | (6,301 | ) | ||
|
|
|
|
|
|||||
As of December 31, 2012, we had no federal net operating loss or tax credit carryforwards.
The exercise of certain of the Company’s stock options results in compensation, which is includable in the taxable income of the exercising option holder and which we can deduct from our taxable income for federal and state income tax purposes. Such compensation results from increases in the fair value of the Company’s common stock subsequent to the date of grant of the exercised stock options. Any option-related excess tax benefits (tax deduction over cumulative book deduction) are recorded as an increase to additional paid-in capital, while option-related tax deficiencies (cumulative book deduction over tax deduction) are recorded as a decrease to additional paid-in capital to the extent of the Company’s additional paid-in capital option pool, then to the income tax provision. During the years ended December 31, 2011 and 2012, there were no option-related tax deductions.
We follow the guidance on accounting for uncertainty in income taxes, which prescribes a recognition threshold and measurement attribute for the financial statement recognition and measurement of a tax position taken or expected to be taken in a tax return and also provides guidance on derecognition, classification, interest and penalties, accounting in interim periods, disclosure and transition. As of December 31, 2012, our federal returns for the years 2009 through 2012 are subject to examination by the Internal Revenue Service. Additionally, various state and foreign income tax returns are subject to examinations for years 2009 through 2012 and 2007 through 2012, respectively. As of December 31, 2011 and 2012, we did not have any significant unrecognized tax benefits recorded on our consolidated balance sheets. Our practice is to recognize interest and penalties in income tax expense. Amounts for penalties and interest were not significant for the years ended December 31, 2011 and 2012.
We are subject to taxation in the U.S. federal and various state and foreign jurisdictions. Significant judgment is required in determining the worldwide provision for income taxes and recording the related income tax assets and liabilities. At December 31, 2012, no provision has been made for U.S. federal and state taxes related to undistributed earnings of our foreign subsidiaries, as we currently expect to permanently reinvest those earnings for the foreseeable future. At December 31, 2012, the unrecognized U.S. deferred tax liability related to undistributed earnings of our foreign subsidiaries was $1.2 million.
For the nine months ended September 30, 2012 and 2013, we recorded income tax expense of $11.2 million (unaudited) and $11.0 million (unaudited), respectively, resulting in an effective tax rate of 38.0% (unaudited)
F-35
Table of Contents
and 38.3% (unaudited), respectively. As of September 30, 2013, our effective tax rate estimate for the year ended December 31, 2013 differed from the statutory rate primarily due to non-deductible stock-based compensation charges, state taxes, the effect of different statutory tax rates in foreign jurisdictions and the benefit of disqualifying dispositions of incentive stock options.
14. Domestic and Foreign Operations
The Company has operations in the U.S. and Europe. Information about these operations is presented below (in thousands):
| Year Ended December 31, | Nine Months Ended September 30, |
|||||||||||||||||||
| 2010 | 2011 | 2012 | 2012 | 2013 | ||||||||||||||||
| (unaudited) | (unaudited) | |||||||||||||||||||
| Net Revenues: |
||||||||||||||||||||
| U.S. |
$ | 16,862 | $ | 72,616 | $ | 119,986 | $ | 77,979 | $ | 104,284 | ||||||||||
| United Kingdom |
— | 7,786 | 21,357 | 14,072 | 19,480 | |||||||||||||||
| Other International |
— | — | 3,342 | 1,844 | 7,548 | |||||||||||||||
|
|
|
|
|
|
|
|
|
|
|
|||||||||||
| Total Net Revenues |
$ | 16,862 | $ | 80,402 | $ | 144,685 | $ | 93,895 | $ | 131,312 | ||||||||||
|
|
|
|
|
|
|
|
|
|
|
|||||||||||
| As of December 31, | As of September 30, 2013 |
|||||||||||
| 2011 | 2012 | |||||||||||
| (unaudited) | ||||||||||||
| Identifiable long-lived assets: |
||||||||||||
| U.S. |
$ | 192,990 | $ | 183,633 | $ | 182,208 | ||||||
| United Kingdom |
41,551 | 40,076 | 39,806 | |||||||||
| Other International |
— | 11,952 | 33,658 | |||||||||
|
|
|
|
|
|
|
|||||||
| Total identifiable long-lived assets |
$ | 234,541 | $ | 235,661 | $ | 255,672 | ||||||
|
|
|
|
|
|
|
|||||||
Net revenues attributed to the U.S. and international geographies are based upon the country in which the selling subsidiary of the Company is located.
Identifiable long-lived assets attributed to the U.S. and international geographies are based upon the country in which the asset is located or owned.
15. Employee Benefit Plans
401(k) Plan
We have established a tax-qualified employee savings and retirement plan for all employees in the U.S. who satisfy certain eligibility requirements, including requirements relating to age and length of service. Under our 401(k) plan, employees may elect to reduce their current compensation by up to the statutory limit, $17,000 in 2012, and have us contribute the amount of this reduction to the 401(k) plan. During 2012, we began matching up to 58% of employee contributions, but not exceeding $8,750 per employee. Our contributions for the year ended December 31, 2012 were $0.4 million.
16. Subsequent Events (unaudited)
On October 9, 2013, we acquired 100% of the outstanding capital stock of YSL Ventures, Inc., a private company that operated under the name Zendeals, for approximately $17.8 million of initial cash consideration. The initial cash consideration is subject to adjustment based on the amount of YSL Ventures, Inc.’s working capital as of October 9, 2013. In connection with the acquisition, we incurred approximately $0.1 million in direct acquisition costs. Due to the timing of the acquisition, we have not yet finalized our allocation of the purchase price to the fair value of assets acquired and liabilities assumed.
F-36
Table of Contents
REPORT OF INDEPENDENT REGISTERED PUBLIC ACCOUNTING FIRM
The Board of Directors and Shareholders of eConversions Limited,
We have audited the accompanying balance sheets of eConversions Limited as of August 15, 2011 (date of acquisition) and December 31, 2010, and the related statements of income, shareholders’ equity and cash flows for the period from January 1, 2011 to August 15, 2011 (date of acquisition) and the year ended December 31, 2010. These financial statements are the responsibility of the Company’s management. Our responsibility is to express an opinion on these financial statements based on our audits.
We conducted our audits in accordance with the standards of the Public Company Accounting Oversight Board (United States). Those standards require that we plan and perform the audit to obtain reasonable assurance about whether the financial statements are free of material misstatement. We were not engaged to perform an audit of the Company’s internal control over financial reporting. Our audits included consideration of internal control over financial reporting as a basis for designing audit procedures that are appropriate in the circumstances, but not for the purpose of expressing an opinion on the effectiveness of the Company’s internal control over financial reporting. Accordingly, we express no such opinion. An audit also includes examining, on a test basis, evidence supporting the amounts and disclosures in the financial statements, assessing the accounting principles used and significant estimates made by management and evaluating the overall financial statement presentation. We believe that our audits provide a reasonable basis for our opinion.
In our opinion, the financial statements referred to above present fairly, in all material respects, the financial position of eConversions Limited as of August 15, 2011 (date of acquisition) and December 31, 2010, and the results of its operations and its cash flows for the period from January 1, 2011 to August 15, 2011 (date of acquisition) and the year ended December 31, 2010, in conformity with U.S. generally accepted accounting principles.
/s/ Ernst & Young LLP
Austin, Texas
July 16, 2012
F-37
Table of Contents
BALANCE SHEETS
(£ in Thousands)
| August 15, 2011 |
December 31, 2010 |
|||||||
| Assets |
||||||||
| Current assets: |
||||||||
| Cash and cash equivalents |
£ | 779 | £ | 2,567 | ||||
| Accounts receivable, net |
1,833 | 1,912 | ||||||
| Prepaid expenses and other current assets |
64 | 21 | ||||||
|
|
|
|
|
|||||
| Total current assets |
2,676 | 4,500 | ||||||
| Property and equipment, net |
97 | 87 | ||||||
| Other noncurrent assets |
25 | 43 | ||||||
|
|
|
|
|
|||||
| Total assets |
£ | 2,798 | £ | 4,630 | ||||
|
|
|
|
|
|||||
| Liabilities and shareholders’ deficit |
||||||||
| Current liabilities: |
||||||||
| Accounts payable |
£ | 45 | £ | 352 | ||||
| Accrued expenses and other current liabilities |
527 | 33 | ||||||
| Corporate taxes payable |
1,265 | 1,349 | ||||||
|
|
|
|
|
|||||
| Total current liabilities |
1,837 | 1,734 | ||||||
| Deferred corporate tax liability—long term |
21 | 18 | ||||||
|
|
|
|
|
|||||
| Total liabilities |
1,858 | 1,752 | ||||||
| Shareholders’ equity: |
||||||||
| Ordinary shares, par value £1; 1,171 and 1,112 shares issued and outstanding at August 15, 2011 and December 31, 2010, respectively |
1 | 1 | ||||||
| Share premium |
699 | 229 | ||||||
| Share subscription receivable from Director |
— | (227 | ) | |||||
| Retained earnings |
240 | 2,875 | ||||||
|
|
|
|
|
|||||
| Total shareholders’ equity |
940 | 2,878 | ||||||
|
|
|
|
|
|||||
| Total liabilities and shareholders’ equity |
£ | 2,798 | £ | 4,630 | ||||
|
|
|
|
|
|||||
See accompanying notes which are an integral part of these financial statements.
F-38
Table of Contents
STATEMENTS OF INCOME
(£ in Thousands)
| For the Period January 1, 2011 through August 15, 2011 |
Year Ended December 31, 2010 |
|||||||
| Revenue |
£ | 4,721 | £ | 6,004 | ||||
| Costs and Expenses: |
||||||||
| Cost of revenue |
1,233 | 1,388 | ||||||
| Operations |
215 | 173 | ||||||
| Technology |
359 | 338 | ||||||
| Marketing |
599 | 728 | ||||||
| General and administration |
681 | 775 | ||||||
|
|
|
|
|
|||||
| Total costs and expenses |
3,087 | 3,402 | ||||||
|
|
|
|
|
|||||
| Income from operations |
1,634 | 2,602 | ||||||
| Other income (expense), net: |
||||||||
| Interest income, net |
2 | 8 | ||||||
| Other expense, net |
(11 | ) | — | |||||
|
|
|
|
|
|||||
| Total other income (expense), net |
(9 | ) | 8 | |||||
| Income from continuing operations before income taxes |
1,625 | 2,610 | ||||||
| Income taxes |
452 | 747 | ||||||
|
|
|
|
|
|||||
| Income from continuing operations |
1,173 | 1,863 | ||||||
| Discontinued operations |
||||||||
| Income from operations of discontinued component before income tax |
388 | 667 | ||||||
| Income tax on discontinued component |
104 | 187 | ||||||
|
|
|
|
|
|||||
| Income from discontinued operations |
284 | 480 | ||||||
|
|
|
|
|
|||||
| Net income |
£ | 1,457 | £ | 2,343 | ||||
|
|
|
|
|
|||||
See accompanying notes which are an integral part of these financial statements.
F-39
Table of Contents
STATEMENTS OF SHAREHOLDERS’ EQUITY
(£ in Thousands)
| Ordinary Shares | Retained Earnings |
Total Shareholders’ Equity |
||||||||||||||||||||||
| Shares | Par Value | Share Premium |
Share Subscription Receivable |
|||||||||||||||||||||
| Balances at January 1, 2010 |
1,000 | £ | 1 | £ | — | £ | — | £ | 1,002 | £ | 1,003 | |||||||||||||
| Issuance of ordinary shares |
112 | — | 227 | (227 | ) | — | — | |||||||||||||||||
| Share-based compensation |
— | — | 2 | — | — | 2 | ||||||||||||||||||
| Dividends paid |
— | — | — | — | (470 | ) | (470 | ) | ||||||||||||||||
| Net income |
— | — | — | — | 2,343 | 2,343 | ||||||||||||||||||
|
|
|
|
|
|
|
|
|
|
|
|
|
|||||||||||||
| Balances at December 31, 2010 |
1,112 | 1 | 229 | (227 | ) | 2,875 | 2,878 | |||||||||||||||||
| Stock options exercised |
59 | — | 96 | — | — | 96 | ||||||||||||||||||
| Share subscription exercised |
— | — | — | 227 | — | 227 | ||||||||||||||||||
| Share-based compensation |
— | — | 26 | — | — | 26 | ||||||||||||||||||
| Excess tax benefits from exercise of share options |
— | — | 348 | — | — | 348 | ||||||||||||||||||
| Dividends paid |
— | — | — | — | (4,092 | ) | (4,092 | ) | ||||||||||||||||
| Net income |
— | — | — | — | 1,457 | 1,457 | ||||||||||||||||||
|
|
|
|
|
|
|
|
|
|
|
|
|
|||||||||||||
| Balances at August 15, 2011 |
1,171 | £ | 1 | £ | 699 | £ | — | £ | 240 | £ | 940 | |||||||||||||
|
|
|
|
|
|
|
|
|
|
|
|
|
|||||||||||||
See accompanying notes which are an integral part of these financial statements.
F-40
Table of Contents
STATEMENTS OF CASH FLOWS
(£ in Thousands)
| For the Period January 1, 2011 through August 15, 2011 |
Year Ended December 31, 2010 |
|||||||
| Net income |
£ | 1,457 | £ | 2,343 | ||||
| Adjustments to reconcile net income to net cash provided by operating activities: |
||||||||
| Depreciation and amortization |
24 | 29 | ||||||
| Share-based payment expense |
26 | 2 | ||||||
| Excess tax benefit from exercise of share options |
348 | — | ||||||
| Loss on disposal of asset |
8 | — | ||||||
| Deferred tax |
3 | 6 | ||||||
| Changes in operating assets and liabilities: |
||||||||
| Accounts receivable |
79 | (883 | ) | |||||
| Accounts payable |
(307 | ) | 241 | |||||
| Prepaid expenses and other |
(43 | ) | 68 | |||||
| Accrued expenses and other |
410 | 552 | ||||||
| Noncurrent assets |
18 | 17 | ||||||
|
|
|
|
|
|||||
| Net cash provided by operating activities |
2,023 | 2,375 | ||||||
| Investing activities |
||||||||
| Purchase of property and equipment |
(42 | ) | (47 | ) | ||||
|
|
|
|
|
|||||
| Net cash used in investing activities |
(42 | ) | (47 | ) | ||||
| Financing activities |
||||||||
| Proceeds from sales of ordinary shares to Director |
227 | — | ||||||
| Proceeds from exercise of share options to purchase ordinary shares |
96 | — | ||||||
| Dividends paid |
(4,092 | ) | (470 | ) | ||||
|
|
|
|
|
|||||
| Net cash provided by financing activities |
(3,769 | ) | (470 | ) | ||||
| Increase (decrease) in cash and cash equivalents |
(1,788 | ) | 1,858 | |||||
| Cash and cash equivalents at beginning of year |
2,567 | 709 | ||||||
|
|
|
|
|
|||||
| Cash and cash equivalents at end of year |
£ | 779 | £ | 2,567 | ||||
|
|
|
|
|
|||||
| Cash paid for interest and income taxes: |
||||||||
| Interest |
£ | — | £ | — | ||||
| Income taxes |
£ | 340 | £ | 295 | ||||
See accompanying notes which are an integral part of these financial statements.
F-41
Table of Contents
NOTES TO FINANCIAL STATEMENTS
Year Ended December 31, 2010 and the period January 1, 2011 through August 15, 2011
1. Description of Business
eConversions Limited, or the Company, whose name was changed to WhaleShark Media Ltd on April 4, 2012, is a private limited company incorporated in England and Wales. We are an Internet publishing company that owns and operates on-line marketplaces where consumers are able to find discounts offered by numerous and varied retailers. In October 2008, we launched our website, VoucherCodes.co.uk, to target consumers in the United Kingdom. Our website aggregates links to retailer websites which not only facilitate the purchasing process, but also identify the transaction as originating from one of our websites. We earn commissions when consumers make purchases utilizing these retailer offers advertised on our websites. The arrangements with the retailers are both direct and through third parties, referred to as Affiliate Networks, who act as intermediaries between publishers like us and retailers.
In addition to these retailer offer websites, prior to August 15, 2011, we also contracted with customers to provide paid search marketing services, or PSM, whereby we drove traffic to our customers’ websites through Google, Yahoo and Bing for a performance-based fee. We have since ceased this operation and completed all contracts as of December 31, 2011.
On August 15, 2011, at close of business, WhaleShark Media, Inc. (WhaleShark) acquired 100% of our outstanding share capital. The accompanying financial statements are presented for the year ended December 31, 2010 and the period from January 1, 2011 through August 15, 2011, all of which is prior to the acquisition.
2. Summary of Significant Accounting Policies
Basis of Accounting
The accompanying financial statements have been prepared in accordance with accounting principles generally accepted in the United States of America, or U.S. GAAP.
We have adopted the Financial Accounting Standards Board, or FASB, Accounting Standards Codification , or ASC. Unless needed to clarify a point to readers, we will not cite specific references when discussing application of accounting principles or addressing new or pending accounting rule changes.
Use of Estimates
The preparation of our financial statements in conformity with U.S. GAAP requires the use of estimates. These estimates are subjective in nature and involve judgments that affect the reported amounts of assets, liabilities and the disclosure of contingent assets and liabilities at the date of the financial statements and the reported amount of revenue and expenses during the reporting periods. Estimates are used for, but not limited to, share-based compensation, income taxes, allowances on accounts receivable and the depreciable lives of property and equipment. Actual amounts could differ from these estimates.
Cash and Cash Equivalents
We consider all highly-liquid investments with an original maturity of three months or less at the date of purchase to be cash equivalents. At August 15, 2011 and December 31, 2010, we maintained all cash balances in operating and savings accounts with one U.K. bank.
Accounts Receivable, Net
Accounts receivable primarily represent the net cash due from Affiliate Networks and retailers for commissions earned when consumers utilize retailer offers advertised on our websites, as well as amounts due
F-42
Table of Contents
from customers for services rendered under PSM contracts. The carrying amount of our accounts receivable balances have been reduced by an allowance for cancellations, returns and doubtful accounts of £108,000 and £144,000 at August 15, 2011 and December 31, 2010, respectively. We estimate the amount of probable transactions that will be subsequently cancelled or where the merchandise will be returned based on an analysis of historical cancellations and returns experience. We estimate future expected write-offs by making an assessment of specific identifiable accounts considered at risk or uncollectible.
Property and Equipment
Property and equipment consist primarily of computer hardware and office furniture recorded at cost and depreciated over their estimated useful lives, which is three to five years, using the declining balance method. Upon retirement, sale or disposal, the cost and the accumulated depreciation of the assets retired or sold are removed from our accounts, and any resulting gain or loss is recognized in the period incurred. We perform reviews for fixed asset impairments whenever events or changes in circumstances indicate the carrying amount of an asset may not be recoverable. We did not recognize any long lived asset impairments for the period from January 1, 2011 through August 15, 2011 and for the year ended December 31, 2010.
Lease Obligations
We categorize leases at their inception as either an operating lease or a capital lease. We may receive renewal or expansion options, rent holidays and other incentives on certain lease agreements. We recognize operating lease costs on a straight-line basis taking into account significant adjustments, if any, for market incentives, such as free or escalating base monthly rental payments, or deferred payment terms such as rent holidays that defer the commencement date of required payments. We record rent expense associated with operating lease obligations in general and administrative expense on the statement of income.
Revenue Recognition
We recognize revenue when persuasive evidence of an arrangement exists, delivery has occurred, the fee is fixed or determinable, and collectability is probable. These criteria generally are met when the end-user completes a purchase transaction with the retailer as reported to us by the retailer directly or through one or more Affiliate Networks. Based on historical experience, we estimate and record a reduction to revenue for transactions that may be subsequently cancelled or merchandise that is subsequently returned to the retailer, which may not be reported by the retailer or Affiliate Network until a later date.
Cost of Revenue
Cost of revenue consists of the direct costs incurred to generate revenue and primarily consists of traffic acquisition costs incurred to direct traffic to our websites from established search websites.
Website Development Costs
Our website development costs consists primarily of personnel costs of our product management and software engineering teams, as well as fees paid to third-party contractors and consultants engaged in the design, development, testing and improvement of the functionality and user experience of our websites and mobile applications. We expense all internal website development costs as we do not track and separately identify these costs with identifiable development activities from costs of maintenance and related activities.
Marketing Expenses
Our marketing expenses include email campaigns, promotional items, sponsorships, printing, online advertising and compensation paid to marketing employees. The costs of advertising are expensed as incurred, which generally is the time advertising takes place. Advertising expense was £135,000 and £295,000 at
F-43
Table of Contents
August 15, 2011 and December 31, 2010, respectively. Compensation costs, including related share-based compensation expense paid to employees involved with marketing activities are also classified as marketing activities.
General and Administrative
General and administrative expenses consist of employee compensation and related expenses for employees involved in general corporate functions, including business intelligence, accounting, executive management and IT, among others. Additional costs included in general and administrative include amortization and depreciation expense, rent, professional fees, travel and entertainment, recruiting, office supplies, maintenance and other general corporate costs.
Share-Based Compensation
We measure share-based compensation cost using the calculated fair value of the award at the grant date and recognize the related compensation costs on a straight-line basis over the requisite service period of the award. The calculated fair values are based on the Black-Scholes Merton valuation model and include a forfeiture rate estimated at the grant date and adjusted in subsequent months based on differences between the estimated and actual experience. We include share-based compensation costs in operating expense in the statement of income consistent with the respective employee’s cash compensation.
Fair Value of Financial Instruments
The carrying amounts of our short-term financial instruments, which include cash and cash equivalents, accounts receivable, accounts payable and other accrued expenses, approximate their fair values due to their short-term maturities. We also consider our long-term non-marketable equity security to be a financial instrument; however, it is not practicable to estimate its fair value.
Income Taxes
We account for income taxes under the liability method. Deferred tax assets and liabilities are recognized for the future tax consequences attributable to differences between the financial statement carrying amounts of existing assets and liabilities and their respective tax bases. Deferred tax assets and liabilities are measured using enacted tax rates expected to apply to taxable income in the years in which those temporary differences are expected to be recovered or settled. Valuation allowances are established as considered necessary to reduce deferred tax assets to amounts which are more likely than not to be realized. We recognize a tax benefit from an uncertain tax position in the financial statements only when it is more likely than not that the position will be sustained.
Recent Accounting Pronouncements
In May 2011, the FASB issued new guidance on fair value measurements, which clarifies how a principal market is determined, how and when the valuation premise of highest and best use applies, and how premiums and discounts are applied, as well as requiring new disclosures. This new guidance is effective for us for the fiscal year ending December 31, 2012. Early application is not permitted. Other than requiring additional disclosures, we do not expect that this new guidance will impact our financial statements.
In June 2011, the FASB issued new guidance on presentation of comprehensive income. The new guidance eliminates the option to present components of other comprehensive income as part of the statement of changes in shareholders’ equity and requires an entity to present either one continuous statement of net income and other comprehensive income or two separate, but consecutive statements. This new guidance relates only to presentation and is effective for us for the fiscal year ending December 31, 2012.
F-44
Table of Contents
3. Property and Equipment
Property and equipment consist of the following (in thousands):
| August 15, 2011 |
December 31, 2010 |
|||||||
| Machinery |
£ | — | £ | 12 | ||||
| Computing equipment |
121 | 103 | ||||||
| Office furniture and equipment |
58 | 53 | ||||||
| Leasehold improvement |
19 | — | ||||||
|
|
|
|
|
|||||
| 198 | 168 | |||||||
| Accumulated depreciation and amortization |
(101 | ) | (81 | ) | ||||
|
|
|
|
|
|||||
| Net property and equipment |
£ | 97 | £ | 87 | ||||
|
|
|
|
|
|||||
Depreciation and amortization expense on property and equipment was £24,000 and £29,000 for the period from January 1, 2011 through August 15, 2011 and for the year ended December 31, 2010, respectively. In connection with relocating our offices in August 2011, we recognized an £8,000 charge for disposal of equipment.
4. Shareholders’ Equity
A total of 1,000 Ordinary Shares had been designated as share capital in 2007, when we were first established, at a value of £1 per share. On August 26, 2010, our Board of Directors approved a resolution removing the restriction on authorized share capital included in the articles of association and issued an additional 112 Ordinary Shares for purchase to a key employee who became a Director. The purchased shares were issued at par with a £2,024 per share premium.
We issued employee management incentive share options under the Her Majesty’s Revenue and Customs, or HMRC, approved Employee Management Incentive share option provision, or EMI Plan, to three employees whereby they were able to purchase a total of 59 shares at £1,620 per share should any one of several contractually defined events occur. These options were exercised on August 15, 2011.
Total shares issued and outstanding at August 15, 2011 and December 31, 2010, were 1,171 and 1,112, respectively. Each share is entitled to one vote at all meetings of shareholders and special resolutions taken in lieu thereof. Whenever funds are legally available for distribution, the holders of Ordinary Shares are also entitled to receive dividends when, if and as declared by the Board of Directors.
Dividends
From time to time we analyze cash balances and, amounts on hand in excess of our future needs are paid out to shareholders in the form of dividends. The following dividends were declared and paid during the period from January 1, 2011 through August 15, 2011 and for the year ended December 31, 2010.
| Total Dividend Payments (in thousands) |
||||||||||||||||||
| Date Declared |
Date Paid | Dividend per Share |
Shares Outstanding |
Period January 1, 2011 through August 15, 2011 |
Year Ended December 31, 2010 |
|||||||||||||
| March 20, 2010 |
March 24, 2010 | £ | 356.00 | 1,000 | £ | — | £ | 356 | ||||||||||
| July 1, 2010 |
October 13, 2010 and November 15, 2010 |
£ | 114.33 | 1,000 | £ | — | £ | 114 | ||||||||||
| August 12, 2011 |
August 12, 2011 | £ | 3,679.58 | 1,112 | £ | 4,092 | £ | — | ||||||||||
F-45
Table of Contents
5. Share-Based Compensation
On August 26, 2010, we established the EMI Plan pursuant to Schedule 5 to the U.K. Income Tax (Earnings and Pension) Act of 2003. On that same date and under this EMI Plan, in exchange for a nominal payment, we individually granted to three key employees options to acquire a total of 59 ordinary shares at a per share price of £1,620. We have not granted any additional share options since that grant.
The grants had a life of 10 years and were conditioned on the recipient’s continued compliance with certain statutory requirements, including remaining an employee of the Company. The options were exercisable at the earlier of (1) the discretion of our Directors, (2) the sale of all of our outstanding equity capital in a bona fide arm’s length transaction or (3) the admission of all of our capital shares to a recognized exchange. We measured share-based compensation cost at the grant date using a calculated fair value of the award, and recorded a charge for the related compensation costs on a straight-line basis over 50 months, which we estimated at the time of grant to be the weighted average period until one of the stated conditions would be met. On August 15, 2011 all our outstanding equity shares were sold in an arm’s length transaction, thus satisfying one of the exercise criteria. Immediately preceding the sale, all outstanding share options immediately vested, were exercised and the remaining compensation cost charged to income. For the period from January 1, 2011 through August 15, 2011 and the year ended December 31, 2010, we recorded £26,000 and £2,000 of share-based compensation expense, respectively.
We estimated the fair value of the EMI Plan options granted on August 26, 2010, the grant date, using a weighted average of the fair values calculated using the Black-Scholes Merton option pricing model applied to management’s best estimate of the likelihood and timing of all possible outcomes and using the following assumptions:
| Volatility |
69.5% – 78% | |
| Dividend yield |
– | |
| Risk-free interest rate |
0.5% – 2.9% | |
| Expected lives in years |
Up to 10 years |
Volatility was determined using the volatility of comparable publicly traded entities.
The following table summarizes the activity of our EMI Plan for the period January 1, 2011 through August 15, 2011 and for the year ended December 31, 2010:
| Number of Shares |
Weighted- Average Exercise Price Per Share |
Weighted- Average Remaining Contractual Term |
Aggregate Intrinsic Value |
|||||||||||||
| Outstanding—December 31, 2009 |
— | — | — | — | ||||||||||||
| Granted |
59 | £ | 1,620 | 10 | ||||||||||||
|
|
|
|
|
|
|
|
|
|||||||||
| Outstanding—December 31, 2010 |
59 | £ | 1,620 | 9.68 | £ | 24 | ||||||||||
| Exercised |
(59 | ) | £ | (1,620 | ) | 9 | — | |||||||||
|
|
|
|
|
|
|
|
|
|||||||||
| Outstanding—August 15, 2011 |
— | — | — | — | ||||||||||||
The aggregate intrinsic value in the table above represents the total pre-tax intrinsic value that would have been received by the option holders had all option holders exercised their options on December 31, 2010. There were no options exercisable at December 31, 2010. There were no options that remained outstanding on August 15, 2011. The aggregate intrinsic value is determined by multiplying the difference between the fair value of our shares on the last day of each reporting period and the exercise price, multiplied by the number of options where the exercise price exceeds the fair value.
F-46
Table of Contents
6. Income Taxes
The components of the provision for income taxes attributable to continuing operations are as follows (£ in thousands):
| Period Ended | ||||||||
| August 15, 2011 |
December 31, 2010 |
|||||||
| Current |
£ | 440 | £ | 743 | ||||
| Deferred |
12 | 4 | ||||||
|
|
|
|
|
|||||
| Total tax expense |
£ | 452 | £ | 747 | ||||
|
|
|
|
|
|||||
Deferred income taxes reflect the net tax effects of temporary differences between the carrying amounts of assets and liabilities for financial reporting purposes and the amounts used for corporate tax purposes. Significant components of our deferred taxes are as follows (£ in thousands):
| August 15, 2011 |
December 31, 2010 |
|||||||
| Non-current deferred tax liabilities: |
||||||||
| Basis of property and equipment |
£ | 21 | £ | 18 | ||||
|
|
|
|
|
|||||
| Net deferred tax liability |
£ | 21 | £ | 18 | ||||
|
|
|
|
|
|||||
The exercise of the EMI Plan options resulted in personal taxable compensation for the exercising option holders and a corresponding tax deduction against our corporate tax liability. Such compensation results when the exercising option holder sells their shares for an amount in excess of the price at which they purchased the shares. When the option is exercised, we recorded our associated tax benefit as an increase to share premium. During the period from January 1, 2011 through August 15, 2011, we recorded a £345,000 option related tax benefit. There were no option related tax adjustments for the year ended December 31, 2010.
Our provision for income taxes attributable to continuing operations differs from the expected tax expense (benefit) amount computed by applying the statutory corporate income tax rate of 26% for the period from April 1, 2011 through August 15, 2011, and 28% for the quarter ended March 31, 2011 and for the year ended December 31, 2010, to income before income taxes as a result of the following:
| Period Ended | ||||||||
| August 15, 2011 |
December 31, 2010 |
|||||||
| Tax at statutory rate of 26% and 28% |
£ | 435 | £ | 731 | ||||
| Permanent differences and other |
17 | 16 | ||||||
|
|
|
|
|
|||||
| Income tax provision |
£ | 452 | £ | 747 | ||||
|
|
|
|
|
|||||
Our statutory year end historically has been April 30 and our corporate tax return for fiscal year 2011 is subject to examination by HMRC.
7. Commitments and Contingencies
Operating Leases
We lease our office space under a non-cancellable operating lease. On August 10, 2011, we entered into a new lease arrangement for a substantially larger office space than our existing lease. We negotiated a termination of our prior lease subsequent to August 15, 2011.
F-47
Table of Contents
Our new lease extends through August 2016; however, we are able to terminate early, on August 10, 2013, provided we furnish notice to the landlord 6 months prior to that date. We had no capital lease obligations at August 15, 2011 or December 31, 2010. Future minimum lease payments required under operating leases for the period from August 16, 2011 through year ending December 31, 2011 and for the next four years and thereafter are as follows (£ in thousands):
| Operating Leases |
||||
| August 16, 2011 through December 31, 2011 |
£ | 73 | ||
| Year ended 2012 |
149 | |||
| Year ended 2013 |
81 | |||
| Thereafter |
— | |||
|
|
|
|||
| Total contractual cash obligations |
£ | 303 | ||
8. Subsequent Events
Subsequent events are those events or transactions that occur after the balance sheet date, but before the financial statements are issued or available to be issued, and are either recognized or unrecognized in our books and records. In preparing the financial statements, we reviewed events that occurred after August 15, 2011 through the date that the report was available to be issued (July 16, 2012).
WhaleShark Media, Inc. Purchase
Effective with the close of business on August 15, 2011, WhaleShark Media, Inc., or WSMI, a U.S. corporation registered in Delaware and having its principal offices in Austin, Texas USA, purchased all of our outstanding share capital from our shareholders through its U.K. subsidiary company, WhaleShark Media, Ltd.
PSM Business Unit
Subsequent to August 15, 2011, and at the request of our new owner, WSMI, we began winding down our PSM business unit with all operations closed by December 31, 2011. Net contributions by this business unit were £284,000 and £480,000 for the period January 1, 2011 through August 15, 2011 and for the year ended December 31, 2010, respectively.
Office Space Lease Termination
In October 2011, we terminated the lease for our prior office space earlier than provided for in the lease agreement. As such and in accordance with the deed of surrender arrangements negotiated with the landlord, we paid an additional £36,000 to the landlord in exchange for the right to terminate the lease early.
F-48
Table of Contents
The Board of Directors
RetailMeNot, Inc.
515 South Congress Ave, Suite 700
Austin, TX 78704
USA
We have audited the accompanying divisional balance sheet of RetailMeNot.com—A division of Stateless Systems Unit Trust as of November 24, 2010, and the related divisional statements of operations, stockholders’ equity and cash flows for the period then ended. These financial statements are the responsibility of the management of RetailMeNot, Inc. Our responsibility is to express an opinion on these financial statements based on our audit.
We conducted our audit in accordance with the auditing standards generally accepted in the U.S. Those standards require that we plan and perform the audit to obtain reasonable assurance about whether the financial statements are free of material misstatement. An audit includes consideration of internal control over financial reporting as a basis for designing audit procedures that are appropriate in the circumstances, but not for the purpose of expressing an opinion on the effectiveness of the divisional internal control over financial reporting. Accordingly, we express not such opinion. An audit also includes examining, on a test basis, evidence supporting the amounts and disclosures in the financial statements, assessing the accounting principles used and significant estimates made by management, as well as evaluating the overall financial statement presentation. We believe that our audit provides a reasonable basis for our opinion.
In our opinion, the financial statements referred to above present fairly, in all material respects, the divisional financial position of RetailMeNot.com as of November 24, 2010 and the results of its operations and cash flows for the period then ended in conformity with accounting principles generally accepted in the U.S.
/s/ Shinewing Hall Chadwick
Melbourne, Australia
May 10, 2012
F-49
Table of Contents
DIVISIONAL BALANCE SHEET
| November 24, 2010 |
||||
| Assets |
||||
| Current assets |
||||
| Cash and cash equivalents |
$ | 2,236,919 | ||
| Trade and other receivables, net |
4,668,508 | |||
| Total current assets |
6,905,427 | |||
| Intangible assets |
79,079 | |||
|
|
|
|||
| Total assets |
$ | 6,984,506 | ||
|
|
|
|||
| Liabilities and Stockholders’ Equity |
||||
| Current liabilities |
||||
| Accounts payable and accrued expenses |
$ | 215,536 | ||
| Employee entitlements |
29,345 | |||
| Loan from Stateless Systems Unit Trust |
6,737,758 | |||
| Current portion of deferred expenditure |
1,867 | |||
|
|
|
|||
| Total current liabilities |
6,984,506 | |||
| Total liabilities |
6,984,506 | |||
| Equity |
||||
| Retained earnings |
— | |||
| Total equity |
— | |||
|
|
|
|||
| Total liabilities and equity |
$ | 6,984,506 | ||
|
|
|
|||
See accompanying notes to divisional financial statements.
F-50
Table of Contents
STATEMENT OF DIVISIONAL OPERATIONS
| For Period January 1, 2010 through November 24, 2010 |
||||
| Revenues |
$ | 25,155,141 | ||
|
|
|
|||
| Operating expenses |
||||
| Cost of revenue |
384,160 | |||
| Marketing expenses |
487,988 | |||
| Technology expenses |
190,341 | |||
| Operating expenses |
347,242 | |||
| General and administration expenses |
657,886 | |||
|
|
|
|||
| Total operating expenses |
2,067,617 | |||
|
|
|
|||
| Operating income |
23,087,524 | |||
|
|
|
|||
| Other income and expenses |
||||
| Interest expense, net |
320,491 | |||
|
|
|
|||
| Income before income taxes |
22,767,033 | |||
| Provision for income taxes |
— | |||
| Net income |
$ | 22,767,033 | ||
|
|
|
|||
See accompanying notes to divisional financial statements.
F-51
Table of Contents
STATEMENT OF DIVISIONAL STOCKHOLDERS’ EQUITY
| Retained Earnings |
Total Equity |
|||||||
| Balances at January 1, 2010 |
$ | — | $ | — | ||||
| Net income |
22,767,033 | 22,767,033 | ||||||
| Distributions |
(22,767,033 | ) | (22,767,033 | ) | ||||
|
|
|
|
|
|||||
| Balances at November 24, 2010 |
$ | — | $ | — | ||||
|
|
|
|
|
|||||
See accompanying notes to divisional financial statements.
F-52
Table of Contents
STATEMENT OF DIVISIONAL CASH FLOWS
| For the Period January 1, 2010 through November 24, 2010 |
||||
| Cash flows from operating activities |
||||
| Net income |
$ | 22,767,033 | ||
| Adjustments to reconcile net income to net cash provided by operating activities: |
||||
| Amortization & Impairment of Intangibles |
22,721 | |||
| Impairment of loans to related entities |
195,780 | |||
| Non—cash finance costs on related party loans |
319,597 | |||
| Changes in assets and liabilities from operating activities: |
||||
| Trade and other receivables |
20,631 | |||
| Accounts payable and accrued expenses |
118,362 | |||
| Deferred rental charges |
186 | |||
| Employee provisions |
(4,386 | ) | ||
|
|
|
|||
| Net cash provided by operating activities |
23,439,924 | |||
|
|
|
|||
| Cash flows from investing activities |
||||
| Purchase of intangibles |
(55,539 | ) | ||
| Loans to related entities |
(106,490 | ) | ||
|
|
|
|||
| Net cash used in investing activities |
(162,029 | ) | ||
|
|
|
|||
| Cash flows from financing activities |
||||
| Loan from related entities |
1,375,325 | |||
| Distributions paid |
(23,282,410 | ) | ||
|
|
|
|||
| Net cash used in financing activities |
(21,907,085 | ) | ||
|
|
|
|||
| Net increase in cash |
1,370,810 | |||
| Cash and cash equivalents, beginning of period |
866,109 | |||
|
|
|
|||
| Cash and cash equivalents, end of period |
$ | 2,236,919 | ||
|
|
|
|||
| Supplemental disclosures |
||||
| Cash paid for interest |
$ | 894 | ||
|
|
|
|||
See accompanying notes to divisional financial statements.
F-53
Table of Contents
NOTES TO DIVISIONAL FINANCIAL STATEMENTS
1. Summary of Significant Accounting Policies
Nature of Business and Basis of Presentation
On November 24, 2010, Whale Shark Media, Inc., or the Parent, through its subsidiary, RMN Acquisition Co., LLC, or the Acquirer, entered into an Asset Purchase Agreement with Stateless Systems Pty. Ltd. as trustee for Stateless Systems Unit Trust, a trust domiciled in Australia, or SS, to acquire certain intangible assets of SS. SS operated the web-site ‘RetailMeNot.com’, or the division, an online coupons and deals publisher and online advertiser, whereby shoppers are referred to online retailers in exchange for commissions on sales made to referred shoppers. The acquisition transaction was closed on November 24, 2010 at $160 million U.S. Dollars, which consisted of $130 million cash, $10 million Promissory Note and $20 million preferred stock of the Parent (representing 17,164,096 shares of Series B-2 preferred stock). The purchase price was subject to adjustment based on final determination of the working capital of SS on the closing date in accordance with the Asset Purchase Agreement. There was no such adjustment upon sale. The accompanying divisional financial statements do not reflect any impact from the acquisition.
The accompanying divisional Balance Sheet of SS as of November 24, 2010 and the related divisional statement of operations for the period January 1, 2010 through November 24, 2010 (collectively, the “Divisional Financial Statements”) have been prepared for the purpose of complying with Rule 3-05 of Regulation S-X of the Securities and Exchange Commission, or SEC, for inclusion in a Current Report on Form S-1 filed by the Parent and are not intended to be a complete presentation of SS’s assets and liabilities nor of its revenues and expenses.
The divisional financial statements have been prepared in accordance with United States’ Generally Accepted Accounting Principles, or U.S. GAAP, from the historical accounting records maintained by SS. Historically, the division was not a separate legal entity or subsidiary of SS and was not operated or accounted for as a stand-alone business. The accompanying divisional Statement of Operations reflects revenues and related costs such as direct marketing, technology, operating and general and administration expenses specifically identifiable and directly related to the division. The divisional Balance Sheet reflects assets and liabilities directly attributable to the division. Allocation of expenses incurred by SS to the Acquirer is made on the basis of percentage costs incurred by the Acquirer should it have operated as a stand-alone entity during the relevant period.
Use of Estimates
The divisional financial statements were prepared in accordance with U.S. GAAP. U.S. GAAP requires management to make estimates and assumptions that affect the reported amounts of assets and liabilities and disclosure of contingencies at the date of the divisional financial statements and the reported amounts of revenue and expenses during the reporting period. Significant areas requiring the use of estimates include the allowance for doubtful accounts, the valuation of intangible assets, potential reserves relating to litigation matters, accrued liabilities, workers’ compensation and general liability claims, and other liabilities. On an ongoing basis, management reviews its estimates based on currently available information. Actual results could differ from those estimates and such differences could be material to the financial position and results of operations.
Revenue Recognition
Revenues are generated principally through commissions earned from online retailers and third parties (referred to as network providers) resulting from consumer purchases. The division recognizes revenue when persuasive evidence of an arrangement exists, delivery has occurred, the fee is fixed or determinable, and collectability is probable. This is generally based on the period in which the end-user completes a purchase transaction with the retailer as reported to the division by the retailer directly or through one or more network providers. Certain retailers do not provide reporting until a cash payment is made. In those cases, which have
F-54
Table of Contents
historically not been significant, the division either records revenue using an estimate based on historical trends or on the cash basis. The division estimates and records a reserve to provide for end-user cancellations (returns) which may not be reported by the retailer or network provider until a later date.
Cash and Cash Equivalents
The division considers all highly liquid investments with original maturities of 90 days or less at the time of purchase to be cash equivalents.
Fair Value of Financial Instruments
ASC Topic 820, Fair Value Measurements and Disclosure, or Topic 820, defines fair value, establishes a market-based framework or hierarchy for measuring fair value, and expands disclosures about fair value measurements. Fair value is defined as the price that would be received to sell an asset or paid to transfer a liability in an orderly transaction between market participants. The guidance within Topic 820 is applicable whenever another accounting pronouncement requires or permits assets and liabilities to be measured at fair value. The fair value hierarchy prioritizes the inputs used in valuation techniques into three levels as follows:
| • | Level 1—unadjusted quoted prices for identical assets or liabilities in active markets; |
| • | Level 2—quoted prices for similar assets and liabilities in active markets, quoted prices for identical or similar assets or liabilities in markets that are not active, and inputs other than quoted market prices that are observable or that can be corroborated by observable market data by correlation; and |
| • | Level 3—unobservable inputs based upon the reporting entity’s internally developed assumptions which market participants would use in pricing the asset or liability. |
The carrying value of financial instruments including cash and cash equivalents, accounts receivable, accounts payable, accrued expenses and loans to and from related entities approximate estimated market values because of short-maturities and interest rates that approximate current rates. The division does not have any investments or other assets valued using Level 1, 2 or 3 inputs.
Trade and Other Receivables and Allowance for Doubtful Accounts
Trade and other receivables are comprised principally of commissions due from online retailers and network providers.
The allowance for doubtful accounts is maintained at a level that, in management’s opinion, is adequate to absorb potential losses related to trade and other receivables. The allowance for doubtful accounts is based upon management’s continuous evaluation of the collectability of outstanding receivables. Management’s evaluation takes into consideration such factors as past bad debt experience, economic conditions and information about specific receivables. The allowance for doubtful accounts is based on estimates and ultimate losses may vary from current estimates.
As adjustments to these estimates become necessary, they are reported in earnings in the periods that they become known. The allowance is increased by bad debt provisions charged to expense and reduced by direct write-offs, net of recoveries. Historically, the allowance for bad debts has not been significant. The allowance for doubtful accounts amounted to $195,780 at November 24, 2010.
Concentration of Risk
Cash and cash equivalents are maintained at financial institutions and, at times, balances may exceed federally insured limits. The division has never experienced any losses related to these balances. All of the non-interest bearing cash balances were insured to the figure of one million Australian Dollars at November 24, 2010, due to a temporary Australian federal government program in effect from November 28, 2008, and reducing to 250,000 Australian dollars on February 1, 2012.
F-55
Table of Contents
Intangibles
Intangibles are stated at cost. Those intangibles acquired which result in direct generation of income are capitalized and amortized over the assessed life of the intangible asset. Gains and losses from disposition of intangible assets are included in income and expense when realized. Amortization is computed principally by use of the straight-line method based upon the following estimated useful lives:
| Description |
Average Useful Life | |||
| Domain Names |
2.5 years | |||
| Website development costs |
2.5 years | |||
| Software |
2.5 years | |||
| Patents |
20 years | |||
| Trademarks |
20 years | |||
Impairment of Long—Lived Assets
The division reviews long-lived assets for impairment whenever events or changes in circumstances indicate that the carrying amounts of the assets may not be fully recoverable. The division generally evaluates assets for impairment within certain groupings, which management believes is the lowest level for which there are separately identifiable cash flows.
If the sum of the expected future cash flows, undiscounted and without interest charges is less than the carrying amount of the assets, the division recognizes an impairment charge in the amount by which the carrying value of the assets exceeds the fair value. Assets to be disposed of are reported at the lower of the carrying amount or fair value, less costs to sell. There were no impairment damages recognized during the period ended November 24, 2010.
Advertising Costs
The costs of advertising are expensed as incurred. The division’s primary advertising and marketing costs include email campaigns, trade shows, promotional items, sponsorships, printing and online advertising. Advertising and marketing expenses were $487,988 during the period ended November 24, 2010. The division also incurred $384,160 in paid search costs for the period ended November 24, 2010.
Sales Taxes
Revenues, expenses and assets are recognized net of the amount of sales tax, except where the amount of sales tax incurred is not recoverable from the relevant tax office. In these circumstances the sales tax is recognized as part of the cost of acquisition of the asset or as part of an item of the expense. Receivables and payables in the divisional balance sheet are shown inclusive of sales tax.
Income Taxes
RetailMeNot.com, as a division of a Trust, is not a separate taxable entity for Australian tax purposes so long as taxable income is fully distributed to the beneficiaries or unitholders of the Trust. As the effective income tax rate of the entity is 0%, no deferred tax assets and liabilities are recognized.
Leases
The majority of the division’s operations are conducted in premises occupied under a non-cancelable lease agreement with the initial base term being three years. The division, at its option, can renew the lease at the fair rental rates for one further term of three years. The lease provides for escalating rentals at a rate of 4% per annum.
F-56
Table of Contents
The division accounts for leased properties under the provisions of ASC 840, Accounting for Leases, and related interpretations and other authoritative accounting literature. ASC 840 requires that the division evaluate each lease for classification as either a capital lease or an operating lease. The division performs this evaluation at the inception of the lease and when a modification is made to a lease. Historically, all of the division’s lease arrangements have been classified as operating leases.
Deferred Rent
The division accounts for rent expense under non-cancelable operating leases with scheduled rent increases on a straight-line basis over the lease term beginning with the effective lease commencement date. The excess of straight-line rent expense over scheduled payment amounts is recorded as an accrued liability for deferred rent. The deferred rent liability amounted to $1,867 at November 24, 2010, and is included in the current portion of deferred expenditures.
2. Intangible Assets
At November 24, 2010, a summary of intangible assets is as follows:
| 2010 | ||||
| Domain Names |
$ | 55,329 | ||
| Less: Accumulated Amortization & Impairment |
(49,850 | ) | ||
|
|
|
|||
| 5,479 | ||||
|
|
|
|||
| Website Development Costs |
$ | 9,454 | ||
| Less: Accumulated Amortization |
(3,832 | ) | ||
|
|
|
|||
| 5,622 | ||||
|
|
|
|||
| Software |
$ | 24,891 | ||
| Less: Accumulated Amortization |
(11,102 | ) | ||
|
|
|
|||
| 13,789 | ||||
|
|
|
|||
| Patents |
$ | 38,134 | ||
| Less: Accumulated Amortization |
(688 | ) | ||
|
|
|
|||
| 37,446 | ||||
|
|
|
|||
| Trademarks |
$ | 16,939 | ||
| Less: Accumulated Amortization |
(196 | ) | ||
|
|
|
|||
| 16,743 | ||||
|
|
|
|||
| Intangible assets |
$ | 79,079 | ||
|
|
|
|||
Amortization & Impairment expense, recognized in general and administration expenses, totaled $22,721 for the period ended November 24, 2010.
The amortization expense of intangible assets for each of the following five years is estimated as follows:
| Year Ended December 31 |
||||
| 2011 |
$ | 18,654 | ||
| 2012 |
7,311 | |||
| 2013 |
4,222 | |||
| 2014 |
3,319 | |||
| 2015 |
2,754 | |||
F-57
Table of Contents
3. Transactions with Related Parties
The division’s assets are funded by loans from Stateless Systems. Interest is charged on this funding arrangement based on market rate funding costs during the period ended November 24, 2010 at 5.75% per annum.
Related party finance costs arising from this funding during the period ended November 24, 2010 amounted to $319,597.
The division provided funding totaling $195,780 as at November 24, 2010 to fund operations of a related party established in the United Kingdom. As a result of this operation ceasing, an impairment expense of $195,780 has been recognized within general and administration expenses during the period ended November 24, 2010.
This funding was provided on an interest free basis.
4. Commitments and Contingent Liabilities
Lease Commitments
The division leases an office under a non—cancelable operating lease expiring January 16, 2012.
At November 24, 2010, minimum rental payments due on this lease are as follows:
| Years ending |
Total | |||
| December 31, 2011 |
$ | 49,087 | ||
| December 31, 2012 |
2,155 | |||
|
|
|
|||
| $ | 51,242 | |||
Minimum rent expense (excluding lease buy-out costs) under such operating leases during the period ended November 24, 2010 amounted to $39,627.
No contingent rent expense was incurred.
Legal Contingencies
There are no lawsuits currently underway involving the division or the Trust, either as the plaintiff or the defendant. The division and the Trust are also not aware of any potential lawsuits that may arise in the future. As such, no contingent liability has been recorded at November 24, 2010.
5. Post-Retirement Benefits
The division participates in a defined contribution retirement plan under the Superannuation Act 1990, which covers all employees of the division. Employees may contribute additional amounts to the plan through payroll withholdings, subject to certain limitations. During the period ended November 24, 2010, the division’s contributions amounted to $39,183.
6. Subsequent Events
The division evaluates subsequent events in accordance with ASC 855, Subsequent Events. The Trust evaluated subsequent events through May 10, 2012, which is when the divisional financial statements were available to be issued.
With the exception of the execution of the asset purchase agreement noted previously, no events subsequent to November 24, 2010 were noted which are significant to the entity.
F-58
Table of Contents

Table of Contents

Table of Contents
PART II
INFORMATION NOT REQUIRED IN PROSPECTUS
Item 13. Other Expenses of Issuance and Distribution
The following table sets forth the costs and expenses, other than the underwriting discounts and commissions payable by us, in connection with the sale of Series 1 common stock being registered. All amounts are estimates except for the SEC registration fee and the Financial Industry Regulatory Authority, or FINRA, filing fee.
| SEC registration fee |
$ | |||
| FINRA filing fee |
||||
| Blue sky fees and expenses |
||||
| Transfer agent and registrar fees |
||||
| Accounting fees and expenses |
||||
| Legal fees and expenses |
||||
| Printing and engraving costs |
||||
| Miscellaneous expenses |
||||
|
|
|
|||
| Total |
$ | |||
|
|
|
Item 14. Indemnification of Directors and Officers
Section 145 of the Delaware General Corporation Law authorizes a court to award, or a corporation’s board of directors to grant, indemnity to directors and officers in terms sufficiently broad to permit such indemnification under certain circumstances for liabilities (including reimbursement for expenses incurred) arising under the Securities Act.
As permitted by the Delaware General Corporation Law, our amended and restated certificate of incorporation includes a provision that eliminates the personal liability of our directors for monetary damages for breach of fiduciary duty as a director, except for liability:
| • | For any breach of the director’s duty of loyalty; |
| • | For acts or omissions not in good faith or that involve intentional misconduct or a knowing violation of law; |
| • | Under section 174 of the Delaware General Corporation law regarding unlawful dividends and stock purchases; or |
| • | For any transaction for which the director derived an improper personal benefit. |
| • | As permitted by the Delaware General Corporation Law, our amended and restated bylaws provide that: |
| • | we are required to indemnify our directors and officers to the fullest extent permitted by the Delaware General Corporation Law, subject to very limited exceptions; |
| • | we may indemnify our other employees and agents to the fullest extent permitted by the Delaware General Corporation Law, subject to very limited exceptions; |
| • | we are required to advance expenses, as incurred, to our directors and officers in connection with a legal proceeding to the fullest extent permitted by the Delaware General Corporation Law, subject to very limited exceptions; |
| • | we may advance expenses, as incurred, to our employees and agents in connection with a legal proceeding; and |
| • | the rights conferred in our amended and restated bylaws are not exclusive. |
II-1
Table of Contents
We have entered into indemnity agreements with each of our current directors and officers to give these directors and officers additional contractual assurances regarding the scope of the indemnification set forth in our restated certificate of incorporation and to provide additional procedural protections. At present, there is no pending litigation or proceeding involving our directors, officers or employees regarding which indemnification is sought, nor are we aware of any threatened litigation that may result in material claims for indemnification.
The indemnification provisions in our amended and restated certificate of incorporation and amended and restated bylaws and the indemnity agreements entered into between us and each of our directors and officers may be sufficiently broad to permit indemnification of the our directors and officers for liabilities arising under the Securities Act.
Reference is also made to the underwriting agreement, which provides for the indemnification of our officers, directors and controlling persons against certain liabilities.
We also maintain directors’ and officers’ liability insurance which includes coverage for securities matters.
Item 15. Recent Sales of Unregistered Securities
In the three years preceding the filing of this registration statement, RetailMeNot, Inc. has sold and issued the following unregistered securities:
| 1. | On December 17, 2010, we sold and issued an aggregate of 35,334 shares of our Series B-1 preferred stock to an accredited investor pursuant to the exercise of a right to purchase capital stock of the Company received in connection with our acquisition of certain assets of CSB Media Company. The shares were sold at a purchase price of approximately $3.54 per share for aggregate consideration of approximately $125,000. |
| 2. | On May 20, 2011, we sold and issued an aggregate of 2,145,512 shares of our Series B-2 preferred stock to an accredited investor at a purchase price of $4.66 per share for aggregate consideration of approximately $10.0 million. |
| 3. | On August 12, 2011, we sold and issued an aggregate of 3,861,916 shares of our Series B-2 preferred stock to 11 accredited investors pursuant to the exercise of outstanding warrants. The shares were sold at a purchase price of $4.66 per share for aggregate consideration of approximately $18.0 million. |
| 4. | On August 17, 2011, we sold and issued an aggregate of 978,998 shares of our Series B-4 preferred stock to six individuals as partial consideration in connection with our acquisition of eConversions Limited at a price of $7.15 per share for aggregate consideration of approximately $7.0 million. |
| 5. | On September 1, 2011, we sold and issued an aggregate of 17,482 shares of our Series B-4 preferred stock to an accredited investor at a purchase price of $7.15 per share for aggregate consideration of approximately $125,000. |
| 6. | On October 28, 2011, we sold and issued an aggregate of 3,053,747 shares of our Series B-3 preferred stock to an accredited investor at a purchase price of $16.37 per share for aggregate consideration of approximately $50.0 million. |
| 7. | On October 28, 2011, we sold and issued an aggregate of 6,107,494 shares of our Series BB-3 preferred stock to two accredited investors at a purchase price of $16.37 per share for aggregate consideration of approximately $100.0 million. |
| 8. | On May 10, 2012, we sold and issued an aggregate of 182,425 shares of our Series B-5 preferred stock to two accredited investors as partial consideration in connection with our acquisition of Miwim at a price of $16.45 per share for aggregate consideration of approximately $3.0 million. |
II-2
Table of Contents
| 9. | On March 22, 2013, we sold and issued an aggregate of 457,796 shares of our Series 1 common stock to an accredited investor pursuant to the exercise of an outstanding warrant. The shares were sold at a purchase price of $0.004 per share for aggregate consideration of approximately $2,000. |
| 10. | During the three-year period ending October 31, 2013, an aggregate of 556,367 unregistered shares of our Series 1 common stock were issued to employees, consultants and directors upon exercise of stock options under our 2007 Stock Plan, for an aggregate consideration of approximately $1.7 million. |
| 11. | During the three-year period ending October 31, 2013, we have granted to employees, consultants and directors options to purchase 5,992,823 unregistered shares of our Series 1 common stock under our 2007 Stock Plan. The exercise price per share of these options ranged from $2.08 to $21.00. |
No underwriters were involved in the foregoing sales of securities. The issuances of the securities described above were deemed to be exempt from registration under the Securities Act, in reliance on Section 4(2) of the Securities Act as transactions by an issuer not involving a public offering, Regulation S of the Securities Act or Rule 701 promulgated under Section 3(b) of the Securities Act as transactions pursuant to compensation benefits plans and contracts relating to compensation.
Item 16. Exhibits and Financial Statement Schedules
(a) Exhibits
| Exhibit Number |
Exhibit Description |
Incorporated by Reference | ||||||||
| Form |
File No. |
Exhibit |
Filing Date | |||||||
| 1.1* | Form of Underwriting Agreement. | |||||||||
| 2.1 | Asset Purchase Agreement for the purchase of RetailMeNot.com, dated November 24, 2010. | DRS | 377-00145 | 2.1 | April 5, 2013 | |||||
| 2.2 | Agreement Relating to the Sale and Purchase of the Entire Issued Share Capital of eConversions Limited, dated August 15, 2011. | DRS | 377-00145 | 2.2 | April 5, 2013 | |||||
| 3.1.1 | Fifth Amended and Restated Certificate of Incorporation dated May 9, 2012. | DRS | 377-00145 | 3.1.1 | April 5, 2013 | |||||
| 3.1.2 | Certificate of Amendment to Fifth Amended and Restated Certificate of Incorporation, dated September 12, 2012. | DRS | 377-00145 | 3.1.2 | April 5, 2013 | |||||
| 3.1.3 | Second Certificate of Amendment to Fifth Amended and Restated Certificate of Incorporation, dated March 8, 2013. | DRS | 377-00145 | 3.1.3 | April 5, 2013 | |||||
| 3.1.4 | Third Certificate of Amendment to Fifth Amended and Restated Certificate of Incorporation, dated April 4, 2013. | DRS | 377-00145 | 3.1.4 | April 5, 2013 | |||||
| 3.1.5 | Fourth Certificate of Amendment to Fifth Amended and Restated Certificate of Incorporation, dated June 12, 2013. | S-1 | 333-189397 | 3.1.5 | June 17, 2013 | |||||
| 3.2 | Form of Sixth Amended and Restated Certificate of Incorporation of the Registrant, to be effective upon the closing of the offering. | S-1/A | 333-189397 | 3.2 | July 8, 2013 | |||||
| 3.3 | Bylaws of the Registrant, as currently in effect. | S-1/A | 333-189397 | 3.4 | July 8, 2013 | |||||
II-3
Table of Contents
| Exhibit |
Exhibit Description |
Incorporated by Reference | ||||||||
| Form |
File No. |
Exhibit |
Filing Date | |||||||
| 4.1.1 | Third Amended and Restated Investors’ Rights Agreement dated October 28, 2011. | DRS | 377-00145 | 4.1.1 | April 5, 2013 | |||||
| 4.1.2 | Amendment to Third Amended and Restated Investors’ Rights Agreement dated May 10, 2012. | DRS | 377-00145 | 4.1.2 | April 5, 2013 | |||||
| 4.2.1 | Third Amended and Restated Right of First Refusal and Co-Sale Agreement dated October 28, 2011. | DRS | 377-00145 | 4.2.1 | April 5, 2013 | |||||
| 4.2.2 | Amendment to Third Amended and Restated Right of First Refusal and Co-Sale Agreement dated May 10, 2012. | DRS | 377-00145 | 4.2.2 | April 5, 2013 | |||||
| 4.3.1 | Third Amended and Restated Voting Agreement dated October 28, 2011. | DRS | 377-00145 | 4.3.1 | April 5, 2013 | |||||
| 4.3.2 | Amendment to Third Amended and Restated Voting Agreement dated May 10, 2012. | DRS | 377-00145 | 4.3.2 | April 5, 2013 | |||||
| 4.3.3 | Voting Agreement dated July 5, 2013. | S-1/A | 333-189397 | 4.3.3 | July 8, 2013 | |||||
| 4.4 | Warrant to Purchase Series 1 common stock issued to Escalate Capital Partners on November 24, 2010. | DRS | 377-00145 | 4.4 | April 5, 2013 | |||||
| 4.5 | Term Loan A Note dated November 24, 2010, payable to Comerica Bank in the original principal amount of $35,000,000. | DRS | 377-00145 | 4.5 | April 5, 2013 | |||||
| 4.6 | Term Loan A Note dated November 24, 2010, payable to Square 1 Bank in the original principal amount of $10,000,000. | DRS | 377-00145 | 4.6 | April 5, 2013 | |||||
| 5.1* | Opinion of DLA Piper LLP (US). | |||||||||
| 10.1 | Form of Indemnification Agreement for directors and officers. | DRS/A | 377-00145 | 10.1 | May 13, 2013 | |||||
| 10.2.1 | 2007 Stock Plan and forms of agreement thereunder. | DRS/A | 377-00145 | 10.2.1 | May 13, 2013 | |||||
| 10.2.2 | First Amendment to the 2007 Stock Plan. | DRS | 377-00145 | 10.2.2 | April 5, 2013 | |||||
| 10.2.3 | Second Amendment to the 2007 Stock Plan. | DRS | 377-00145 | 10.2.3 | April 5, 2013 | |||||
| 10.2.4 | Third Amendment to the 2007 Stock Plan. | DRS | 377-00145 | 10.2.4 | April 5, 2013 | |||||
| 10.2.5 | Fourth Amendment to the 2007 Stock Plan. | DRS | 377-00145 | 10.2.5 | April 5, 2013 | |||||
| 10.2.6 | Fifth Amendment to the 2007 Stock Plan. | DRS | 377-00145 | 10.2.6 | April 5, 2013 | |||||
| 10.2.7 | Sixth Amendment to the 2007 Stock Plan. | DRS | 377-00145 | 10.2.7 | April 5, 2013 | |||||
| 10.3 | Form of the Registrant’s 2012 Bonus Plan for Officers dated May 22, 2012. | DRS | 377-00145 | 10.3 | April 5, 2013 | |||||
| 10.4.1 | Term Loan Agreement by and among Comerica Bank, as administrative agent for the lenders named therein, and the Registrant et al, dated November 24, 2010. | DRS | 377-00145 | 10.4.1 | April 5, 2013 | |||||
II-4
Table of Contents
| Exhibit |
Exhibit Description |
Incorporated by Reference | ||||||||
| Form |
File No. |
Exhibit |
Filing Date | |||||||
| 10.4.2 | First Amendment to Term Loan Agreement. | DRS | 377-00145 | 10.4.2 | April 5, 2013 | |||||
| 10.4.3 | Second Amendment to Term Loan Agreement. | DRS | 377-00145 | 10.4.3 | April 5, 2013 | |||||
| 10.4.4 | Third Amendment to Term Loan Agreement. | DRS | 377-00145 | 10.4.4 | April 5, 2013 | |||||
| 10.4.5 | Fourth Amendment to Term Loan Agreement. | DRS | 377-00145 | 10.4.5 | April 5, 2013 | |||||
| 10.4.6 | Fifth Amendment to Term Loan Agreement. | DRS | 377-00145 | 10.4.6 | April 5, 2013 | |||||
| 10.4.7 | Sixth Amendment to Term Loan Agreement. | DRS | 377-00145 | 10.4.7 | April 5, 2013 | |||||
| 10.4.8 | Amended and Restated Revolving Credit and Term Loan Agreement by and among Comerica Bank, as administrative agent for the lenders named therein, and the Registrant et al, dated July 1, 2013. | S-1/A | 333-189397 | 10.4.8 | July 18, 2013 | |||||
| 10.4.9 | Security Agreement by and among Comerica Bank, as administrative agent for the lenders named therein, the Registrant, Spectrawide Acquisition Co., LLC, CSB Acquisition Co., LLC, CLTD Acquisition Co., LLC, Smallponds, LLC, Deals.com, LLC, RNOT, LLC and WSM CV, LLC, dated July 1, 2013. | S-1/A | 333-189397 | 10.4.9 | July 18, 2013 | |||||
| 10.5 | Intellectual Property Security Agreement by and among the Registrant, Comerica Bank, Spectrawide Acquisition Co., LLC, Spectrawide Inc., CSB Acquisition Co., LLC, CLTD Acquisition Co., LLC, Smallponds, LLC, Deals.com, LLC and RMN Acquisition Co., LLC, dated November 24, 2010. | DRS | 377-00145 | 10.5 | April 5, 2013 | |||||
| 10.5.1 | Intellectual Property Security Agreement by and among Comerica Bank, as administrative agent for the lenders named therein, the Registrant, Spectrawide Acquisition Co., LLC, CSB Acquisition Co., LLC, CLTD Acquisition Co., LLC, Smallponds, LLC, Deals.com, LLC, RNOT, LLC and WSM CV, LLC, dated July 1, 2013. | S-1/A | 333-189397 | 10.5.1 | July 18, 2013 | |||||
| 10.6.1 | Lease Agreement by and between the Registrant and NOP 301 Congress LP, dated May 24, 2011. | DRS | 377-00145 | 10.6.1 | April 5, 2013 | |||||
| 10.6.2 | Amendment No. 1 to Lease Agreement by and between the Registrant and NOP 301 Congress LP, dated November 14, 2011. | DRS | 377-00145 | 10.6.2 | April 5, 2013 | |||||
| 10.6.3 | Amendment No. 2 to Lease Agreement by and between the Registrant and NOP 301 Congress LP, dated November 9, 2012. | DRS | 377-00145 | 10.6.3 | April 5, 2013 | |||||
| 10.6.4 | Amendment No. 3 to Lease Agreement by and between the Registrant and NOP 301 Congress LP, dated January 21, 2013. | S-1/A | 333-189397 | 10.6.4 | July 16, 2013 | |||||
II-5
Table of Contents
| Exhibit |
Exhibit Description |
Incorporated by Reference | ||||||||
| Form |
File No. |
Exhibit |
Filing Date | |||||||
| 10.7.1 | Counterpart Lease Agreement by and among Northburgh House Limited, eConversions Limited and RetailMeNot UK Ltd., dated June 24, 2011. | DRS | 377-00145 | 10.7.1 | April 5, 2013 | |||||
| 10.7.2 | Termination of Lease Agreement by and among Northburgh House Limited, eConversions Limited and RetailMeNot UK Ltd., dated February 1, 2013, and effective as of August 10, 2013. | DRS | 377-00145 | 10.7.2 | April 5, 2013 | |||||
| 10.8.1 | Underlease, dated 1/10/07, amongst Billingford Investments Limited, Braiseworth Investments Limited and Carlton Communications Limited, dated January 10, 2007. | DRS | 377-00145 | 10.8.1 | April 5, 2013 | |||||
| 10.8.2 | Agreement for the Assignment of the Underlease, between Carlton Communications Limited and the Registrant, dated March 11, 2013. | DRS | 377-00145 | 10.8.2 | April 5, 2013 | |||||
| 10.9.1 | Lease Agreement by and between MIWIMMO, Société Civile Immobilière (a real estate company) and MIWIM, Société à Responsabilité Limitée (a limited liability company), dated September 23, 2009. | DRS | 377-00145 | 10.9.1 | April 5, 2013 | |||||
| 10.9.2 | Amendment to Lease by and between MIWIMMO, Société Civile Immobilière (a real estate company) and MIWIM, Société à Responsabilité Limitée (a limited liability company), dated December 31, 2010. | DRS | 377-00145 | 10.9.2 | April 5, 2013 | |||||
| 10.10 | Employment Agreement between the Registrant and G. Cotter Cunningham, dated effective as of March 1, 2013. | DRS | 377-00145 | 10.10 | April 5, 2013 | |||||
| 10.11 | Employment Agreement between the Registrant and Kelli A. Beougher, dated effective as of March 1, 2013. | DRS | 377-00145 | 10.11 | April 5, 2013 | |||||
| 10.12 | Employment Agreement between the Registrant and Douglas C. Jeffries, dated effective as of March 1, 2013. | DRS | 377-00145 | 10.12 | April 5, 2013 | |||||
| 10.13 | Employment Agreement between the Registrant and Paul M. Rogers, dated effective as of March 1, 2013. | DRS | 377-00145 | 10.13 | April 5, 2013 | |||||
| 10.14 | Employment Agreement between the Registrant and Louis J. Agnese, III, dated effective as of March 1, 2013. | DRS | 377-00145 | 10.14 | April 5, 2013 | |||||
| 10.14.1 | Amendment to Employment Agreement between Registrant and Louis J. Agnese, III dated effective as of October 15, 2013. | |||||||||
II-6
Table of Contents
| Exhibit |
Exhibit Description |
Incorporated by Reference | ||||||||
| Form |
File No. |
Exhibit |
Filing Date | |||||||
| 10.15 | Employment Agreement between the Registrant and Jagjit S. Bath, dated effective as of March 1, 2013. | DRS | 377-00145 | 10.15 | April 5, 2013 | |||||
| 10.16 | Employment Agreement between the Registrant and Jillian L. Balis, dated effective as of March 1, 2013. | DRS | 377-00145 | 10.16 | April 5, 2013 | |||||
| 10.17 | Commission Junction Publisher Service Agreement dated November 16, 2010, as assigned to RNOT, LLC pursuant to the Assignment and Assumption Amendment dated November 24, 2010. | DRS | 377-00145 | 10.17 | April 5, 2013 | |||||
| 10.18 | LinkShare Corporation Publisher Membership Agreement, as assigned to the Registrant and RNOT, LLC pursuant to the Consent to Assignment of Agreement dated November 24, 2010. | DRS | 377-00145 | 10.18 | April 5, 2013 | |||||
| 10.19.1 | Google Affiliate Network Online Program Terms and Conditions. | DRS | 377-00145 | 10.19.1 | April 5, 2013 | |||||
| 10.19.2 | Google Affiliate Network Program Policies. | DRS | 377-00145 | 10.19.2 | April 5, 2013 | |||||
| 10.19.3 | Google AdSense Online Standard Terms and Conditions. | DRS | 377-00145 | 10.19.3 | April 5, 2013 | |||||
| 10.20 | 2013 Equity Incentive Plan. | S-1/A | 333-189397 | 10.20 | July 8, 2013 | |||||
| 10.21 | 2013 Employee Stock Purchase Plan. | S-1/A | 333-189397 | 10.21 | July 8, 2013 | |||||
| 10.22 | Board Offer Letter between the Registrant and Brian H. Sharples, dated as of July 11, 2011. | DRS/A | 377-00145 | 10.22 | May 13, 2013 | |||||
| 10.23 | Board Offer Letter between the Registrant and Greg J. Santora, dated as of April 24, 2013. | DRS/A | 377-00145 | 10.23 | May 13, 2013 | |||||
| 10.24 | Employment Agreement between the Registrant and Steven T. Pho, dated effective as of March 1, 2013. | |||||||||
| 10.24.1 | Amendment to Employment Agreement between Registrant and Steven T. Pho, dated effective as of October 15, 2013. | |||||||||
| 21.1* | List of Subsidiaries of the Registrant. | |||||||||
| 23.1 | Consent of Ernst & Young LLP, Independent Registered Public Accounting Firm. | |||||||||
| 23.2 | Consent of ShineWing Hall Chadwick, Independent Registered Public Accounting Firm. | |||||||||
| 23.3* | Consent of DLA Piper LLP (US) (included in Exhibit 5.1). | |||||||||
| 24.1 | Power of Attorney (see page II-10 to this registration statement on Form S-1). | |||||||||
| * | To be filed by amendment. |
II-7
Table of Contents
Financial statement schedules have been omitted because the information required to be set forth therein is either inapplicable or is shown in our consolidated financial statements or notes thereto, other than with respect to the statement above related to dividend payments.
Item 17. Undertakings
The undersigned Registrant hereby undertakes to provide to the underwriters, at the closing specified in the underwriting agreement, certificates in such denominations and registered in such names as required by the underwriters to permit prompt delivery to each purchaser.
Insofar as indemnification by the Registrant for liabilities arising under the Securities Act may be permitted to directors, officers and controlling persons of the Registrant pursuant to the foregoing provisions or otherwise, the Registrant has been advised that in the opinion of the Securities and Exchange Commission such indemnification is against public policy as expressed in the Securities Act, and is, therefore, unenforceable. In the event that a claim for indemnification against such liabilities (other than the payment by the Registrant of expenses incurred or paid by a director, officer, or controlling person of the Registrant in the successful defense of any action, suit or proceeding) is asserted by such director, officer or controlling person in connection with the securities being registered, the Registrant will, unless in the opinion of its counsel the matter has been settled by controlling precedent, submit to a court of appropriate jurisdiction the question whether such indemnification by it is against public policy as expressed in the Securities Act and will be governed by the final adjudication of such issue.
The Registrant hereby undertakes that:
(1) For purposes of determining any liability under the Securities Act, the information omitted from the form of prospectus filed as part of this registration statement in reliance upon Rule 430A and contained in a form of prospectus filed by the Registrant pursuant to Rule 424(b)(1) or (4) or 497(h) under the Securities Act shall be deemed to be part of this registration statement as of the time it was declared effective.
(2) For the purpose of determining any liability under the Securities Act, each post-effective amendment that contains a form of prospectus shall be deemed to be a new registration statement relating to the securities offered therein, and the offering of such securities at that time shall be deemed to be the initial bona fide offering thereof.
II-8
Table of Contents
SIGNATURES
Pursuant to the requirements of the Securities Act of 1933, as amended, the Registrant has duly caused this registration statement to be signed on its behalf by the undersigned, thereunto duly authorized, in Austin, Texas on December 2, 2013.
| RETAILMENOT, INC. | ||
| By: | /s/ G. Cotter Cunningham | |
| G. Cotter Cunningham President and Chief Executive Officer | ||
II-9
Table of Contents
SIGNATURES AND POWER OF ATTORNEY
KNOW ALL PERSONS BY THESE PRESENTS, that each person whose signature appears below hereby constitutes and appoints G. Cotter Cunningham and Douglas C. Jeffries and each of them, his or her true and lawful agent, proxy and attorney-in-fact, with full power of substitution and resubstitution, for him or her and in his or her name, place and stead, in any and all capacities, to (i) act on, sign and file with the Securities and Exchange Commission any and all amendments (including post-effective amendments) to this registration statement together with all schedules and exhibits thereto and any subsequent registration statement filed pursuant to Rule 462(b) under the Securities Act of 1933, as amended, together with all schedules and exhibits thereto, (ii) act on, sign and file such certificates, instruments, agreements and other documents as may be necessary or appropriate in connection therewith, (iii) act on and file any supplement to any prospectus included in this registration statement or any such amendment or any subsequent registration statement filed pursuant to Rule 462(b) under the Securities Act of 1933, as amended and (iv) take any and all actions which may be necessary or appropriate to be done, as fully for all intents and purposes as he or she might or could do in person, hereby approving, ratifying and confirming all that such agent, proxy and attorney-in-fact or any of his substitutes may lawfully do or cause to be done by virtue thereof.
Pursuant to the requirements of the Securities Act of 1933, as amended, this registration statement has been signed by the following persons in the capacities and on the dates indicated:
| Signature |
Title |
Date | ||
| /s/ G. Cotter Cunningham G. Cotter Cunningham |
President, Chief Executive Officer (Principal Executive Officer) and Director | December 2, 2013 | ||
| /s/ Douglas C. Jeffries Douglas C. Jeffries |
Chief Financial Officer (Principal Financial Officer) | December 2, 2013 | ||
| /s/ Thomas E. Aylor Thomas E. Aylor |
Principal Accounting Officer | December 2, 2013 | ||
| /s/ C. Thomas Ball C. Thomas Ball |
Director | December 2, 2013 | ||
| /s/ Jeffrey M. Crowe Jeffrey M. Crowe |
Director | December 2, 2013 | ||
| /s/ Karim B. Faris Karim B. Faris |
Director | December 2, 2013 | ||
| /s/ Jules A. Maltz Jules A. Maltz |
Director | December 2, 2013 | ||
| /s/ Gokul Rajaram Gokul Rajaram |
Director | December 2, 2013 | ||
| /s/ Greg J. Santora Greg J. Santora |
Director | December 2, 2013 | ||
| /s/ Brian H. Sharples Brian H. Sharples |
Director | December 2, 2013 | ||
II-10
Table of Contents
EXHIBIT INDEX
| Exhibit |
Exhibit Description |
Incorporated by Reference | ||||||||
| Form |
File No. |
Exhibit |
Filing Date | |||||||
| 1.1* | Form of Underwriting Agreement. | |||||||||
| 2.1 | Asset Purchase Agreement for the purchase of RetailMeNot.com, dated November 24, 2010. | DRS | 377-00145 | 2.1 | April 5, 2013 | |||||
| 2.2 | Agreement Relating to the Sale and Purchase of the Entire Issued Share Capital of eConversions Limited, dated August 15, 2011. | DRS | 377-00145 | 2.2 | April 5, 2013 | |||||
| 3.1.1 | Fifth Amended and Restated Certificate of Incorporation dated May 9, 2012. | DRS | 377-00145 | 3.1.1 | April 5, 2013 | |||||
| 3.1.2 | Certificate of Amendment to Fifth Amended and Restated Certificate of Incorporation, dated September 12, 2012. | DRS | 377-00145 | 3.1.2 | April 5, 2013 | |||||
| 3.1.3 | Second Certificate of Amendment to Fifth Amended and Restated Certificate of Incorporation, dated March 8, 2013. | DRS | 377-00145 | 3.1.3 | April 5, 2013 | |||||
| 3.1.4 | Third Certificate of Amendment to Fifth Amended and Restated Certificate of Incorporation, dated April 4, 2013. | DRS | 377-00145 | 3.1.4 | April 5, 2013 | |||||
| 3.1.5 | Fourth Certificate of Amendment to Fifth Amended and Restated Certificate of Incorporation, dated June 12, 2013. | S-1 | 333-189397 | 3.1.5 | June 17, 2013 | |||||
| 3.2 | Form of Sixth Amended and Restated Certificate of Incorporation of the Registrant, to be effective upon the closing of the offering. | S-1/A | 333-189397 | 3.2 | July 8, 2013 | |||||
| 3.3 | Bylaws of the Registrant, as currently in effect. | S-1/A | 333-189397 | 3.4 | July 8, 2013 | |||||
| 4.1.1 | Third Amended and Restated Investors’ Rights Agreement dated October 28, 2011. | DRS | 377-00145 | 4.1.1 | April 5, 2013 | |||||
| 4.1.2 | Amendment to Third Amended and Restated Investors’ Rights Agreement dated May 10, 2012. | DRS | 377-00145 | 4.1.2 | April 5, 2013 | |||||
| 4.2.1 | Third Amended and Restated Right of First Refusal and Co-Sale Agreement dated October 28, 2011. | DRS | 377-00145 | 4.2.1 | April 5, 2013 | |||||
| 4.2.2 | Amendment to Third Amended and Restated Right of First Refusal and Co-Sale Agreement dated May 10, 2012. | DRS | 377-00145 | 4.2.2 | April 5, 2013 | |||||
| 4.3.1 | Third Amended and Restated Voting Agreement dated October 28, 2011. | DRS | 377-00145 | 4.3.1 | April 5, 2013 | |||||
| 4.3.2 | Amendment to Third Amended and Restated Voting Agreement dated May 10, 2012. | DRS | 377-00145 | 4.3.2 | April 5, 2013 | |||||
| 4.3.3 | Voting Agreement dated July 5, 2013. | S-1/A | 333-189397 | 4.3.3 | July 8, 2013 | |||||
| 4.4 | Warrant to Purchase Series 1 common stock issued to Escalate Capital Partners on November 24, 2010. | DRS | 377-00145 | 4.4 | April 5, 2013 | |||||
Table of Contents
| Exhibit |
Exhibit Description |
Incorporated by Reference | ||||||||
| Form |
File No. |
Exhibit |
Filing Date | |||||||
| 4.5 | Term Loan A Note dated November 24, 2010, payable to Comerica Bank in the original principal amount of $35,000,000. | DRS | 377-00145 | 4.5 | April 5, 2013 | |||||
| 4.6 | Term Loan A Note dated November 24, 2010, payable to Square 1 Bank in the original principal amount of $10,000,000. | DRS | 377-00145 | 4.6 | April 5, 2013 | |||||
| 5.1* | Opinion of DLA Piper LLP (US). | |||||||||
| 10.1 | Form of Indemnification Agreement for directors and officers. | DRS/A | 377-00145 | 10.1 | May 13, 2013 | |||||
| 10.2.1 | 2007 Stock Plan and forms of agreement thereunder. | DRS/A | 377-00145 | 10.2.1 | May 13, 2013 | |||||
| 10.2.2 | First Amendment to the 2007 Stock Plan. | DRS | 377-00145 | 10.2.2 | April 5, 2013 | |||||
| 10.2.3 | Second Amendment to the 2007 Stock Plan. | DRS | 377-00145 | 10.2.3 | April 5, 2013 | |||||
| 10.2.4 | Third Amendment to the 2007 Stock Plan. | DRS | 377-00145 | 10.2.4 | April 5, 2013 | |||||
| 10.2.5 | Fourth Amendment to the 2007 Stock Plan. | DRS | 377-00145 | 10.2.5 | April 5, 2013 | |||||
| 10.2.6 | Fifth Amendment to the 2007 Stock Plan. | DRS | 377-00145 | 10.2.6 | April 5, 2013 | |||||
| 10.2.7 | Sixth Amendment to the 2007 Stock Plan. | DRS | 377-00145 | 10.2.7 | April 5, 2013 | |||||
| 10.3 | Form of the Registrant’s 2012 Bonus Plan for Officers dated May 22, 2012. | DRS | 377-00145 | 10.3 | April 5, 2013 | |||||
| 10.4.1 | Term Loan Agreement by and among Comerica Bank, as administrative agent for the lenders named therein, and the Registrant et al, dated November 24, 2010. | DRS | 377-00145 | 10.4.1 | April 5, 2013 | |||||
| 10.4.2 | First Amendment to Term Loan Agreement. | DRS | 377-00145 | 10.4.2 | April 5, 2013 | |||||
| 10.4.3 | Second Amendment to Term Loan Agreement. | DRS | 377-00145 | 10.4.3 | April 5, 2013 | |||||
| 10.4.4 | Third Amendment to Term Loan Agreement. | DRS | 377-00145 | 10.4.4 | April 5, 2013 | |||||
| 10.4.5 | Fourth Amendment to Term Loan Agreement. | DRS | 377-00145 | 10.4.5 | April 5, 2013 | |||||
| 10.4.6 | Fifth Amendment to Term Loan Agreement. | DRS | 377-00145 | 10.4.6 | April 5, 2013 | |||||
| 10.4.7 | Sixth Amendment to Term Loan Agreement. | DRS | 377-00145 | 10.4.7 | April 5, 2013 | |||||
| 10.4.8 | Amended and Restated Revolving Credit and Term Loan Agreement by and among Comerica Bank, as administrative agent for the lenders named therein, and the Registrant et al, dated July 1, 2013. | S-1/A | 333-189397 | 10.4.8 | July 18, 2013 | |||||
| 10.4.9 | Security Agreement by and among Comerica Bank, as administrative agent for the lenders named therein, the Registrant, Spectrawide Acquisition Co., LLC, CSB Acquisition Co., LLC, CLTD Acquisition Co., LLC, Smallponds, LLC, Deals.com, LLC, RNOT, LLC and WSM CV, LLC, dated July 1, 2013. | S-1/A | 333-189397 | 10.4.9 | July 18, 2013 | |||||
Table of Contents
| Exhibit |
Exhibit Description |
Incorporated by Reference | ||||||||
| Form |
File No. |
Exhibit |
Filing Date | |||||||
| 10.5 | Intellectual Property Security Agreement by and among the Registrant, Comerica Bank, Spectrawide Acquisition Co., LLC, Spectrawide Inc., CSB Acquisition Co., LLC, CLTD Acquisition Co., LLC, Smallponds, LLC, Deals.com, LLC and RMN Acquisition Co., LLC, dated November 24, 2010. | DRS | 377-00145 | 10.5 | April 5, 2013 | |||||
| 10.5.1 | Intellectual Property Security Agreement by and among Comerica Bank, as administrative agent for the lenders named therein, the Registrant, Spectrawide Acquisition Co., LLC, CSB Acquisition Co., LLC, CLTD Acquisition Co., LLC, Smallponds, LLC, Deals.com, LLC, RNOT, LLC and WSM CV, LLC, dated July 1, 2013. | S-1/A | 333-189397 | 10.5.1 | July 18, 2013 | |||||
| 10.6.1 | Lease Agreement by and between the Registrant and NOP 301 Congress LP, dated May 24, 2011. | DRS | 377-00145 | 10.6.1 | April 5, 2013 | |||||
| 10.6.2 | Amendment No. 1 to Lease Agreement by and between the Registrant and NOP 301 Congress LP, dated November 14, 2011. | DRS | 377-00145 | 10.6.2 | April 5, 2013 | |||||
| 10.6.3 | Amendment No. 2 to Lease Agreement by and between the Registrant and NOP 301 Congress LP, dated November 9, 2012. | DRS | 377-00145 | 10.6.3 | April 5, 2013 | |||||
| 10.6.4 | Amendment No. 3 to Lease Agreement by and between the Registrant and NOP 301 Congress LP, dated January 21, 2013. | S-1/A | 333-189397 | 10.6.4 | July 16, 2013 | |||||
| 10.7.1 | Counterpart Lease Agreement by and among Northburgh House Limited, eConversions Limited and RetailMeNot UK Ltd., dated June 24, 2011. | DRS | 377-00145 | 10.7.1 | April 5, 2013 | |||||
| 10.7.2 | Termination of Lease Agreement by and among Northburgh House Limited, eConversions Limited and RetailMeNot UK Ltd., dated February 1, 2013, and effective as of August 10, 2013. | DRS | 377-00145 | 10.7.2 | April 5, 2013 | |||||
| 10.8.1 | Underlease, dated 1/10/07, amongst Billingford Investments Limited, Braiseworth Investments Limited and Carlton Communications Limited, dated January 10, 2007. | DRS | 377-00145 | 10.8.1 | April 5, 2013 | |||||
| 10.8.2 | Agreement for the Assignment of the Underlease, between Carlton Communications Limited and the Registrant, dated March 11, 2013. | DRS | 377-00145 | 10.8.2 | April 5, 2013 | |||||
| 10.9.1 | Lease Agreement by and between MIWIMMO, Société Civile Immobilière (a real estate company) and MIWIM, Société à Responsabilité Limitée (a limited liability company), dated September 23, 2009. | DRS | 377-00145 | 10.9.1 | April 5, 2013 | |||||
Table of Contents
| Exhibit |
Exhibit Description |
Incorporated by Reference | ||||||||
| Form |
File No. |
Exhibit |
Filing Date | |||||||
| 10.9.2 | Amendment to Lease by and between MIWIMMO, Société Civile Immobilière (a real estate company) and MIWIM, Société à Responsabilité Limitée (a limited liability company), dated December 31, 2010. | DRS | 377-00145 | 10.9.2 | April 5, 2013 | |||||
| 10.10 | Employment Agreement between the Registrant and G. Cotter Cunningham, dated effective as of March 1, 2013. | DRS | 377-00145 | 10.10 | April 5, 2013 | |||||
| 10.11 | Employment Agreement between the Registrant and Kelli A. Beougher, dated effective as of March 1, 2013. | DRS | 377-00145 | 10.11 | April 5, 2013 | |||||
| 10.12 | Employment Agreement between the Registrant and Douglas C. Jeffries, dated effective as of March 1, 2013. | DRS | 377-00145 | 10.12 | April 5, 2013 | |||||
| 10.13 | Employment Agreement between the Registrant and Paul M. Rogers, dated effective as of March 1, 2013. | DRS | 377-00145 | 10.13 | April 5, 2013 | |||||
| 10.14 | Employment Agreement between the Registrant and Louis J. Agnese, III, dated effective as of March 1, 2013. | DRS | 377-00145 | 10.14 | April 5, 2013 | |||||
| 10.14.1 | Amendment to Employment Agreement between Registrant and Louis J. Agnese, III dated effective as of October 15, 2013. | |||||||||
| 10.15 | Employment Agreement between the Registrant and Jagjit S. Bath, dated effective as of March 1, 2013. | DRS | 377-00145 | 10.15 | April 5, 2013 | |||||
| 10.16 | Employment Agreement between the Registrant and Jillian L. Balis, dated effective as of March 1, 2013. | DRS | 377-00145 | 10.16 | April 5, 2013 | |||||
| 10.17 | Commission Junction Publisher Service Agreement dated November 16, 2010, as assigned to RNOT, LLC pursuant to the Assignment and Assumption Amendment dated November 24, 2010. | DRS | 377-00145 | 10.17 | April 5, 2013 | |||||
| 10.18 | LinkShare Corporation Publisher Membership Agreement, as assigned to the Registrant and RNOT, LLC pursuant to the Consent to Assignment of Agreement dated November 24, 2010. | DRS | 377-00145 | 10.18 | April 5, 2013 | |||||
| 10.19.1 | Google Affiliate Network Online Program Terms and Conditions. | DRS | 377-00145 | 10.19.1 | April 5, 2013 | |||||
| 10.19.2 | Google Affiliate Network Program Policies. | DRS | 377-00145 | 10.19.2 | April 5, 2013 | |||||
| 10.19.3 | Google AdSense Online Standard Terms and Conditions. | DRS | 377-00145 | 10.19.3 | April 5, 2013 | |||||
| 10.20 | 2013 Equity Incentive Plan. | S-1/A | 333-189397 | 10.20 | July 8, 2013 | |||||
Table of Contents
| Exhibit |
Exhibit Description |
Incorporated by Reference | ||||||||
| Form |
File No. |
Exhibit |
Filing Date | |||||||
| 10.21 | 2013 Employee Stock Purchase Plan. | S-1/A | 333-189397 | 10.21 | July 8, 2013 | |||||
| 10.22 | Board Offer Letter between the Registrant and Brian H. Sharples, dated as of July 11, 2011. | DRS/A | 377-00145 | 10.22 | May 13, 2013 | |||||
| 10.23 | Board Offer Letter between the Registrant and Greg J. Santora, dated as of April 24, 2013. | DRS/A | 377-00145 | 10.23 | May 13, 2013 | |||||
| 10.24 | Employment Agreement between the Registrant and Steven T. Pho, dated effective as of March 1, 2013. | |||||||||
| 10.24.1 | Amendment to Employment Agreement between Registrant and Steven T. Pho, dated effective as of October 15, 2013. | |||||||||
| 21.1* | List of Subsidiaries of the Registrant. | |||||||||
| 23.1 | Consent of Ernst & Young LLP, Independent Registered Public Accounting Firm. | |||||||||
| 23.2 | Consent of ShineWing Hall Chadwick, Independent Registered Public Accounting Firm. | |||||||||
| 23.3* | Consent of DLA Piper LLP (US) (included in Exhibit 5.1). | |||||||||
| 24.1 | Power of Attorney (see page II-10 to this registration statement on Form S-1). | |||||||||
| * | To be filed by amendment. |