Attached files
| file | filename |
|---|---|
| 8-K - iMedia Brands, Inc. | vv_8k1120.htm |
| EX-99.1 - PRESS RELEASE - iMedia Brands, Inc. | vv_8k1120ex.htm |
Exhibit 99.2

MANAGEMENT PRESENTATION November 2013 ValueVision Media (NASDAQ: VVTV - SINCE 1991) For period ended 11/2/13

SAFE HARBOR This document contains certain “forward-looking statements” within the meaning of the Private Securities Litigation Reform Act of 1995. Any statements contained herein that are not statements of historical fact may be deemed forward-looking statements. These statements are based on management's current expectations and accordingly are subject to uncertainty and changes in circumstances. Actual results may vary materially from the expectations contained herein due to various important factors, including (but not limited to): consumer preferences, spending and debt levels; the general economic and credit environment; interest rates; seasonal variations in consumer purchasing activities; the ability to achieve the most effective product category mixes to maximize sales and margin objectives; competitive pressures on sales; pricing and gross sales margins; the level of cable and satellite distribution for our programming and the associated fees; our ability to establish and maintain acceptable commercial terms with third-party vendors and other third parties with whom we have contractual relationships, and to successfully manage key vendor relationships; our ability to manage our operating expenses successfully and our working capital levels; our ability to remain compliant with our long-term credit facility covenants; our ability to successfully transition our brand name; the market demand for television station sales; our management and information systems infrastructure; challenges to our data and information security; changes in governmental or regulatory requirements; litigation or governmental proceedings affecting our operations; significant public events that are difficult to predict, or other significant television-covering events causing an interruption of television coverage or that directly compete with the viewership of our programming; and our ability to obtain and retain key executives and employees. More detailed information about those factors is set forth in the Company's filings with the Securities and Exchange Commission, including the Company's annual report on Form 10-K, quarterly reports on Form 10-Q, and current reports on Form 8-K. You are cautioned not to place undue reliance on forward-looking statements, which speak only as of the date of this announcement. The Company is under no obligation (and expressly disclaims any such obligation) to update or alter its forward-looking statements whether as a result of new information, future events or otherwise. The Company includes information on the Future State of the business in certain instances in the following presentation. This information is intended to identify aspirational goals of the Company with respect to certain metrics, and is not tied to a specific date or timeline. These aspirational objectives are forward-looking statements and should be read in conjunction with the company's risk factors identified in our most recent annual report on Form 10-K and periodic reports filed after such 10-K. ADJUSTED EBITDA EBITDA represents net loss for the respective periods excluding depreciation and amortization expense, interest income (expense) and income taxes. The Company defines Adjusted EBITDA as EBITDA excluding debt extinguishment; non-operating gains (losses); non-cash impairment charges and write-downs; activist shareholder response costs; and non-cash share-based compensation expense. The Company has included the term “Adjusted EBITDA” in our EBITDA reconciliation in order to adequately assess the operating performance of our television and Internet businesses and in order to maintain comparability to our analyst's coverage and financial guidance, when given. Management believes that Adjusted EBITDA allows investors to make a more meaningful comparison between our business operating results over different periods of time with those of other similar companies. In addition, management uses Adjusted EBITDA as a metric to evaluate operating performance under its management and executive incentive compensation programs. Adjusted EBITDA should not be construed as an alternative to operating income (loss), net income (loss) or to cash flows from operating activities as determined in accordance with generally accepted accounting principles and should not be construed as a measure of liquidity. Adjusted EBITDA may not be comparable to similarly entitled measures reported by other companies. The company has included a reconciliation of Adjusted EBITDA to net loss, its most directly comparable GAAP financial measure, in this presentation. LTM LTM refers to the Last Twelve Months of reported company information on or about the date of this presentation. Data in this deck may be unaudited. IMPORTANT INFORMATION This release may be deemed to be solicitation material in respect of the solicitation of proxies from shareholders in connection with one or more meetings of the Company’s stockholders, including a special meeting of shareholders, if such a meeting is called. The Company, its directors and certain of its executive officers and employees may be deemed to be participants in the solicitation of proxies from shareholders in connection with any such meetings of shareholders. Information concerning these directors and executive officers in connection with the matters to be voted on at any such meeting that may be held will be included in the proxy statement filed by the Company with the Securities and Exchange Commission (the “SEC”) in connection with any such meeting. In addition, the Company files annual, quarterly and special reports, proxy and information statements, and other information with the SEC. Any proxy statement, any other relevant documents and any other material filed with the SEC concerning the Company will be, when filed, available free of charge at the SEC website at http://www.sec.gov. SHAREHOLDERS ARE URGED TO READ CAREFULLY ANY SUCH PROXY STATEMENT FILED BY THE COMPANY AND ANY OTHER RELEVANT DOCUMENTS FILED WHEN THEY BECOME AVAILABLE BECAUSE THEY WILL CONTAIN IMPORTANT INFORMATION, INCLUDING INFORMATION WITH RESPECT TO PARTICIPANTS. DISCLOSURES *
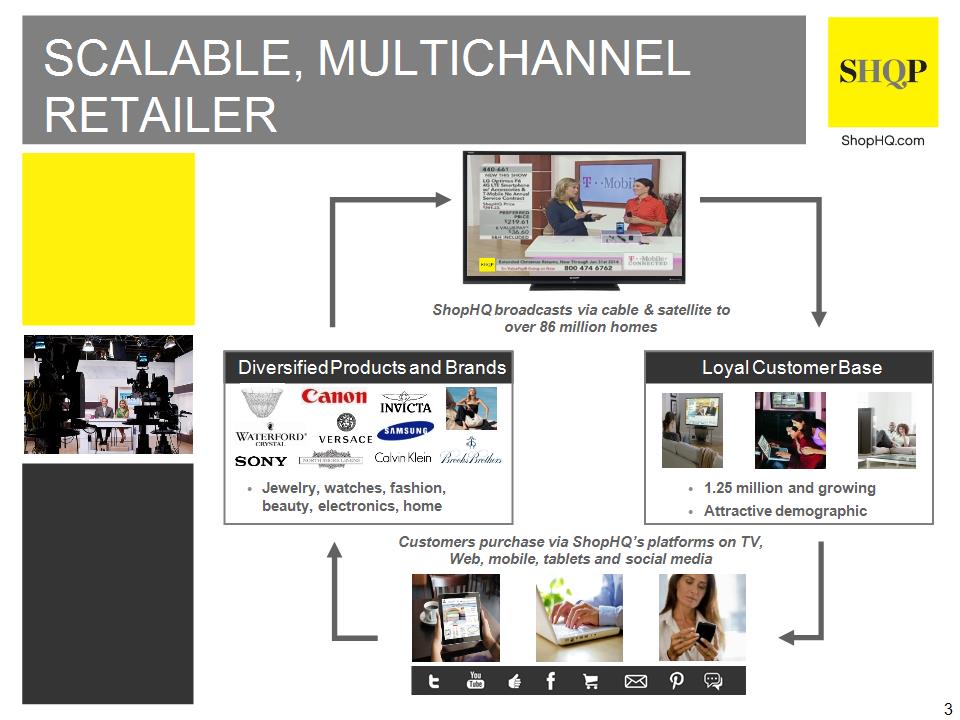
SCALABLE, MULTICHANNEL RETAILER * Customers purchase via ShopHQ’s platforms on TV, Web, mobile, tablets and social media Diversified Products and Brands Loyal Customer Base 1.25 million and growing Attractive demographic Jewelry, watches, fashion, beauty, electronics, home ShopHQ broadcasts via cable & satellite to over 86 million homes

On May 22, 2013, ValueVision announced the rebranding of ShopNBC to ShopHQ ShopHQ brand leverages core identity of “Shop” and layers on simplicity, comfort and strength ShopHQ states the aspiration of inspiring and building communities through shopping Transition to ShopHQ is nearly complete and has been executed via a gradual transition during the 2013 fiscal year, supported by a targeted customer marketing campaign Company’s multichannel electronic retail model remains the same and focuses on its four primary categories: Jewelry & Watches, Home & Consumer Electronics, Fashion & Accessories, and Beauty, Health & Fitness * REBRANDING TO SHOPHQ

2008 Keith Stewart CEO 23 Years QVC 2010 Bob Ayd President 37 Years Macy’s, QVC 2010 Bill McGrath EVP & CFO 33 Years Arthur Andersen, Subaru, QVC 2009 Carol Steinberg COO 19 Years David’s Bridal, QVC 2011 Annette Repasch SVP & Chief Merchandising Officer 26 Years Saks, QVC, Stages Stores 2008 Jean Sabatier SVP Sales, Planning, Programming & Special Projects 15 Years QVC 2004 Mike Murray SVP Operations 28 Years Fingerhut 2004 Teresa Dery SVP & General Counsel 19 Years Net Perceptions, 1 Potato 2 2011 Nancy Kunkle SVP Customer Experience & Business Process Engineering 27 Years QVC, Boeing 2000 Ashish Akolkar VP IT Operations 15 Years NetBriefings, Sunflower IT 2001 Beth McCartan VP Financial Planning & Analysis 19 Years Pillsbury 1996 Nick Vassallo VP Corporate Controller 23 Years Arthur Andersen, Fourth Shift 2009 Randy Ronning Chairman of Board 39 Years JC Penney, QVC JOINED NAME TITLE YEARS PREVIOUS EXPERIENCE Leadership with over 300 years of combined experience * SEASONED MULTICHANNEL RETAILING MANAGEMENT
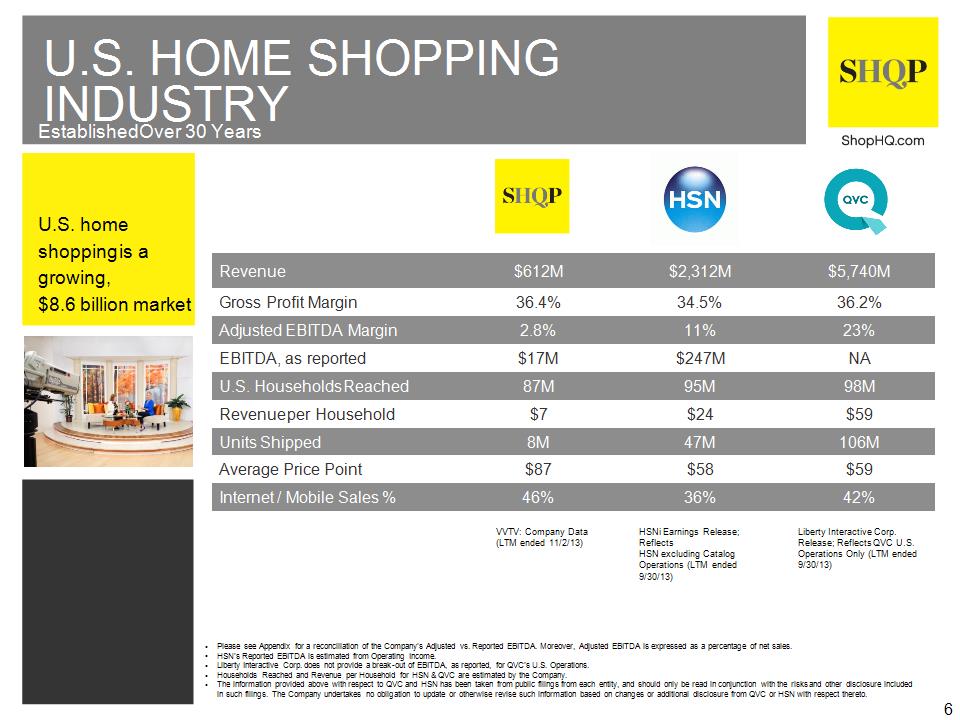
Revenue $612M $2,312M $5,740M Gross Profit Margin 36.4% 34.5% 36.2% Adjusted EBITDA Margin 2.8% 11% 23% EBITDA, as reported $17M $247M NA U.S. Households Reached 87M 95M 98M Revenue per Household $7 $24 $59 Units Shipped 8M 47M 106M Average Price Point $87 $58 $59 Internet / Mobile Sales % 46% 36% 42% VVTV: Company Data (LTM ended 11/2/13) HSNi Earnings Release; Reflects HSN excluding Catalog Operations (LTM ended 9/30/13) Liberty Interactive Corp. Release; Reflects QVC U.S. Operations Only (LTM ended 9/30/13) Please see Appendix for a reconciliation of the Company’s Adjusted vs. Reported EBITDA. Moreover, Adjusted EBITDA is expressed as a percentage of net sales. HSN’s Reported EBITDA is estimated from Operating Income. Liberty Interactive Corp. does not provide a break-out of EBITDA, as reported, for QVC’s U.S. Operations. Households Reached and Revenue per Household for HSN & QVC are estimated by the Company. The information provided above with respect to QVC and HSN has been taken from public filings from each entity, and should only be read in conjunction with the risks and other disclosure included in such filings. The Company undertakes no obligation to update or otherwise revise such information based on changes or additional disclosure from QVC or HSN with respect thereto. U.S. HOME SHOPPING INDUSTRY Established Over 30 Years * U.S. home shopping is a growing, $8.6 billion market
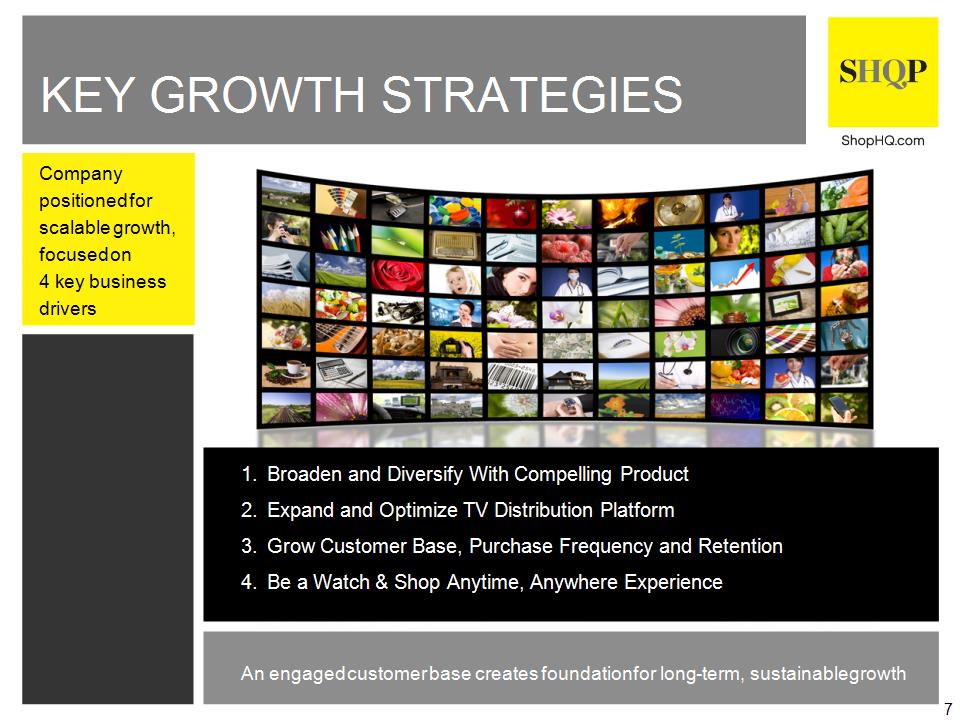
KEY GROWTH STRATEGIES Broaden and Diversify With Compelling Product Expand and Optimize TV Distribution Platform Grow Customer Base, Purchase Frequency and Retention Be a Watch & Shop Anytime, Anywhere Experience An engaged customer base creates foundation for long-term, sustainable growth * Company positioned for scalable growth, focused on 4 key business drivers

Annual spend increases when our customers engage in multiple channels * Increased Product Diversification Jewelry & Watches Home & Consumer Electronics Beauty, Health & Fitness Fashion & Accessories DIVERSE PRODUCT MIX WITH DISTINCTIVE NATIONAL BRANDS

Increased visibility by improving channel positions that our customers frequent * Increased Second+ Channel Presence 2008 Current Select Cable & Satellite TV Distribution Partners U.S. Household Penetration Total US(1) ~115 million ShopHQ 87 million GROWING NATIONAL AUDIENCE Continues to grow the number of U.S. households ShopHQ reaches by 3% to 4% annually - Comparable footprint to QVC (98 million U.S. homes) and HSN (95 million U.S. homes) Company has affiliate agreements with more than 1,500 cable systems supporting its TV distribution network ShopHQ is continuously improving its channel positioning through the addition of a second channel of exposure and lower channel positioning (1) Source: Nielsen, May 2013.

Our base of customers is growing in size and is more engaged * Key Characteristics 70% female with average income $70k plus Community-oriented and college educated; want to be informed and entertained Style conscious, valuing newness and unique products Customers’ shopping demographics index high relative to industry competition Prefer convenience of “watch & shop anytime, anywhere” experience Strong propensity to buy digitally, with internet / mobile comprising 46% of total sales Total Customers (thousands) Internet / Mobile Sales % KEY INDICATOR/INDUSTRY BENCHMARK 2011 2012 2013 Net Promoter Score (1) 36% 47% 54% (1) Net Promoter Score, or NPS, is a nationally-recognized third party customer satisfaction indicator. The Company views this indicator as a reaction of its customers to progress made with certain customer focused initiatives. Going forward, the Company has the opportunity to use NPS as an additional tool to measure changes it is making as policies are implemented. HSN data excludes Catalog Operations (LTM ended 9/30/13) QVC data is domestic only (LTM 9/30/13) ATTRACTIVE CUSTOMER DEMOGRAPHIC

New Retained * Improved Customer Retention Customer Retention % by Annual Purchase Frequency Annual Customer Purchases by Length of Relationship Customers who make a greater number of purchases are more likely to repeat as customers the following year Customer longevity drives purchase frequency and increases total annual spend INCREASING RETENTION & PURCHASE FREQUENCY F08 LTM New Retained Increased retention and purchase frequency drives long term sustainable growth

Business realigned to support long-term growth * Return Rate 26% Improvement U.S. Households (millions) 21% Growth KEY OPERATING METRICS Please see Appendix for above data for years F09 through F12. Units shipped have doubled as ShopHQ has increased its household penetration and purchase frequency Shift in average price point reflects ShopHQ’s strategy to diversify its product mix away from higher priced products such as jewelry and watches to beauty, fashion and home products Improved efficiency demonstrated through lower costs / household, return rate and transaction costs / unit TV Costs / Household 31% Improvement Transaction Costs / Unit 48% Improvement Units Shipped (millions) 100% Growth Average Price Point 51% Decline

Selected Quarterly Metrics Selected Quarterly Metrics Selected Quarterly Metrics Selected Quarterly Metrics Selected Quarterly Metrics Quarter Total Customers (thousands) Average Price Point Average Purchase Frequency Total Net Sales ($millions) F13 Q3 532.9 $80 3.5x $147.3 F12 Q3 444.9 $100 3.1x $137.6 F13 Q2 522.3 $83 3.4x $148.6 F12 Q2 429.1 $102 3.1x $135.2 F13 Q1 497.4 $93 3.3x $151.4 F12 Q1 466.4 $95 3.1x $136.5 * Total Customers Average Price Point Average Purchase Frequency Total Revenue An engaged customer creates foundation for long term sustainable growth IMPROVED CUSTOMER ENGAGEMENT Increasing new and repeat customers driven by: Further diversification of product mix and a broader offering of merchandise Lower average price points offer a lower entry point for new customers Significant improvement in channel positioning Increasing average purchase frequency driven by: Improved selection of “repurchase-oriented” products (i.e., Fashion and Beauty) Enhanced user experience of mobile applications Increase in the Company’s Net Promoter Score, a third-party measure of customer satisfaction 7% (2%) 6% 11% 22% (19%) 11% 10% 20% (20%) 12% 7%
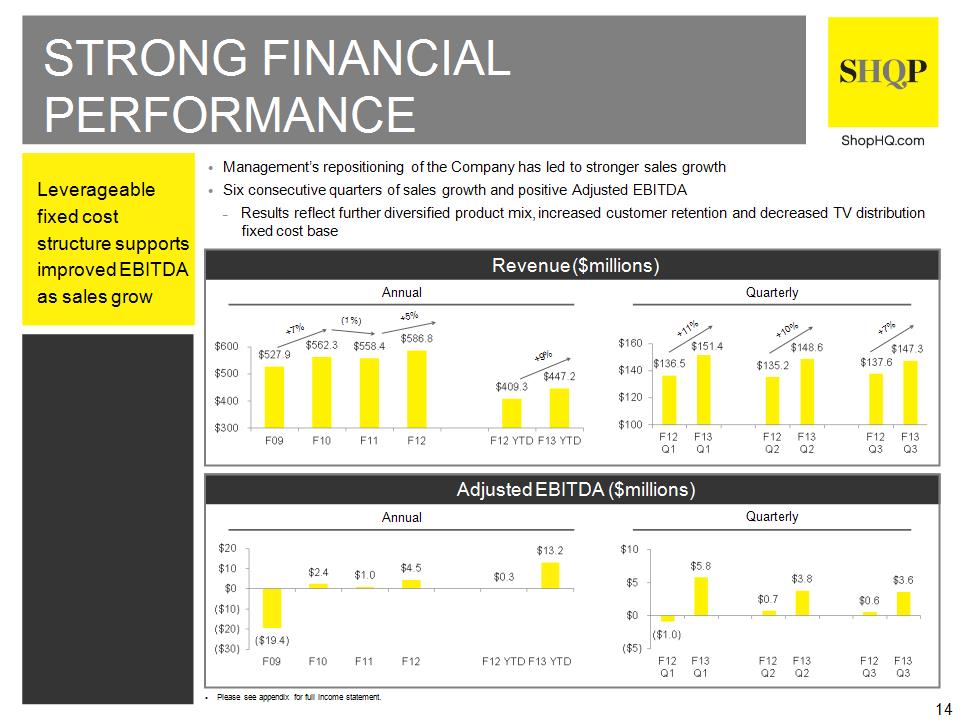
* Leverageable fixed cost structure supports improved EBITDA as sales grow Management’s repositioning of the Company has led to stronger sales growth Six consecutive quarters of sales growth and positive Adjusted EBITDA Results reflect further diversified product mix, increased customer retention and decreased TV distribution fixed cost base STRONG FINANCIAL PERFORMANCE Please see appendix for full income statement. Revenue ($millions) Adjusted EBITDA ($millions) Annual Quarterly Annual Quarterly +10% +7% (1%) +5% +11% +7% +9%

* Internet / mobile sales as a percentage of total revenue is steadily growing Customers are able to conveniently watch the broadcast, browse, purchase and share products Experience inspires shopping and is consistent across all channels Launched new iPad shopping app in Q3; Android versions of iPad apps to be deployed Q4 2013 WATCH & SHOP ANYTIME, ANYWHERE Mobile & Tablet Options Mobile Website Text Alerts Watches iPad App ShopHQ iPad App Android App iPhone App Internet / Mobile Sales as a % of Total Revenue ShopHQ’s mobile offerings allow customers to shop and buy anytime, anywhere

Focused on delivering long-term sustainable growth * Scalable multichannel retail platform with highly leverageable fixed cost base Improved channel positioning and adjacencies in strategic markets through the addition of second channels and lower channel positions Increased investment in emerging product categories including upscale, luxury, proprietary and national brands Broader product offering, lower average price point and improved channel positioning attracts new customers Increasing purchase frequency continues to drive higher retention rates Multichannel Engagement Internet ↔ TV Promotions Brand Power Live Streaming on Internet & Mobile Platforms Mobile, iPad / Tablet Apps Social Media Interactive Webcasts Contests & Promotions Expand and Optimize TV Distribution Platform Broaden & Diversify Product Offering Grow Customer Base, Purchase Frequency and Retention Be A Watch & Shop Anytime, Anywhere Experience GROWTH OPPORTUNITIES

DOCUMENTS TO FOLLOW: Summary P&L Summary Balance Sheet EBITDA Reconciliation Summary Key Operating Results Cash Flow Investors are advised to review carefully the risk factors contained in our most recently filed annual report on Form 10-K filed for our year ended February 2, 2013. APPENDIX *

SUMMARY P&L *

SUMMARY BALANCE SHEET *

SUMMARY ADJUSTED EBITDA RECONCILIATION a) EBITDA as defined for this statistical presentation represents net income (loss) from continuing operations for the respective periods excluding depreciation and amortization expense, interest income (expense) and income taxes. The Company defines Adjusted EBITDA as EBITDA excluding debt extinguishment; non-operating gains (losses); non-cash impairment charges and write-downs; activist shareholder response costs; and non-cash share-based compensation expense. Management has included the term EBITDA, as adjusted, in its EBITDA reconciliation in order to adequately assess the operating performance of the Company's television and Internet businesses and in order to maintain comparability to its analyst's coverage and financial guidance. Management believes that EBITDA, as adjusted, allows investors to make a more meaningful comparison between our business operating results over different periods of time with those of other similar small cap, higher growth companies. In addition, management uses EBITDA, as adjusted, as a metric measure to evaluate operating performance under its management and executive incentive compensation programs. EBITDA, as adjusted, should not be construed as an alternative to operating income (loss) or to cash flows from operating activities as determined in accordance with GAAP and should not be construed as a measure of liquidity. EBITDA, as adjusted, may not be comparable to similarly entitled measures reported by other companies. *

* SUMMARY KEY OPERATING METRICS
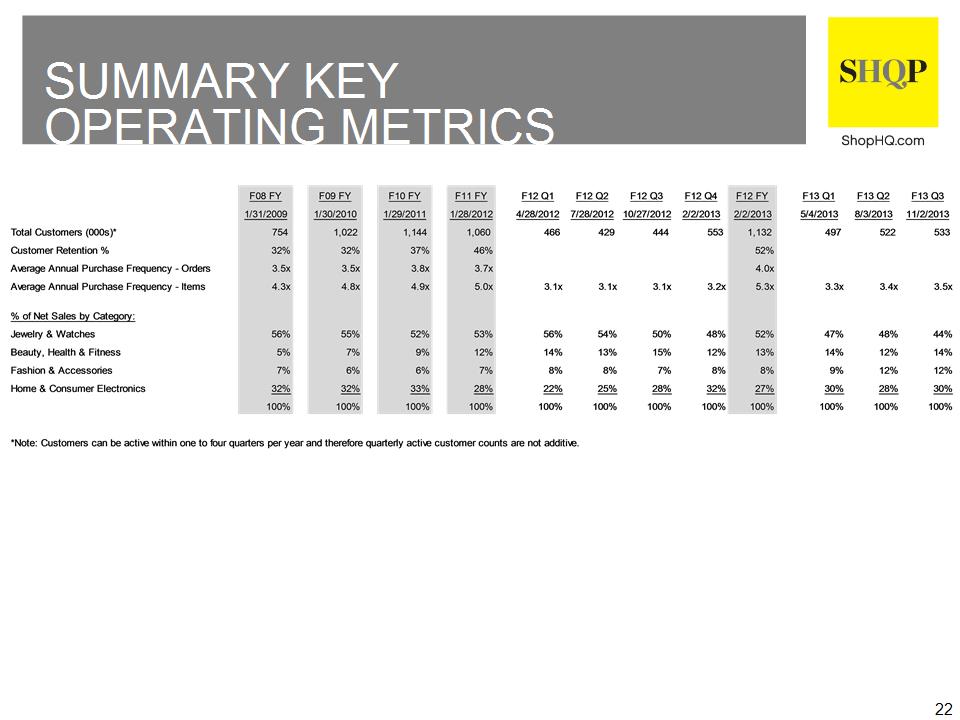
* SUMMARY KEY OPERATING METRICS

CASH FLOW *