Attached files
| file | filename |
|---|---|
| 8-K - FORM 8-K - ASPEN INSURANCE HOLDINGS LTD | d631261d8k.htm |
Exhibit 99.1

| Aspen Insurance Holdings Limited INVESTOR PRESENTATION THIRD QUARTER 2013 |

| SAFE HARBOR DISCLOSURE This slide presentation is for information purposes only. It should be read in conjunction with our financial supplement posted on our website on the Investor Relations page and with other documents filed or to be filed shortly by Aspen Insurance Holdings Limited (the "Company" or "Aspen") with the U.S. Securities and Exchange Commission. Non-GAAP Financial Measures: In presenting Aspen's results, management has included and discussed certain "non-GAAP financial measures" as such term is defined in Regulation G. Management believes that these non-GAAP financial measures, which may be defined differently by other companies, better explain Aspen's results of operations in a manner that allows for a more complete understanding of the underlying trends in Aspen's business. However, these measures should not be viewed as a substitute for those determined in accordance with GAAP. The reconciliation of such non-GAAP financial measures to their respective most directly comparable GAAP financial measures in accordance with Regulation G is included herein or in the financial supplement, as applicable, which can be obtained from the Investor Relations section of Aspen's website at www.aspen.co. Application of the Safe Harbor of the Private Securities Litigation Reform Act of 1995: This presentation contains written or oral "forward-looking statements" within the meaning of the U.S. federal securities laws. These statements are made pursuant to the safe harbor provisions of the Private Securities Litigation Reform Act of 1995. Forward-looking statements include all statements that do not relate solely to historical or current facts, and can be identified by the use of words such as "expect," "intend," "plan," "believe," "do not believe," "aim," "project," "anticipate," "seek," "will," "likely," "estimate," "may," "continue," "guidance," and similar expressions of a future or forward-looking nature. All forward-looking statements address matters that involve risks and uncertainties. Accordingly, there are or will be important factors that could cause actual results to differ materially from those indicated in these statements. Aspen believes these factors include, but are not limited to: the possibility of greater frequency or severity of claims and loss activity, including as a result of natural or man-made (including economic and political risks) catastrophic or material loss events, than our underwriting, reserving, reinsurance purchasing or investment practices have anticipated; the reliability of, and changes in assumptions to, natural and man-made catastrophe pricing, accumulation and estimated loss models; decreased demand for our insurance or reinsurance products and cyclical changes in the insurance and reinsurance sectors; changes in insurance and reinsurance market conditions; increased competition on the basis of pricing, capacity, coverage terms, new capital, binding authorities to brokers or other factors and the related demand and supply dynamics as contracts come up for renewal; cost or quality of reinsurance or retrocessional coverage; changes in general economic conditions, including inflation, foreign currency exchange rates, interest rates and other factors that could affect our financial results; the risk of a material decline in the value or liquidity of all or parts of our investment portfolio; evolving issues with respect to interpretation of coverage after major loss events and any intervening legislative or governmental action; the effectiveness of our risk management loss limitation methods; changes in the total industry losses, or our share of total industry losses, resulting from past events and, with respect to such events, our reliance on loss reports received from cedants and loss adjustors, our reliance on industry loss estimates and those generated by modeling techniques, changes in rulings on flood damage or other exclusions as a result of prevailing lawsuits and case law; the impact of one or more large losses from events other than natural catastrophes or by an unexpected accumulation of attritional losses; the impact of acts of terrorism and acts of war and related legislation; any changes in our reinsurers' credit quality and the amount and timing of reinsurance recoverables; the continuing and uncertain impact of the current depressed lower growth economic environment in many of the countries in which we operate; the level of inflation in repair costs due to limited availability of labor and materials after catastrophes; a decline in our operating subsidiaries' ratings with Standard & Poor's Rating Services ("S&P"), A.M. Best Company, Inc. ("A.M. Best") or Moody's Investors Service ("Moody's"); the failure of our reinsurers, policyholders, brokers or other intermediaries to honor their payment obligations; our ability to execute our business plan to enter new markets, introduce new products and develop new distribution channels, including their integration into our existing operations; our reliance on the assessment and pricing of individual risks by third parties; our dependence on a few brokers for a large portion of our revenues; the persistence of heightened financial risks, including excess sovereign debt, the banking system and the Eurozone debt crisis; our ability to successfully implement steps to further optimize the business portfolio, ensure capital efficiency and enhance investment returns; changes in our ability to exercise capital management initiatives (including our share repurchase program) or to arrange banking facilities as a result of prevailing market changes or changes in our financial position; changes in government regulations or tax laws in jurisdictions where we conduct business; Aspen or Aspen Bermuda Limited becoming subject to income taxes in the United States or the United Kingdom; loss of one or more of our senior underwriters or key personnel; our reliance on information technology and third party service providers for our operations and systems; and increased counterparty risk due to the credit impairment of financial institutions. For a more detailed description of these uncertainties and other factors, please see the "Risk Factors" section in Aspen's Annual Report on Form 10-K as filed with the U.S. Securities and Exchange Commission on February 26, 2013. Aspen undertakes no obligation to publicly update or revise any forward-looking statements, whether as a result of new information, future events or otherwise. Readers are cautioned not to place undue reliance on these forward-looking statements, which speak only as of the dates on which they are made. The guidance in this presentation relating to 10% Operating ROE in 2014 is made as at October 30, 2013. Such guidance assumes a pre-tax catastrophe load of $190 million per annum and normal loss experience given the current interest rate environment. Aspen has identified actions in each of its three operating return on equity levers - optimization of the business portfolio, capital efficiency and enhancing investment returns - to seek to achieve a 10% operating ROE in 2014. These forward looking statements are subject to risks and uncertainties, as discussed above, which could cause actual results to differ materially from these statements. In addition, any estimates relating to loss events involve the exercise of considerable judgment and reflect a combination of ground-up evaluations, information available to date from brokers and cedants, market intelligence, initial tentative loss reports and other sources. The actuarial range of reserves and management's best estimate represents a distribution from our internal capital model for reserving risk based on our then current state of knowledge and explicit and implicit assumptions relating to the incurred pattern of claims, the expected ultimate settlement amount, inflation and dependencies between lines of business. Due to the complexity of factors contributing to the losses and the preliminary nature of the information used to prepare these estimates, there can be no assurance that Aspen's ultimate losses will remain within the stated amounts. AHL: NYSE 2 |
| CONTENTS Aspen Overview: Who We Are Diversified Business Mix Financial Highlights: Third Quarter 2013 and YTD September 30, 2013 Underwriting Expertise Strong Historical Performance Creating Shareholder Value The Aspen Approach Building a Specialty Niche Business in the U.S. Proactive Management of Capital Delivering Strong Investment Returns with High Quality Portfolio Conclusion: Focused on Shareholder Value Appendix AHL: NYSE 3 |

| AHL: NYSE ASPEN OVERVIEW: WHO WE ARE Bermuda-domiciled Specialty Insurer and Reinsurer $2.6 billion gross written premiums for the last twelve months through September 30, 2013 Underwriting focused company with industry-leading underwriting expertise Strong balance sheet with ratings of A / Stable (S&P), A2 / Stable (Moody's) and A / Stable (A.M. Best) for its operating subsidiaries 4 (1) See Aspen's quarterly financial supplement for a reconciliation of operating income to net income, average equity to closing shareholders' equity, diluted book value per share to basic book value per share in the Investor Relations section of Aspen's website at www.aspen.co. Unless otherwise noted, figures are for the twelve months ended September 30, 2013 GROSS WRITTEN PREMIUMS BY SEGMENT LAST TWELVE MONTHS THROUGH SEPTEMBER 30, 2013 GROWTH IN DILUTED BOOK VALUE PER SHARE(1) AND CUMULATIVE DIVIDENDS (CHART) 10 Year CAGR: 10.8% |

| DIVERSIFIED BUSINESS MIX: REINSURANCE ESTABLISHED LEADER, POSITIONED FOR CONTINUED PROFITABLE GROWTH AHL: NYSE 5 (1) Gross written premium for the last twelve months ended September 30, 2013 SPECIALTY REINSURANCE: Hired Michael Dicker as global head of agriculture to work with our underwriters globally and provide strategic direction for this line CASUALTY REINSURANCE: Hired Jamie Lewis as head of Casualty Reinsurance London Achieved average rate increase of 1% through the first nine months of 2013 in a pressured environment. OTHER PROP REINSURANCE: Formed Rock Re in October 2013 to focus on North American brokered property facultative market Hired Tom Luning as head of US Regional Business development PROPERTY CAT REINSURANCE: Diversified book both in geography and peril Extensive in-house, bespoke catastrophe modeling expertise (CHART) Gain access to attractive and well-rated risks through: Local market strategy enables close proximity to clients through hubs in Zurich, Singapore and Miami (serving Latin America) Close proximity to the client enables a high level of service, local market knowledge and more frequent, detailed oversight Offer clients multiple products and solutions which creates a multifaceted relationship Aspen Capital Markets, an asset management business that leverages Aspen Re's existing underwriting and technical expertise into managing reinsurance risks on behalf of third-party investors STRATEGIC POSITIONING GWP BY BUSINESS LINE (1) |

| (CHART) DIVERSIFIED BUSINESS MIX: INSURANCE ESTABLISHED LEADER, POSITIONED FOR CONTINUED PROFITABLE GROWTH AHL: NYSE 6 (1) Gross written premium for the last twelve months ended September 30, 2013 CASUALTY INSURANCE: Achieved an average rate increase of 5% through the first nine months of 2013 Changing market dynamic in the U.S. due to recent downgrades of competitors is creating opportunities PROGRAMS: Gaining traction in the U.S. Targets premier program business on a direct basis or through a reinsurance intermediary FINANCIAL AND PROFESSIONAL LINES: Achieved an average rate increase of 2% through the first nine months of 2013 Notable rate improvements in Financial Institutions and U.S. Professional Indemnity MARINE, ENERGY AND TRANSPORTATION: Hired Tony Carroll in the U.S. to focus on a variety of onshore energy and construction classes and Christopher Wildee in London to enhance capabilities in fast growing energy property physical damage market Achieved an average rate increase of 9% through the first nine months of 2013 Targeting areas which have the superior returns which come from a true understanding of complex risk Focused on the U.S. teams achieving scale while growing the International platform in profitable, niche opportunities STRATEGIC POSITIONING GWP BY BUSINESS LINE (1) PROPERTY INSURANCE: Continue to achieve rate increases in the U.S. following a year with large industry losses |

| FINANCIAL HIGHLIGHTS: THIRD quarter 2013 7 7 ($ in millions, except per share data and percentages) AHL: NYSE (1) See Aspen's quarterly financial supplement for a reconciliation of operating income to net income, average equity to closing shareholders' equity, and diluted book value per share to basic book value per share in the Investor Relations section of Aspen's website at www.aspen.co. |

| FINANCIAL HIGHLIGHTS: YTD September 30, 2013 8 8 ($ in millions, except per share data and percentages) AHL: NYSE (1) See Aspen's quarterly financial supplement for a reconciliation of operating income to net income, average equity to closing shareholders' equity, and diluted book value per share to basic book value per share in the Investor Relations section of Aspen's website at www.aspen.co. |

| underwriting EXPERTISE: REFLECTED IN superior ACCIDENT YEAR LOSS RATIOS AHL: NYSE 9 ACCIDENT YEAR LOSS RATIO(1) (CHART) (1) Reported loss ratios less the impact from net prior year reserve releases (2) Peers: AWH, ACGL, AXS, ENH, MRH, PRE, RE, RNR, PTP, VR and XL Source: company public filings 5-Year Average 2008-2012 Aspen : 69.5% Peers (2): 72.5% |

| AHL: NYSE CREATING SHAREHOLDER VALUE: THE ASPEN APPROACH Optimization of business portfolio Ceded reinsurance program: estimated $25 million benefit to net income in 2014 (1) U.S. business making progress towards achieving scale in 2015 Controlled reduction of wind and quake volatility in U.S. property insurance; release of $80 million of capital through September 30, 2013 Capital efficiency $500 million share repurchase authorization, with repurchases of $296 million through October 30, 2013 Plan to continue to opportunistically repurchase ordinary shares(2) Longer term, we expect to use comprehensive earnings mainly to repurchase ordinary shares after dividends, amount needed for organic growth and ensuring our capital levels satisfy internal and regulatory requirements Enhancing investment return Constantly evaluating ways to increase return on investments within our risk tolerance Invested a further $200 million in equities in 2013 Tactically adding to positions in BB Bank Loans and High Yield Bonds; $105 million at 3Q 2013 Invested $200 million in investment grade Emerging Market Debt in 3Q 2013 10 Three Levers to Higher ROE Expect to achieve 10% operating ROE in 2014 (2) As at October 31, 2013. See "Safe Harbor Disclosure" slide 2 As at October 30, 2013. See "Safe Harbor Disclosure" slide 2 |

| YTD SEPTEMBER 30, 2013 U.S. INSURANCE TEAMS GWP: $561 MILLION(2) CREATING SHAREHOLDER VALUE: BUILDING A SPECIALTY NICHE BUSINESS in the u.s. AHL: NYSE 11 U.S. INSURANCE STRATEGY (1): Specialty U.S. insurance underwriter Making very good progress in building out the platform Three consecutive quarters with a combined ratio of less than 100% Currently accounts for 35% of segment net earned premiums (NEP) and would expect this percentage to increase over time Targeting to achieve $550 million of NEP for the year 2015 At the level of $550 million NEP, the platform will have a "normalized expense ratio" of approximately 16% Focusing on scale and increased profitability As at October 31, 2013. See "Safe Harbor Disclosure" slide 2 Gross written premium for the last twelve months through September 30, 2013 (CHART) (CHART) |

| CREATING SHAREHOLDER VALUE: PROACTIVE MANAGEMENT OF CAPITAL Maintain strong balance sheet of our operating subsidiaries with capital at levels that satisfy all regulatory and rating agency requirements as well as internal metrics Ratings of A/Stable (S&P), A2/Stable (Moody's) and A/Stable (A.M. Best) Competitive dividend yield; quarterly dividend increased 6% in 1Q 2013 Return capital to shareholders through share repurchases In 1Q 2013, announced new $500 million share repurchase authorization, including $150 million Accelerated Share Repurchase Expect to repurchase at least $300 million in 2013 (over 10% of current market capitalization), assuming normal loss experience, using: Capital released from reduction of wind and quake exposure in U.S. property insurance $296 million share repurchases through October 30, 2013 Longer term, we expect to use comprehensive earnings mainly to repurchase ordinary shares after dividends, amount needed for organic growth and ensuring our capital levels satisfy internal and regulatory requirements AHL: NYSE 12 CAPITAL MANAGEMENT STRATEGY |
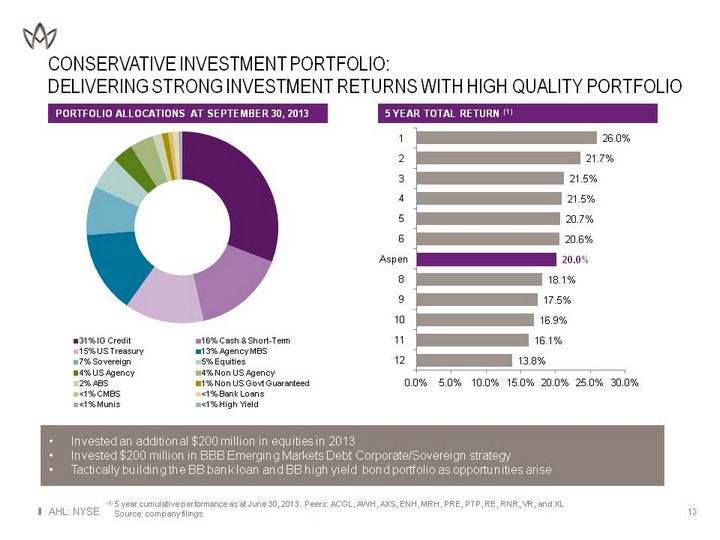
| CONSERVATIVE INVESTMENT PORTFOLIO: DELIVERING STRONG INVESTMENT RETURNS WITH HIGH QUALITY PORTFOLIO AHL: NYSE 13 PORTFOLIO ALLOCATIONS AT SEPTEMBER 30, 2013 5 YEAR TOTAL RETURN (1) (1) 5 year cumulative performance as at June 30, 2013. Peers: ACGL, AWH, AXS, ENH, MRH, PRE, PTP, RE, RNR, VR, and XL Source: company filings (CHART) (CHART) $7.9 BILLION AS AT 06/30/13 Invested an additional $200 million in equities in 2013 Invested $200 million in BBB Emerging Markets Debt Corporate/Sovereign strategy Tactically building the BB bank loan and BB high yield bond portfolio as opportunities arise (CHART) |

| CONCLUSION: FOCUSED ON SHAREHOLDER VALUE Deep underwriting expertise and understanding of client needs and risks Executing plan to drive higher ROE and BVPS growth Optimizing business portfolio to free up capital and improve risk-adjusted returns Improving capital efficiency Enhancing investment return within acceptable risk parameters Pursuing selective, profitable growth in exposures we know and understand, subject to market conditions Diversified platform allows us to take advantage of areas where rates are improving Significant portion of growth expected to be in diversifying lines Longer term, we expect to use comprehensive earnings mainly to repurchase ordinary shares after dividends, amount needed for organic growth and ensuring our capital levels satisfy internal and regulatory requirements AHL: NYSE 14 Expect to achieve 10% Operating ROE in 2014 (1) (1) As at October 30, 2013. See "Safe Harbor Disclosure" slide 2 |

| APPENDIX |

| UNDERWRITING EXPERTISE: ASPEN'S NATURAL CATASTROPHE EXPOSURES IN MAJOR PERIL ZONES 100 YEAR RETURN PERIOD AS % OF TOTAL SHAREHOLDERS' EQUITY 250 YEAR RETURN PERIOD AS % OF TOTAL SHAREHOLDERS' EQUITY 1 in 100 year tolerance: 17.5% of total shareholders' equity 1 in 250 year tolerance: 25.0% of total shareholders' equity AHL: NYSE 16 Based on shareholders' equity of $3,271.1 million as at September 30, 2013. The estimates reflect Aspen's own view of the modeled maximum losses ("PML's") at the return periods shown which include input from various third party vendor models and our own proprietary adjustments to these models. Catastrophe loss experience may materially differ from the modeled PML's due to limitations in one or more of the models or uncertainties in the application of policy terms and limits. |

| Aspen Insurance Holdings Limited INVESTOR PRESENTATION THIRD QUARTER 2013 |