Attached files
| file | filename |
|---|---|
| 8-K - 8-K - STIFEL FINANCIAL CORP | d630042d8k.htm |
 November 2013
Stifel Investor Presentation
Exhibit 99.1 |
 Disclaimer
Forward-Looking
Statements
This
presentation
may
contain
“forward-looking
statements”
within
the
meaning
of
the
Private
Securities
Litigation
Reform
Act
of
1995
that
involve
significant
risks,
assumptions,
and
uncertainties,
including
statements
relating
to
the
market
opportunity
and
future
business
prospects
of
Stifel
Financial
Corp.,
as
well
as
Stifel,
Nicolaus
&
Company,
Incorporated
and
its
subsidiaries
(collectively,
“SF”
or
the
“Company”).
These
statements
can
be
identified
by
the
use
of
the
words
“may,”
“will,”
“should,”
“could,”
“would,”
“plan,”
“potential,”
“estimate,”
“project,”
“believe,”
“intend,”
“anticipate,”
“expect,”
and
similar
expressions.
In
particular,
these
statements
may
refer
to
our
goals,
intentions,
and
expectations,
our
business
plans
and
growth
strategies,
our
ability
to
integrate
and
manage
our
acquired
businesses,
estimates
of
our
risks
and
future
costs
and
benefits,
and
forecasted
demographic
and
economic
trends
relating
to
our
industry.
You
should
not
place
undue
reliance
on
any
forward-looking
statements,
which
speak
only
as
of
the
date
they
were
made.
We
will
not
update
these
forward-looking
statements,
even
though
our
situation
may
change
in
the
future,
unless
we
are
obligated
to
do
so
under
federal
securities
laws.
Actual
results
may
differ
materially
and
reported
results
should
not
be
considered
as
an
indication
of
future
performance.
Factors
that
could
cause
actual
results
to
differ
are
included
in
the
Company’s
annual
and
quarterly
reports
and
from
time
to
time
in
other
reports
filed
by
the
Company
with
the
Securities
and
Exchange
Commission
and
include,
among
other
things,
changes
in
general
economic
and
business
conditions,
actions
of
competitors,
regulatory
and
legal
actions,
changes
in
legislation,
and
technology
changes.
Note
Regarding
the
Use
of
Non-GAAP
Financial
Measures
The
Company
utilized
non-GAAP
calculations
of
presented
net
revenues,
compensation
and
benefits,
non-compensation
operating
expenses,
income
before
income
taxes,
provision
for
income
taxes,
net
income,
compensation
and
non-compensation
operating
expense
ratios,
pre-tax
margin
and
diluted
earnings
per
share
as
an
additional
measure
to
aid
in
understanding
and
analyzing
the
Company’s
financial
results.
Specifically,
the
Company
believes
that
the
non-GAAP
measures
provide
useful
information
by
excluding
certain
items
that
may
not
be
indicative
of
the
Company’s
core
operating
results
and
business
outlook.
The
Company
believes
that
these
non-GAAP
measures
will
allow
for
a
better
evaluation
of
the
operating
performance
of
the
business
and
facilitate
a
meaningful
comparison
of
the
Company’s
results
in
the
current
period
to
those
in
prior
periods
and
future
periods.
Reference
to
these
non-GAAP
measures
should
not
be
considered
as
a
substitute
for
results
that
are
presented
in
a
manner
consistent
with
GAAP.
These
non-GAAP
measures
are
provided
to
enhance
the
overall
understanding
of
the
Company’s
current
financial
performance. |
 Market Overview |
 Domestic Equity
Flows Equity Risk Premium
4
Market Overview |
 Stifel Overview |
 Stifel Overview
Global Wealth Management
Institutional Group
Independent Research
Institutional Equity & Fixed Income
Brokerage
Equity & Fixed Income Capital Raising
M&A Advisory / Restructuring
Private Client
Stifel Bank & Trust
Customer Financing
Asset Management
(1) As of 11/11/13. (2) Insider ownership percentage includes all fully
diluted shares, units outstanding, options outstanding, as well as shares owned by Stifel’s former Chairman as of 11/13/13.
Stifel Financial (NYSE: SF)
National presence with over 2,000
Financial Advisors
$153 billion in total client assets
Largest U.S. equity research platform
Broad product portfolio & industry
expertise
_________________________________________________________
|
 7
Stifel’s Market Opportunity
Stifel’s Differentiated Value Proposition: Growth, Scale, and
Stability Bulge Bracket
Middle Market
Firm focus
Good research
Growth investor access
Issues
Lack of focus
Banker turnover
Lack of commitment
Research indifference
Lack of growth investors
Issues
Financial / firm stability
Trading support
Few with retail
Size / scale
Firm focus
Stability (financial &
personnel)
Large distribution
Growth investor access
Trading
Outstanding research
Retail
Size / scale
Large distribution
Trading
Retail |
 Strategy: Building the Premier Investment Bank
8
Unburdened by capital constraints
Low leverage business model and conservative risk management
Built the Company through 12 acquisitions since 2005; prudently evaluate
all opportunities Capitalize on headwinds across the industry
Select growth of high-quality talent
Drive revenue synergies by leveraging the global wealth and institutional
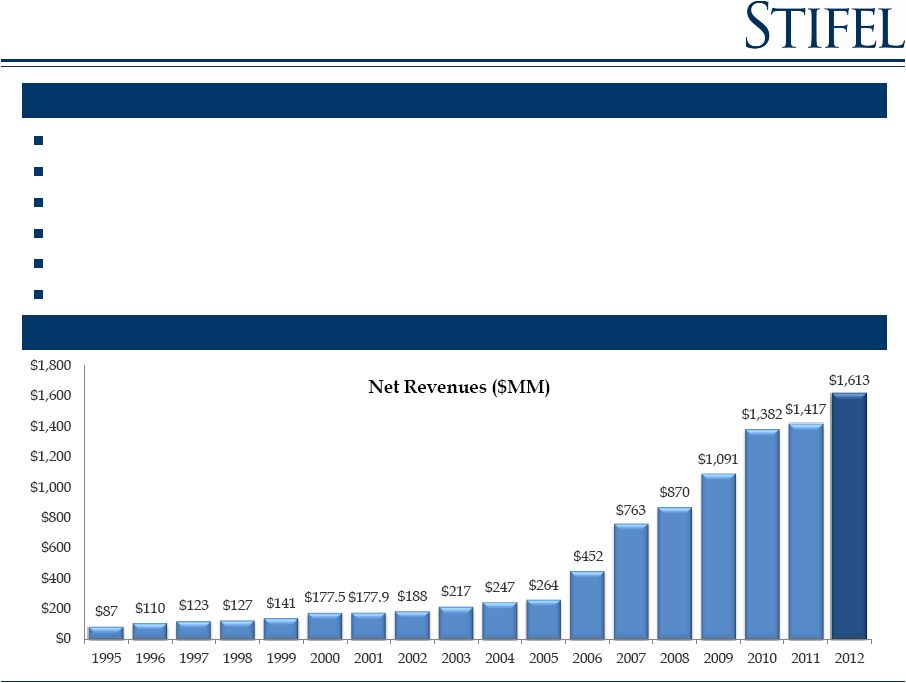
businesses 17
Consecutive Year of Record Net Revenues
Position Stifel to Take Advantage of Opportunities
th |
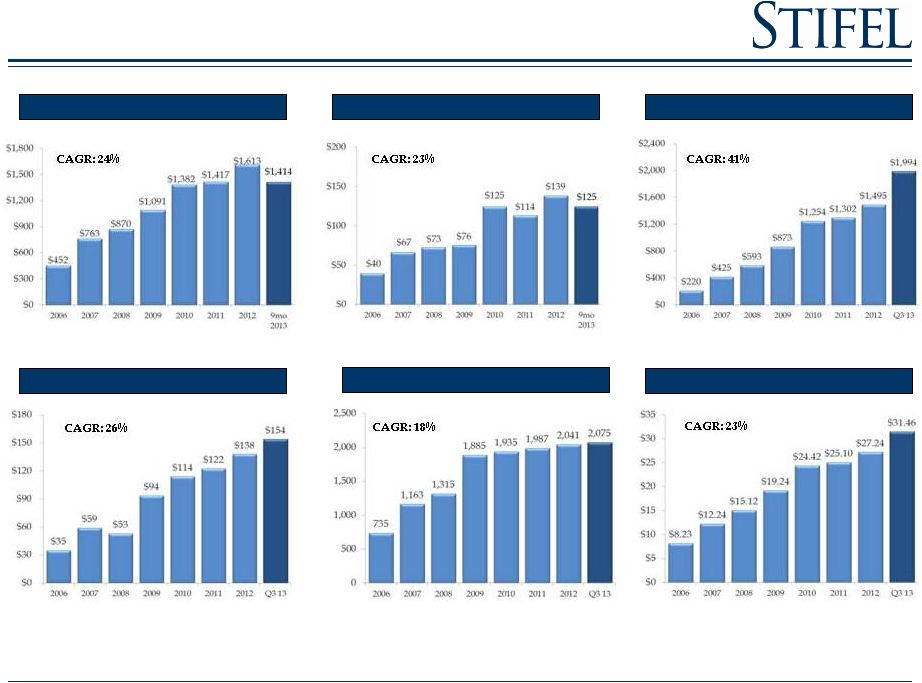 (1)
CAGR reflects years 2006 to 2012.
(2)
Client
assets
-
Includes
FDIC-insured
products
as
of
9/30
for
years
2008-2013
(3)
Includes Independent Contractors.
(4)
Book Value Per Share adjusted for April 2011 three-for-two stock
split (2006-2010). A Growth Story…
9
Net Revenues ($MM)
(1)
Core Net Income ($MM)
(1)
Total Equity ($MM)
Total Client Assets ($BN)
(2)
Book Value Per Share
(4)
Financial Advisors
(3)
_________________________________________________________
|
 10
Building Scale…
Growth Focused
Investment Banking
Research, Sales and Trading
Achieved cost efficiencies
July 2010
Private Client
Revenue production has exceeded
expectations
October 2009
Significant enhancement to our
Capital Markets business
Achieved cost savings objectives
December 2005
Bank holding company
Financial holding company
Grown assets from ~ $100M to $3.2B
April 2007
Private Client
Public Finance
Seamless & efficient integration
December 2008
Fixed Income IB
Fixed Income Sales and Trading
Private Client
Seamless & efficient integration
October 2011
FIG Investment Banking
FIG Sales and Trading
FIG Research
February 2013
56 UBS Branches
Private Client
Capital Markets
Achieved cost savings objectives
February 2007
Each merger has been accretive to Stifel
Retention remains high
Restructuring advisory
December 2012
Knight
Fixed Income
Fixed Income Sales and
Trading –
U.S. & Europe
Fixed Income Research
July 2013
Asset Management
Announced October 2013
Clean portfolio of 1-4 family
residential mortgages
October 2013 |
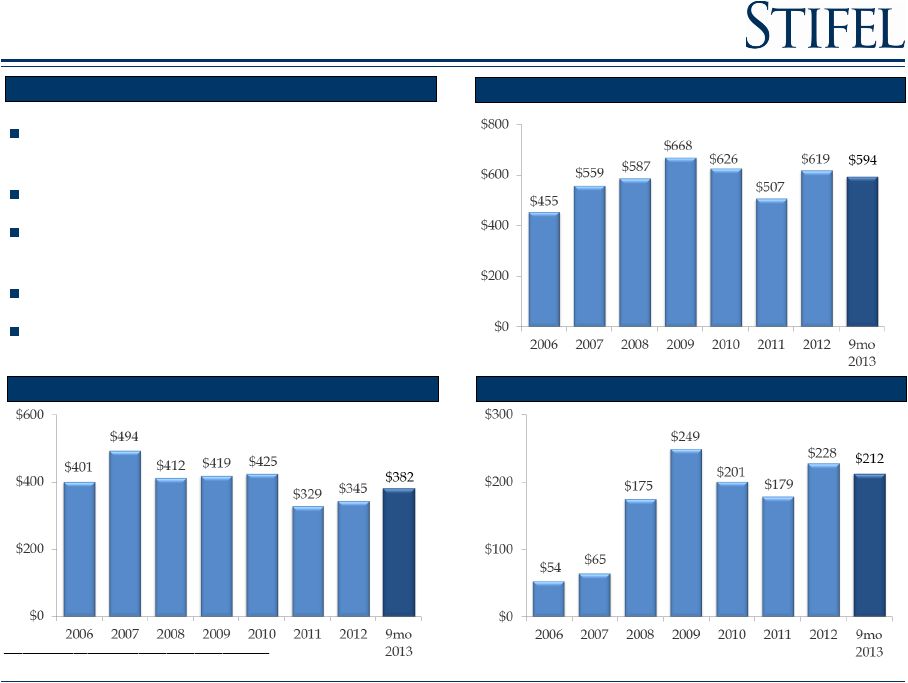
 Stability Achieved Through A Balanced Business Model
11
Net Revenues
Balanced business model facilitates growth during volatile markets
Stable GWM business is augmented by profitable and growing Institutional
Group Proven ability to grow all businesses
Operating Contribution
9 mo 2012
9 mo 2013
9 mo 2012
9 mo 2013
Note:
Net
revenues
and
operating
contribution
excludes
the
Other
segment.
11
_________________________________________________________
|
 12
Leverage Ratio
Total Assets ($ in Billions)
Book Value Per Share
(1)
Total Capitalization ($ in Billions)
(1)
Per share information adjusted for April 2011 three-for-two stock
split Strong Balance Sheet Facilitates Growth
As September 30, 2013 |
 13
Top Performing Stock
Cumulative Price Appreciation As of November 12, 2013
Since 12/31/12
Since 12/31/07
Since 12/31/00
Morgan Stanley
55.65%
Stifel Financial Corp.
82.97%
Stifel Financial Corp.
1027.47%
Stifel Financial Corp.
33.72%
Raymond James Financial
40.63%
Raymond James Financial
196.32%
Goldman Sachs Group
27.70%
S&P 500 Index
20.39%
Goldman Sachs Group
52.32%
S&P 500 Index
23.94%
JMP Group
-24.17%
S&P 500 Index
33.89%
Raymond James Financial
19.21%
Goldman Sachs Group
-24.25%
Oppenheimer
-17.84%
Oppenheimer
14.65%
Piper Jaffray
-24.44%
Morgan Stanley
-62.45%
SWS Group
10.59%
Morgan Stanley
-43.97%
SWS Group
-62.70%
Piper Jaffray
8.93%
Oppenheimer
-53.25%
JMP Group
NM
JMP Group
5.93%
SWS Group
-53.83%
Piper Jaffray
NM |
 Attract and retain high-quality talent
Continue to expand our private client footprint in the U.S.
Continue to expand fixed income businesses
Continue to expand investment banking capabilities
Focus on quality asset generation within Stifel Bank
Expand traditional asset management capabilities
Approach acquisition opportunities with discipline
Opportunities Drive our Growth
14
Initiatives |
 Recent Merger Updates |
 16
We
announced
KBW
transaction
November
5,
2012
and
closed
February
15,
2013.
Integration
has
gone
very
well.
YTD
advisory
success:
#1
by
number
of
bank
mergers
(1)
#1
by
number
of
Insurance
mergers
(2)
#2
by
number
of
FIG
mergers
(1)
#3
by
bank
deal
value
(1)
Seeing
increased
market
share
in
common
equity
FIG
deals
and
equity
trading
volumes.
Achieved
superior
recognition
in
independent
research,
sales
and
trading
rankings.
Successful
conference
pattern
with
a
number
attracting
record
levels
of
attendees
Miller
Buckfire
transaction
was
completed
December
31,
2012.
Transaction
has
already
resulted
in
nine
completed
or
ongoing
transactions.
A
number
of
these
were
won
by
leveraging/including
other
capabilities
across
Stifel.
Won
assignments
on
a
number
of
high
profile
advisory
engagements
including
the
City
of
Detroit,
Lehman
Brothers,
UniTek,
Furniture
Brands,
Excel
Maritime,
and
OnCor.
Fixed Income
Knight
Fixed
Income
transaction
closed
on
July
1,
2013.
Welcomed
approximately
90
professionals
to
the
firm.
3Q
revenues
in
line
with
our
expectations.
Sales
and
trading
integration
has
gone
very
well
and
complimenting
existing
Stifel
capabilities.
Investment
grade,
high
yield,
and
loan
trading
focus.
Primarily
located
in
London,
Greenwich
and
New
York.
M&A Statistics Source: SNL Financial
(1) Includes transactions announced since 1/1/2013; Data as of
10/21/2013 (2) Includes transactions announced since 1/1/2005; Data
as of 10/29/2013 Recent Merger Updates
_________________________________________________________
|
 17
Previously announced acquisition of Acacia Federal Savings Bank
($525mm in assets) by Stifel Bank & Trust closed on October 31, 2013
at an attractive discount to tangible book value.
All non-performing loans were excluded from transaction
Expect significant synergies in connection with single branch closing in
1Q2014
Immediately accretive to Stifel Financial tangible book value/share.
Expected to add $10 million to core earnings for the next few
years. Entirely funded with Bank deposits
Consistent with asset generation strategy within the bank.
Announced acquisition of Ziegler Lotsoff Capital Management (ZLCM)
October 16
Chicago and Milwaukee based asset management company that currently
manages $4.3 billion in assets.
ZLCM management team brings additional experience and capabilities to
Stifel’s existing Asset Management efforts
Opportunity to bring other Stifel Asset Management capabilities under
one umbrella. Total AUM of combined entities will exceed $9
billion. Expected closing 11/30/2013
Recent Merger Updates
th |
 Global Wealth Management |
 Global Wealth Management
Provides Securities Brokerage Services and Stifel Bank Products
19
Grown
from
600+
financial
advisors
in
2005
to
over
2,000
(1)
financial
advisors
currently
Proven
organic
growth
and
acquirer
of
private
client
business
(56
UBS
branches,
Butler
Wick,
Ryan
Beck)
Retail
investors
are
generally
mid-
to
long-term
buyers
Goal
of
providing
price
stability
and
support
to
the
institutional
order
book
Strategy
of
recruiting
experienced
advisors
with
established
client
relationships
Expanding
U.S.
footprint
Net Revenues ($MM)
(2)
Overview
Operating Contribution ($MM)
(2)
(1)
Includes Independent Contractors.
(2)
CAGR reflects years 2006 to 2012.
_________________________________________________________
|
 (1)
Includes
Independent
Contractors.
(2)
Client
assets
include
FDIC-insured
products
as
of
9/30/13
for
years
2008-2013.
Global Wealth Management
20
Opportunity Through Growth
GWM Account Growth
GWM
Broker
Growth
(1)
GWM
Assets
Under
Management
Growth
($MM)
(2)
GWM Branch Growth
_________________________________________________________
|
 Global Wealth Management –
Stifel Bank & Trust
Offers banking products (securities based loans and
mortgage loans) within the GWM client base,
including establishing trust services
Built-in source of business
High net worth clients
Highly efficient due to lack of “brick and mortar”
deposit focused facilities
Overview
Strength of Brokerage Position
21
Acquired FirstService Bank, a St. Louis-based,
Missouri-chartered commercial bank, in April 2007
Stifel Financial became a bank holding company and
financial services holding company
Balance sheet growth with low-risk assets
Funded by Stifel Nicolaus client deposits
Maintain high levels of liquidity
Interest Earnings Assets
(1)
Investment Portfolio
Loan Portfolio (Gross)
Total: $4.0 Billion
Total: $3.0 Billion
(2)
Total: $1.1 Billion
(3)
Note: Data as of 9/30/13
(1) Average interest earning assets as of 9/30/13.
(2) MBS makes up less than 1% of Investment Portfolio (3) Construction and Land and Commercial Real Estate make up less than 1% of the loan portfolio
_________________________________________________________
|
 Institutional Group |
 (1) Based on 2012 U.S. trading volume per Bloomberg. (2)
Includes TWPG historical investment banking and brokerage revenues for years 2006 through September 30, 2010.
(3) 2012 includes realized and unrealized gains on the Company’s
investment in Knight Capital Group, Inc. of $39.0 million.
Institutional Group
23
Net Revenues ($MM)
(2)(3)
Equity Brokerage + Investment Banking
(2)
Fixed Income Brokerage + Investment Banking
Overview
Provides securities brokerage, trading, research,
underwriting and corporate advisory services
Largest providers of U.S. Equity Research
2
largest
Equity
trading
platform
in
the
U.S.
outside
of
the
Bulge
Bracket
(1)
Full Service Investment Bank
Comprehensive Fixed Income platform
nd |
 Largest provider of U.S. equity research
#1 in Overall, Mid and Small Cap Coverage
Largest provider of Financial Services coverage
Deep expertise across 12 major sectors
Ranked #2 in the FT/Starmine 2013 Survey
Largest U.S. Equity Research Platform
U.S. Equity Research Coverage
(1)
Coverage Balanced Across All Market Caps
(2)
Institutional Group –
Research
Stifel Research Highlights
24
(1)
Source: StarMine rankings as of 10/30/13. Does not include Closed End
Funds. (2) Small
Cap
includes
market
caps
less
than
$1
billion;
Mid
Cap
includes
market
caps
less
than
$5
billion.
Research
coverage
distribution
as
of
10/30/13.
Small Cap
29%
Mid Cap 35%
Large Cap
36%
_________________________________________________________
Rank
Firm
Overall
Mid Cap
Small Cap
1
Stifel/KBW
1,341
499
428
2
BofA Merrill Lynch
1,142
448
153
3
JPMorgan
1,115
423
162
4
Goldman Sachs
1,014
376
88
5
Raymond James
1,001
393
302
6
Wells Fargo Securities, Llc
988
394
161
7
Barclays
947
354
88
8
Credit Suisse
904
318
132
9
Citi
902
299
101
10
Deutsche Bank Securities
875
294
117
11
Jefferies & Co.
853
298
167
12
Morgan Stanley
844
286
82
13
S&P Capital Iq
833
234
33
14
RBC Capital Markets
788
298
112
15
UBS
737
245
67
16
Morningstar, Inc.
702
179
24
17
Robert W. Baird & Co., Inc.
676
260
156
18
Sidoti & Company LLC
650
216
426
19
BMO Capital Markets
592
211
80
20
Cowen And Company
571
179
156
21
William Blair & Company, L.L.C.
562
197
153
22
Piper Jaffray
522
185
173
23
Keybanc Capital Markets
510
248
105
24
Macquarie Research Equities
506
171
54
25
Oppenheimer & Co.
504
176
109 |
 Institutional Equity Sales
110 person sales force, commission based
Experts in small and mid cap growth and value
Team based sales model with 2-4 sales people per
account
Team leaders have an average of 15 years experience
Offices in all major institutional markets in North
America & Europe
Accounts range from large mutual funds to small
industry focused investors
Managed over 741 non-deal roadshow days in 2012
Extensive experience with traditional and overnight
corporate finance transactions
Equity Trading
53 sales traders located in
Baltimore, New York, Boston, Dallas, San
Francisco, Cleveland and London
24 position traders covering each major industry
8 specialized traders focused on: Option Trading,
Convertible and ETF Trading
Agency model –
no proprietary trading or prime
brokerage
Profitable model with advantages of scale
Institutional Group –
Equity Sales and Trading
Powerful Platform Spanning North America and Europe
25
Extensive Distribution Network
Agency model –
no proprietary trading or prime brokerage
Major liquidity provider to largest equity money management
complexes Multi-execution venues: high-touch, algorithms,
program trading and direct market access Dedicated convertible
sales, trading and research desk |
 Overview
Strong Fixed Income Capital Markets Capabilities
Institutional Group –
Fixed Income
Client Distribution
(1)(2)
Platform & Products
Focus on long-only money
managers and income
funds versus hedge funds
Consistency of execution
Identification of relative
value through security
selection
Agency/Gov't Securities
Money Markets
Mortgages & MBS
Reverse MBS
Asset-Backed Securities
Investment Grade Credit
High Yield & Distressed
Aircraft Finance & Credit
Solutions
Whole Loans
Municipals
Emerging Markets
Structured Products
Stifel Capital Advisors
Hybrid Securities
Dedicated Loan Trading Group
Capable UK Sales & Trading
platform (former Knight team)
(1)
Client
Distribution
is
for
1/1/12
–
10/31/13.
(2)
Other
category
includes:
Corporation,
Hedge
Fund,
Pension
Fund,
Trust
Company,
Foundation,
Endowment,
University
&
Non-Profit.
26
Comprehensive platform
69 traders with annual client trade volume
approaching $400 billion
33-person Fixed Income Research and Strategy
Group
Widespread distribution
More than 180 Institutional sales professionals
covering over 4,400 accounts
33 institutional fixed income offices nationwide
European offices in London and Zurich
_________________________________________________________
|
 Accomplished U.S. Equity Underwriting Franchise –
All Equity Transactions
Investment Banking
Bookrun Equity Deals Since 2010
All Managed Equity Deals Since 2010
27
Source:
Dealogic.
Rank
eligible
SEC
registered
IPOs
and
Follow-On
offerings
since
2010.
Includes
demutualizations.
As
of
9/30/13.
Overlapping
deals
between
Stifel
and
its
acquired
firms
have
been
removed.
Note: $ Volume represents full credit to underwriter for All Managed
Equity Deals and apportioned credit to bookrunner for Bookrun Equity Deals. Bold font indicates middle-market firms.
($ in billions)
# of
$
Rank
Firm
Deals
Volume
1
Bank of America Merrill Lynch
781
$469.7
2
JPMorgan
769
$455.5
3
Citi
725
$451.3
4
Morgan Stanley
688
$436.5
5
Barclays
631
$369.1
6
Wells Fargo Securities
629
$337.1
7
Deutsche Bank
623
$380.9
8
Credit Suisse
616
$374.5
9
Stifel / Keefe, Bruyette & Woods
595
$221.9
10
RBC Capital Markets
569
$264.3
11
Goldman Sachs
546
$378.1
12
UBS
517
$292.3
13
Raymond James
424
$208.7
14
Robert W Baird & Co
308
$77.2
15
Piper Jaffray & Co
300
$142.2
16
Jefferies LLC
282
$58.0
17
Oppenheimer & Co Inc
264
$67.2
18
JMP Securities LLC
259
$50.3
19
William Blair & Co LLC
209
$61.8
20
Cowen & Co LLC
205
$50.2
($ in billions)
# of
$
Rank
Firm
Deals
Volume
1
Bank of America Merrill Lynch
710
$86.4
2
JPMorgan
670
$89.1
3
Citi
626
$81.9
4
Morgan Stanley
624
$100.1
5
Barclays
512
$74.0
6
Credit Suisse
490
$63.3
7
Goldman Sachs
482
$82.8
8
Deutsche Bank
474
$54.1
9
Wells Fargo Securities
437
$34.5
10
UBS
349
$36.3
11
Jefferies LLC
227
$13.5
12
RBC Capital Markets
193
$14.4
13
Stifel / Keefe, Bruyette & Woods
187
$9.3
14
Raymond James
118
$6.5
15
Piper Jaffray & Co
101
$4.4
16
Roth Capital Partners
79
$1.5
17
Cowen & Co LLC
77
$2.4
18
Robert W Baird & Co
69
$3.2
19
Lazard Capital Markets
62
$1.8
20
Leerink Swann LLC
56
$2.0
_________________________________________________________
|
 Financial Results |
 29
(1)
Non-core
adjustments
consist
of
merger-related
revenues
and
expenses
associated
with
our
acquisitions
of
KBW,
the
Knight
Capital
Fixed
Income
business,
Miller
Buckfire
and
a
U.S.
tax
benefit.
(2)
Core (non-GAAP) results for the three months ended September 30, 2012
are the same as GAAP results. Stifel Financial Results
Three months ended September 30, 2013
_________________________________________________________
|
 30
Unusual Items
(1)
Included in compensation expense is a $5.0 million compensation accrual as
a result of the recognition of the U.S. tax benefit during the three months ended September 30, 2013.
(2)
Included
in
the
provision
for
income
taxes
is
a
U.S.
tax
benefit
arising
out
of
the
Company’s
investment
in
Stifel
Nicolaus
Canada,
Inc.
of
$58.2
million.
_________________________________________________________
Merger-Related Expenses, Discontinued Ops, & U.S. Tax Benefit
|
 31
Discontinued Operations |
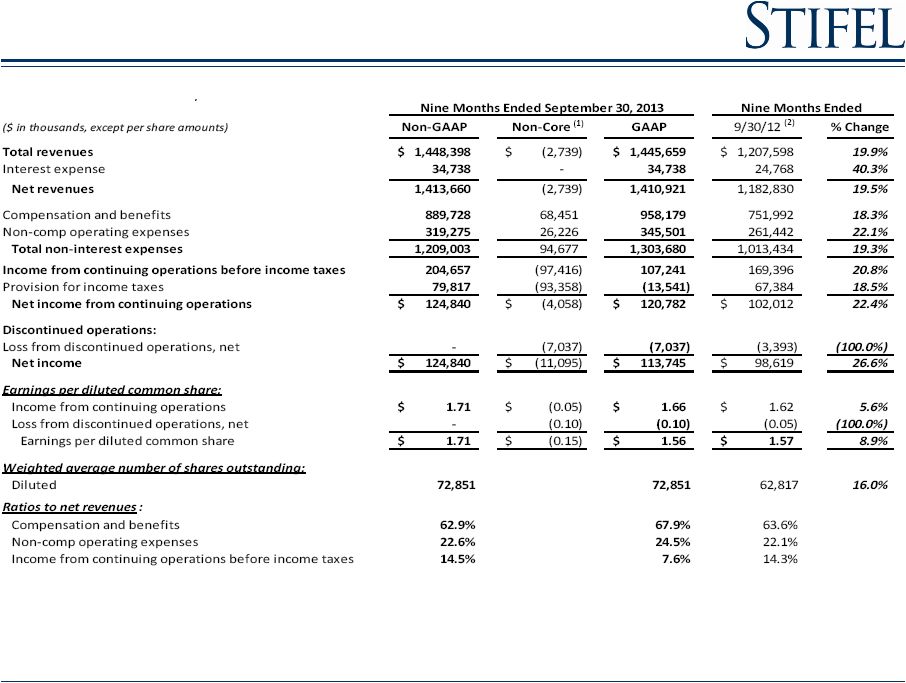 32
Stifel Financial Results
Nine months ended September 30, 2013
(1)
Non-core
adjustments
consist
of
a
charges
related
to
expensing
stock
awards
issued
as
retention
in
connection
with
the
acquisitions
of
KBW
and
the
Knight
Capital
Fixed
Income
business
and
other
merger-
related
revenues
and
expenses
associated
with
our
acquisitions
of
KBW,
the
Knight
Capital
Fixed
Income
business,
Miller
Buckfire
and
a
U.S.
tax
benefit.
(2)
Core (non-GAAP) results for the nine months ended September 30, 2012
are the same as GAAP results.
_________________________________________________________
|
 33
Sources of Revenues
($ in thousands)
9/30/13
9/30/12
%
Change
6/30/13
%
Change
9/30/13
9/30/12
%
Change
Commissions
145,837
$
125,509
$
16.2%
154,795
$
(5.8%)
446,498
$
370,107
$
20.6%
Principal transactions
122,583
102,474
19.6%
111,306
10.1%
341,153
311,420
9.5%
Brokerage revenues
268,420
227,983
17.7%
266,101
0.9%
787,651
681,527
15.6%
Capital raising
53,665
44,563
20.4%
71,737
(25.2%)
175,252
139,441
25.7%
Advisory
39,186
27,180
44.2%
47,706
(17.9%)
113,947
68,901
65.4%
Investment banking
92,851
71,743
29.4%
119,443
(22.3%)
289,199
208,342
38.8%
Asset mgt and service fees
76,710
62,881
22.0%
76,088
0.8%
221,711
189,010
17.3%
Other
13,063
31,094
(58.0%)
11,787
10.8%
45,269
49,991
(9.4%)
Total operating revenues
451,044
393,701
14.6%
473,419
(4.7%)
1,343,830
1,128,870
19.0%
Interest revenue
39,130
26,360
48.4%
32,893
19.0%
101,829
78,728
29.3%
Total revenues
490,174
420,061
16.7%
506,312
(3.2%)
1,445,659
1,207,598
19.7%
Interest expense
11,535
5,904
95.4%
12,634
(8.7%)
34,738
24,768
40.3%
Net revenues
478,639
$
414,157
$
15.6%
493,678
$
(3.0%)
1,410,921
$
1,182,830
$
19.3%
Three Months Ended
Nine Months Ended |
 34
Core Non-Interest Expenses
Three months ended September 30, 2013
($ in thousands)
6/30/13
(1)
6/30/12
% Change
3/31/13
% Change
6/30/13
(1)
6/30/12
3/31/13
Net revenues
500,472
$
374,407
$
33.7%
441,788
$
13.3%
100.0%
100.0%
100.0%
Compensation and benefits
294,446
219,004
34.4%
259,135
13.6%
58.8%
58.5%
58.7%
Transitional pay
(2)
20,867
20,370
2.4%
22,806
(8.5%)
4.2%
5.4%
5.2%
Total compensation and benefits
315,313
239,374
31.7%
281,941
11.8%
63.0%
63.9%
63.8%
Occupancy and equipment rental
38,306
32,320
18.5%
31,501
21.6%
7.7%
8.6%
7.1%
Communication and office supplies
24,604
20,797
18.3%
21,858
12.6%
4.9%
5.6%
4.9%
Commissions and floor brokerage
9,616
7,747
24.1%
8,669
10.9%
1.9%
2.1%
2.0%
Other operating expenses
38,707
30,295
27.8%
34,127
13.4%
7.7%
8.1%
7.6%
Total non-comp operating expenses
111,233
91,159
22.0%
96,155
15.7%
22.2%
24.3%
21.8%
Total non-interest expense
426,546
330,533
29.0%
378,096
12.8%
85.2%
88.3%
85.6%
Income before income taxes
73,926
43,874
68.5%
63,692
16.1%
14.8%
11.7%
14.4%
Provision for income taxes
29,570
17,738
66.7%
23,808
24.2%
5.9%
4.6%
5.4%
Non-GAAP net income
44,356
$
26,136
$
69.7%
39,884
$
11.2%
8.9%
7.0%
9.0%
Non-core expenses (after-tax)
(14,921)
-
(25,265)
GAAP net income
29,435
$
26,136
$
14,619
$
Three Months Ended
% of Net revenues
_________________________________________________________
(1)
Excludes
non-core
adjustments
consisting
of
merger-related
revenues
and
expenses
associated
with
our
acquisitions
of
KBW,
the
Knight
Capital
Fixed
Income
business,
Miller
Buckfire
and
the
U.S.
tax
benefit..
(2)
Transition pay includes amortization of upfront notes, signing bonuses and
retention awards. |
 35
Core Non-Interest Expenses
Nine months ended September 30, 2013
($ in thousands)
9/30/13
(1)
9/30/12
% Change
9/30/13
(1)
9/30/12
Net revenues
1,413,660
$
1,182,830
$
19.5%
100.0%
100.0%
Compensation and benefits
826,314
699,601
18.1%
58.5%
59.1%
Transitional pay
(2)
63,414
52,391
21.0%
4.5%
4.4%
Total compensation and benefits
889,728
751,992
18.3%
62.9%
63.6%
Occupancy and equipment rental
108,596
94,776
14.6%
7.7%
8.0%
Communication and office supplies
70,565
60,115
17.4%
5.0%
5.1%
Commissions and floor brokerage
27,599
22,339
23.5%
2.0%
1.9%
Other operating expenses
112,515
84,212
33.6%
8.0%
7.1%
Total non-comp operating expenses
319,275
261,442
22.1%
22.6%
22.1%
Total non-interest expense
1,209,003
1,013,434
19.3%
85.5%
85.7%
Income from continuing operations before income taxes
204,657
169,396
20.8%
14.5%
14.3%
Provision for income taxes
79,817
67,384
18.5%
5.6%
5.6%
Non-GAAP net income from continuing operations
124,840
$
102,012
$
22.4%
8.8%
8.6%
Non-core expenses (after-tax)
(4,058)
-
GAAP net income from continuing operations
120,782
$
102,012
$
Nine Months Ended
% of Net revenues
_________________________________________________________
(1)
Excludes non-core adjustments consisting of a charge related to
expensing stock awards issued as retention in connection with the acquisitions of KBW and the Knight Capital Fixed Income business and
other
merger-related
revenues
and
expenses
associated
with
our
acquisitions
of
KBW,
the
Knight
Capital
Fixed
Income
business,
Miller
Buckfire
and
a
U.S.
tax
benefit.
(2)
Transition pay includes amortization of upfront notes, signing bonuses and
retention awards. |
 36
Segment Comparison
(1)
Core (non-GAAP) results for the three and nine months ended September
30, 2012 are the same as GAAP results.
_________________________________________________________
|