Attached files
| file | filename |
|---|---|
| 8-K - 8-K - FARMERS NATIONAL BANC CORP /OH/ | d631651d8k.htm |
Exhibit 99.1

| 1 Investor Presentation September 30, 2013 |
| 2 Disclosure Statement Forward-Looking Statements This presentation contains forward-looking statements within the meaning of the Private Securities Litigation Reform Act of 1995. Forward-looking statements express management's current expectations, forecasts of future events or long-term-goals and, by their nature, are subject to assumptions, risks and uncertainties. Actual results could differ materially from those indicated. Farmers National Banc Corp. ("Farmers") refers you to its periodic reports and registration statements filed with the Securities and Exchange Commission, including its Annual Report on Form 10-K for the year ended December 31, 2012 and Quarterly Report on Form 10-Q for the period ended September 30, 2013 which have been filed with the Securities and Exchange Commission and are available on Farmers' website (www.farmersbankgroup.com) and on the Securities and Exchange Commission's website (www.sec.gov), for additional discussion of these assumptions, risks and uncertainties. Forward-looking statements are not guarantees of future performance and should not be relied upon as representing management's views as of any subsequent date. Farmers undertakes no obligation to update forward-looking statements, whether as a result of new information, future events or otherwise, except as may be required by law. Use of Non-GAAP Financial Measures This presentation contains certain financial information determined by methods other than in accordance with accounting principles generally accepted in the United States ("GAAP"). These non-GAAP financial measures include "Core Deposits" and "Pre-tax, Pre-provision Earnings". Farmers believes that these non-GAAP financial measures provide both management and investors a more complete understanding of the Company's deposit profile and profitability. These non-GAAP financial measures are supplemental and are not a substitute for any analysis based on GAAP financial measures. Because not all companies use the same calculation of "Core Deposits" and "Pre-tax, Pre- provision Earnings", this presentation may not be comparable to other similarly titled measures as calculated by other companies. |
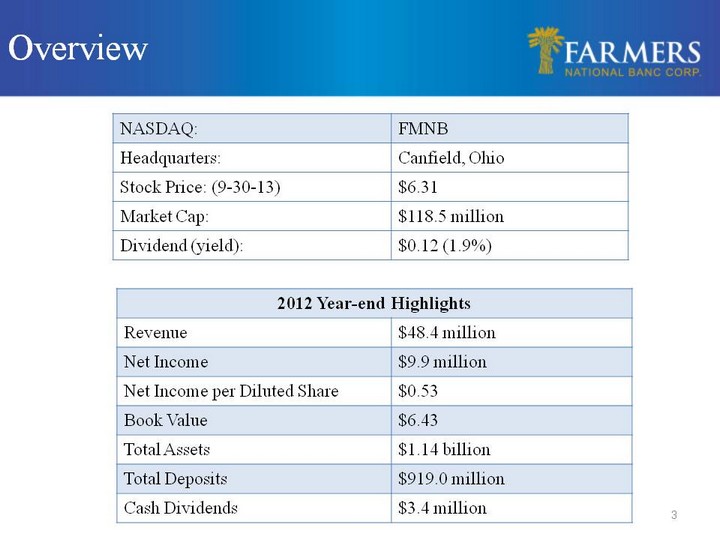
| 3 Overview NASDAQ: FMNB Headquarters: Canfield, Ohio Stock Price: (9-30-13) $6.31 Market Cap: $118.5 million Dividend (yield): $0.12 (1.9%) 2012 Year-end Highlights 2012 Year-end Highlights Revenue $48.4 million Net Income $9.9 million Net Income per Diluted Share $0.53 Book Value $6.43 Total Assets $1.14 billion Total Deposits $919.0 million Cash Dividends $3.4 million |

| 4 Who We Are Leading community bank in Ohio with deposit market share in the top ten in the counties we operate in Founded over 126 years ago 17 branches and 18 ATMs Sound franchise with many opportunities for growth Profitable throughout cycle and growing tangible book value per share Diversified and growing revenue streams Compelling valuation: 1.15x of tangible book value 12.5x LTM pre-tax pre-provision earnings 14.2x LTM EPS 1.9% dividend yield |

| 5 Rated one of the Top 200 Community Banks in 2013, by American Banker Magazine for the second consecutive year 5-Star, Superior Rating from the Bauer Financial Group - the highest rating awarded by the financial group. Listed in Top 100 Best Banks, $1B - $5B, as scored by Bank Director Magazine , July 2013 97% Customer Satisfaction Rate, according to an Independent Research Study Farmers' Texas Ratio, 8.5%, remains lower than similarly-sized banks and Mid-west banks Growing Franchise *As of September 30, 2013 |

| 6 Operating in Mahoning Valley Compelling Demographics Approximately 75 - 100 miles from Cleveland, Pittsburgh & Erie 6.8 million people 18 Fortune 500 company world headquarters 95 colleges and universities campus locations Northeast Ohio's manufacturing productivity is on track to outpace the rest of the nation by 10 percent as early as 2015, according to a report released by Team Northeast Ohio. Land acquisition, construction and labor costs are significantly below national averages. |

| 7 Note: Deposit data as of June 30, 2012 Source: SNL Opportunity for growth with approximately 10.60% deposit market share in the Mahoning Valley Large regional competitors lack focus - Community competitors inwardly focused Attractive Deposit Franchise - Deposit Market Share by MSA & County Tri-County Top 10 Tri-County Top 10 Tri-County Top 10 Tri-County Top 10 Tri-County Top 10 2013 Rank Company Branches Dep. ($000) Market Share 1 Huntington National Bank 48 2,191,626 25.82 2 Home Savings and Loan Co. of Youngstown 21 1,172,067 13.81 3 First Place Bank 19 1,014,108 11.95 4 PNC Bank NA 22 915,992 10.79 5 Farmers National Bank of Canfield 19 899,843 10.60 6 JPMorgan Chase Bank NA 20 885,120 10.43 7 Cortland Savings and Banking Co. 9 381,446 4.49 8 First National Bank of Pennsylvania 8 290,591 3.42 9 RBS Citizens NA 6 171,657 2.02 10 KeyBank NA 6 154,092 1.82 Total for Institutions in the Market 194 8,486,873 100.00 Columbiana Top 10 Columbiana Top 10 Columbiana Top 10 Columbiana Top 10 Columbiana Top 10 2013 Rank Company Branches Dep. ($M) Market Share 1 Huntington National Bank 11 332,137 24.33 2 Home Savings and Loan Co. of Youngstown 7 300,436 22.01 3 Farmers National Bank of Canfield 4 139,339 10.21 4 PNC Bank NA 6 131,503 9.63 5 JPMorgan Chase Bank NA 3 110,192 8.07 6 Consumers National Bank 3 96,574 7.07 7 1st National Community Bank 4 95,650 7.01 8 CFBank 2 67,433 4.94 9 RBS Citizens NA 1 44,982 3.30 10 KeyBank NA 1 44,512 3.26 Total for Institutions in the Market 44 1,365,054 100.00 Mahoning Top 10 Mahoning Top 10 Mahoning Top 10 Mahoning Top 10 Mahoning Top 10 2013 Rank Company Branches Dep. ($M) Market Share 1 Huntington National Bank 21 1,277,106 29.63 2 Home Savings and Loan Co. of Youngstown 10 742,041 17.22 3 Farmers National Bank of Canfield 8 541,721 12.57 4 PNC Bank NA 9 523,107 12.14 5 First Place Bank 12 433,595 10.06 6 JPMorgan Chase Bank NA 7 380,824 8.84 7 First National Bank of Pennsylvania 5 203,826 4.73 8 RBS Citizens NA 3 92,181 2.14 9 KeyBank National Association 4 76,756 1.78 10 Cortland Savings and Banking Co. 2 37,406 0.87 Total for Institutions in the Market 82 4,309,664 100.00 Trumbull Top 10 Trumbull Top 10 Trumbull Top 10 Trumbull Top 10 Trumbull Top 10 2013 Rank Company Branches Dep. ($M) Market Share 1 Huntington National Bank 16 582,383 20.71 2 First Place Bank 7 580,513 20.64 3 JPMorgan Chase Bank NA 10 394,104 14.01 4 Cortland Savings and Banking Co. 7 344,040 12.23 5 PNC Bank NA 7 261,382 9.29 6 Farmers National Bank of Canfield 7 218,783 7.78 7 Home Savings and Loan Co. of Youngstown 4 129,590 4.61 8 First National Bank of Pennsylvania 3 86,765 3.09 9 Home FS&LA of Niles 1 63,073 2.24 10 The Middlefield Banking Company 1 48,388 1.72 Total for Institutions in the Market 68 2,812,155 100.00 |

| 8 Increasing Shareholder Value Stable Dividend Policy Always paid a quarterly cash dividend Current yield 1.9% Two $0.03 per share special cash dividends declared in 2012 Dividend payout in 2012 was 34.1% of net income Stock Up 75% Since '08 *As of September 30, 2013 |

| 9 Source: Regional Chamber, Youngstown-Warren, Ohio Metropolitan Profile ,Valley Leads in Industrial Job Growth in NE Ohio, The Vindicator ,Ohio's Economic Impact Study - September, 2011 & 2012 Industrial Growth Returning to The Valley Steelmaker Vallourec's $650 million expansion - 350 jobs created. ($57 million Finishing Plant) Exterran $13 million plant - Approximately 100 jobs will be created once production begins. General Motors announced in August 2012 a three-year commitment and an investment of more than $200 million to manufacture the all-new Chevrolet Cruze at the Lordstown Assembly Plant, retaining about 4,500 jobs in the Valley Growing Interest in Utica Gas Formation Development Since 2011, 832 horizontal well permits have been issued and 466 wells drilled in eastern Ohio's Utica shale. 122 of those wells are now in production, ODNR reports. Pennant Midstream, LLC constructing $300 million pipeline and natural gas processing plant in eastern Mahoning County. The Hickory Bend Pipeline System and associated cryogenic gas- processing plant is expected to be operational by the end of 2013. Ohio's Natural Gas/Crude Oil Exploration Production Industry and the Utica Gas Formation impact: Jobs (204,000 created or supported by 2015) Income (Economic Output will increase by over $22 billion by 2015) Mahoning Valley Growth Opportunities |

| 10 Performance-driven culture Advancing automation and use of technology Metrics-oriented accountability Scaling organization to support growth Diligent risk management Expand fee-based business Integrate sales efforts Continue to drive name awareness Unification of brand Top graded talent to drive performance growth De novo expansion and strategic acquisitions Customer intimacy/decisions close to customer Identify target markets and customer segments Lead with commercial business/expand wallet share Acquire Share of Market/Share of Customer Operational Excellence Risk Management Evolve Trust, Insurance & Financial Services Brand Development Talent Farmers' Strategy for Growth |

| 11 Farmers' Family Billboard |

| Established and experienced management team with over 214 years of combined experience, 112 of which has been with Farmers. Experienced Management Team * Includes years with Butler Wick Trust Company |

| 13 Focus for Growth Continued organic growth in current markets Growth opportunities in new markets with Private Banking, Trust and Investments Targeted acquisitions include fee-based business and banks Target Metrics for Acquisition Accretive to earnings near term (excluding one-time charges) Manageable initial tangible book value dilution recoverable near term Growth of fee revenue to 30+% of total revenue A compelling IRR in low double digits Must enhance shareholder value Must sustain our culture Not materially change our investment merits Sustain our TCE and regulatory ratios Growth Focus and Target Metrics |

| 14 Butler Wick Trust Company Acquisition Acquired for cash on March 31, 2009 Only locally owned trust company in the Mahoning Valley Rebranded to Farmers Trust Company Assets increased approximately 69% since acquisition Contributed $5.5 million to non-interest income in 2012 National Associates, Inc. Acquisition Acquired on July 1, 2013 from owner for cash and stock A leading independent consultant to retirement plans. Offers actuarial, plan design, compliance and administrative services Located in Cleveland, Ohio 200 retirement plans with assets under administration of $500 million Expected to be accretive to earnings immediately Acquisitions to Enhance Fee-Based Revenue |
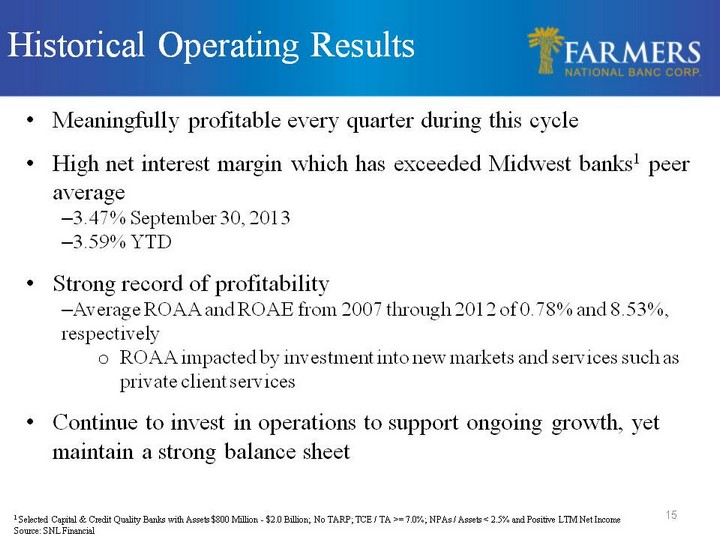
| 15 Meaningfully profitable every quarter during this cycle High net interest margin which has exceeded Midwest banks1 peer average 3.47% September 30, 2013 3.59% YTD Strong record of profitability Average ROAA and ROAE from 2007 through 2012 of 0.78% and 8.53%, respectively ROAA impacted by investment into new markets and services such as private client services Continue to invest in operations to support ongoing growth, yet maintain a strong balance sheet Historical Operating Results 1 Selected Capital & Credit Quality Banks with Assets $800 Million - $2.0 Billion; No TARP; TCE / TA >= 7.0%; NPAs / Assets < 2.5% and Positive LTM Net Income Source: SNL Financial |

| 16 Non Interest Income Increases 24% Noninterest income for the three months ended September 30, 2013 increased 23.9% from same quarter of 2012 123 consecutive quarters of positive earnings Net income for three months ended September 30, 2013 was $1.6 million compared to $2.5 million for same quarter of 2012 Excluding severance expenses, net income was $2.4 million, or $0.13 per diluted share for the 2013 third quarter Strong Capital Levels: Tier 1 Leverage Ratio of 9.29% remains solid from 9.51% at September 30, 2012 Tangible common equity ratio at September 30, 2013 remains strong at 8.96% Stable Asset Quality: Non-performing assets to total assets remain at low levels, currently 0.81% at September 30, 2013 Loans 30-89 days delinquent decreased from $3.2 million at September 30, 2012 to $2.3 million at September 30, 2013 Continued Strong Results - Overview of Q3 2013 |

| 17 Acquisition of Trust Company increased non-interest income by 10.72% since first quarter 20091 Growing and Diverse Revenue Stream Note: Revenue defined as net interest income plus non-interest income; Excludes $1.1MM net gain on securities 1 Calculated as Q4 2012 trust revenue / Q1 2009 total revenue (CHART) (CHART) (CHART) |

| 18 Diverse loan mix No national lending No sub-prime lending Farmers' practice is to lend primarily within its market area Less than 2% of loan portfolio is participations purchased Less than 2% of loan portfolio is construction loans Loan Portfolio Mix - September 30, 2013 Overview of Loan Portfolio Note: Dollars in thousands (CHART) (CHART) (CHART) |
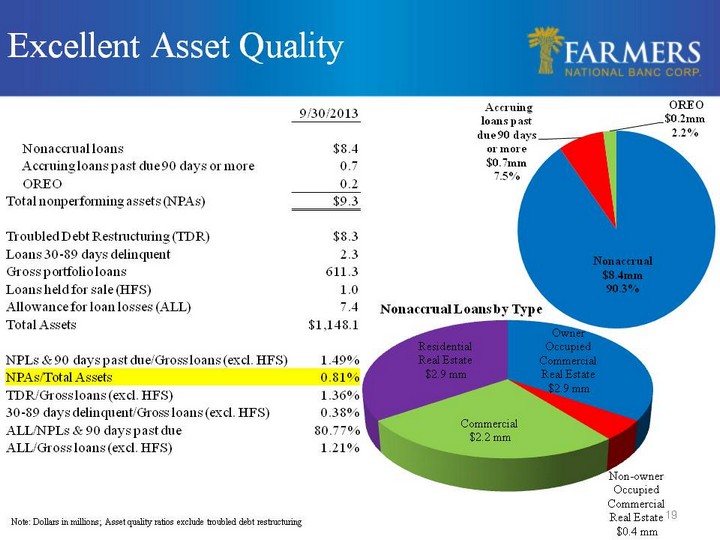
| 19 Excellent Asset Quality Note: Dollars in millions; Asset quality ratios exclude troubled debt restructuring 9/30/2013 Nonaccrual loans $8.4 Accruing loans past due 90 days or more 0.7 OREO 0.2 Total nonperforming assets (NPAs) $9.3 Troubled Debt Restructuring (TDR) $8.3 Loans 30-89 days delinquent 2.3 Gross portfolio loans 611.3 Loans held for sale (HFS) 1.0 Allowance for loan losses (ALL) 7.4 Total Assets $1,148.1 NPLs & 90 days past due/Gross loans (excl. HFS) 1.49% NPAs/Total Assets 0.81% TDR/Gross loans (excl. HFS) 1.36% 30-89 days delinquent/Gross loans (excl. HFS) 0.38% ALL/NPLs & 90 days past due 80.77% ALL/Gross loans (excl. HFS) 1.21% (CHART) (CHART) Nonaccrual Loans by Type |

| Relative to similar sized Midwest banks and similar quality Nationwide banks, FMNB is undervalued FMNB Comparative Valuation Note: Peer data is the median value for the peer group; market data as of November 14, 2013; All asset quality ratios exclude troubled debt restructurings 1 Selected Midwest Banks with Assets $1.0 Billion - $2.0 Billion and traded on the NASDAQ, NYSE and NYSE AMEX exchanges. Includes: PEBO, FFKT, BKYF, UCFC, HBNC, MOFG, CASH, MCBC, WTBA, BFIN, MBWM, MFSF, PULB, FBIZ, HFFC, ATLO, LNBB, MBTF, HWBK, FCZA, NASB, and PBIB 2 Selected Capital & Credit Quality Banks with Assets $1.0 Billion - $2.0 Billion; No TARP; TCE / TA >= 8.5%; NPAs / Assets < 2.0%, Positive LTM ROAA and traded on the NASDAQ, NYSE and NYSE AMEX exchanges. Includes: OKSB, IBTX, PSTB, GBNK, BKYF, MOFG, SUBK, FUBC, PFBC, HFWA, PPBI, BMRC, BBNK, PCBK, MBWM, HTBK, BHB, CACB, CUNB, AMNB, CZNC, ATLO, PWOD, OLBK, NRIM, HEOP, CNOB, NKSH, ACNB, and MNRK 3 Last 12 months pre-tax, pre-provision earnings ^ Texas Ratio calculated as: NPAs (Excluding troubled debt restructurings) & 90+ DPD / Tangible Common Equity + Reserves Source: SNL Financial |

| 21 Supplemental Information |

| 22 GAAP to Non-GAPP Reconciliation Reconciliation of Common Stockholders' Equity to Tangible Common Equity Reconciliation of Common Stockholders' Equity to Tangible Common Equity Reconciliation of Common Stockholders' Equity to Tangible Common Equity Reconciliation of Common Stockholders' Equity to Tangible Common Equity Sept 30, June 30, March 31, Dec 31, Sept 30, 2013 2013 2013 2012 2012 Stockholders' Equity $112,524 $114,316 $120,576 $120,792 $121,008 Less Goodwill and other intangibles 10,546 5,836 5,934 6,032 6,134 Tangible Common Equity $101,978 $108,480 $114,642 $114,760 $114,874 Reconciliation of Total Assets to Tangible Assets Reconciliation of Total Assets to Tangible Assets Sept 30, June 30, March 31, Dec 31, Sept 30, 2013 2013 2013 2012 2012 Total Assets $1,148,119 $1,123,489 $1,143,099 $1,139,695 $1,132,746 Less Goodwill and other intangibles 10,546 5,836 5,934 6,032 6,134 Tangible Assets $1,137,573 $1,117,653 $1,137,165 $1,133,663 $1,126,612 Reconciliation of Income Before Taxes to Pre-Tax, Pre-Provision Income Reconciliation of Income Before Taxes to Pre-Tax, Pre-Provision Income Reconciliation of Income Before Taxes to Pre-Tax, Pre-Provision Income Reconciliation of Income Before Taxes to Pre-Tax, Pre-Provision Income For the Three Months Ended For the Three Months Ended For the Three Months Ended For the Three Months Ended For the Three Months Ended For the Nine Months Ended For the Nine Months Ended Sept 30, June 30, March 31, Dec 31, Sept 30, Sept 30, Sept 30, 2013 2013 2013 2012 2012 2013 2012 Income before income taxes $1,755 $2,272 $2,500 $3,462 $3,247 $6,527 $9,525 Provision for loan losses 340 170 255 0 325 765 725 Pre-tax, pre-provision income $2,095 $2,442 $2,755 $3,462 $3,572 $7,292 $10,250 |

| 23 Consolidated Statements of Income Consolidated Statements of Income For the Three Months Ended For the Three Months Ended For the Three Months Ended For the Three Months Ended For the Three Months Ended For the Nine Months Ended For the Nine Months Ended For the Nine Months Ended Sept 30, June 30, March 31, Dec 31, Sept 30, Sept 30, Sept 30, Percent 2013 2013 2013 2012 2012 2013 2012 Change Total interest income $10,122 $10,273 $10,266 $10,691 $10,630 $30,661 $32,419 -5.4% Total interest expense 1,274 1,234 1,298 1,435 1,529 3,806 4,777 -20.3% Net interest income 8,848 9,039 8,968 9,256 9,101 26,855 27,642 -2.8% Provision for loan losses 340 170 255 0 325 765 725 5.5% Other income 4,173 3,225 2,875 3,671 3,367 10,273 8,952 14.8% Other expense 10,926 9,822 9,088 9,465 8,896 29,836 26,344 13.3% Income before income taxes 1,755 2,272 2,500 3,462 3,247 6,527 9,525 -31.5% Income taxes 143 404 495 825 758 1,042 2,230 -53.3% Net income $1,612 $1,868 $2,005 $2,637 $2,489 $5,485 $7,295 -24.8% |

| 24 Consolidated Statements of Financial Condition Consolidated Statements of Financial Condition Consolidated Statements of Financial Condition Sept 30, June 30, March 31, Dec 31, Sept 30, 2013 2013 2013 2012 2012 Assets Cash and cash equivalents $40,303 $26,587 $57,312 $37,759 $79,494 Securities available for sale 438,127 443,833 439,540 464,088 429,845 Loans held for sale 1,016 4,612 4,330 3,624 4,574 Loans 611,349 596,838 592,520 586,592 572,903 Less allowance for loan losses 7,369 7,590 7,508 7,629 8,625 Net Loans 603,980 589,248 585,012 578,963 564,278 Other assets 64,693 59,209 56,905 55,261 54,555 Total Assets $1,148,119 $1,123,489 $1,143,099 $1,139,695 $1,132,746 Liabilities and Stockholders' Equity Deposits $903,410 $901,886 $915,855 $919,009 $900,138 Other interest-bearing liabilities 118,322 101,589 101,659 90,309 107,358 Other liabilities 13,863 5,698 5,009 9,585 4,242 Total liabilities 1,035,595 1,009,173 1,022,523 1,018,903 1,011,738 Stockholders' Equity 112,524 114,316 120,576 120,792 121,008 Total Liabilities and Stockholders' Equity $1,148,119 $1,123,489 $1,143,099 $1,139,695 $1,132,746 |