Attached files
| file | filename |
|---|---|
| 8-K - 8-K - Education Realty Trust, Inc. | a8-kforreitworldinvestorpr.htm |

REITWorld 2013 November 13-15 Grand Opening August 16, 2013 Central Hall I & III University of Kentucky

Leading Student Housing Company Strong Internal Growth – 5% Increase in Same-Community Revenue for Academic Year 2013/2014 Strong, Prefunded External Growth High Quality, Best-In-Class, Owned Portfolio Significant Competitive Advantages Excellent Capital Structure Proven Growth Investment Highlights The Oaks on the Square – Storrs Center University of Connecticut 2

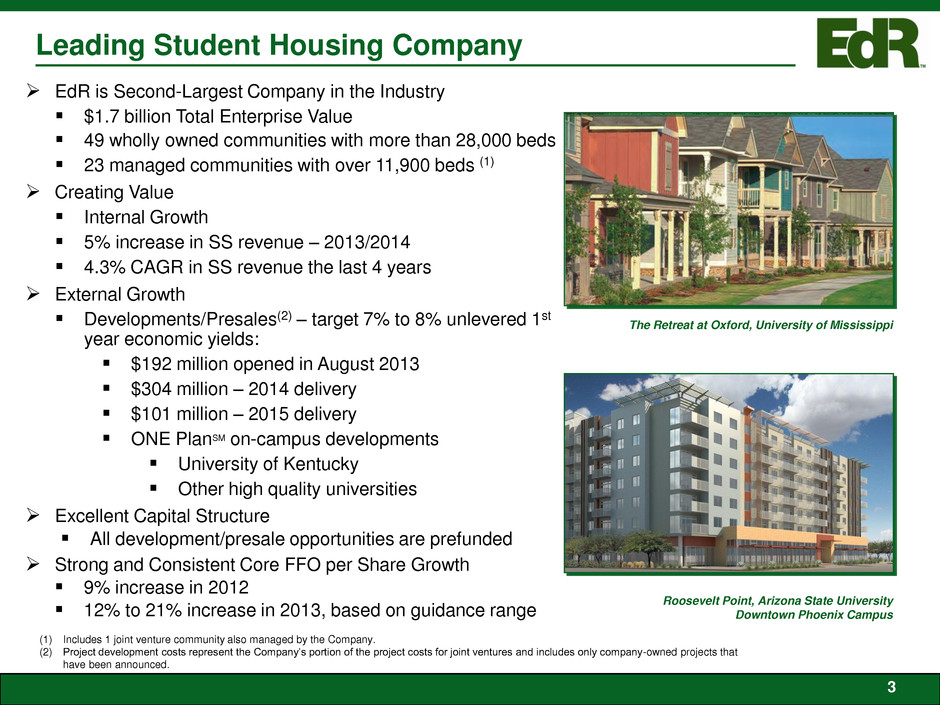
EdR is Second-Largest Company in the Industry $1.7 billion Total Enterprise Value 49 wholly owned communities with more than 28,000 beds 23 managed communities with over 11,900 beds (1) Creating Value Internal Growth 5% increase in SS revenue – 2013/2014 4.3% CAGR in SS revenue the last 4 years External Growth Developments/Presales(2) – target 7% to 8% unlevered 1st year economic yields: $192 million opened in August 2013 $304 million – 2014 delivery $101 million – 2015 delivery ONE PlanSM on-campus developments University of Kentucky Other high quality universities Excellent Capital Structure All development/presale opportunities are prefunded Strong and Consistent Core FFO per Share Growth 9% increase in 2012 12% to 21% increase in 2013, based on guidance range (1) Includes 1 joint venture community also managed by the Company. (2) Project development costs represent the Company’s portion of the project costs for joint ventures and includes only company-owned projects that have been announced. Roosevelt Point, Arizona State University Downtown Phoenix Campus Leading Student Housing Company The Retreat at Oxford, University of Mississippi 3

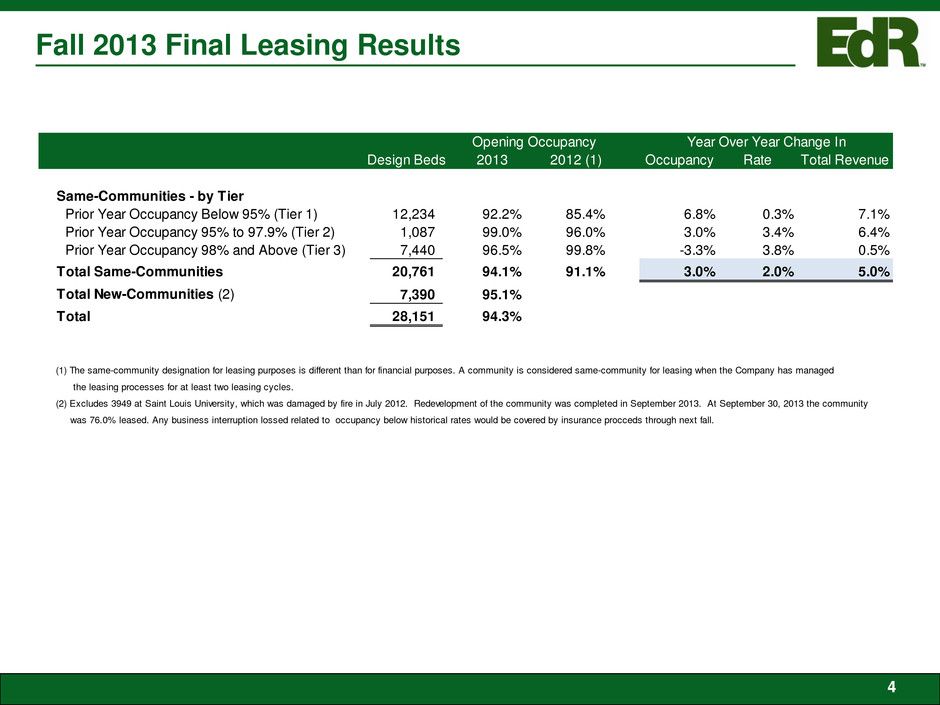
Fall 2013 Final Leasing Results 4 Design Beds 2013 2012 (1) Occupancy Rate Total Revenue Same-Communities - by Tier Prior Year Occupancy Below 95% (Tier 1) 12,234 92.2% 85.4% 6.8% 0.3% 7.1% Prior Year Occupancy 95% to 97.9% (Tier 2) 1,087 99.0% 96.0% 3.0% 3.4% 6.4% Prior Year Occupancy 98% and Above (Tier 3) 7,440 96.5% 99.8% -3.3% 3.8% 0.5% Total Same-Communities 20,761 94.1% 91.1% 3.0% 2.0% 5.0% Total New-Communities (2) 7,390 95.1% Total 28,151 94.3% (1) The same-community designation for leasing purposes is different than for financial purposes. A community is considered same-community for leasing when the Company has managed the leasing processes for at least two leasing cycles. (2) Excludes 3949 at Saint Louis University, which was damaged by fire in July 2012. Redevelopment of the community was completed in September 2013. At September 30, 2013 the community was 76.0% leased. Any business interruption lossed related to occupancy below historical rates would be covered by insurance procceds through next fall. Opening Occupancy Year Over Year Change In

Strong, Prefunded External Growth 5 (Amounts in thousands expect bed counts) Active projects Project Project Type Bed Count EdR's Share of Development Cost University of Colorado - The Lotus Wholly Owned 202 $20,830 University of Kentucky ONE Plan 2,381 138,025 University of Minnesota - The Marshall Joint Venture 882 47,022 Duke University - 605 West Joint Venture 384 41,520 University of Connecticut - Storrs Center Ph III Wholly Owned 116 12,819 Florida International University Presale 542 43,500 Total - 2014 Deliveries 4,507 303,716 University of Kentucky - Woodland Glen III, IV & V ONE Plan 1,610 101,172 Total - 2015 Deliveries 1,610 $101,172 Current projects will increase total gross assets by nearly 25%.

High Quality, Best-In-Class Portfolio 2012 Average Enrollment Distance to Campus (1) 6 Median distance to campus 0.1 miles Average distance to campus 0.5 miles Average enrollment over 25,500 Average rental rate $630 per bed Average age 7.4 years (2) Sold 40% of assets owned prior to January 2010 No portfolio acquisitions (1) Based on community NOI, includes announced developments. (2) Age as of August 2014 in order to include developments delivering in 2014. On Campus 26% Pedestrian 38% 0.2 to 0.5 Miles 9% 0.6 to 1.0 Miles 1% 1.1 to 2.0 Miles 25% > 2.0 Miles 1% 25,943 20,139 - 5,000 10,000 15,000 20,000 25,000 30,000 EdR 4-Year Public- Private Graduate Undergraduate

EdR Focuses on Strong Stable Markets EdR Schools Have Strong Demand EdR Markets vs Average 7 Enrollment growth at universities EdR serves is stronger than the national average for 4-year public-private universities. EdR underwrites the university before investing in a market. Target universities with strong characteristics, including: Enrollment over 10,000 High application to admission ratio. Guard against supply and enrollment issues with most desired sites pedestrian to campus. Source: The National Center for Education Statistics IPEDS data base. EdR averages weighted by NOI exposure and includes proforma NOI on announced developments. 2.8% 2.1% 1.3% 2.8% 1.6% 0.4% 0.0% 0.5% 1.0% 1.5% 2.0% 2.5% 3.0% 2010 2011 2012 EdR 4-Year Universities >10K Enrollment 1.60x 1.65x 1.70x 1.75x 1.80x 2010 2011 2012 1.68x 1.75x 1.80x Applicant to Admitted Ratio

Excellent Capital Structure Conservative Capital Structure (1) Debt Maturities as of September 30, 2013 Conservative Capitalization Prudent Financing Strategy (1) All data is as of September 30, 2013 per the company’s 3Q13 financial supplement except for footnote 2. (2) Most recently announced quarterly dividend annualized. Based on stock price of $9.10 as of September 30, 2013. Conservative Leverage Levels Debt to Gross Assets: 40.2% Net Debt to Enterprise Value: 39.4% Net Debt to Adjusted EBITDA: 6.2x Strong Coverage Levels Interest Coverage Ratio: 4.6x Well-staggered debt maturities $500 million unsecured Credit Facility expandable to $700 million In process of Terming and Swapping $150 million of the current revolver balance Attractive and well covered dividend (2) Dividend Yield: 4.7% Projected 49% debt to gross assets at the end of 2015 based on announced deals 8 60% 17% 8% 15% Equity Mortgage Debt Construction Debt Revolving Credit Facility 105.8 268.9 $1.1 $59.3 $100.8 $125.4 $39.8 $374.7 $0.0 $75.0 $150.0 $225.0 $300.0 $375.0 2013 2014 2015 2016 2017 2018+ Mortgage Debt Revolving Credit Facility

Strengthened Balance Sheet Interest Coverage Debt to Gross Assets Source: Company disclosures. Unencumbered Assets (% of Gross Assets) Net Debt to Enterprise Value 9 41.5% 31.3% 31.7% 40.2% 20.0% 27.5% 35.0% 42.5% 50.0% 4Q10 4Q11 4Q12 3Q13 2.2x 2.7x 4.2x 4.6x 1.00x 2.00x 3.00x 4.00x 5.00x 4Q10 4Q11 4Q12 3Q13 43.9% 22.9% 27.4% 39.4% 10.0% 22.5% 35.0% 47.5% 60.0% 4Q10 4Q11 4Q12 3Q13 23.6% 43.6% 50.3% 53.1% 0.0% 15.0% 30.0% 45.0% 60.0% 4Q10 4Q11 4Q12 3Q13

Proven Growth Core FFO Growth Same Community Revenue Growth (1) 10 EdR has produced strong growth that is expected to continue. Industry leading same-community revenue growth three out four years. Significant increases in total revenue, NOI and gross assets. Strong growth in Core FFO per share. Annual dividend increases of at least 10% over the last two years. (1) Source: respective company’s disclosures. 2013 is midpoint of any disclosed range or last reported leasing progress for fall 2013. $0.47 $0.55 9.3% 17.0% $0.30 $0.40 $0.50 $0.60 $0.70 2012 2013 Mid-point P e r S h a re 4.3% 7.1% 0.9% 5.0% 0.0% 1.0% 2.0% 3.0% 4.0% 5.0% 6.0% 7.0% 8.0% 2010 2011 2012 2013 EdR ACC EdR CAGR = 4.3% ACC CAGR = 2.8%

11 Demand for Collegiate Housing • Increasing Enrollment – estimated at 1.1% annually through 2021 (1) • Growth in student population is stressing on-campus housing capabilities of universities (2) • Experiencing pent up demand by students vacating older, less functional housing Positive Environment for Industry Growth (1) National Center for Education Statistics report titled “The Condition of Education 2012.” (2) National Multi Housing Council White Paper, May 2012. Total Full-Time Enrollment Growth (1) 2.3% 4.9% 5.3% 3.8% 2.8% 1.8% 1.5% 2.9% 4.2% 8.3% 2.3% 0.2% -1.8% 0.3% 0.9% 0.7% 0.9% 1.4% 1.6% 1.6% 1.3% 1.0% -2.5% -1.5% -0.5% 0.5% 1.5% 2.5% 3.5% -4.0% -2.0% 0.0% 2.0% 4.0% 6.0% 8.0% 10.0% 2000 2002 2004 2006 2008 2010 2012 2014 2016 2018 2020 Avg % Growth 2000-12 = 3.0% Proj. Avg % Growth 2013-21= 1.1% Actual Growth Projected Growth

12 Percentage of High School Graduates Attending College (1) Demand for Collegiate Housing • 1.1% Average Annual Increasing in Enrollment Driven by − Echo Boom generation − Increasing percentage of high school graduates choosing to attend college − College students are taking longer to graduate Positive Environment for Industry Growth (Con’t) (1) National Center for Education Statistics report titled “The Condition of Education 2012.” 52.6% 46.7% 58.6% 58.0% 62.6% 59.9% 66.5% 62.8% 40.0% 45.0% 50.0% 55.0% 60.0% 65.0% 70.0% 1975 1980 1985 1990 1995 2000 2005 2010

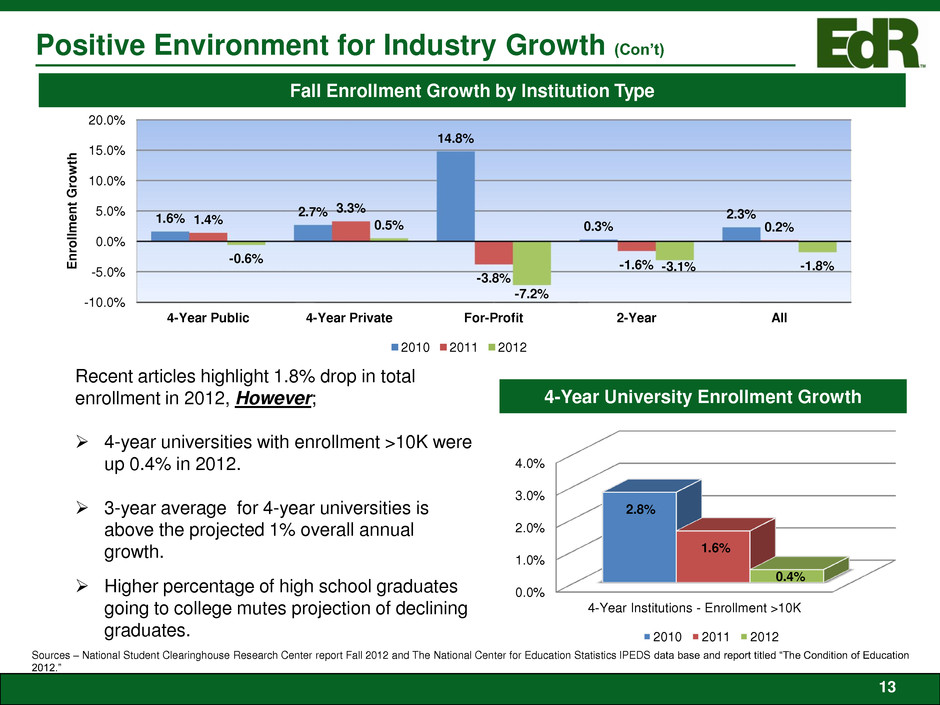
Recent articles highlight 1.8% drop in total enrollment in 2012, However; 4-year universities with enrollment >10K were up 0.4% in 2012. 3-year average for 4-year universities is above the projected 1% overall annual growth. Higher percentage of high school graduates going to college mutes projection of declining graduates. Positive Environment for Industry Growth (Con’t) 4-Year University Enrollment Growth Fall Enrollment Growth by Institution Type 13 Sources – National Student Clearinghouse Research Center report Fall 2012 and The National Center for Education Statistics IPEDS data base and report titled “The Condition of Education 2012.” 0.0% 1.0% 2.0% 3.0% 4.0% 4-Year Institutions - Enrollment >10K 2.8% 1.6% 0.4% 2010 2011 2012 -10.0% -5.0% 0.0% 5.0% 10.0% 15.0% 20.0% 4-Year Public 4-Year Private For-Profit 2-Year All 1.6% 2.7% 14.8% 0.3% 2.3% 1.4% 3.3% -3.8% -1.6% 0.2% -0.6% 0.5% -7.2% -3.1% -1.8% E n ro llmen t G ro w th 2010 2011 2012

14 Reasonable Near-term Supply of New Product • Reduced state appropriations limit ability for many universities to update their aged and obsolete on-campus housing • On-campus housing capacity as a percentage of undergraduate enrollment is decreasing Positive Environment for Industry Growth (Con’t) Owned Community Projected 2014 New Supply and Demand Information by Region(1) (1) All markets served by EdR and includes all announced deliveries. Data was obtained from the National Center for Education Statistics, Axiometrics and local market data. (2) Includes 2014 development deliveries. NOI is based on current 2013 forecasted net operating income with proforma adjustments for 2014 developments and developments or acquisitions that have been operating less than 12 months. Example of Pent Up Demand in EdR Markets Re gi on Ow d Be ds ( 2 ) P e r c e nt a ge of Owne d Be ds ( 2 ) EdR NOI % ( 2 ) Enr ol l me nt Gr owt h 3 Ye a r CAGR - Uni v e r si t i e s S e r v e d 2 0 14 Ne w S uppl y % Va r i a nc e West 2,331 7% 8% 1.5% 1.7% 0.2% Mid At lant ic 5,811 18% 27% 1.2% 1.2% -% Nort h 5,128 15% 12% 0.2% 0.9% 0.7% Sout h Cent ral 7,043 16% 23% 1.7% 2.5% 0.8% Sout h East 8,363 29% 20% 2.1% 3.3% 1.2% Mid West 4,238 15% 10% 1.7% 3.1% 1.4% Tot a l 3 2 , 9 14 10 0 % 10 0 % 1. 4 % 2 . 2 % 0 . 8 % Universit y 2013 New Supply EdR Revenue Growt h Universit y of Mississippi 12.6% 5.2% Georgia Sout hern Universit y 19.1% 5.4% Universit y of Missouri 9.8% -4.7% Florida St at e Universit y 4.0% -2.0% Weight ed average 9.3% 0.5%

Leading Student Housing Company Strong Internal Growth – 5% Increase in Same-Community Revenue for Academic Year 2013/2014 Strong, Prefunded External Growth High Quality, Best-In-Class, Owned Portfolio Significant Competitive Advantages Excellent Capital Structure Proven Growth Investment Highlights 2400 Nueces, University of Texas at Austin 15

Forward Looking Statements This presentation includes certain statements, estimates and projections provided by EdR’s management with respect to the anticipated future performance of EdR, including “forward-looking statements” within the meaning of Section 27A of the Securities Act of 1933, as amended, and Section 21E of the Securities Exchange Act of 1934, as amended. Such statements, estimates and projections reflect various assumptions by EdR’s management concerning anticipated results and have been included solely for illustrative purposes. Forward-looking statements can be identified by the use of the words “anticipate,” “believe,” “expect,” “intend,” “may,” “might,” “plan,” “estimate,” “project,” “should,” “will,” “result,” and similar expressions. No representations are made as to the accuracy of such statements, estimates or projections, which necessarily involve known and unknown risks, uncertainties and other factors that, in some ways, are beyond management’s control. Such factors include the risk factors discussed in the Company’s registration statement on Form S-3, annual report on Form 10-K for the year ended December 31, 2012, and quarterly report on Form 10-Q for the period ended September 30, 2013, each as filed with the SEC. These risk factors include, but are not limited to risks and uncertainties inherent in the national economy, the real estate industry in general, and in our specific markets; legislative or regulatory changes including changes to laws governing REITS; our dependence on key personnel; rising insurance rates and real estate taxes; changes in GAAP; and our continued ability to successfully lease and operate our properties. Accordingly, actual results may vary materially from the projected results contained herein and you should not rely on any forward-looking statements made herein or made in connection with this presentation. The Company shall have no obligation or undertaking to update or revise any forward-looking statements to reflect any change in Company expectations or results, or any change in events. 16
