Attached files
| file | filename |
|---|---|
| 8-K - FORM 8-K - HUNTINGTON BANCSHARES INC /MD/ | d627869d8k.htm |
 Bank
of America Merrill Lynch
Banking & Financial
Services Conference
Steve Steinour
November 13, 2013
Exhibit 99.1 |
 This
document contains certain forward-looking statements, including certain plans, expectations, goals, projections,
and statements, which are subject to numerous assumptions, risks, and
uncertainties. Forward-looking statements may be identified by
words such as expect, anticipate, believe, intend, estimate, plan, target, goal,
or similar expressions, or future or conditional verbs such as will, may,
might, should, would, could, or similar variations. While there is no
assurance that any list of risks and uncertainties or risk factors is complete, below are certain factors
which could cause actual results to differ materially from those
contained or implied in the forward-looking statements:
(1) worsening of credit quality performance due to a number of factors such as the
underlying value of collateral that could prove less valuable than otherwise
assumed and assumed cash flows may be worse than expected; (2) changes in
general economic, political, or industry conditions; uncertainty in U.S. fiscal and monetary policy, including the interest
rate policies of the Federal Reserve Board; volatility and disruptions in global
capital and credit markets; (3) movements in interest rates; (4) competitive
pressures on product pricing and services; (5) success, impact, and timing of our
business
strategies,
including
market
acceptance
of
any
new
products
or
services
implementing
our
“Fair
Play”
banking
philosophy; (6) changes in accounting policies and principles and the accuracy of
our assumptions and estimates used to prepare our financial statements; (7)
extended disruption of vital infrastructure; (8) the final outcome of significant
litigation; (9) the nature, extent, timing and results of governmental actions,
examinations, reviews, reforms, regulations, and interpretations, including
those related to the Dodd-Frank Wall Street Reform and Consumer Protection Act and the
Basel III regulatory capital reforms, as well as those involving
the OCC, Federal Reserve, and CFPB; and (10) the
outcome of judicial and regulatory decisions regarding practices
in the residential mortgage industry, including among
other things the processes followed for foreclosing residential mortgages.
Additional factors that could cause results to differ materially from those
described above can be found in Huntington’s 2012 Annual Report on Form 10-K, and
documents subsequently filed by Huntington with the Securities and Exchange
Commission. All forward-looking statements included in this document are
based on information available at the time of the release. Huntington assumes
no obligation to update any forward-looking statement.
Forward Looking Statements
2 |
 Presenter
Steve Steinour
Chairman, President, & Chief Executive Officer
Also Present
Todd Beekman
–
Senior Vice President –
Investor Relations
Mark Muth
–
Vice President –
Investor Relations
Participants
3
•
Who is Huntington
•
2010 Strategy and Investments
–
Visible Results: Customers, Fee Income, Lending Discipline
•
2014 -
Continued Positive Operating Leverage
•
Performance vs. Top 100 Banks & Regional Peers
Discussion Topics |
 MSA
Rank
Branches
Deposits
Share
Columbus, OH
1
95
$14,436
28.3%
Cleveland, OH
4
90
4,261
8.2
Detroit, MI
7
65
4,478
4.5
Toledo, OH
2
40
2,045
22.4
Pittsburgh, PA
8
40
2,512
2.7
Cincinnati, OH
4
40
2,109
2.8
Youngstown, OH
1
45
2,082
23.0
Indianapolis, IN
4
45
2,859
7.8
Canton, OH
2
28
1,494
25.1
Grand Rapids, MI
3
28
1,855
10.7
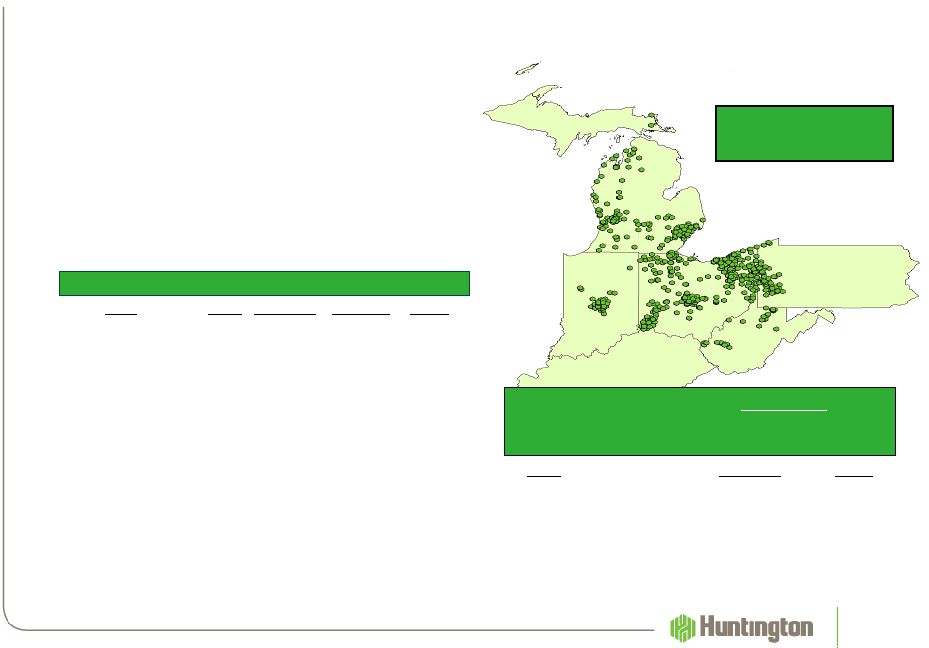
Who is Huntington (HBAN)
Midwest financial services holding company
Founded
-
1866
Headquarters
-
Columbus, Ohio
Total assets
-
$57 Billion
Total loans
-
$43 Billion,
90% in footprint
Employees
(1)
-
11,956
4
(1)
Full-time equivalent (FTE) (2) Includes 15 Private Financial Group
Offices Branches 731
(2)
ATMs
1,516
% Deposits
#1 Share markets
38%
#1-
#4 Share markets
63%
State
Branches
ATMs
Ohio
408
941
Michigan
163
230
Pennsylvania
54
108
Indiana
48
69
West Virginia
31
145
Kentucky
12
23
Deposits
-
Top
12
MSAs
Source:
SNL Financial, company presentations and filings
FDIC deposit data as of June 30, 2013 |
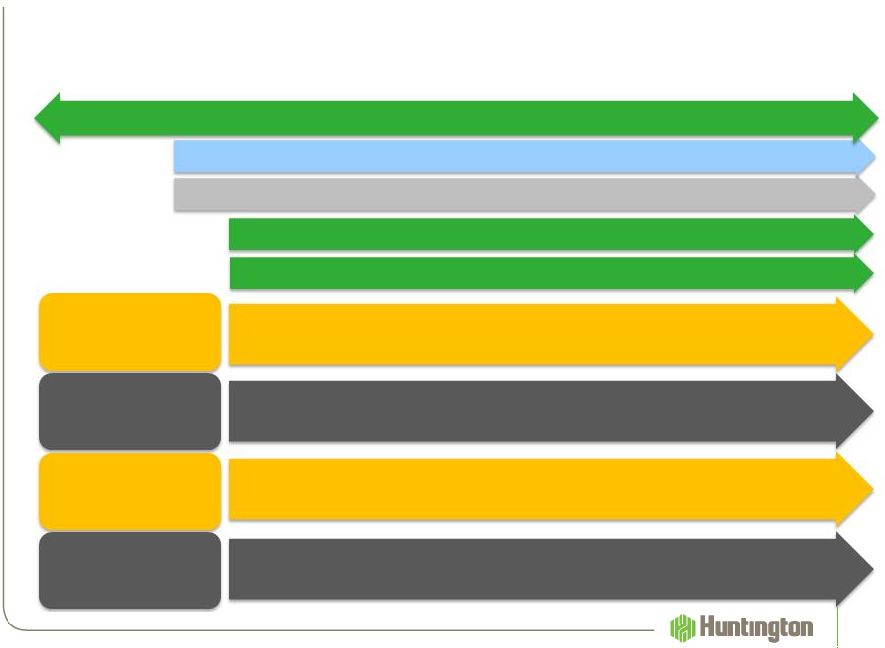 Continuing To Invest
But At a Moderated Pace
5
Retail and
Business
Banking
Commercial
Banking
Auto Finance
Wealth Advisors,
Gov’t Finance, and
Home Lending
Investing for the Long Term
2010
2011 2012
2009
Credit & Risk Management and IT Infrastructure
Strategic Plan
24-Hour Grace
®
Added 150 Sm Bus. Bankers
Giant Eagle / In-Store
Asterisk-Free Checking™
Huntington Plus Checking™
Treasury Management
Equipment Finance
Capital Markets
Expand to PA and
New England
Expand Personal Trust Offices
Huntington Asset Services
Foundation of Service
Common Sales Process: OCR / Cross Sell
Building a Powerful Brand
Expand to
WI & MN
Healthcare & Not-For-
Profit Verticals
Launched ETFs
Meijer / In-Store
Energy, Ag, &
International Verticals
Credit Card
Expand to
CT & IA
2013 |
 Grow
market share and share of wallet •
How
–
Best in class consumer products
–
Commercial focus on Small & Middle Market and select Specialty
Verticals
–
Best in class customer service with increased marketing & branding
–
Deep community involvement
–
Alignment of employees and shareholders through long-term
ownerships of equity
•
Outcome
–
Extending life of relationship... “stickier”
customers
–
Relationship-based customer selection…
reduced impact of irrational
competition
–
Improved funding mix…
higher percentage of low-
and no-cost deposits
–
Higher mix of fee income…
higher ROE revenue stream
–
Disciplined growth and capital deployment
Huntington’s Strategy Since 2010
6 |
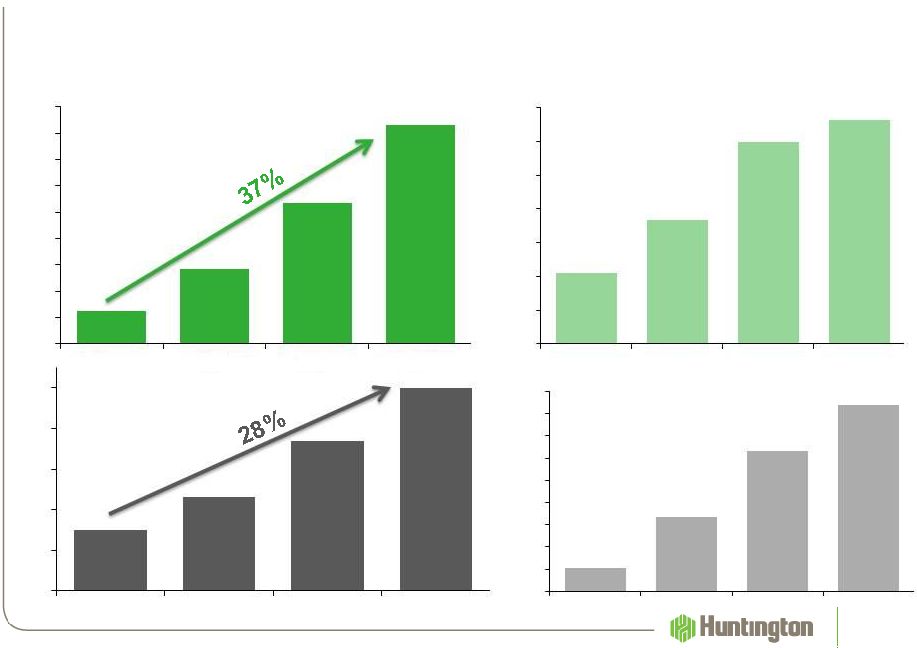 Consumer Checking Households (000s)
7
Commercial Relationships (000s)
4+ Services / Consumer Household
4+ Services / Commercial Relationship
Outcome…
Growing “Stickier”
Customers
With Increased Share of Wallet
•
Average expected length of consumer relationship is up over 10%
962
1,315
900
950
1,000
1,050
1,100
1,150
1,200
1,250
1,300
1,350
2Q10
2Q11
2Q12
3Q13
68%
71%
76%
77%
64%
66%
68%
70%
72%
74%
76%
78%
2Q10
2Q11
2Q12
3Q13
1,167
1,042
125
160
110
120
130
140
150
160
2Q10
2Q11
2Q12
3Q13
133
147
22%
27%
33%
37%
20%
22%
24%
26%
28%
30%
32%
34%
36%
38%
2Q10
2Q11
2Q12
3Q13 |
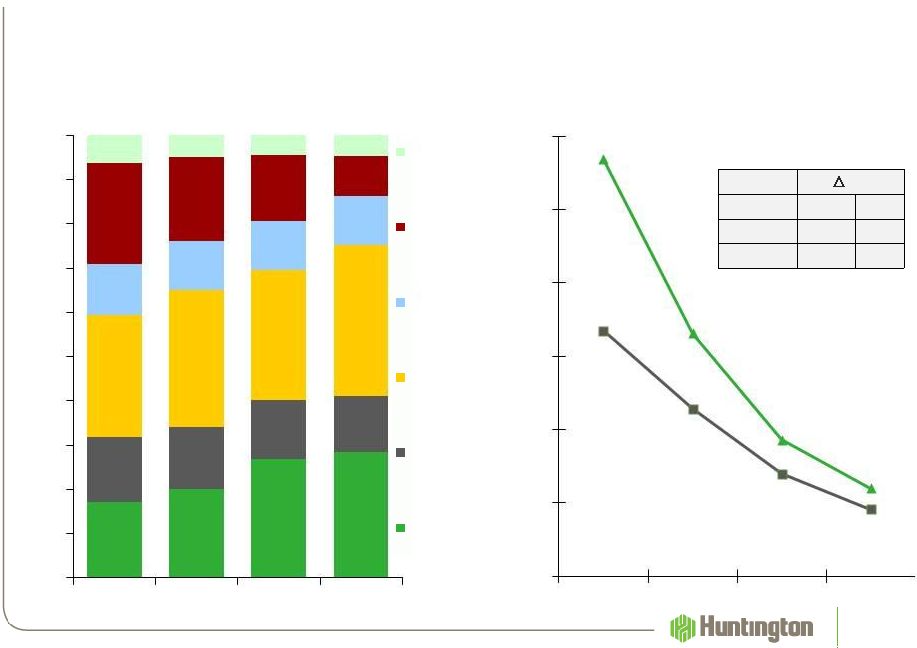 Avg.
Total Deposits – Mix
8
Source: SNL
Peers include ASBC, BBT, CMA, FHN, FITB, FNFG, KEY, MTB, PNC, RF, STI, &
ZION. bp
3Q13 vs.
HBAN
Peer
2Q10
-90
-49
2Q12
-13
-10
Avg. Total Deposits –
Rate
Outcome…
Better Deposit Mix at Lower Costs
•
Targeted mix of noninterest bearing of low to mid 30%’s
•
Deposit cost, in a higher interest rate environment, should be below peers
17%
20%
27%
28%
15%
14%
13%
13%
28%
31%
29%
34%
12%
11%
11%
11%
23%
19%
15%
9%
6%
5%
5%
5%
0%
10%
20%
30%
40%
50%
60%
70%
80%
90%
100%
2Q10
2Q11
2Q12
3Q13
Noncore
Core
CDs
Savings
/ Other
MMA
DDA
Int.
Bearing
DDA
Nonint.
Bearing
-
-
1.14
0.66
0.37
0.24
0.67
0.46
0.28
0.18
0.00
0.20
0.40
0.60
0.80
1.00
1.20
2Q10
2Q11
2Q12
3Q13 |
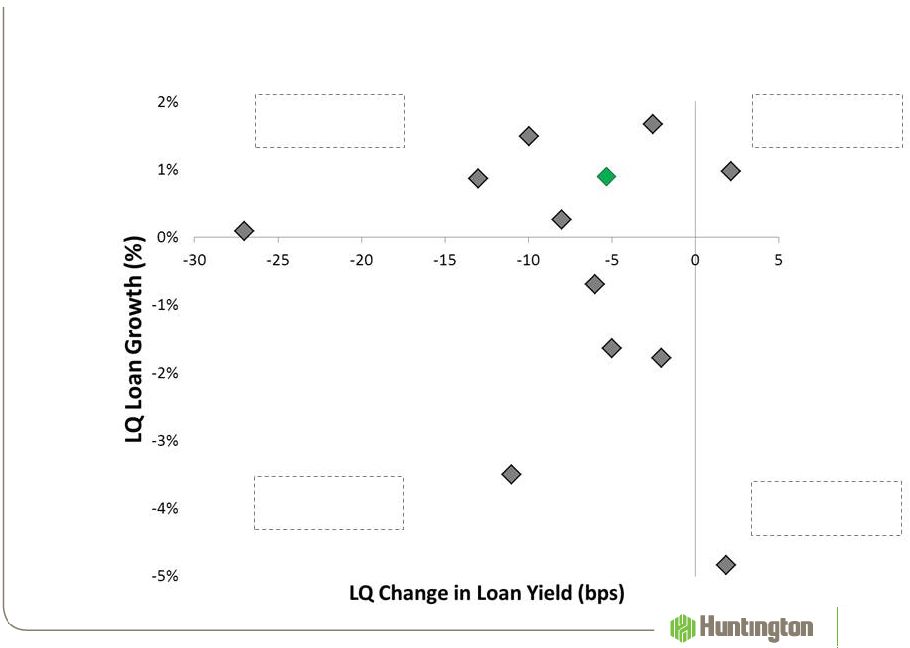 Outcome…
Disciplined Loan Growth With More
Stable Asset Yields
9
Loan Growth &
Increasing Yield
Loan Growth &
Declining Yield
Loans Decline &
Declining Yield
Loans Decline &
Increasing Yield
HBAN
Source: SNL Financial
Peers include ASBC, BBT, CMA, FHN, FITB, FNFG, KEY, MTB, PNC, RF, STI, &
ZION |
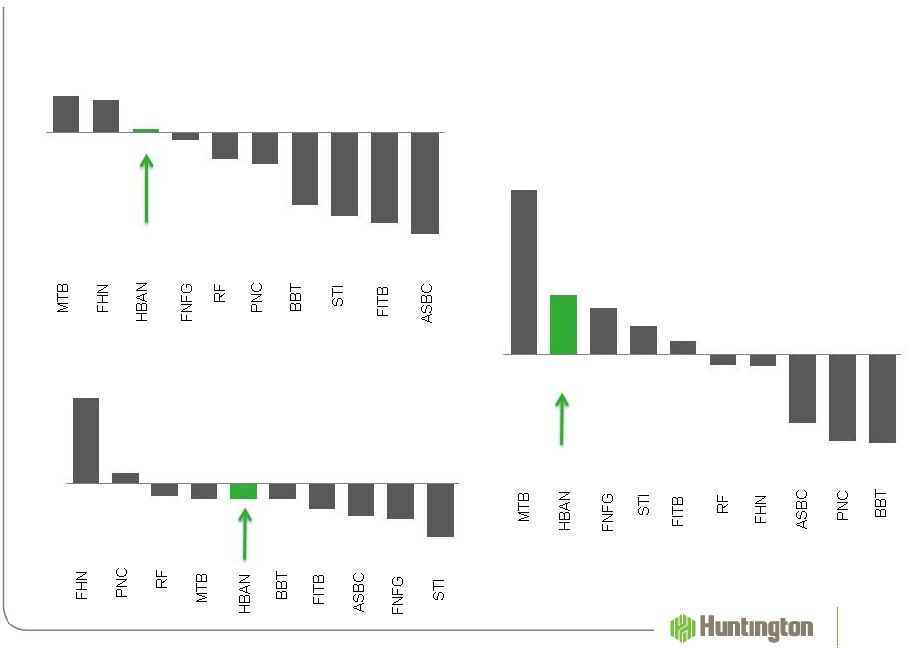 LQ
% Change Noninterest Income 10
Outcome…
Relationship Growth and Product Penetration
are Offsetting Fee Income Headwinds
Source: SNL Financial, see GAAP to Non-GAAP Reconciliation slide
LQ % Change Mortgage Banking Income
LQ % Change Noninterest Income
Excluding Mortgage
6
5
1
-1
-4
-5
-12
-13
-14
-16
-20
-15
-10
-5
0
5
10
159
19
-25
-29
-30
-30
-48
-61
-67
-99
-150
-100
-50
0
50
100
150
200
15
5
4
2
1
-1
-1
-6
-8
-8
-10
-5
0
5
10
15 |
 Optimize
Current
Franchise
•
Profitability /
pricing
•
Cross-sell /
share-of-
wallet
•
Launch new
brand
•
Invest in
capabilities
and begin
hiring
11
Lay
the
Foundation
•
Capital and
liquidity
•
Organizational
changes
•
Build
management
depth
•
Credit and
Risk
management
Invest
in the
Core
•
Build out
sales
forces,
channels,
and
products
•
Continued
brand roll-
out
•
Enhance
investment
discipline
Selective M&A –
as opportunities arise
2009
Focus
Future
•
Build out
sales forces,
channels,
and
products
•
Expand
winning
“plays”
•
Drive
efficiency &
continuous
improvement
Extend and
Expand
•
Monetize
investments
•
Drive growth
•
Drive
positive
operating
leverage &
continuous
improvement
2010
2011
2012
2013
Execution of Long Term Strategic Plan
Driving Differentiated Results
Disciplined
Execution
•
Capital
Management
•
Operating
Leverage /
Continuous
Improvement
•
Delivering
Returns On
Existing
Investments
2014
2009: Warren Bank $0.5B in Deposits, FDIC
2012: Fidelity Bank $0.7B in Deposit & $0.8B in Assets, FDIC
2013 Announced: Camco Financial $0.6B in Deposit & $0.8B in Assets
|
 Continued Execution is Driving Results
12
2014
•
Disciplined Capital Management
•
Grow the core business
•
Support the dividend
•
All other -
Repurchase, M&A, TruPS, …
•
Operating Leverage / Continuous Improvement
•
Deliver full-year positive operating leverage
•
Continue to invest -
At a slower pace but have increased
depreciation of recent investments
•
CI -
customer-centric, process-focused, data-driven decision
making to grow revenue, reduce expenses, cost/loss avoidance,
and improve customer and employee experience.
•
Delivering Returns On Existing Investments
•
Continue to deliver household & commercial relationship growth
•
In-store branches expected to have $15MM-$18MM pretax
improvement
•
Commercial verticals expected to add $0.5B to $1B of loans
•
Treasury Management & Capital Markets continue to mature
•
Credit card ramping…
few million loss in 2013 to a slight benefit
in 2014
Disciplined
Execution
•
Capital
Management
•
Operating
Leverage /
Continuous
Improvement
•
Delivering
Returns On
Existing
Investments |
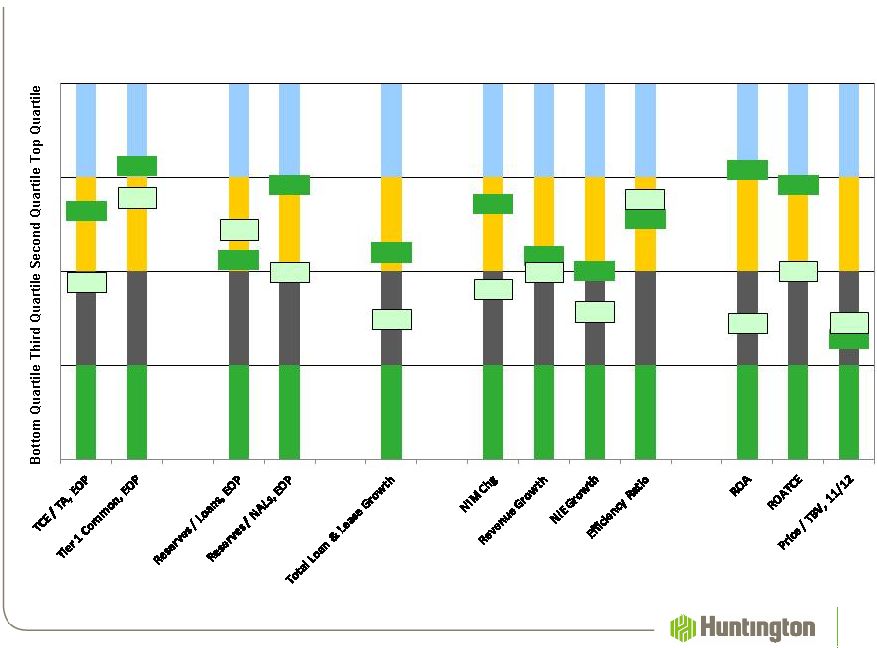 Comparison of Selected Performance Metrics Among Top 100 Bank Holding Companies
(1)
13
Strategy & Execution Differentiate Results
HBAN
HBAN
HBAN
HBAN
HBAN
HBAN
HBAN
HBAN
HBAN
HBAN
HBAN
HBAN
Peers
Peers
Peers
Peers
Peers
Peers
Peers
Peers
Peers
Peers
Peers
Peers
Best
Worst
(1) 100 largest BHCs, ranked by assets; data reflects 3Q13. Source: SNL Financial, as of
11/12/13 Peer
average includes ASBC, BBT, CMA, FHN, FITB, FNFG, KEY, MTB, PNC, RF, STI, and ZION. |
 Challenge /
Opportunity
HBAN
Economy
Customer uncertainty from
uneven U.S. economic
recovery
Midwestern strength (e.g., manufacturing and housing recovery) and soundness
of HBAN strategy will drive growth.
Disciplined
Loan
Growth
Economic uncertainty
remains a hurdle to solid
loan growth and
competitiveness of the
market is intense
•
C&I growth to increase due to customer activity and maturing of recently
launched specialty lending verticals.
•
Indirect Automobile: On balance sheet exposure is expected to increase.
•
Residential Mortgages, Home Equity , and CRE are expected to grow modestly.
Interest
Rates
Prolonged low interest rate
environment & recent long-
end volatility
•
Net interest income expected to modestly grow.
•
Full Year NIM is not expected to fall below the mid 3.30%’s and will
experience continued downward pressure due to competitive loan pricing and
growth in investment securities ($1B to $1.5B).
Noninterest
Income
Anticipated continued
reduction in mortgage
banking activity
Relatively stable as the continued benefits from growth in new customers,
increased contribution from higher cross-sell, and the continued maturation of
strategic investments should offset lower mortgage banking income.
Noninterest
Expense
Modest continued
investment and continued
cost saving opportunities
•
Expenses, excluding the significant items, are expected to modestly increase
due to higher depreciation, personnel, occupancy, and equipment expense
related to our continued modest pace of investments.
•
$6 million of branch consolidation expense is expected in 4Q13.
•
We remain committed to posting positive operating leverage in 2013.
Credit
Quality
Continued improvement in
NPAs / credit costs at low
end of normalized range
•
NPAs: expected to continue to improve.
•
NCOs: continued performance in our long-term expected range of 35 to 55
bps. •
LLP: below long-term expectation in 3Q13; expect moderate quarterly
volatility. Expectations…
Next Several Quarters
14 |
 Important Messages
•
Driving revenue with a continued focus on expense and rate
of investment
+ Multi-year process of executing our long-term strategic plan
+
Prior investments are not mature …. should continue to drive growth
+ Moderating level of investment given economic uncertainty
+
Continuous improvement focused on generating efficiencies
•
Managing to a lower risk profile and consistent performance
•
High level of employee and shareholder alignment
•
Expectations of positive operating leverage in 2014
15 |
 Use
of non-GAAP financial measures This document may contain GAAP financial
measures and non-GAAP financial measures where management believes it to
be helpful in understanding Huntington’s results of operations or financial position. Where non-GAAP financial
measures are used, the comparable GAAP financial measure, as well as the
reconciliation to the comparable GAAP financial measure, can be found in
this document, the 2013 third quarter earnings press release, or the Form
8-K related to this document, all of which can be found on
Huntington’s website at www.huntington-ir.com. Annualized data
Certain returns, yields, performance ratios, or quarterly growth
rates are presented on an “annualized”
basis. This is
done for analytical and decision-making purposes to better discern underlying
performance trends when compared to full year or year-over-year
amounts. For example, loan and deposit growth rates, as well as net charge-off percentages,
are most often expressed in terms of an annual rate like 8%. As
such, a 2% growth rate for a quarter would represent
an annualized 8% growth rate.
Fully-taxable equivalent interest income and net interest margin
Income from tax-exempt earning assets is increased by an amount equivalent to
the taxes that would have been paid if this income had been taxable at
statutory rates. This adjustment puts all earning assets, most notably tax-exempt
municipal securities and certain lease assets, on a common basis
that facilitates comparison of results to results of
competitors.
Earnings per share equivalent data
Significant income or expense items may be expressed on a per common share basis.
This is done for analytical and decision-making purposes to better
discern underlying trends in total corporate earnings per share performance
excluding the impact of such items. Investors may also find this information
helpful in their evaluation of the company’s financial performance
against published earnings per share mean estimate amounts, which typically exclude the impact
of Significant Items. Earnings per share equivalents are usually calculated
by applying a 35% effective tax rate to a pre- tax amount to derive an
after-tax amount, which is divided by the average shares outstanding during the respective
reporting period. Occasionally, when the item involves special tax treatment,
the after-tax amount is disclosed separately, with this then being the
amount used to calculate the earnings per share equivalent. Rounding
Please note that columns of data in the presentation may not add
due to rounding.
Basis of Presentation
16
Do we
consolidate
this and
next slide? |
 Significant Items
From time to time, revenue, expenses, or taxes are impacted by items judged by
Management to be outside of ordinary banking activities and/or by items that,
while they may be associated with ordinary banking activities, are so unusually
large that their outsized impact is believed by Management at that time to be
infrequent or short term in nature. We refer to such items as
"Significant Items". Most often, these Significant Items result from factors originating outside the
company –
e.g., regulatory actions/assessments, windfall gains, changes in accounting
principles, one-time tax assessments/refunds, litigation actions,
etc. In other cases they may result from Management decisions associated
with significant corporate actions out of the ordinary course of
business –
e.g., merger/restructuring charges,
recapitalization actions, goodwill impairment, etc.
Even though certain revenue and expense items are naturally subject to more
volatility than others due to changes in market and economic environment
conditions, as a general rule volatility alone does not define a Significant Item. For
example, changes in the provision for credit losses, gains/losses from investment
activities, asset valuation write downs, etc., reflect ordinary banking
activities and are, therefore, typically excluded from consideration as a Significant Item.
Management believes the disclosure of “Significant Items”, when
appropriate, aids analysts/investors in better understanding corporate
performance and trends so that they can ascertain which of such items, if any, they may wish
to include/exclude from their analysis of the company’s performance
- i.e., within the context of determining how that
performance differed from their expectations, as well as how, if
at all, to adjust their estimates of future performance
accordingly. To this end, Management has adopted a practice of listing
“Significant Items” in its external disclosure
documents (e.g., earnings press releases, quarterly performance discussions,
investor presentations, Forms 10-Q and 10 K).
"Significant Items" for any particular period are not intended to be a
complete list of items that may materially impact current or future period
performance. A number of items could materially impact these periods, including those
described in Huntington’s 2012 Annual Report on Form 10-K and other
factors described from time to time in Huntington’s other filings with
the Securities and Exchange Commission. Basis of Presentation
17 |
    GAAP to
Non-GAAP Reconciliation 18
($000)
Total Noninterest
Income
Mortgage Banking
Income
Noninterest Income
Excluding Mortgage
3Q 2013
2Q 2013
Change
3Q 2013
2Q 2013
Change
3Q 2013
2Q 2013
Change
HBAN
250,405
249,065
1%
33,659
23,621
-30%
215,406
226,784
5%
ASBC
70,668
84,276
-16%
15,399
6,015
-61%
68,877
64,653
-6%
BBT
905,000
1,023,000
-12%
168,000
117,000
-30%
855,000
788,000
-8%
FHN
150,456
142,983
5%
5,589
14,460
159%
137,394
135,996
-1%
FITB
630,000
736,000
-14%
233,000
121,000
-48%
503,000
509,000
1%
FNFG
91,422
92,516
-1%
6,882
2,268
-67%
85,634
89,154
4%
MTB
481,269
454,685
6%
91,262
64,731
-29%
363,423
416,538
15%
PNC
1,582,000
1,666,000
-5%
167,000
199,000
19%
1,499,000
1,383,000
-8%
RF
468,000
489,000
-4%
69,000
52,000
-25%
420,000
416,000
-1%
STI
743,000
858,000
-13%
134,000
1,000
-99%
724,000
742,000
2%
Source: SNL Financial |
 19 |