Attached files
| file | filename |
|---|---|
| 8-K - 8-K - Globalstar, Inc. | v360335_8k.htm |
| EX-99.1 - EXHIBIT 99.1 - Globalstar, Inc. | v360335_ex99-1.htm |

Earnings Call Presentation Q3 2013 November 13, 2013

Safe Harbor Language This press release contains certain statements that are “forward - looking statements” within the meaning of the Private Securities Litigation Reform Act of 1995 . These forward - looking statements are based on current expectations and assumptions that are subject to risks and uncertainties which may cause actual results to differ materially from the forward - looking statements . Forward - looking statements, such as the statements regarding our expectations with respect to actions by the FCC, future increases in our revenue and profitability and other statements contained in this release regarding matters that are not historical facts, involve predictions . Any forward - looking statements made in this press release are accurate as of the date made and are not guarantees of future performance . Actual results or developments may differ materially from the expectations expressed or implied in the forward - looking statements, and we undertake no obligation to update any such statements . Additional information on factors that could influence our financial results is included in our filings with the Securities and Exchange Commission, including our Annual Report on Form 10 - K, Quarterly Reports on Form 10 - Q and Current Reports on Form 8 - K . 1

Globalstar has reached an Inflection Point… 2 Full Constellation Restoration New Product Rollouts … and is strategically poised for future growth & profitability FCC NPRM Released Financial Flexibility Through Refinancings All second - gen satellites have been placed into service Duplex service coverage has continued to improve materially – customers return in growing numbers In Q3 2013, Duplex gross subscriber additions, minutes of use and ARPU increased 129%, 23% and 29%, respectively, over the prior year period Three new products launched in 2013 including SPOT Global Phone, SPOT Gen3 TM and SPOT Trace TM – a miniature consumer asset tracking device, to be launched tomorrow Three additional products to be launched over the coming quarters – designed to expand addressable market through lower cost and enhanced functionality Successfully exchanged 5.75% Notes in May 2013 Amended and Restated COFACE Facility Agreement effective August 2013 Facility amendment provides material improvement to debt repayment schedule and financial covenants $85 million Thermo equity commitment / backstop Company poised to make strategic investments to reach full revenue potential On November 1, 2013, the Federal Communications Commission (“FCC”) voted unanimously to release Globalstar’s requested Notice of Proposed Rulemaking (“NPRM”) to provide a “Wi - Fi like” service over 22 MHz of spectrum including Globalstar’s licensed MSS spectrum (2483.5 - 2495 MHz) and the adjacent ISM spectrum (2473 - 2483.5 MHz) The FCC has established a comment cycle of 75 days and 105 days after publication in the Federal Register for initial and reply comments, respectively
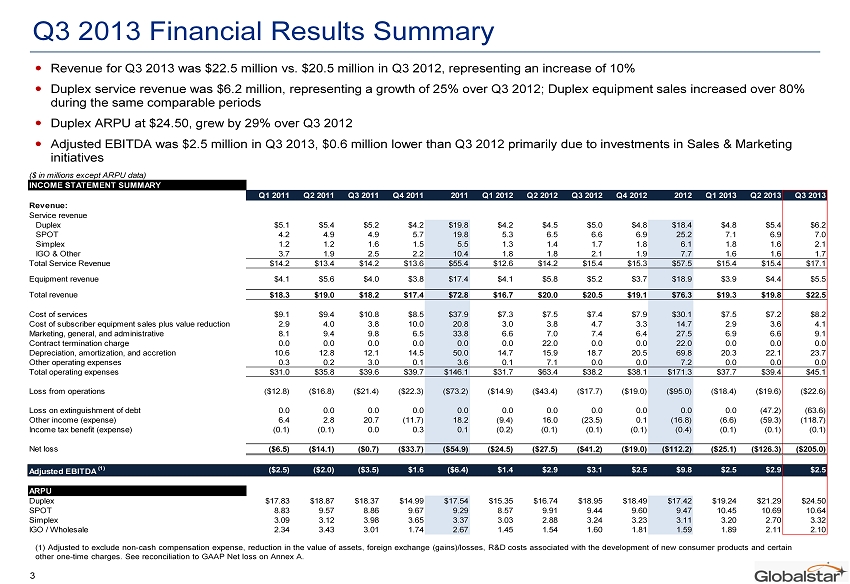
Q3 2013 Financial Results Summary Revenue for Q3 2013 was $22.5 million vs. $20.5 million in Q3 2012, representing an increase of 10% Duplex service revenue was $6.2 million, representing a growth of 25% over Q3 2012; Duplex equipment sales increased over 80% during the same comparable periods Duplex ARPU at $24.50, grew by 29% over Q3 2012 Adjusted EBITDA was $2.5 million in Q3 2013, $0.6 million lower than Q3 2012 primarily due to investments in Sales & Marketin g initiatives 3 ($ in millions except ARPU data) INCOME STATEMENT SUMMARY Q1 2011 Q2 2011 Q3 2011 Q4 2011 2011 Q1 2012 Q2 2012 Q3 2012 Q4 2012 2012 Q1 2013 Q2 2013 Q3 2013 Revenue: Service revenue Duplex $5.1 $5.4 $5.2 $4.2 $19.8 $4.2 $4.5 $5.0 $4.8 $18.4 $4.8 $5.4 $6.2 SPOT 4.2 4.9 4.9 5.7 19.8 5.3 6.5 6.6 6.9 25.2 7.1 6.9 7.0 Simplex 1.2 1.2 1.6 1.5 5.5 1.3 1.4 1.7 1.8 6.1 1.8 1.6 2.1 IGO & Other 3.7 1.9 2.5 2.2 10.4 1.8 1.8 2.1 1.9 7.7 1.6 1.6 1.7 Total Service Revenue $14.2 $13.4 $14.2 $13.6 $55.4 $12.6 $14.2 $15.4 $15.3 $57.5 $15.4 $15.4 $17.1 Equipment revenue $4.1 $5.6 $4.0 $3.8 $17.4 $4.1 $5.8 $5.2 $3.7 $18.9 $3.9 $4.4 $5.5 Total revenue $18.3 $19.0 $18.2 $17.4 $72.8 $16.7 $20.0 $20.5 $19.1 $76.3 $19.3 $19.8 $22.5 Cost of services $9.1 $9.4 $10.8 $8.5 $37.9 $7.3 $7.5 $7.4 $7.9 $30.1 $7.5 $7.2 $8.2 Cost of subscriber equipment sales plus value reduction 2.9 4.0 3.8 10.0 20.8 3.0 3.8 4.7 3.3 14.7 2.9 3.6 4.1 Marketing, general, and administrative 8.1 9.4 9.8 6.5 33.8 6.6 7.0 7.4 6.4 27.5 6.9 6.6 9.1 Contract termination charge 0.0 0.0 0.0 0.0 0.0 0.0 22.0 0.0 0.0 22.0 0.0 0.0 0.0 Depreciation, amortization, and accretion 10.6 12.8 12.1 14.5 50.0 14.7 15.9 18.7 20.5 69.8 20.3 22.1 23.7 Other operating expenses 0.3 0.2 3.0 0.1 3.6 0.1 7.1 0.0 0.0 7.2 0.0 0.0 0.0 Total operating expenses $31.0 $35.8 $39.6 $39.7 $146.1 $31.7 $63.4 $38.2 $38.1 $171.3 $37.7 $39.4 $45.1 Loss from operations ($12.8) ($16.8) ($21.4) ($22.3) ($73.2) ($14.9) ($43.4) ($17.7) ($19.0) ($95.0) ($18.4) ($19.6) ($22.6) Loss on extinguishment of debt 0.0 0.0 0.0 0.0 0.0 0.0 0.0 0.0 0.0 0.0 0.0 (47.2) (63.6) Other income (expense) 6.4 2.8 20.7 (11.7) 18.2 (9.4) 16.0 (23.5) 0.1 (16.8) (6.6) (59.3) (118.7) Income tax benefit (expense) (0.1) (0.1) 0.0 0.3 0.1 (0.2) (0.1) (0.1) (0.1) (0.4) (0.1) (0.1) (0.1) Net loss ($6.5) ($14.1) ($0.7) ($33.7) ($54.9) ($24.5) ($27.5) ($41.2) ($19.0) ($112.2) ($25.1) ($126.3) ($205.0) Adjusted EBITDA (1) ($2.5) ($2.0) ($3.5) $1.6 ($6.4) $1.4 $2.9 $3.1 $2.5 $9.8 $2.5 $2.9 $2.5 ARPU Duplex $17.83 $18.87 $18.37 $14.99 $17.54 $15.35 $16.74 $18.95 $18.49 $17.42 $19.24 $21.29 $24.50 SPOT 8.83 9.57 8.86 9.67 9.29 8.57 9.91 9.44 9.60 9.47 10.45 10.69 10.64 Simplex 3.09 3.12 3.98 3.65 3.37 3.03 2.88 3.24 3.23 3.11 3.20 2.70 3.32 IGO / Wholesale 2.34 3.43 3.01 1.74 2.67 1.45 1.54 1.60 1.81 1.59 1.89 2.11 2.10 (1) Adjusted to exclude non - cash compensation expense, reduction in the value of assets, foreign exchange (gains)/losses, R&D co sts associated with the development of new consumer products and certain other one - time charges. See reconciliation to GAAP Net loss on Annex A.

Globalstar’s Duplex Improvement 4 $15.35 $16.74 $18.95 $18.49 $19.24 $21.29 $24.50 $14.50 $16.50 $18.50 $20.50 $22.50 $24.50 $26.50 Q1 2012 Q2 2012 Q3 2012 Q4 2012 Q1 2013 Q2 2013 Q3 2013 $4.2 $4.5 $5.0 $4.8 $4.8 $5.4 $6.2 $3.5 $4.0 $4.5 $5.0 $5.5 $6.0 $6.5 Q1 2012 Q2 2012 Q3 2012 Q4 2012 Q1 2013 Q2 2013 Q3 2013 Duplex ARPU ($ in millions) Duplex Service Revenue After years of decline, principal Duplex data points are experiencing material growth Rollout of SPOT Global Phone, the first - of - its - kind consumer oriented satellite phone, expands Globalstar’s two - way market by leveraging our existing consumer network Usage on the network has increased significantly – 23% growth in minutes of use in Q3 2013 over the prior year period Gross subscriber additions of over 2x in Q3 2013 as compared to the prior year period Enterprise customers returning to Globalstar in key sectors such as Oil & Gas, Mining and Forestry, expanding market share in the MSS industry Globalstar’s core two - way business has experienced material growth as all second - gen satellites have been placed into service Key Highlights Duplex Equipment Revenue $0.8 $0.7 $1.2 $0.8 $1.1 $1.9 $2.1 $0.0 $0.5 $1.0 $1.5 $2.0 $2.5 Q1 2012 Q2 2012 Q3 2012 Q4 2012 Q1 2013 Q2 2013 Q3 2013 ($ in millions)

Critical Mobile Satellite Services During Disasters Areas Outside Cellular Networks Asset Tracking / Low Cost Alternative to International Roaming Source: Adventure Tourism Market Report by George Washington University, Adventure Travel Trade Association, Xola Consulting, Informa Telecoms & Media. (1) Adventure Tourism Market Report by George Washington University, Adventure Travel Trade Association, Xola Consulting. Statistic based on survey conducted with participants in Latin America, North America, and Europe. (2) CIA World Factbook , as of 2010. (3) Based on current plan “ Evolution III ” at $49.99 / month assuming 400 minutes per month of usage. Connectivity to nearly one billion people who live, work and/or play in areas not covered by cellular service Over a billion people work in industries that may require presence outside of cellular reach , such as Oil & Gas, Transportation and Forestry Over 150 million adventure trips taken annually (1) The majority of the world ’ s land mass is without terrestrial cellular coverage (2) Provides alternative network access in areas prone to natural disasters Provides public safety with needed connectivity when cellular service is down due to overloaded / failed infrastructure Enables basic services, NGOs, emergency response and business continuity Hurricane Katrina and Sandy are prime examples of Globalstar’s ability to provide critical Mobile Satellite Services Provides the ability to track anything, anywhere, anytime across the globe even where terrestrial networks exist Provides low cost alternative to international roaming charges when traveling abroad ‒ Traditional cellular companies can charge upwards of $2 – $3 per minute versus Globalstar unlimited usages plans which charge as little as $0.12 per minute for worldwide coverage (3) Globalstar’s Existing Target Market No Terrestrial Network Failure of Terrestrial Network Existing Terrestrial Network 5 Strictly Private and Confidential
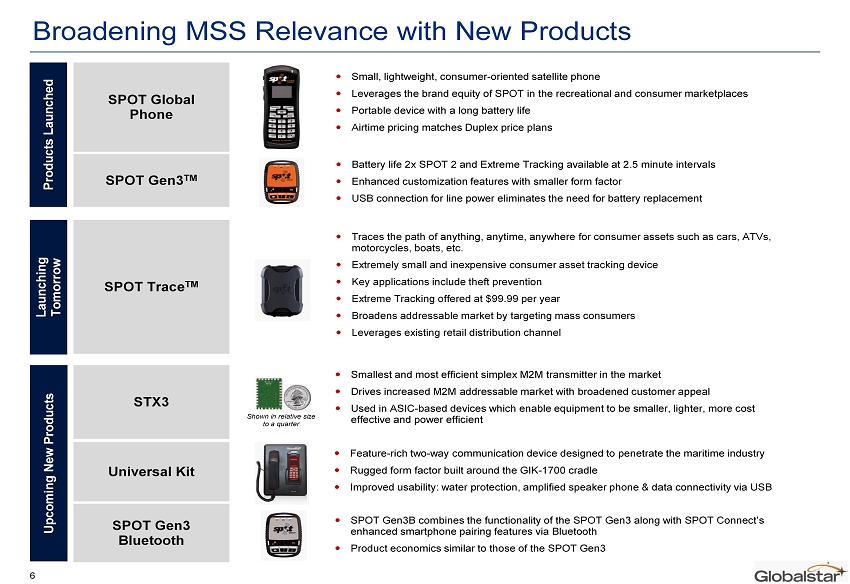
Broadening MSS Relevance with New Products 6 Products Launched Launching Tomorrow Upcoming New Products SPOT Global Phone SPOT Gen3 TM Small, lightweight, consumer - oriented satellite phone Leverages the brand equity of SPOT in the recreational and consumer marketplaces Portable device with a long battery life Airtime pricing matches Duplex price plans Battery life 2x SPOT 2 and Extreme Tracking available at 2.5 minute intervals Enhanced customization features with smaller form factor USB connection for line power eliminates the need for battery replacement SPOT Trace TM Traces the path of anything, anytime, anywhere for consumer assets such as cars, ATVs, motorcycles, boats, etc. Extremely small and inexpensive consumer asset tracking device Key applications include theft prevention Extreme Tracking offered at $99.99 per year Broadens addressable market by targeting mass consumers Leverages existing retail distribution channel STX3 Universal Kit SPOT Gen3 Bluetooth Smallest and most efficient simplex M2M transmitter in the market Drives increased M2M addressable market with broadened customer appeal Used in ASIC - based devices which enable equipment to be smaller, lighter, more cost effective and power efficient Feature - rich two - way communication device designed to penetrate the maritime industry Rugged form factor built around the GIK - 1700 cradle Improved usability: water protection, amplified speaker phone & data connectivity via USB SPOT Gen3B combines the functionality of the SPOT Gen3 along with SPOT Connect’s enhanced smartphone pairing features via Bluetooth Product economics similar to those of the SPOT Gen3 Shown in relative size to a quarter

FCC’s NPRM Highlights On November 1st, 2013, the FCC voted unanimously to release Globalstar’s requested NPRM to provide a “Wi - Fi like” service over 22 MHz of spectrum including Globalstar’s licensed MSS spectrum (2483.5 - 2495 MHz) and the adjacent ISM spectrum (2473 - 2483.5 MHz) 7 Recognizes Globalstar’s commitment to MSS First Permits Globalstar to offer low power mobile broadband services Second Substantially eliminates the ATC gating criteria as they relate to Globalstar’s provision of mobile broadband services Third No build out requirements imposed for terrestrial authority Fourth Major Highlights The FCC has established a comment cycle of 75 days and 105 days after publication in the Federal Register for initial and reply comments, respectively Requires Globalstar to protect other licensed services from harmful interference Fifth Proposes technical rules (power limits, OOBE rules) that strike an appropriate balance to protect other licensed and unlicensed interests Sixth Proposes equipment certification rules to minimize the burdens on device manufacturers Seventh

Successfully launched three products in 2013 including SPOT Trace TM that will make its debut tomorrow; three additional products to be launched over the coming quarters 10,000 retail points of distribution and over 2,000 dealers / resellers / VARs New products designed to expand addressable market through lower costs and enhanced functionality Globalstar Value Drivers Operational Improvements & Low Cost Scalable Network New Products Expanding Addressable Market Sales & Operational Momentum Valuable Spectrum Assets With all second - gen satellites providing service, Globalstar has achieved full Duplex service restoration Debt refinancing provides financial flexibility and eliminates near - term financial uncertainty Second - gen provides considerable cost benefits and significant voice and data capacity (34 billion text messages or 19 million voice or data minutes per day) Continued momentum in revenue growth drivers Duplex MOUs increase 23% over the prior year period Duplex ARPU increased 29% over Q3 2012 10% increase in revenue over the prior year period Non - replicable, globally - harmonized spectrum Unique spectrum position allows for rapid deployment of 22 MHz of 2.4 GHz spectrum for consumer broadband service to relieve existing Wi - Fi congestion FCC voted unanimously to release Globalstar’s requested NPRM to provide a “Wi - Fi like” service Leverage an inflection point into multiple, transformative opportunities 8
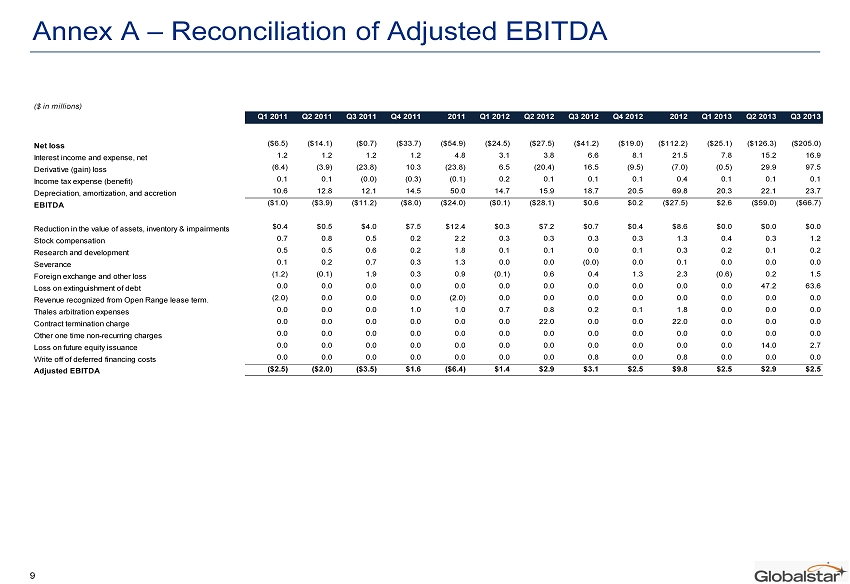
Annex A – Reconciliation of Adjusted EBITDA 9 ($ in millions) Q1 2011 Q2 2011 Q3 2011 Q4 2011 2011 Q1 2012 Q2 2012 Q3 2012 Q4 2012 2012 Q1 2013 Q2 2013 Q3 2013 . Net loss ($6.5) ($14.1) ($0.7) ($33.7) ($54.9) ($24.5) ($27.5) ($41.2) ($19.0) ($112.2) ($25.1) ($126.3) ($205.0) Interest income and expense, net 1.2 1.2 1.2 1.2 4.8 3.1 3.8 6.6 8.1 21.5 7.8 15.2 16.9 Derivative (gain) loss (6.4) (3.9) (23.8) 10.3 (23.8) 6.5 (20.4) 16.5 (9.5) (7.0) (0.5) 29.9 97.5 Income tax expense (benefit) 0.1 0.1 (0.0) (0.3) (0.1) 0.2 0.1 0.1 0.1 0.4 0.1 0.1 0.1 Depreciation, amortization, and accretion 10.6 12.8 12.1 14.5 50.0 14.7 15.9 18.7 20.5 69.8 20.3 22.1 23.7 EBITDA ($1.0) ($3.9) ($11.2) ($8.0) ($24.0) ($0.1) ($28.1) $0.6 $0.2 ($27.5) $2.6 ($59.0) ($66.7) Reduction in the value of assets, inventory & impairments $0.4 $0.5 $4.0 $7.5 $12.4 $0.3 $7.2 $0.7 $0.4 $8.6 $0.0 $0.0 $0.0 Stock compensation 0.7 0.8 0.5 0.2 2.2 0.3 0.3 0.3 0.3 1.3 0.4 0.3 1.2 Research and development 0.5 0.5 0.6 0.2 1.8 0.1 0.1 0.0 0.1 0.3 0.2 0.1 0.2 Severance 0.1 0.2 0.7 0.3 1.3 0.0 0.0 (0.0) 0.0 0.1 0.0 0.0 0.0 Foreign exchange and other loss (1.2) (0.1) 1.9 0.3 0.9 (0.1) 0.6 0.4 1.3 2.3 (0.6) 0.2 1.5 Loss on extinguishment of debt 0.0 0.0 0.0 0.0 0.0 0.0 0.0 0.0 0.0 0.0 0.0 47.2 63.6 Revenue recognized from Open Range lease term. (2.0) 0.0 0.0 0.0 (2.0) 0.0 0.0 0.0 0.0 0.0 0.0 0.0 0.0 Thales arbitration expenses 0.0 0.0 0.0 1.0 1.0 0.7 0.8 0.2 0.1 1.8 0.0 0.0 0.0 Contract termination charge 0.0 0.0 0.0 0.0 0.0 0.0 22.0 0.0 0.0 22.0 0.0 0.0 0.0 Other one time non-recurring charges 0.0 0.0 0.0 0.0 0.0 0.0 0.0 0.0 0.0 0.0 0.0 0.0 0.0 Loss on future equity issuance 0.0 0.0 0.0 0.0 0.0 0.0 0.0 0.0 0.0 0.0 0.0 14.0 2.7 Write off of deferred financing costs 0.0 0.0 0.0 0.0 0.0 0.0 0.0 0.8 0.0 0.8 0.0 0.0 0.0 Adjusted EBITDA ($2.5) ($2.0) ($3.5) $1.6 ($6.4) $1.4 $2.9 $3.1 $2.5 $9.8 $2.5 $2.9 $2.5