Attached files
| file | filename |
|---|---|
| 8-K - 8-K - Premier, Inc. | a13-23910_18k.htm |
| EX-99.1 - EX-99.1 - Premier, Inc. | a13-23910_1ex99d1.htm |
Exhibit 99.2
|
|
Fiscal 2014 first quarter review November 12, 2013 |
|
|
Forward-looking statements and Non-GAAP financial measures Forward-looking statements—Certain statements made during this conference call, including those related to our financial and business outlook and financial guidance, are “forward-looking statements.” Forward-looking statements may involve known and unknown risks, uncertainties and other factors that may cause the actual results of Premier to be materially different from historical results or from any future results or projections expressed or implied by such forward-looking statements. Accordingly, readers should not place undue reliance on any forward looking statements. Readers are urged to consider statements in the conditional or future tenses or that include terms such as “believes,” “belief,” “expects,” “estimates,” “intends,” “anticipates” or “plans” to be uncertain and forward-looking. Forward-looking statements may include comments as to Premier’s beliefs and expectations as to future events and trends affecting its business and are necessarily subject to uncertainties, many of which are outside Premier’s control. More information on potential risks and other factors that could affect Premier’s financial results is included, and updated, from time to time, in Premier’s periodic and current filings with the SEC, as well as those discussed in Premier’s IPO Prospectus filed with the SEC and available on Premier’s website. Forward looking statements speak only as of the date they are made. Premier undertakes no obligation to publicly update or revise any forward-looking statements. Non-GAAP financial measures—This presentation includes certain “non-GAAP financial measures” as defined in Regulation G under the Securities Exchange Act of 1934. Schedules are attached that reconcile the non-GAAP financial measures included in the following presentation to the most directly comparable financial measures calculated and presented in accordance with Generally Accepted Accounting Principles in the United States. The press release attached as Exhibit 99.1 to our Form 8-K, dated November 11, 2013, as well as our Form 10-Q for the quarter ended September 30, 2013 to be filed in the next few days, provides further explanation and disclosure regarding our use of non-GAAP financial measures and should be read in conjunction with these supplemental slides. |
|
|
Overview Susan DeVore President and CEO |
|
|
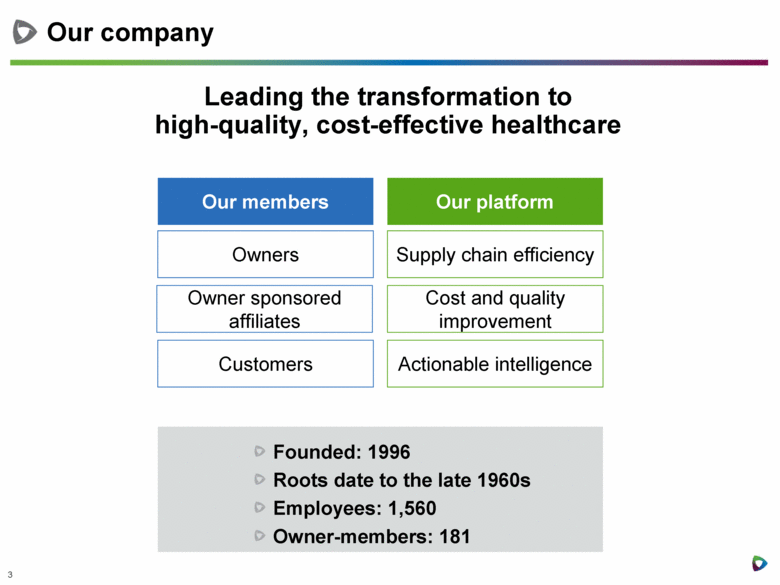
Our company Leading the transformation to high-quality, cost-effective healthcare Our members Our platform Owners Supply chain efficiency Customers Cost and quality improvement Actionable intelligence Owner sponsored affiliates Founded: 1996 Roots date to the late 1960s Employees: 1,560 Owner-members: 181 |
|
|
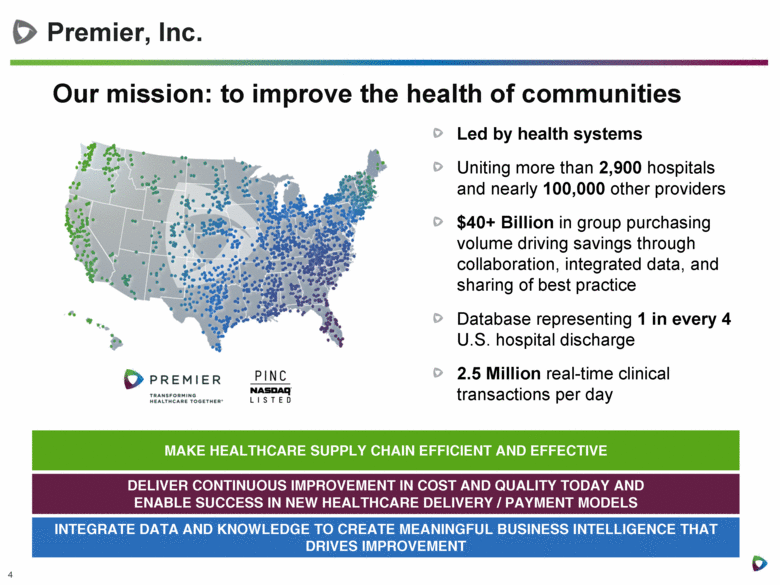
Premier, Inc. Led by health systems Uniting more than 2,900 hospitals and nearly 100,000 other providers $40+ Billion in group purchasing volume driving savings through collaboration, integrated data, and sharing of best practice Database representing 1 in every 4 U.S. hospital discharge 2.5 Million real-time clinical transactions per day Our mission: to improve the health of communities MAKE HEALTHCARE SUPPLY CHAIN EFFICIENT AND EFFECTIVE DELIVER CONTINUOUS IMPROVEMENT IN COST AND QUALITY TODAY AND ENABLE SUCCESS IN NEW HEALTHCARE DELIVERY / PAYMENT MODELS INTEGRATE DATA AND KNOWLEDGE TO CREATE MEANINGFUL BUSINESS INTELLIGENCE THAT DRIVES IMPROVEMENT |
|
|
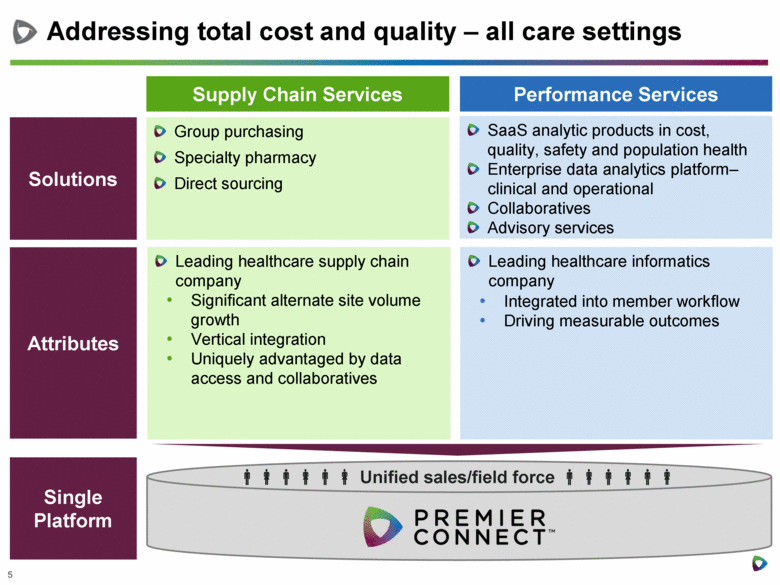
Addressing total cost and quality – all care settings Unified sales/field force Solutions Attributes Single Platform Group purchasing Specialty pharmacy Direct sourcing Leading healthcare supply chain company Significant alternate site volume growth Vertical integration Uniquely advantaged by data access and collaboratives Leading healthcare informatics company Integrated into member workflow Driving measurable outcomes SaaS analytic products in cost, quality, safety and population health Enterprise data analytics platform–clinical and operational Collaboratives Advisory services Supply Chain Services Performance Services |
|
|
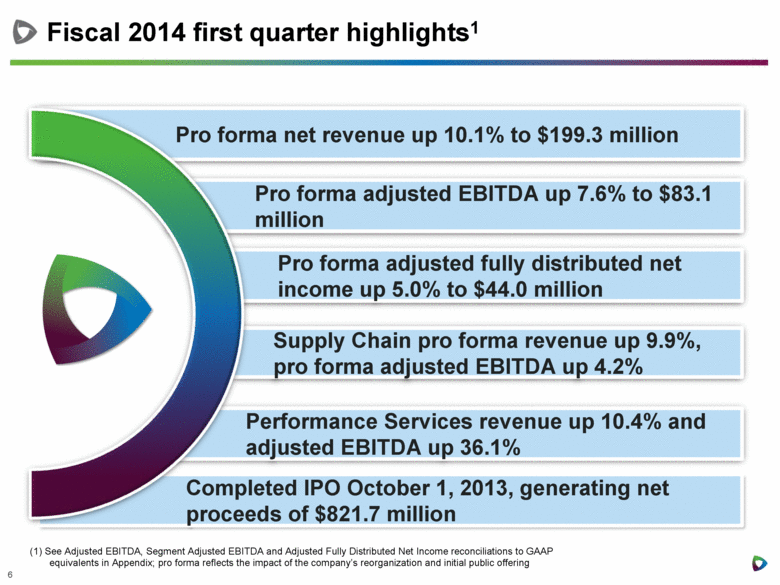
Fiscal 2014 first quarter highlights1 Pro forma adjusted EBITDA up 7.6% to $83.1 million Supply Chain pro forma revenue up 9.9%, pro forma adjusted EBITDA up 4.2% Pro forma adjusted fully distributed net income up 5.0% to $44.0 million Performance Services revenue up 10.4% and adjusted EBITDA up 36.1% Completed IPO October 1, 2013, generating net proceeds of $821.7 million Pro forma net revenue up 10.1% to $199.3 million (1) See Adjusted EBITDA, Segment Adjusted EBITDA and Adjusted Fully Distributed Net Income reconciliations to GAAP equivalents in Appendix; pro forma reflects the impact of the company’s reorganization and initial public offering |
|
|
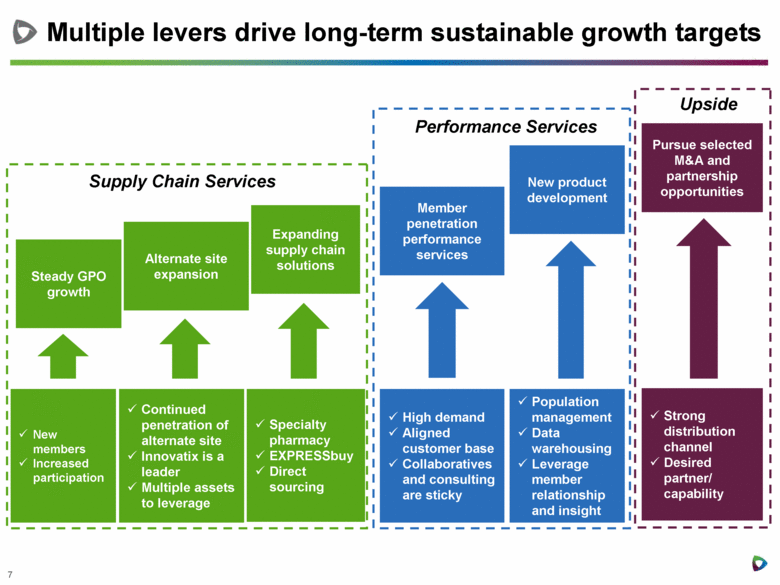
Expanding supply chain solutions Steady GPO growth Multiple levers drive long-term sustainable growth targets Upside Performance Services Supply Chain Services Alternate site expansion New members Increased participation Continued penetration of alternate site Innovatix is a leader Multiple assets to leverage Specialty pharmacy EXPRESSbuy Direct sourcing Member penetration performance services High demand Aligned customer base Collaboratives and consulting are sticky New product development Population management Data warehousing Leverage member relationship and insight Pursue selected M&A and partnership opportunities Strong distribution channel Desired partner/ capability |
|
|
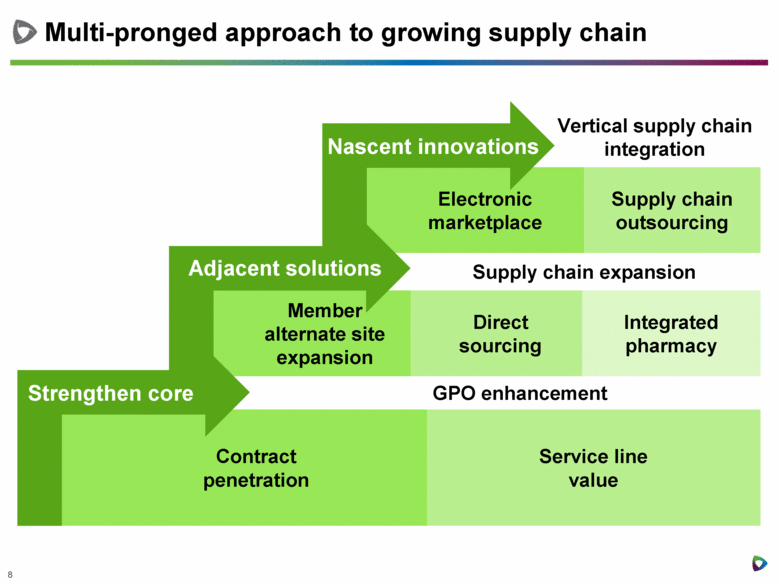
Electronic marketplace Member alternate site expansion Direct sourcing Contract penetration Multi-pronged approach to growing supply chain Service line value Integrated pharmacy Supply chain outsourcing Vertical supply chain integration Supply chain expansion GPO enhancement Strengthen core Adjacent solutions Nascent innovations |
|
|
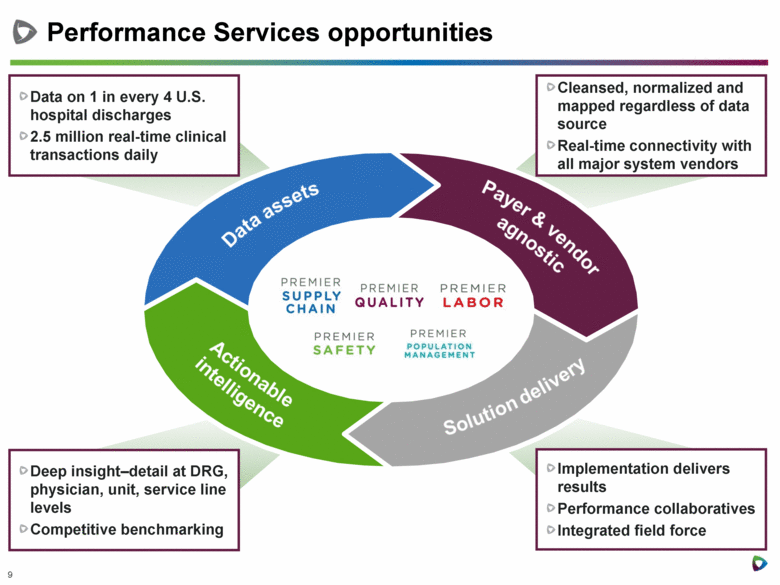
Performance Services opportunities Data on 1 in every 4 U.S. hospital discharges 2.5 million real-time clinical transactions daily Cleansed, normalized and mapped regardless of data source Real-time connectivity with all major system vendors Implementation delivers results Performance collaboratives Integrated field force Deep insight–detail at DRG, physician, unit, service line levels Competitive benchmarking |
|
|
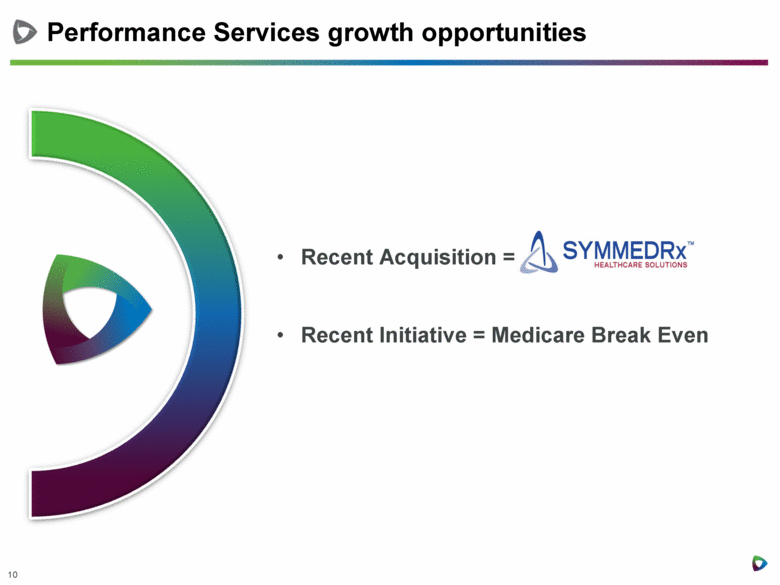
Performance Services growth opportunities Recent Acquisition = Recent Initiative = Medicare Break Even |
|
|
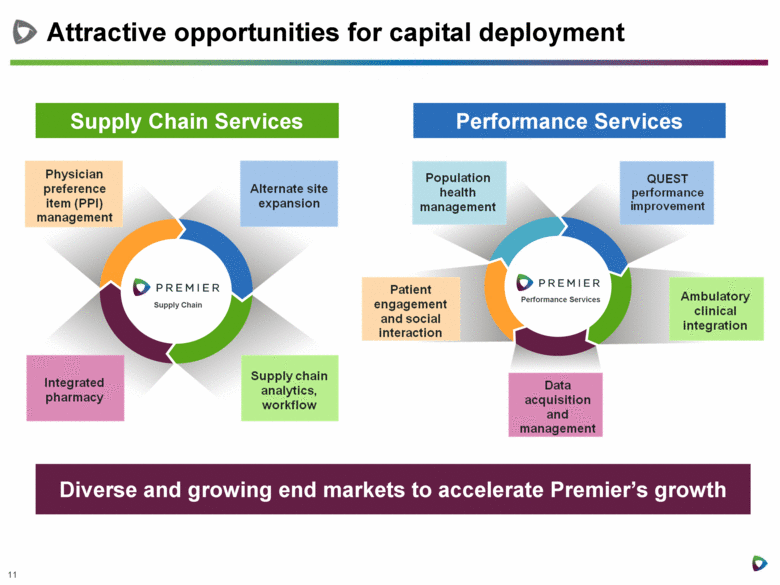
Attractive opportunities for capital deployment Performance Services Supply Chain Services Performance Services Diverse and growing end markets to accelerate Premier’s growth Supply Chain |
|
|
Financial review Craig McKasson Chief Financial Officer |
|
|
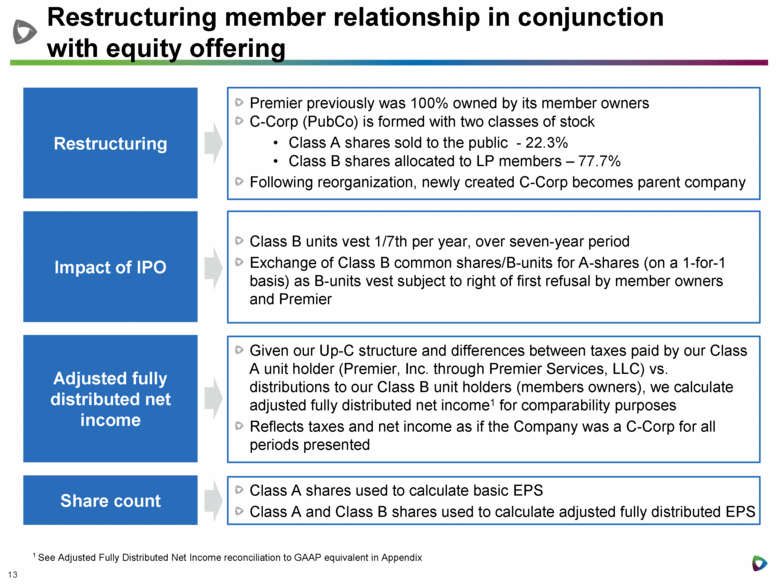
Restructuring Restructuring member relationship in conjunction with equity offering Premier previously was 100% owned by its member owners C-Corp (PubCo) is formed with two classes of stock Class A shares sold to the public - 22.3% Class B shares allocated to LP members – 77.7% Following reorganization, newly created C-Corp becomes parent company Class B units vest 1/7th per year, over seven-year period Exchange of Class B common shares/B-units for A-shares (on a 1-for-1 basis) as B-units vest subject to right of first refusal by member owners and Premier Given our Up-C structure and differences between taxes paid by our Class A unit holder (Premier, Inc. through Premier Services, LLC) vs. distributions to our Class B unit holders (members owners), we calculate adjusted fully distributed net income1 for comparability purposes Reflects taxes and net income as if the Company was a C-Corp for all periods presented Class A shares used to calculate basic EPS Class A and Class B shares used to calculate adjusted fully distributed EPS 1 See Adjusted Fully Distributed Net Income reconciliation to GAAP equivalent in Appendix Impact of IPO Adjusted fully distributed net income Share count |
|
|
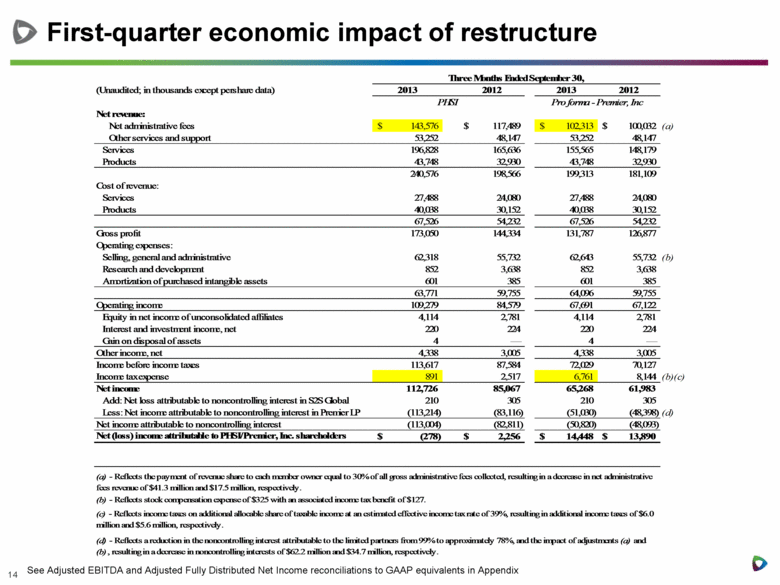
First-quarter economic impact of restructure See Adjusted EBITDA and Adjusted Fully Distributed Net Income reconciliations to GAAP equivalents in Appendix (Unaudited; in thousands except pershare data) 2013 2012 2013 2012 Net revenue: Net administrative fees 143,576 $ 117,489 $ 102,313 $ 100,032 $ (a) Other services and support 53,252 48,147 53,252 48,147 Services 196,828 165,636 155,565 148,179 Products 43,748 32,930 43,748 32,930 240,576 198,566 199,313 181,109 Cost of revenue: Services 27,488 24,080 27,488 24,080 Products 40,038 30,152 40,038 30,152 67,526 54,232 67,526 54,232 Gross profit 173,050 144,334 131,787 126,877 Operating expenses: Selling, general and administrative 62,318 55,732 62,643 55,732 (b) Research and development 852 3,638 852 3,638 Amortization of purchased intangible assets 601 385 601 385 63,771 59,755 64,096 59,755 Operating income 109,279 84,579 67,691 67,122 Equity in net income of unconsolidated affiliates 4,114 2,781 4,114 2,781 Interest and investment income, net 220 224 220 224 Gain on disposal of assets 4 — 4 — Other income, net 4,338 3,005 4,338 3,005 Income before income taxes 113,617 87,584 72,029 70,127 Income tax expense 891 2,517 6,761 8,144 (b)(c) Net income 112,726 85,067 65,268 61,983 Add: Net loss attributable to noncontrolling interest in S2S Global 210 305 210 305 Less: Net income attributable to noncontrolling interest in Premier LP (113,214) (83,116) (51,030) (48,398) (d) Net income attributable to noncontrolling interest (113,004) (82,811) (50,820) (48,093) Net (loss) income attributable to PHSI/Premier, Inc. shareholders (278) $ 2,256 $ 14,448 $ 13,890 $ (d) - Reflects a reduction in the noncontrolling interest attributable to the limited partners from 99% to approximately 78%, and the impact of adjustments (a) and (b) , resulting in a decrease in noncontrolling interests of $62.2 million and $34.7 million, respectively. (b) - Reflects stock compensation expense of $325 with an associated income tax benefit of $127. Three Months Ended September 30, PHSI Pro forma - Premier, Inc (a) - Reflects the payment of revenue share to each member owner equal to 30% of all gross administrative fees collected, resulting in a decrease in net administrative fees revenue of $41.3 million and $17.5 million, respectively. (c) - Reflects income taxes on additional allocable share of taxable income at an estimated effective income tax rate of 39%, resulting in additional income taxes of $6.0 million and $5.6 million, respectively. |
|
|
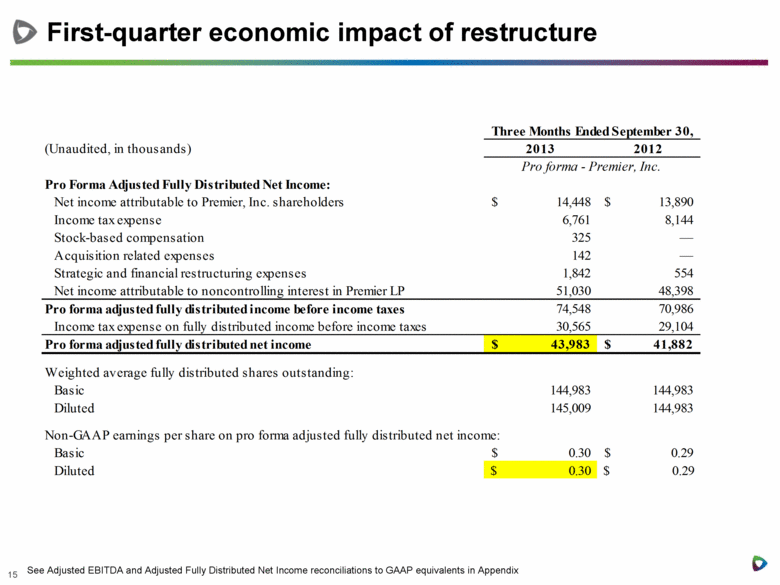
First-quarter economic impact of restructure See Adjusted EBITDA and Adjusted Fully Distributed Net Income reconciliations to GAAP equivalents in Appendix (Unaudited, in thousands) 2013 2012 Pro Forma Adjusted Fully Distributed Net Income: Net income attributable to Premier, Inc. shareholders 14,448 $ 13,890 $ Income tax expense 6,761 8,144 Stock-based compensation 325 — Acquisition related expenses 142 — Strategic and financial restructuring expenses 1,842 554 Net income attributable to noncontrolling interest in Premier LP 51,030 48,398 Pro forma adjusted fully distributed income before income taxes 74,548 70,986 Income tax expense on fully distributed income before income taxes 30,565 29,104 Pro forma adjusted fully distributed net income 43,983 $ 41,882 $ Weighted average fully distributed shares outstanding: Basic 144,983 144,983 Diluted 145,009 144,983 Non-GAAP earnings per share on pro forma adjusted fully distributed net income: Basic 0.30 $ 0.29 $ Diluted $ 0.30 $ 0.29 Pro forma - Premier, Inc. Three Months Ended September 30, |
|
|
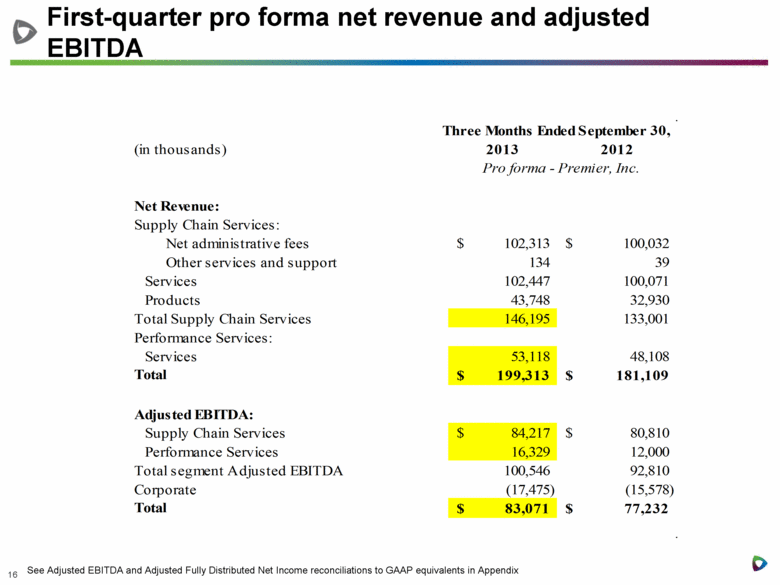
First-quarter pro forma net revenue and adjusted EBITDA See Adjusted EBITDA and Adjusted Fully Distributed Net Income reconciliations to GAAP equivalents in Appendix (in thousands) 2013 2012 Net Revenue: Supply Chain Services: Net administrative fees 102,313 $ 100,032 $ Other services and support 134 39 Services 102,447 100,071 Products 43,748 32,930 Total Supply Chain Services 146,195 133,001 Performance Services: Services 53,118 48,108 Total 199,313 $ 181,109 $ Adjusted EBITDA: Supply Chain Services 84,217 $ 80,810 $ Performance Services 16,329 12,000 Total segment Adjusted EBITDA 100,546 92,810 Corporate (17,475) (15,578) Total 83,071 $ 77,232 $ Three Months Ended September 30, Pro forma - Premier, Inc. |
|
|
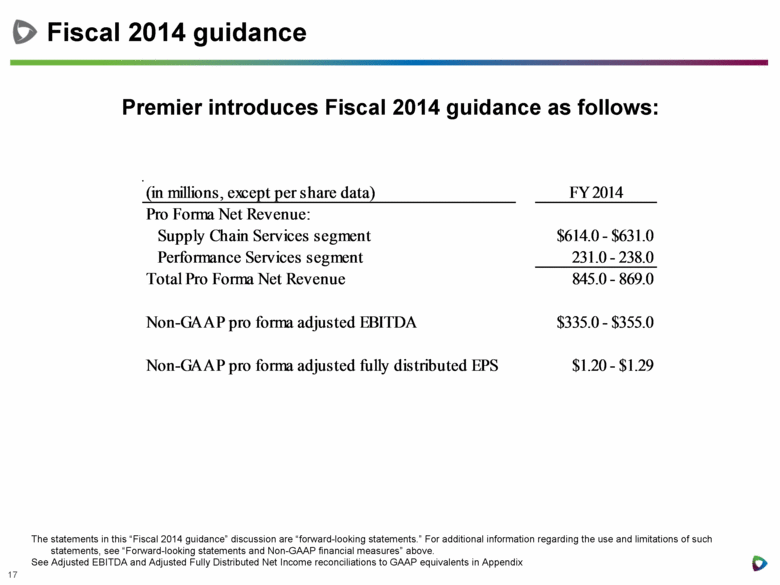
Fiscal 2014 guidance The statements in this “Fiscal 2014 guidance” discussion are “forward-looking statements.” For additional information regarding the use and limitations of such statements, see “Forward-looking statements and Non-GAAP financial measures” above. See Adjusted EBITDA and Adjusted Fully Distributed Net Income reconciliations to GAAP equivalents in Appendix Premier introduces Fiscal 2014 guidance as follows: (in millions, except per share data) FY 2014 Pro Forma Net Revenue: Supply Chain Services segment $614.0 - $631.0 Performance Services segment 231.0 - 238.0 Total Pro Forma Net Revenue 845.0 - 869.0 Non-GAAP pro forma adjusted EBITDA $335.0 - $355.0 Non-GAAP pro forma adjusted fully distributed EPS $1.20 - $1.29 |
|
|
Summary and questions Susan DeVore President and CEO Michael Alkire Chief Operating Officer Craig McKasson Chief Financial Officer |
|
|
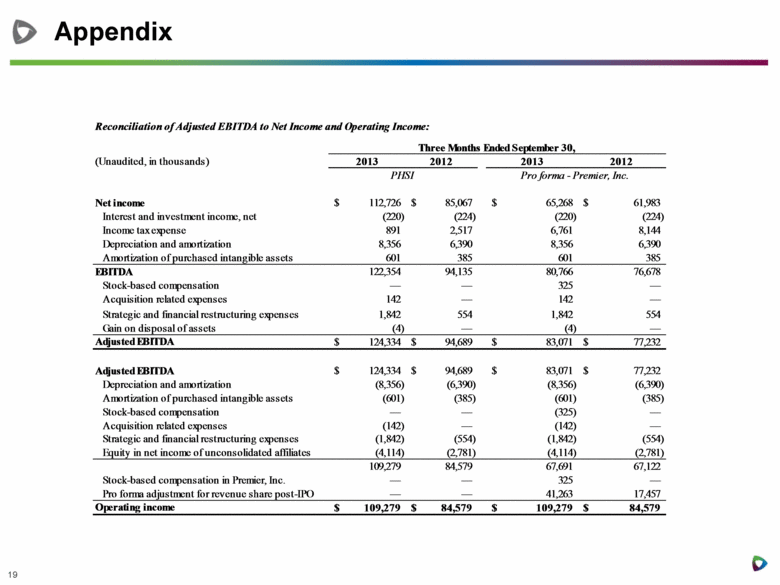
Appendix 19 Reconciliation of Adjusted EBITDA to Net Income and Operating Income: (Unaudited, in thousands) 2013 2012 2013 2012 Net income 112,726 $ 85,067 $ 65,268 $ 61,983 $ Interest and investment income, net (220) (224) (220) (224) Income tax expense 891 2,517 6,761 8,144 Depreciation and amortization 8,356 6,390 8,356 6,390 Amortization of purchased intangible assets 601 385 601 385 EBITDA 122,354 94,135 80,766 76,678 Stock-based compensation — — 325 — Acquisition related expenses 142 — 142 — Strategic and financial restructuring expenses 1,842 554 1,842 554 Gain on disposal of assets (4) — (4) — Adjusted EBITDA 124,334 $ 94,689 $ 83,071 $ 77,232 $ Adjusted EBITDA 124,334 $ 94,689 $ 83,071 $ 77,232 $ Depreciation and amortization (8,356) (6,390) (8,356) (6,390) Amortization of purchased intangible assets (601) (385) (601) (385) Stock-based compensation — — (325) — Acquisition related expenses (142) — (142) — Strategic and financial restructuring expenses (1,842) (554) (1,842) (554) Equity in net income of unconsolidated affiliates (4,114) (2,781) (4,114) (2,781) 109,279 84,579 67,691 67,122 Stock-based compensation in Premier, Inc. — — 325 — Pro forma adjustment for revenue share post-IPO — — 41,263 17,457 Operating income 109,279 $ 84,579 $ 109,279 $ 84,579 $ PHSI Pro forma - Premier, Inc. Supplemental Financial Information (Unaudited) (In thousands) Three Months Ended September 30, |
|
|
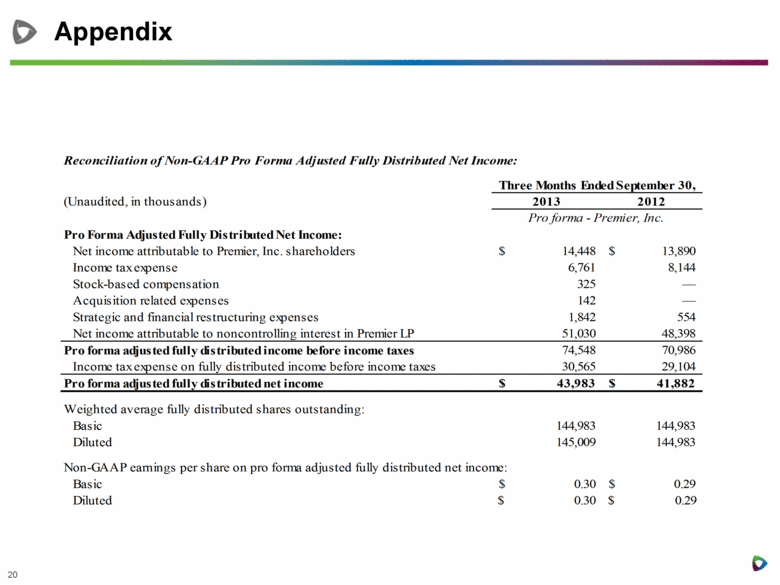
Appendix 20 Reconciliation of Non-GAAP Pro Forma Adjusted Fully Distributed Net Income: (Unaudited, in thousands) 2013 2012 Pro Forma Adjusted Fully Distributed Net Income: Net income attributable to Premier, Inc. shareholders 14,448 $ 13,890 $ Income tax expense 6,761 8,144 Stock-based compensation 325 — Acquisition related expenses 142 — Strategic and financial restructuring expenses 1,842 554 Net income attributable to noncontrolling interest in Premier LP 51,030 48,398 Pro forma adjusted fully distributed income before income taxes 74,548 70,986 Income tax expense on fully distributed income before income taxes 30,565 29,104 Pro forma adjusted fully distributed net income 43,983 $ 41,882 $ Weighted average fully distributed shares outstanding: Basic 144,983 144,983 Diluted 145,009 144,983 Non-GAAP earnings per share on pro forma adjusted fully distributed net income: Basic 0.30 $ 0.29 $ Diluted $ 0.30 $ 0.29 Pro forma - Premier, Inc. Three Months Ended September 30, Supplemental Financial Information (Unaudited) (In thousands) |
|
|
Thank you 21 |

