Attached files
| file | filename |
|---|---|
| 8-K - CURRENT REPORT - POWERSECURE INTERNATIONAL, INC. | d625063d8k.htm |
| EX-99.1 - PRESS RELEASE - POWERSECURE INTERNATIONAL, INC. | d625063dex991.htm |
 Stephens
2013 Fall Investment Conference
November 12, 2013
Sidney Hinton, Chief Executive Officer
Exhibit 99.2 |
 2 | ©
2013 PowerSecure. All rights reserved.
Forward Looking Statements
Safe Harbor
All forward-looking statements made in this presentation are made
under the safe harbor provisions of the Private Securities Litigation
Reform Act of 1995. Forward-looking statements, which are all
statements other than statements of historical facts and include beliefs,
opinions, estimates, and projections about future business
developments and opportunities and financial guidance, are not
guarantees of future performance or events but are subject to risks,
uncertainties and other factors that could cause actual results to differ
materially from those expressed, projected or implied, including risks
and uncertainties set forth in the Company's SEC filings, including but
not limited to the Company’s most recent Form 10-K and subsequent
filings on Form 8-K and 10-Q. Any forward-looking statements in this
presentation speak only as of the date hereof, and the Company
assumes no duty or obligation to update or revise any forward-looking
statements.
|
 3 | ©
2013 PowerSecure. All rights reserved.
NYSE:
POWR
PowerSecure: Who We Are Today
Backlog:
$240M
(37% YoY Growth)
>750
Employees
Growing
Earnings Per Share &
Operating Margins
Strong
Balance Sheet
TTM Revenues:
$243M
(57% YoY Growth)
Headquarters:
Wake Forest, NC |
 PowerSecure: Utility Focused
Energy Efficiency
Products/Services
Utility
Infrastructure
Solutions
IDG Power
Systems
4 | ©
2013 PowerSecure. All rights reserved.
Utilities
And Their
Large
Customers |
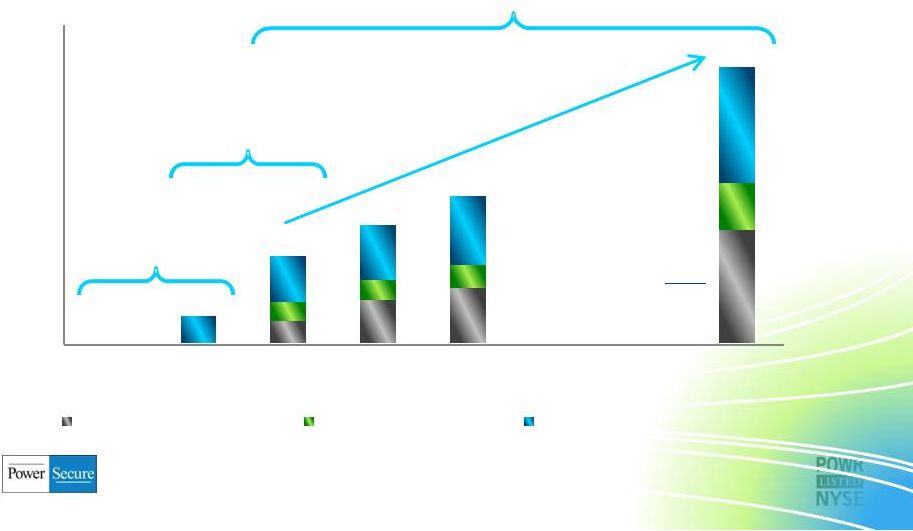 Revenue Scaling Quickly to
$300M Target
0
50
100
150
200
250
300
350
2000 Start-
up
2005
2010
2011
2012
2013
2014
2015
Goals
Utility Infrastructure
Energy Efficiency
Distributed Generation
"Foundation"
2005-2010
26%+
Growth, 3.2X
"Scale
and Profitable Growth
"
2010-2015
Goal
26%+
Growth, 3.1X
$96
$162
$300
($ millions)
"Start-up"
2000-2005
1000%+
Growth
Compound Growth
2010-2015
Utility
Infrastructure
+39%
Energy Efficiency
+20%
Distributed Generation
+20%
Total
+26%
$130
61
25
76
47
23
60
24
21
51
30
5 | ©
2013 PowerSecure. All rights reserved. |
       6 | ©
2013 PowerSecure. All rights reserved.
3Q13 Results
(in millions)
Numbers may non add due to rounding
Y-O-Y Variance
See non-GAAP discussion and reconciliation
3Q13
3Q12
%
Revenue
Distributed Generation
40.6
25.1
62%
Utility Infrastructure
24.2
14.0
72%
Energy Efficiency
16.7
5.1
225%
Total Revenue
81.5
44.2
84%
Gross Profit
21.5
13.9
55%
Gross Profit % Revenue
26.3%
31.4%
-5.1
pp
Operating Income
5.9
0.5
1112%
Operating Profit % Revenue
7.3 %
1.1%
+6.2
pp
GAAP E.P.S.
$0.17
$0.03
+ $0.14
Non-GAAP E.P.S.
$0.17
$0.08
+ $0.09 |
 7 | ©
2013 PowerSecure. All rights reserved.
•
Operating margins increasing
•
Increasing scale across all business lines
•
2012 cost reduction program enhances OpEx leverage
•
Major investment to build UI business from scratch in ‘07
now completed
•
Decreasing OpEx as % of revenue
•
2013 Adjusted EBITDA target: >$20M
Meaningful Bottom Line Leverage
See non-GAAP discussion and reconciliation |
 8 | ©
2013 PowerSecure. All rights reserved.
2011 Progression
Revenue
E.P.S. --
Non-GAAP
Continuing Ops
E.P.S. --
GAAP
$0.25 $0.90
$0.05 $0.06 See non-GAAP
discussion and reconciliation $24
$30
$37
$40
$0
$5
$10
$15
$20
$25
$30
$35
$40
$45
$50
1Q11
2Q11
3Q11
4Q11
(0.09)
(0.03)
0.05
0.05
($0.10)
($0.05)
$0.00
$0.05
$0.10
$0.15
1Q11
2Q11
3Q11
4Q11 |
 See
non-GAAP discussion and reconciliation 9 |
© 2013 PowerSecure. All rights reserved.
2012 Progression
E.P.S. --
Non-GAAP
Continuing Ops
E.P.S. --
GAAP
($0.03)
$0.09 $0.03 $0.08
1Q12
2Q12
3Q12
4Q12
$0
$5
$10
$15
$20
$25
$30
$35
$40
$45
$50
$33
$38
$44
$47
($0.10)
($0.05)
$0.00
$0.05
$0.10
$0.15
(0.03)
2Q12
3Q12
4Q12
0.04
0.08
0.13
See non-GAAP discussion and reconciliation
9 | ©
2013 PowerSecure. All rights reserved.
Revenue |
 Revenue
2013 Progression
E.P.S. --
Non-GAAP
Continuing Ops
E.P.S. --
GAAP
$0.04
$0.11 $0.17
See non-GAAP discussion and reconciliation
$45
$70
$82
$0
$10
$20
$30
$40
$50
$60
$70
$80
$90
1Q13
2Q13
3Q13
$0.04
$0.12
0.17
$0.00
$0.05
$0.10
$0.15
$0.20
1Q13
2Q13
3Q13
10 | ©
2013 PowerSecure. All rights reserved. |
 •
At end of Q3 2013:
-
$54.1 M in Cash
-
Locked in interest rate on $25 M term loan at 3.73%
-
Untapped $20 M revolver
•
Anticipate 2013 Adjusted EBITDA >$20 M
•
Potential uses of capital:
-
Additional investment in company-owned DG projects
-
Potential acquisitions
-
Working capital
-
Equipment to support growth in UI
Robust Balance Sheet
11 | ©
2013 PowerSecure. All rights reserved. |
 •
Provides cybersecurity and NERC-CIP
compliance consulting services to
utility industry
•
Opportunity for PowerSecure to expand
UI service offerings to world-class Encari
customer base
•
PowerSecure can bring Encari’s
expertise to existing UI customers
•
Accretive to UI gross margin
Recent Acquisitions Add Value
12 | ©
2013 PowerSecure. All rights reserved.
Purchased
Encari for $4.8M
October 2013 |
 Recent Acquisitions Add Value
•
Successful 20-yr old business serving
major ESCOs with lighting, mechanical,
water and building envelope solutions
to deliver energy efficiency savings
•
Significantly expands our Energy
Efficiency offerings
•
Opens new customer channels for
LED lighting and peak shaving
•
Purchase included $27M in awarded
projects
•
Accretive in 2013
Purchased
ESCO services
business
for $5.5M
February 2013
13 | ©
2013 PowerSecure. All rights reserved. |
 Recent Acquisitions Add Value
•
Solais has significant sourcing and
manufacturing expertise
•
Adds substantial efficiencies to
manufacturing of PowerSecure’s
existing LED solutions
•
Outstanding proprietary portfolio of LED
lamps and fixtures for commercial and
Industrial applications
•
Superior light output, thermal
management, optics, light quality and
aesthetics
•
Anticipating $4M-$6M charge in Q4
2013/Q1 2014 to accelerate
manufacturing synergies
Purchased
Solais lighting
business
for $15 M
April 2013
14 | ©
2013 PowerSecure. All rights reserved. |
 Our
2015 Goals: $300M in Tot Revenues Distributed
Generation
Utility
Infrastructure
Energy
Efficiency
Driving Mid-Double Digit
Operating Margins
15 | ©
2013 PowerSecure. All rights reserved. |
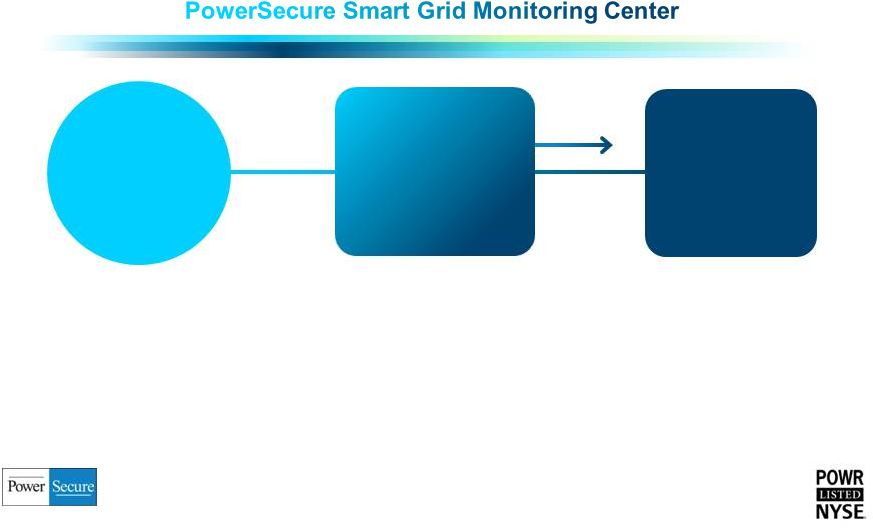 PowerSecure Distributed Generation:
Differentiated Solution=Superior Reliability & ROI
Electric
Utility
Customer
Facility
•
24/7 monitoring: standby and peak shaving
•
Proprietary internet-based monitoring, dispatch and control
•
“No Pain”
demand response
•
Our reliability > nuclear backup systems
•
Utility tariff and interconnect experts
Interactive
Distributed
Generation
®
System
16 | ©
2013 PowerSecure. All rights reserved. |
 17 | ©
2013 PowerSecure. All rights reserved.
•
T&D maintenance and construction
•
Substation products and services
•
Advanced metering and lighting
installation
•
Storm repair and restoration
•
Utility engineering and design
•
Regulatory consulting and rate design
•
PowerSecure MicroGrids and
SmartStations
Utility Infrastructure:
Direct Service to our Utility Customers |
 18 | ©
2013 PowerSecure. All rights reserved.
•
Our Utility Infrastructure Investment and Progression
-
2005 –
Launched utility engineering business
-
2007 –
Launched utility services business
-
2009 –
3 major IOU’s add PowerSecure utility services crews
-
2010 –
1st major award: $30 million, 3-year
award serving major IOU
-
2011 –
Served 9 IOUs (13 operating divisions)
-
Q3 2013 UI revenues + 72% y-o-y to $24.2 million
-
TTM UI revenues + 73% y-o-y to $94.8 million
•
Industry transmission and distribution investment
is estimated to be $890 billion from 2010-2030
1
(average of over $40 billion/year)
-
Capitalize on our “people advantage”
-
Shale gas/oil exploration are an additional growth driver
Utility Infrastructure:
Business Progression and Growth
1.
The
Brattle
Group,
November
2008
–
“Transforming
America’s
Power
Industry
–
The
Investment
Challenge
2010-2030” |
 19 | ©
2013 PowerSecure. All rights reserved.
•
Department store/high-end retail lighting
-
Solais product line adds new customers
•
Utility lighting
-
Utilities and municipalities
-
Energy and maintenance savings drive payback
-
Opportunity: millions of lights across U.S.
•
Grocery, drug, and convenience stores
-
Best-in-class lights for freezer/refrigerated cases
•
Commercial & industrial lighting
-
New targeted/niche product recently launched
Energy Efficiency: LED Solutions |
 20 | ©
2013 PowerSecure. All rights reserved.
Revenue Scaling Quickly to
$300M Target
0
50
100
150
200
250
300
350
2000 Start-
up
2005
2010
2011
2012
2013
2014
2015
Goals
Utility Infrastructure
Energy Efficiency
Distributed Generation
24
61
21
23
25
30
51
60
76
$96
$162
$300
$130
Compound Growth
2010-2015
Utility Infrastructure
+39%
Energy Efficiency
+20%
Distributed Generation
+20%
Total
+26%
"Foundation"
2005-2010
26%+ Growth, 3.2X
"Scale and Profitable Growth"
2010-2015 Goal
26%+ Growth, 3.1X
($ millions)
"Start-up"
2000-2005
1000%+ Growth
47 |
 Thank you |
 22 | ©
2013 PowerSecure. All rights reserved.
Non-GAAP Financial Measures
Our references to our third quarter 2012 “Non-GAAP Pro forma” financial measures of net
income from continuing operations, net income, net income attributable to PowerSecure
International, Inc., diluted EPS from continuing operations, diluted EPS from discontinued
operations and diluted EPS discussed and shown in this report constitute non-GAAP financial
measures. They refer to our GAAP results, adjusted to show the results without the restructuring
and cost reduction charge of $1.5 million recorded in the third quarter of 2012.
We believe providing non-GAAP measures which show our pro forma results with these items adjusted
is valuable and useful as it allows our management and our board of directors to measure,
monitor and evaluate our operating performance with the same consistent financial context.
These non-GAAP pro forma measures also correspond with the way we expect Wall Street
analysts to compare our results. Our non-GAAP pro forma measures should be considered only
as supplements to, and not as substitutes for or in isolation from, our other measures of
financial information prepared in accordance with GAAP, such as GAAP revenue, operating income,
net income from continuing operations, net income, net income attributable to PowerSecure
International, Inc., diluted EPS from continuing operations, diluted EPS from discontinued
operations, and diluted EPS. |
 23 | ©
2013 PowerSecure. All rights reserved.
Non-GAAP Financial Measures
References to our third quarter and year-to-date 2012 and 2013 Adjusted EBITDA, which we define
as our earnings before interest, taxes, depreciation and amortization, as discussed and shown in
this release, constitutes a non-GAAP “pro forma” financial measure.
We believe that Adjusted EBITDA, as a non-GAAP pro forma financial measure, provides meaningful
information to investors in terms of enhancing their understanding of our operating performance
and results, as it allows investors to more easily compare our financial performance on a
consistent basis compared to the prior year periods. This non-GAAP financial measure
also corresponds with the way we expect investment analysts to evaluate and compare our
results. Any non-GAAP pro forma financial measures should be considered only as
supplements to, and not as substitutes for or in isolation from, or superior to, our other
measures of financial information prepared in accordance with GAAP, such as net income
attributable to PowerSecure International, Inc. We define and calculate Adjusted EBITDA as net income attributable to PowerSecure International, Inc.,
minus: 1) the gain on the sale of our unconsolidated affiliate, 2) discontinued operations and
3) interest income and other income, plus: 4) restructuring charges, 5) acquisition expenses,
6) income tax expense (or minus an income tax benefit), 7) interest expense, 8) depreciation
and amortization and 9) stock compensation expense. We disclose Adjusted EBITDA because
we believe it is a useful metric by which to compare the performance of our business from
period to period. We understand that measures similar to Adjusted EBITDA are broadly used
by analysts, rating agencies, investors and financial institutions in assessing our
performance. Accordingly, we believe that the presentation of Adjusted EBITDA provides
useful information to investors. The table below provides a reconciliation of Adjusted
EBITDA to net income attributable to PowerSecure International, Inc., the most directly comparable
GAAP financial measure. |
    24 | ©
2013 PowerSecure. All rights reserved.
PowerSecure International, Inc.
Non-GAAP Pro forma Measures
($000's except per share data, some rounding throughout)
Three Months Ended September 30, 2012
As Reported
3Q12
Restructuring
Charges
Pro forma
3Q12
Operating expenses
General and administrative
9,012
9,012
Selling, marketing, and service
1,615
1,615
Depreciation and amortization
1,211
1,211
Restructuring and cost reduction charges
1,548
(1,548)
0
Total operating expenses
13,386
(1,548)
11,838
Total operating expenses % revenue
30.3%
26.8%
Operating income
490
1,548
2,038
Operating income % revenue
1.1%
4.6%
Income (loss) before income taxes
398
1,548
1,946
Income tax expense (benefit)
119
463
582
Net income (loss) from continuing operations
279
1,085
1,364
EARNINGS PER SHARE AMOUNTS ("E.P.S") ATTRIBUTABLE TO
POWERSECURE INTERNATIONAL, INC. SHAREHOLDERS:
Continuing Operations
Diluted
0.03
0.06
0.08
WEIGHTED AVERAGE COMMON SHARES OUTSTANDING
Diluted
18,793
18,793
18,793 |
 25 | ©
2013 PowerSecure. All rights reserved.
PowerSecure International, Inc.
Non-GAAP Pro forma Measures
Adjusted EBITDA (Earnings before Interest, Taxes, Depreciation and Amortization, and
Charges) Calculations and Reconciliation
($000's except per share data, some rounding throughout)
Sept 30,
Sept 30,
Sept 30,
Sept 30,
2013
2012
2013
2012
Adjusted EBITDA Calculation/Reconciliation
Net income (loss) attributable to
PowerSecure International, Inc.
3,473
482
6,305
1,522
Items to Subtract from Net Income
Gain on sale of unconsolidated affiliate
0
0
0
(1,439)
Discontinued operations - income
0
(11)
0
(78)
Interest income and other income
(21)
(22)
(61)
(67)
Items to Add to Net Income
Restructuring Charges
0
1,548
0
1,548
Acquisition Expenses
30
0
560
128
Income tax expense (benefit)
2,227
119
3,906
347
Interest expense
262
114
497
338
Depreciation and Amortization
1,925
1,211
5,190
3,432
Stock compensation expense
149
179
438
755
Adjusted EBITDA
8,045
3,620
16,835
6,486
Three Months Ended
Nine Months Ended |
 26 | ©
2013 PowerSecure. All rights reserved.
Non-GAAP Financial Measures
Our references to our second quarter 2012 and 2013 “Non-GAAP Pro forma” financial
measures of net income from continuing operations, net income, net income attributable to
PowerSecure International, Inc., diluted E.P.S. from continuing operations, diluted E.P.S. from
discontinued operations and diluted E.P.S. discussed and shown in this report constitute
non-GAAP financial measures. They refer to our GAAP results, adjusted to show the results
1) without the 2Q 2012 gain on the sale of our WaterSecure investment (identified in our
financial statements as our unconsolidated affiliate), 2) without the Q2 2012 results of our
discontinued PowerPackages business, 3) without the Q2 2012 acquisition expenses related to
PowerSecure Solar and 4) without the Q2 2013 acquisition expenses primarily related to Solais
(and to a lesser extent our ESCO, PowerLine, IES, and PowerSecure Solar transactions).
We believe providing non-GAAP measures which show our pro forma results with these items adjusted
is valuable and useful as it allows our management and our board of directors to measure,
monitor and evaluate our operating performance with the same consistent financial context.
These non-GAAP pro forma measures also correspond with the way we expect Wall Street
analysts to compare our results. Our non-GAAP pro forma measures should be considered only
as supplements to, and not as substitutes for or in isolation from, our other measures of
financial information prepared in accordance with GAAP, such as GAAP revenue, operating income,
net income from continuing operations, net income, net income attributable to PowerSecure
International, Inc., diluted E.P.S. from continuing operations, diluted E.P.S. from
discontinued operations, and diluted E.P.S. |
 27 | ©
2013 PowerSecure. All rights reserved.
PowerSecure International, Inc.
Non-GAAP Pro forma Measures
($000's except per share data, some rounding throughout)
Three Months Ended June 30, 2013
Three Months Ended June 30, 2012
As Reported
2Q13
Acquisition
Expenses for
Solais, ESCO,
PowerLine, IES,
and PowerSecure
Solar Transactions
Pro forma
2Q13
As Reported
2Q12
WaterSecure,
PowerPackages,
and Acquisition
Expenses for
PowerSecure
Solar
Pro forma
2Q12
Revenue
70,187
37,867
Cost of sales
50,304
25,663
Gross Profit
19,883
12,204
Operating expenses
General and administrative
12,511
9,093
Selling, marketing, and service
2,105
1,366
Depreciation and amortization
1,809
1,136
Restructuring and cost reduction charges
0
0
Total operating expenses
16,425
11,595
Operating income (loss)
3,458
452
3,910
609
74
683
Other income (expense)
Gain on sale of unconsolidated affiliate
0
1,439
Interest income and other income
19
23
Interest expense
(130)
(116)
Income (loss) before income taxes
3,347
452
3,799
1,955
(1,365)
590
Income tax expense (benefit)
1,305
176
1,481
621
(433)
188
Net income (loss) from continuing operations
2,042
276
2,318
1,334
(932)
402
Discontinued operations -
income (loss) from
operations (net of tax)
0
32
Discontinued operations -
gain on sale (net of
tax)
0
0
Net income (loss)
2,042
1,366
Net loss attributable to noncontrolling
interest
57
277
Net income (loss) attributable to
PowerSecure International, Inc.
2,099
1,643
Summary of Amounts Attributable to PowerSecure International, Inc. shareholders
Income (loss) from continuing operations (net
of tax)
2,099
276
2,375
1,611
(932)
679
Income (loss) from discontinued operations
(net of tax)
0
0
0
32
(32)
0
Net income (loss) attributable to
PowerSecure International, Inc.
2,099
276
2,375
1,643
(964)
679
EARNINGS PER SHARE AMOUNTS ("E.P.S") ATTRIBUTABLE TO
POWERSECURE INTERNATIONAL, INC. SHAREHOLDERS:
Continuing Operations
Basic
0.11
0.09
Diluted
0.11
0.09
Discontinued Operations
Basic
0.00
0.00
Diluted
0.00
0.00
Net Income
Basic
0.11
0.01
0.12
0.09
(0.05)
0.04
Diluted
0.11
0.01
0.12
0.09
(0.05)
0.04
WEIGHTED AVERAGE COMMON SHARES OUTSTANDING
Basic
19,024
Diluted
19,357 |
 28 | ©
2013 PowerSecure. All rights reserved.
Non-GAAP Financial Measures
Our references to our quarterly and full year 2012, and quarterly and full year 2011
“Non-GAAP Pro forma” financial measures of operating expenses, operating expenses
as a percentage of revenue, operating income, operating income as a percentage of revenue, net
income from continuing operations, net income, net income attributable to PowerSecure
International, Inc., diluted E.P.S. from continuing operations, and diluted E.P.S. discussed
and shown in this report constitute non-GAAP financial measures. For our quarterly
and full year 2012 results, they refer to our GAAP results, adjusted to show them 1)
excluding charges related to our restructuring and cost reduction initiative, 2) gains related to
the 2011 sale of our WaterSecure operations, and 3) results of our discontinued PowerPackages
business exited in 2011. For our fourth quarterly and full year 2011 results, they refer to our
GAAP results, adjusted to show them 1) excluding gains and income related to our WaterSecure
operations, 2) the results of our discontinued PowerPackages business, and 3) gains and income
related to our discontinued Southern Flow business sold in 2011.
We believe providing non-GAAP measures which show our pro forma results with these items adjusted
is valuable and useful as it allows our management and our board of directors to measure,
monitor and evaluate our operating performance in 2011, 2012, and in future periods with
the same consistent financial context as the business was managed in those periods.
Additionally, because these items were non-recurring, our non-GAAP pro forma measures
are more comparable to our prior period and future period results. |
 29 | ©
2013 PowerSecure. All rights reserved.
Non-GAAP Financial Measures
We believe providing non-GAAP measures which show our pro forma results with these items adjusted
is valuable and useful as it allows our management and our board of directors to measure,
monitor and evaluate our operating performance in 2011, 2012, and in future periods with
the same consistent financial context as the business was managed in those periods.
Additionally, because these items were non-recurring, our non-GAAP pro forma measures
are more comparable to our prior period and future period results.
We believe these Non-GAAP Pro forma measures also provide meaningful information to investors in
terms of enhancing their understanding of our fourth quarter and full year 2012, and fourth
quarter and full year 2011 operating performance and results, as they allow investors to more
easily compare our financial performance on a consistent basis compared to the prior year
periods. These Non-GAAP Pro forma measures also correspond with the way we expect
investment analysts to evaluate and compare our results. Our Non-GAAP Pro forma
measures should be considered only as supplements to, and not as substitutes for or in
isolation from, or superior to, our other measures of financial information prepared in
accordance with GAAP, such as GAAP revenue, operating expenses, operating expenses as a
percentage of revenue, operating income, operating income as a percentage of revenue, net income
from continuing operations, net income, net income attributable to PowerSecure International,
Inc., diluted E.P.S. from continuing operations, diluted E.P.S. from discontinued operations,
and diluted E.P.S. The following table provides a reconciliation of these non-GAAP financial measures to the most
directly comparable GAAP financial measures.
|
 Non-GAAP Financial Measures |
 31 | ©
2013 PowerSecure. All rights reserved. |