Attached files
| file | filename |
|---|---|
| 8-K - 8-K - Northern Tier Energy LP | d627199d8k.htm |
| EX-99.1 - EX-99.1 - Northern Tier Energy LP | d627199dex991.htm |
 Third Quarter
2013 Earnings Conference Call and Webcast
November 12, 2013
Exhibit 99.2 |
 Forward Looking
Statements 1
This presentation includes “forward-looking statements.” The words
“believe,” “expect,” “anticipate,” “plan,” “intend,” “foresee,” “should,” “would,”
“could,” “attempt,” “appears,” “forecast,”
“outlook,” “estimate,” “project,” “potential,” “may,” “will,” “are likely” or other similar expressions are
intended to identify forward-looking statements. These forward-looking
statements are based on management’s current expectations and beliefs concerning
future developments and their potential effect on us. While management believes that these forward-looking statements are reasonable as
and when made, there can be no assurance that future developments affecting us will be those
that we anticipate, and any and all of our forward- looking statements in this
presentation may turn out to be inaccurate. Our forward-looking statements involve significant risks and uncertainties (some
of which are beyond our control) and assumptions that could cause actual results to differ
materially from our historical experience and our present expectations or
projections. Important factors that could cause actual results to differ materially from those in the forward-looking statements include,
but are not limited to, the overall demand for hydrocarbon products, fuels and other refined
products; our ability to produce products and fuels that meet our customers’
unique and precise specifications; the impact of fluctuations and rapid increases or decreases in crude oil, refined products, fuel,
utility services and crack-spread prices, including the impact of these factors on our
liquidity; fluctuations in refinery capacity; accidents or other unscheduled shutdowns
affecting our refineries, machinery, or equipment, or those of our suppliers or customers; changes in the cost or availability of
transportation for feedstocks and refined products; the results of our hedging and other risk
management activities; our ability to comply with covenants contained in our debt
instruments; labor relations; relationships with our partners and franchisees; successful integration and future
performance of acquired assets, businesses or third-party product supply and processing
relationships; our access to capital to fund expansions, acquisitions and our working
capital needs and our ability to obtain debt or equity financing on satisfactory terms; environmental liabilities or events
that are not covered by an indemnity, insurance or existing reserves; dependence on one
principal supplier for our retail merchandise; maintenance of our credit ratings and
ability to receive open credit lines from our suppliers; the effects of competition; continued creditworthiness of, and performance
by, counterparties; the impact of current and future laws, rulings and governmental
regulations, including guidance related to the Dodd-Frank Wall Street Reform and
Consumer Protection Act; shortages or cost increases of power supplies, natural gas, materials or labor; weather interference with
business operations; seasonal trends in the industries in which we operate; fluctuations in
the debt markets; potential product liability claims and other litigation; accidents or
other unscheduled shutdowns or disruptions; and changes in economic conditions, generally, and in the markets we serve,
consumer behavior, and travel and tourism trends. These factors are not necessarily all
of the important factors that could cause actual results to differ materially from
those expressed in any of our forward-looking statements. Other unknown or unpredictable factors could have material adverse effects
on our future results. For additional information regarding known material factors that
could cause our actual results to differ from our projected results, please refer to
our Annual Report on Form 10-K for the year ended December 31, 2012 and other subsequent filings with the SEC.
The presentation also includes non-GAAP measures. We believe that these non-GAAP
financial measures provide useful information about our operating performance and
should not be viewed in isolation or considered as alternatives to comparable GAAP measures. Our non-GAAP financial
measures may also differ from similarly names measures used by other companies. See the
disclosures in the “Management’s Discussion and Analysis of Financial
Condition and Results of Operations” included in our quarterly report on Form 10-Q for the three and nine months ended September 30,
2013 for additional information on the non–GAAP measures used in this presentation and
reconciliations to the most directly comparable GAAP measures.
|
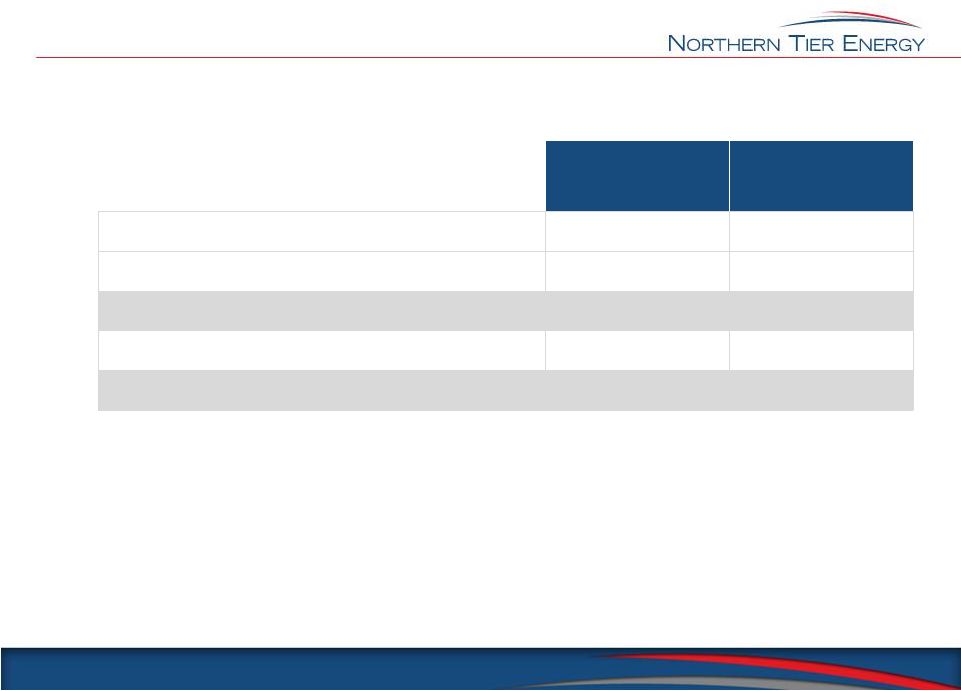
 Q3 2013
Financial Results; Select Balance Sheet & Cash Flow Data
2
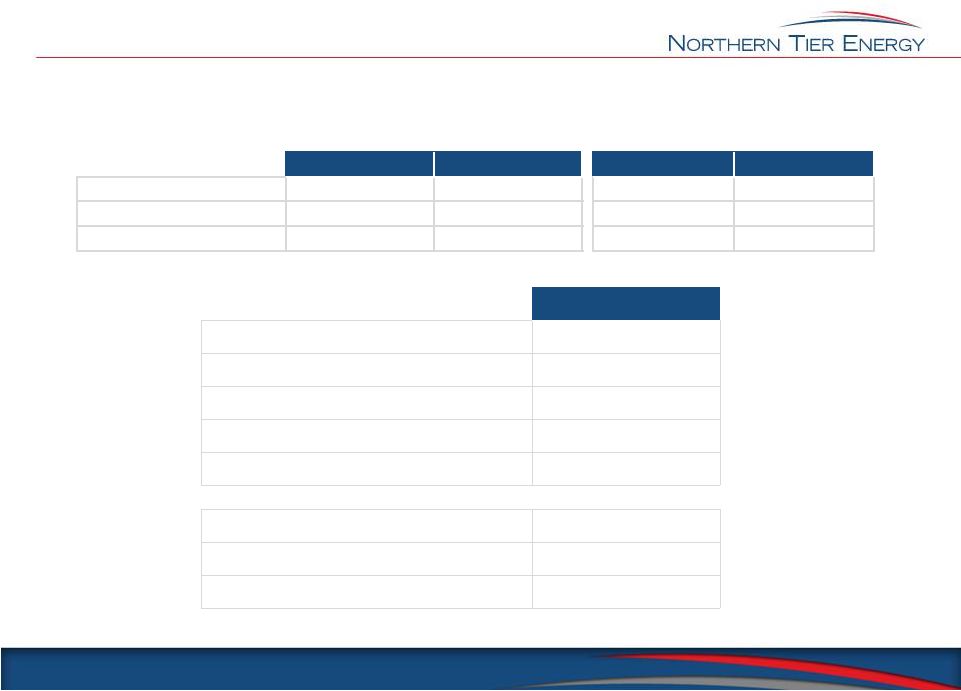
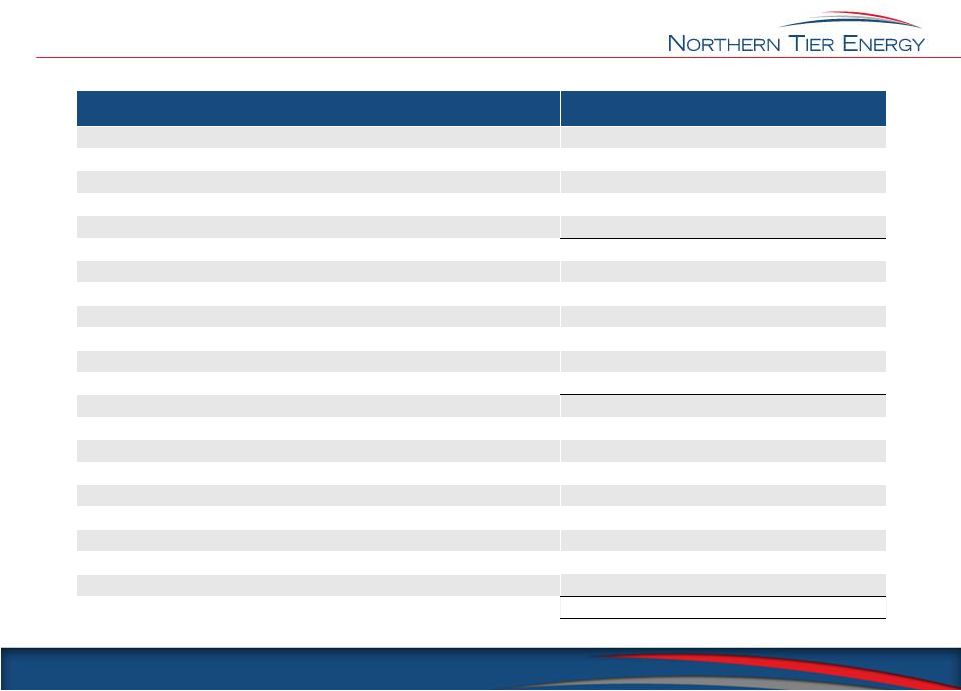
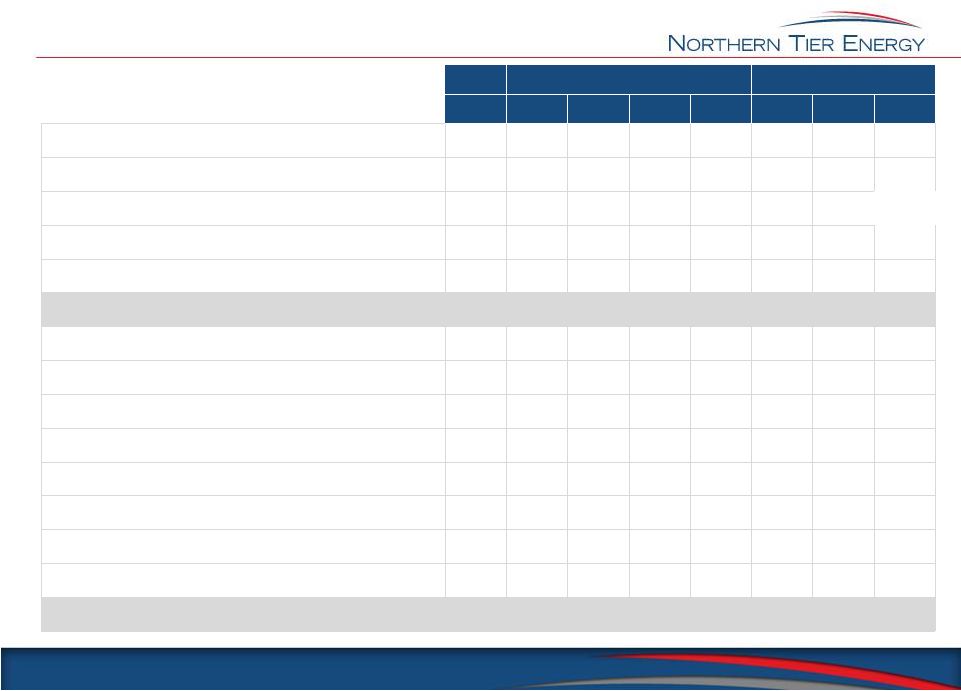
Consolidated Financial Results
1
See Appendix for reconciliation of Net Income to Adjusted EBITDA.
($ in millions)
Q3 2013
Cash and Cash Equivalents
$126.7
Total Debt (including capital leases)
$282.3
Equity
$408.1
Adjusted EBITDA (last twelve months)
$456.2
Debt to LTM Adjusted EBITDA
0.6x
Cash Flow from Operations
$98.5
Cash Available for Distribution
$28.3
Distribution per Unit
$0.31
Balance Sheet & Cash Flows
Q3 2013
Q3 2012
Q3 YTD 2013
Q3 YTD 2012
Net Income
$27.2
$61.1
$210.5
$113.1
Operating Income
27.3
199.4
206.8
426.8
Adjusted EBITDA
1
51.3
249.5
293.8
577.3 |
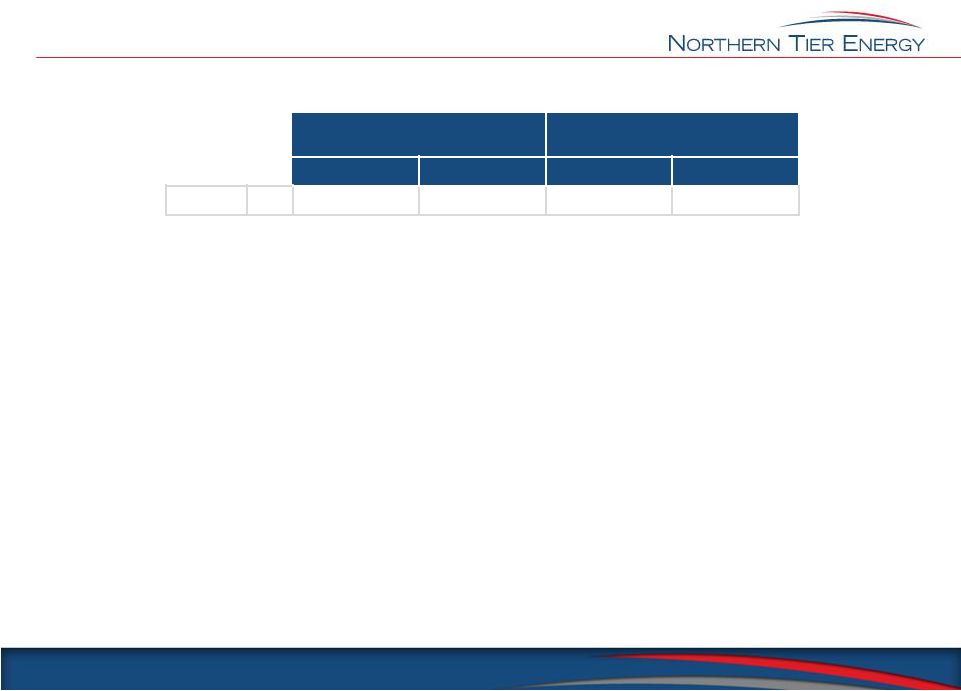
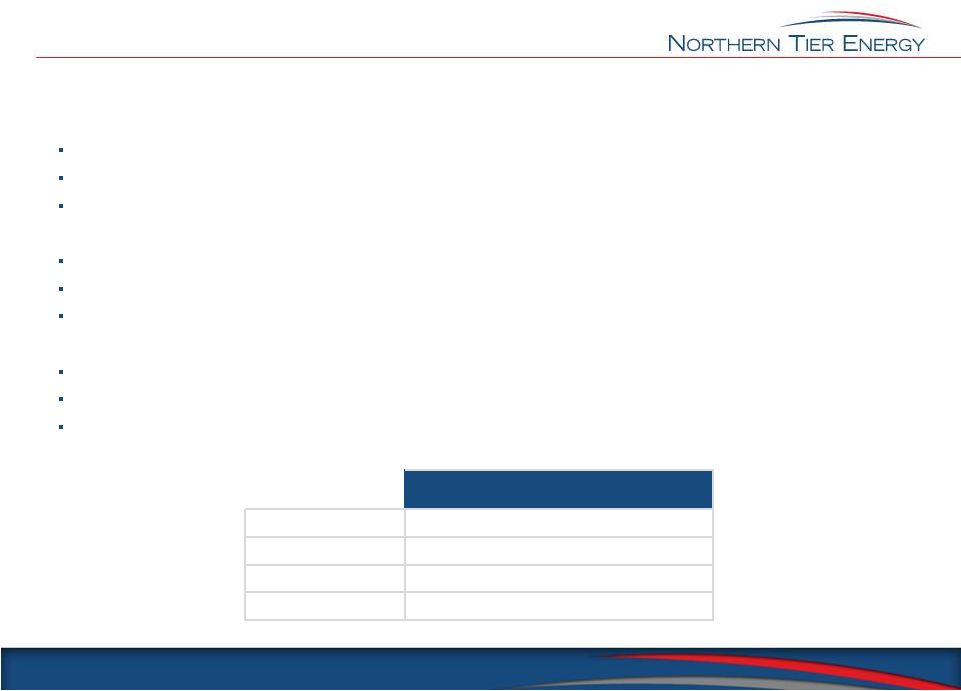 Refinery
Expansion Projects NTI has successfully completed the two previously announced
discretionary projects at the Saint Paul Park Refinery, with the third one to be
completed in Q1 2014: 1.Sweet crude tower expansion
project: Completed in Q2 13
Increased throughput on the #2 crude tower (sweet tower) by 8kbpd
Total cost was $40 million
2.Wet gas compressor project:
Completed in Q4 13
Decreases output of black oil by approximately 2kbpd and converts to gasoline, distillate and
LPGs Total cost was $5 million
3.Slurry stripper project:
To be completed in Q1 14
Allows Fuel Oil to be saleable by itself, unblended
Total cost is $4 million
Net Yield Change:
3
1
Prior to the Saint Paul Park discretionary projects, which were initiated in Q2 of 2013.
2014
Delta
to
Historic
1
Yields
(% of Input)
LPGs
0.9 %
Gasoline
0.5 %
Distillates
3.7 %
Black Oil
(4.9) % |
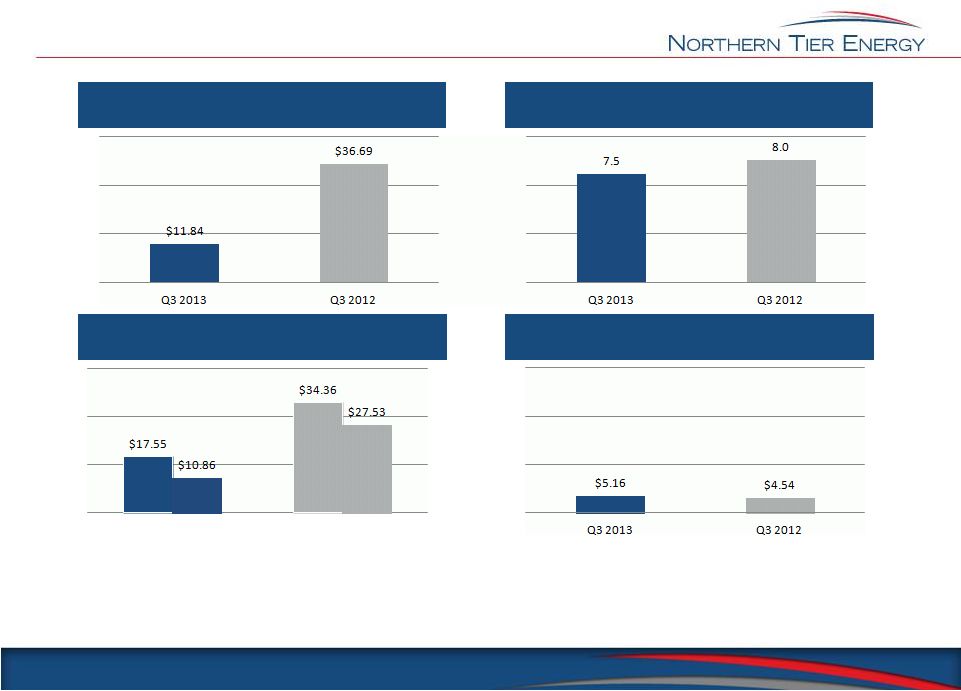 Key Refining
Performance Metrics 4
Gross Margin
1
($ per throughput barrel)
Group 3 Benchmark Crack Spread
2
Direct Operating Expenses
3
($ per throughput barrel)
Throughput
(millions of barrels)
3-2-1
3-2-1
6-3-2-1
6-3-2-1
Q2 2013
Q2 2012
1
See Appendix for each of the components used in this calculation (revenue and cost of
sales). 2
Typically, 80% of our products are comparable to a 3-2-1 crack spread, while 95% of
our products are comparable to a 6-3-2-1 crack spread. 3
Direct operating expenses per barrel is calculated by dividing direct operating expenses by
the total barrels of throughput for the respective periods presented.
|
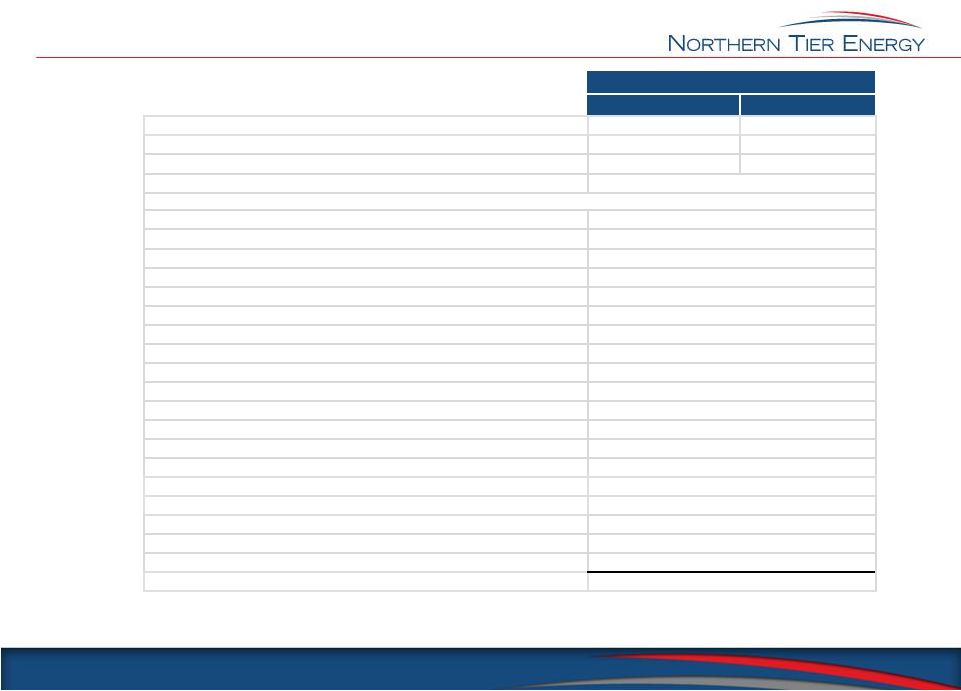
 Cash Available
for Distribution Reconciliation For the 3 months ending
9/30/13
Net income
$27.2
Adjustments:
Interest expense
6.3
Income tax provision
1.4
Depreciation and amortization
9.8
EBITDA subtotal
$44.7
Minnesota Pipe Line proportionate EBITDA
0.7
Turnaround and related expenses
12.2
Equity-based compensation impacts
0.7
Unrealized gains on derivative activities
(6.8)
Formation and offering costs
0.6
Realized gains on derivative activities
(0.8)
Adjusted EBITDA
$51.3
Cash interest expense
(5.7)
Current tax position
(1.4)
Minnesota Pipe Line proportionate EBITDA
(0.7)
Realized gains on derivative activities
0.8
Capital expenditures¹
(5.4)
Formation and offering costs
(0.6)
Cash reserve for turnaround and related expenses
(5.0)
Cash reserve for discretionary capital expenditures
(5.0)
Cash Available for Distribution
$28.3
($ in millions)
5
1
Capital expenditures include maintenance, replacement, and regulatory capital projects.
Expansion capital projects are not included. |
 Hedge
Positions 6
1
30,000 barrels of gasoline per quarter and 15,000 barrels of diesel per quarter are
hedged at cracks against WCS, while the remaining barrels are hedged at cracks against WTI.
Volume Hedged
(000
barrels)
NTI Strike Price
Gasoline
Diesel
Gasoline
Distillate
2013
1
Q4
504
761
16.08
21.40 |
 Q4 ‘13
Operating and Capex Guidance 7
1
Includes gasoline bought on the open market to satisfy SuperAmerica and other contractual
obligations during our planned FCC turnaround. We do not expect to earn a
meaningful margin on these purchases. `
Q4 2013
Low
High
Refinery Statistics:
Total throughput (bpd)
80,000
85,000
Total refined
products sold (bpd)
1
82,500
87,500
Direct opex ex. Turnaround ($/throughput bbl)
$5.25 -
$5.75
Retail Statistics
:
Forecasted gallons (mm)
79
Retail fuel margin ($/gallon)
$0.16
Merchandise
sales ($ in mm)
$91
Merchandise gross
margin (%)
26.0%
Direct operating
expense ($ in mm)
$30
Other Guidance ($ in mm):
Reserve for turnaround
and related expenses
$5 -
$10
Cash reserve for discretionary capital expenditures
$5 -
$10
SG&A
$22
Depreciation & amortization
$10
Cash interest expense
$6
Current tax expense
$1
Capital Program:
Maintenance
and replacement capital
$8
Waste Water Treatment
(non recurring regulatory capital)
$8
Discretionary
capital
$4
Total Planned
Capital Expenditures
($
in
mm)
$20 |
 APPENDIX
|
 Adjusted
EBITDA Reconciliation 9
2011
2012
2013
4Q
1Q
2Q
3Q
4Q
1Q
2Q
3Q
Net Income (Loss)
$292.7
$(193.6)
$245.6
$61.1
$84.5
$119.4
$63.9
$27.2
Adjustments:
Interest Expense
11.5
10.4
10.7
15.6
5.5
6.4
6.3
6.3
Income Tax Provision
-
-
0.1
7.7
2.0
(0.1)
3.0
1.4
Depreciation and Amortization
7.2
8.5
7.8
8.3
8.6
8.6
9.4
9.8
EBITDA Subtotal
$311.4
(174.7)
$265.2
$92.7
$100.6
$134.3
$82.6
$44.7
Minnesota Pipe Line Proportionate EBITDA
0.1
0.7
0.7
0.7
0.7
0.7
0.7
0.7
Turnaround and Related Expenses
0.1
3.5
11.5
2.1
9.0
9.7
27.3
12.2
Equity-based Compensation Impacts
0.5
0.4
0.5
0.5
(0.5)
5.3
0.4
0.7
Unrealized (Gains) / Losses on Derivative Activities
(292.6)
88.4
(191.3)
70.3
(35.4)
(11.2)
(28.7)
(6.8)
Contingent Consideration (Income) / Loss
(18.2)
65.7
0.1
38.5
-
-
-
-
Formation and Offering Costs
1.3
-
1.0
-
0.4
0.4
0.5
0.6
Loss on Early Extinguishment of Derivatives/Debt
-
44.6
92.2
-
50.0
-
-
-
Realized (Gains) Losses on Derivative Activities
63.9
52.9
67.4
44.7
37.6
17.4
3.1
(0.8)
Adjusted EBITDA
$66.5
$81.5
$246.3
$249.5
$162.4
$156.6
$85.9
$51.3
($ in millions) |
 Refining Gross
Product Margin Per Barrel of Throughput Reconciliation
10
Q3 2013
Q3 2012
Refinery Revenue
$1,321.7
$1,151.1
Refinery Costs of Sales
1,233.3
855.8
Refinery Gross Product Margin
$88.4
$295.3
Total Refinery Throughput
7.5
8.0
Refinery Gross Product Margin Per Barrel of Throughput
$11.84
$36.69
($ in millions, unless otherwise indicated) |