Attached files
| file | filename |
|---|---|
| 8-K - FORM 8-K - MID AMERICA APARTMENT COMMUNITIES INC. | v360250_8k.htm |

REIT World 2013 November 13 - 15, 2013

Merger Timeline Announcement June 3, 2013 Closed October 1, 2013 Full Integration December 2014 April 2014 Identified $25M of synergies: 75% personnel 25% non - personnel Numerous due - diligence site visits Exchange of non - public financial information; extensive due diligence and valuation analysis Pre - announcement review with Rating Agencies; day of announcement up - grade by S&P and reaffirmation of ratings by Moody’s and Fitch Lender consents on $2.6 billion in debt Numerous joint management site visits Final management structure in place Formally launch new corporate identity Estimate 40 - 50% of synergies realized on a run rate basis Consolidated financial reporting and forecasting capabilities fully in place Early integration efforts complete Estimate capturing 70 - 80% of synergy opportunity Legacy CLP development pipeline 35 - 45% productive Realize 100% of synergy opportunity Full systems integration complete Full recycling of non multifamily capital approximately 25 - 35% complete (depending on transaction market strength and timing) Legacy CLP development pipeline 65 - 75% productive 2

Merger Related FFO and Value Opportunities 3 ● Approximately $25 million ($0.32 per share) of combined expense synergies across the platform ● Approximately $90 million of non - earning assets to be recycled into yielding multifamily assets ● Stabilization of the legacy CLP development pipeline (approximately $210M) ● Roll out MAA redevelopment program to legacy CLP properties – 30% - 40% of portfolio ($55 million redevelopment program) ● Estimated value creation (net of merger costs) in excess of $230 million Colonial Grand at Double Creek - Austin, TX Additional Areas of Opportunity (beyond $25M of synergies) FFO/Share Opportunity Additional NOI Synergy and CLP Unit Redevelopment $0.15 - $0.20 Recycle Non Earning Assets $0.05 - $0.10 Stabilize Development Pipeline $0.10 - $0.15 Total $0.30 - $0.45 Value Premium Paid 1 ($226.5 million) Deal Costs ($60.0 million) Total Cost ($286.5 million) Value of Synergy & Redevelopment ($37.5M)* $517.0 million Net Value $230.5 million * Using Pre - Merger announcement FFO multiple of 13.8 and midpoint of synergy opportunity; at current sector multiple of 15.2, net value increases to $283.5M (1) Implied price paid based on day of announcement at .360x exchange rate

Portfolio Strategy – Full Cycle Profile Portfolio distribution by total units 1 less than 2,000 Units 2,000 – 5,000 Units greater than 5,000 Units Note: Includes all New MAA multifamily properties, including stabilized, lease up and joint venture communities (1) Breakdown based on total multifamily units, including stabilized, lease - up and joint venture communities Distribution by large markets Large Markets % of Same Store 3Q13 NOI 1 Dallas / Fort Worth 11.6% 2 Raleigh 6.8% 3 Atlanta 6.7% 4 Austin 6.5% 5 Charlotte 6.0% 6 Nashville 5.0% 7 Jacksonville 4.5% 8 Tampa 3.4% 9 Houston 3.2% 10 Orlando 3.1% 62 % of total 2 Distribution by secondary markets Secondary Markets % of Same Store 3 Q13 NOI 1 Memphis 3.6% 2 Charleston 3.6% 3 Savannah 3.3% 4 Birmingham 2.7% 5 Richmond 2.7% 6 Greenville 2.0% 7 Jackson 1.7% 8 Huntsville 1.6% 9 Little Rock 1.4% 10 Columbus 1.3% 38 % of total 2 Note: Other large markets includes 3 additional MSAs; Other secondary markets includes 27 additional MSAs (2) Distribution based on combined legacy MAA same store and legacy CLP same store multifamily 3Q13 NOI 4 Tennessee Nevada Arizona Texas Missouri Arkansas Alabama Kentucky Virginia North Carolina South Carolina Georgia Florida Mississippi Tennessee

Strong Investment Grade Balance Sheet and Manageable Debt Maturity Profile Credit metrics MAA CLP New MAA LT Target Total unencumbered assets to book value 60.1% 62.4% 61.2% 65% - 70% Net Debt / LTM EBITDA 1 6.0x 7.4x 6.3x 6.0x Net Debt / gross assets 2 40.8% 41.2% 40.2% 40% - 45% GAV Secured debt / gross assets 2 25.5% 17.6% 21.3% 15% - 20% LTM fixed charge coverage ratio 1 4.4x 2.5x 3.5x 3.8x - 4.0x Note: As of 9/30/13 1) New MAA EBITDA includes $25mm of annual synergies pro forma for the transaction that MAA anticipates will be realized over ti me; however there can be no assurance that will occur. Fixed charges include interest expense, capitalized interest and preferred distributions 2) Gross assets is defined as the total assets plus accumulated depreciation Debt maturity profile ($mm) $0 $443 $364 $184 $458 $1,953 2013 2014 2015 2016 2017 2018+ 0% 13.0% 10.7% 5.4% 57.4% % maturing 13.5% Note: As of 9/30/13 pro forma for the merger and the $350mm bond transaction. Proceeds from the bond transaction were used t o p ay down the credit facility. 5

Inaugural Public Bond Deal Completed October 2013 $350,000,000 4.30% Senior Unsecured Notes due 2023 Cusip: 59523UAA5 Mid - America Apartments, LP • MAA’s inaugural public bond offering was extremely well received by investors – over 5x oversubscribed • MAA hedged $150 million of the bond offering with rate swaps – effective interest rate of 4.15% Transaction Description Proceeds to repay unsecured credit facility Terms Issuer Mid - America Apartments, LP Size $350,000,000 Credit Spread +180bps (no “first time issuer” premium) Coupon 4.30% (semi - annual) YTM 4.419% Price to Public 99.047% Maturity October 15, 2023 Rating Fitch: BBB, Stable Moody’s: Baa2, Stable S&P: BBB, Stable 6

Development Pipeline Expected stabilized NOI yield between 7% and 8% Active multifamily development pipeline ($mm, except per unit costs) $242.8 Total Expected MSA Units to Date to Complete Total Per Unit Stabilized MAA River's Walk Charleston 270 29.7$ 3.8$ 33.5$ 124$ 2Q14 220 Riverside Jacksonville 294 13.4$ 27.1$ 40.5$ 137$ 4Q15 Subtotal: MAA 564 43.1$ 30.9$ 74.0$ 131$ CLP CR at South End Charlotte 353 45.0$ 14.3$ 59.3$ 168$ 1Q15 CG at Randal Lakes Orlando 462 43.1$ 13.9$ 57.0$ 123$ 1Q15 CG at Lake Mary III Orlando 132 6.0$ 10.1$ 16.1$ 122$ 3Q14 CG at Bellevue Phase II Nashville 220 6.3$ 23.8$ 30.1$ 137$ 2Q15 Subtotal: CLP 1,167 100.4$ 62.1$ 162.5$ 139$ Total 1,731 143.5$ 93.0$ 236.5$ 137$ Cost Expected Cost 7 Represents 3% of GAV

Acquisition/Disposition Recap 8 Active capital redeployment Price Cap (000s) Units Rate Age MAA Acquisitions by Year (wholly-owned) 2009 78,300$ 1,064 6.9% 4 2010 230,050$ 2,138 6.0% 1 2011 362,515$ 3,055 5.9% 3 2012 345,075$ 2,451 5.6% 6 2013 YTD 148,825$ 1,137 5.8% 7 1,164,765$ 9,845 5.9% 4 MAA Dispositions by Year (wholly-owned) 2009 29,800$ 840 7.0% 27 2010 -$ - 2011 23,950$ 534 6.5% 27 2012 113,200$ 2,254 6.8% 23 2013 YTD 131,300$ 2,108 7.2% 26 298,250$ 5,736 7.0% 25 We expect to continue a similar level of capital recycling through acquisition of new multifamily assets and disposition of existing multifamily assets. In addition, there remains approximately $120 million of income producing commercial assets acquired in the merger, representing less than 2% of total company NOI, that are actively being marketed for sale.
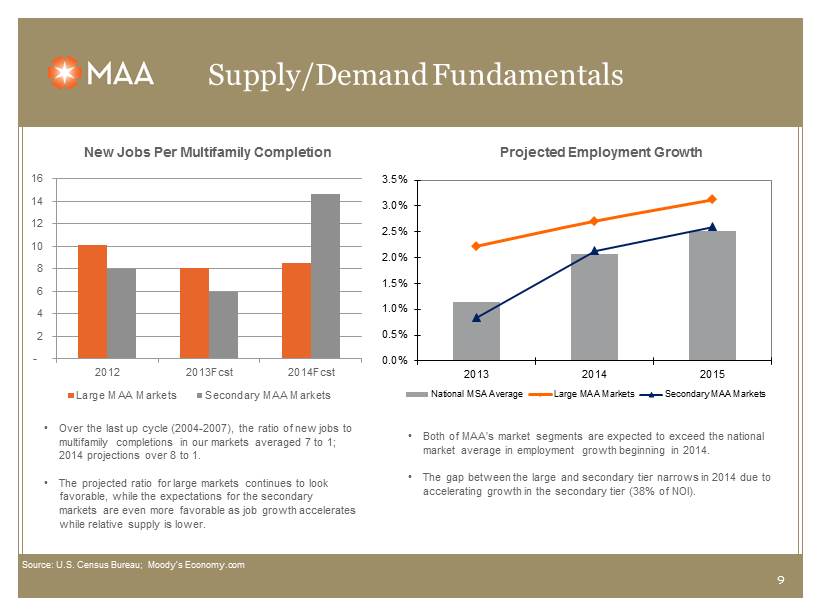
Supply/Demand Fundamentals 9 - 2 4 6 8 10 12 14 16 2012 2013Fcst 2014Fcst Large MAA Markets Secondary MAA Markets New Jobs Per Multifamily Completion • Over the last up cycle (2004 - 2007), the ratio of new jobs to multifamily completions in our markets averaged 7 to 1; 2014 projections over 8 to 1. • The projected ratio for large markets continues to look favorable, while the expectations for the secondary markets are even more favorable as job growth accelerates while relative supply is lower. Projected Employment Growth • Both of MAA’s market segments are expected to exceed the national market average in employment growth beginning in 2014. • The gap between the large and secondary tier narrows in 2014 due to accelerating growth in the secondary tier (38% of NOI). Source: U.S. Census Bureau; Moody’s Economy.com 0.0% 0.5% 1.0% 1.5% 2.0% 2.5% 3.0% 3.5% 2013 2014 2015 National MSA Average Large MAA Markets Secondary MAA Markets

Single Family Recovery Not a Pressure Point 10 10.0% 15.0% 20.0% 25.0% 30.0% 35.0% 40.0% Jan-05 Apr-05 Jul-05 Oct-05 Jan-06 Apr-06 Jul-06 Oct-06 Jan-07 Apr-07 Jul-07 Oct-07 Jan-08 Apr-08 Jul-08 Oct-08 Jan-09 Apr-09 Jul-09 Oct-09 Jan-10 Apr-10 Jul-10 Oct-10 Jan-11 Apr-11 Jul-11 Oct-11 Jan-12 Apr-12 Jul-12 Oct-12 Jan-13 Apr-13 Jul-13 Oct-13 Move Outs to Home Buying as % of Total Move outs ● Move outs due to home buying continue to trend in line with recent history – no appreciable uptick – and below the level seen in the previous “up” cycle (2004 - 2007) ● The national home ownership rate continues to remain steady (65% in Q2) despite the favorable rate environment ● The “Qualified Mortgage Rule” is slated to go into effect in January of 2014, essentially requiring prudent underwriting practices. This should help mitigate the chances of returning to the “undisciplined” home buying environment of the mid - 2000’s ● Similarly, we have not seen an appreciable uptick in move outs due to home renting (6 - 7% of turnover) ● Move outs to another apartment community are also not a meaningful factor for turnover (3 - 4% of turnover)

Summary 11 x Strong industry and market fundamentals outlook x High quality, well - located and diversified portfolio – a full cycle profile x Disciplined capital deployment practices x Investment grade balance sheet ; strong coverages x An experienced management team x Strong operating platform ; meaningful redevelopment opportunity x Proven strategy and long term outperformance x Focus on high - growth Sunbelt Markets driving superior long - term demand x Meaningful value creation opportunity from merger

Certain matters in this presentation may constitute forward - looking statements within the meaning of Section 27 - A of the Securities Act of 1933 and Section 21 E of the Securities and Exchange Act of 1934 . Such statements include, but are not limited to, statements made about anticipated economic and market conditions, expectations for future demographics, the impact of competition, general changes in the apartment industry, expectations for acquisition and joint venture performance, ability to pay dividends and the ability to obtain financing at reasonable rates . Actual results and the timing of certain events could differ materially from those projected in or contemplated by the forward - looking statements due to a number of factors, including a downturn in general economic conditions or the capital markets, competitive factors including overbuilding or other supply/demand imbalances in some or all of our markets, changes in interest rates and other items that are difficult to control such as the impact of legislation, as well as the other general risks inherent in the apartment and real estate businesses . Reference is hereby made to the filings of Mid - America Apartment Communities, Inc . , with the Securities and Exchange Commission, including quarterly reports on Form 10 - Q, reports on Form 8 - K, and its annual report on Form 10 - K, particularly including the risk factors contained in the latter filing . Eric Bolton CEO 901 - 248 - 4127 eric.bolton@maac.com Al Campbell CFO 901 - 248 - 4169 al.campbell@maac.com Tim Argo Investor Relations 901 - 248 - 4149 tim.argo@maac.com Jennifer Patrick Investor Relations 901 - 435 - 5371 jennifer.patrick@maac.com 12 Rob DelPriore General Counsel 901 - 248 - 4150 robert.delpriore@maac.com