Attached files
| file | filename |
|---|---|
| 8-K - 8-K - HEARTLAND EXPRESS INC | gordontruckingacquisition8k.htm |
| EX-99.1 - PRESS RELEASE - HEARTLAND EXPRESS INC | exhibit991.htm |

Acquisition of Gordon Trucking, Inc. November 11, 2013
Safe Harbor This presentation contains forward-looking statements relating to the expected results of acquiring Gordon Trucking, Inc., (“GTI”), future capital expenditures and debt levels, expected synergies, and financial goals. Forward-looking statements are usually identified by words such as "anticipates," "believes," "estimates", "plans,” "projects," "expects," “hopes,” “intends,” “will,” “could,” “may,” or similar expressions. These statements are based on information currently available and speak only as of the date the statement was made. Such forward-looking statements are made pursuant to the safe harbor provisions of the Private Securities Litigation Reform Act of 1995. Such forward-looking statements are inherently uncertain, and are based upon the current beliefs, assumptions and expectations of management, as well as current market conditions, all of which are subject to significant risks and uncertainties as set forth in the Risk Factors Section of our Annual Report Form 10-K for the year ended December 31, 2012, as those risk factors may be updated from time to time. As a result of these and other factors, actual results may differ from those set forth in the forward-looking statements. The Company makes no commitment, and disclaims any duty, to update or revise any forward-looking statements to reflect future events, new information or changes in these expectations. This presentation also includes certain non-GAAP financial measures as defined by the SEC. The calculation of each measure, including a reconciliation to the most closely related GAAP measure is included in the appendix to this presentation. 2
Transaction Overview 3 TRANSACTION HIGHLIGHTS • Heartland Express, Inc. acquired 100% of Gordon Trucking, Inc. of Pacific, WA (“GTI”) in a stock purchase with IRC Section 338(h)(10) election • $300 million approx. closing enterprise value includes $40 million in stock, $110 million in cash, and $150 million in debt assumption/re-finance • Estimated $60 million NPV in future cash tax benefits from Section 338(h)(10) election • Implied LTM Sept. transaction multiple at closing of 5.0x adjusted EBITDA (4.0x adjusted EBITDA including NPV of Section §338(h)(10) cash tax benefit) • Stock holding period and $20 million earn-out align interests STRATEGIC FIT • Geographic scope, customer diversity, scale • Similar service, safety, and driver focus • Management team committed to improvement EXPECTED SYNERGIES • Goal of $30 million in consolidated EBIT improvement through 2017 • Concentrated in maintenance program, optimizing staffing and locations, purchasing power, insurance and claims program, and yield management/dispatch efficiency • Aligned with earn-out FINANCIAL IMPACT • Expected to be meaningfully accretive in 2014 • Acquisition debt expected to be repaid ~ YE 2015 • Quarterly dividends expected to continue

GTI Overview Seattle area headquarters, with strong western U.S. presence Approximately 2,000 tractors, which includes ~ 100 owner-operators 77% dry van and dedicated TL, with niche refrigerated, heavy haul, and brokerage operations Regional Strategy Short to medium length of haul Customer service, safety, and driver focus similar to Heartland Experienced drivers, 64% over 5 years experience Approximately $60 million in Adjusted EBITDA and 93.5% Adjusted operating ratio for LTM September (see non-GAAP reconciliation) $0 $100 $200 $300 $400 $500 2009 2010 2011 2012 LTM Sept Total Revenue $0 $10 $20 $30 $40 $50 $60 2009 2010 2011 2012 LTM Sept Adjusted EBITDA * 4 * LTM is adjusted, others actual

5 Phoenix Jacksonville Atlanta Kingsport Memphis Columbus Carlisle Chester Iowa City Denver O’Fallon Dallas 82% East, 18% West Strong Eastern Presence, Growing West Heartland Terminal Network

6 Green Bay Indianapolis Pontoon Beach Pacific Clackamas Albany Boise Medford Lathrop Rancho Cucamonga Salt Lake City Phoenix Combined 58% East, 42% West 82% East, 18% West Strong Eastern Presence, Growing West 77% West, 23% East Strong Western Presence, Growing East Combined Terminal Network

Focus on Markets 7 Refrigerated 14.4% Other 1.2% Dry Van Truckload 61.6% Logistics 7.0% Dedicated 15.8% Line of Business Commodity Mix < 100 100 to 399 400 to 699 700 to 999 > 1000 26.6% 39.5% 15.2% 10.9% 7.9% Length of Haul Consumer 12.0% Food 27.0% Beverage 16.0% Paper and Packaging 17.5% Retail 18.0% Other 9.5%

Superior Customer Service 8 Chep 2013 Dedicated Carrier of the Year General Mills 2012 Dry Carrier of the Year Georgia Pacific 2012 One Way Carrier of the Year Quaker 2012 Regional Carrier of the Year PepsiCo 2012 West Regional Carrier of the Year Lowes 2012 Gold Service Award Kellogg’s Strategic Sourcing Partner Lowes 2011 Platinum Award Kellogg’s 2009 Regional Carrier of the Year Lowes 2009 Gold Award ConAgra Foods 2009 Innovation Carrier of the Year

Intense Safety Focus Heartland Average = 17.3% GTI Average = 24.6% 9 • WTA Safe Carrier of the Year 2007-2012 • TCA Safest Carrier 100 million miles + • TCA Driver of the Year 2013 • 2012 American Trucking Association Safest U.S. Fleet • TCA National Safe Fleet of the Year 2009, 2010, 2012 • Safest Large Fleet by Oregon Trucking Association 2011, 2012 October 2013 CSA Scores
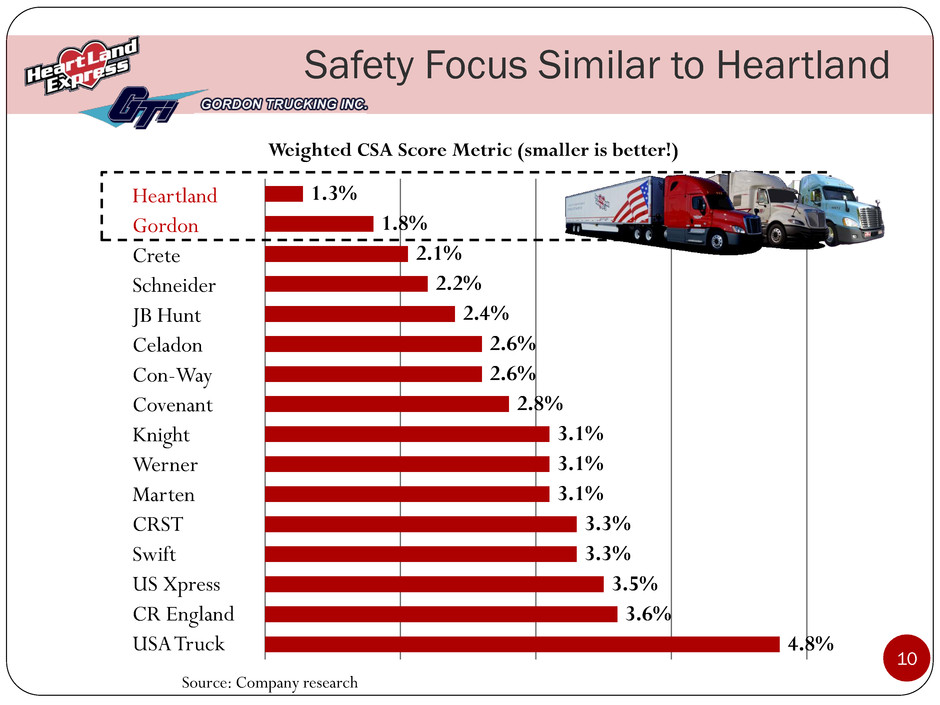
Safety Focus Similar to Heartland 10 Heartland Gordon Crete Schneider JB Hunt Celadon Con-Way Covenant Knight Werner Marten CRST Swift US Xpress CR England USA Truck 1.3% 1.8% 2.1% 2.2% 2.4% 2.6% 2.6% 2.8% 3.1% 3.1% 3.1% 3.3% 3.3% 3.5% 3.6% 4.8% Weighted CSA Score Metric (smaller is better!) Source: Company research

Leading in Sustainability 11

Drivers Among the Best 12 630 drivers awarded for safety in 2013 120 current drivers have over one million accident- free miles with GTI Washington State Driver of the Year awarded 6 times Below industry average turnover 2007 2008 2009 2010 2011 2012 2013 Increasing Fleet Growth Current Drivers by Experience 5+ Years 63.5% 1 Year 17.5% 3 Years 5.7% 4 Years 5.3% 2 Years 8.0%

Drivers That Shine! 13
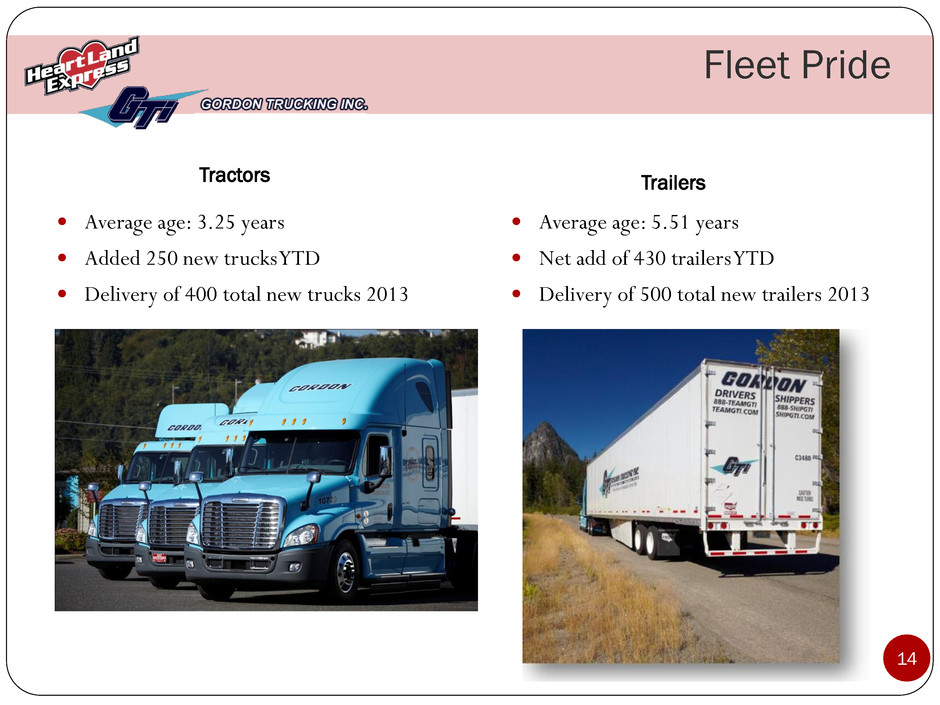
Fleet Pride 14 Average age: 3.25 years Added 250 new trucks YTD Delivery of 400 total new trucks 2013 Average age: 5.51 years Net add of 430 trailers YTD Delivery of 500 total new trailers 2013 Tractors Trailers
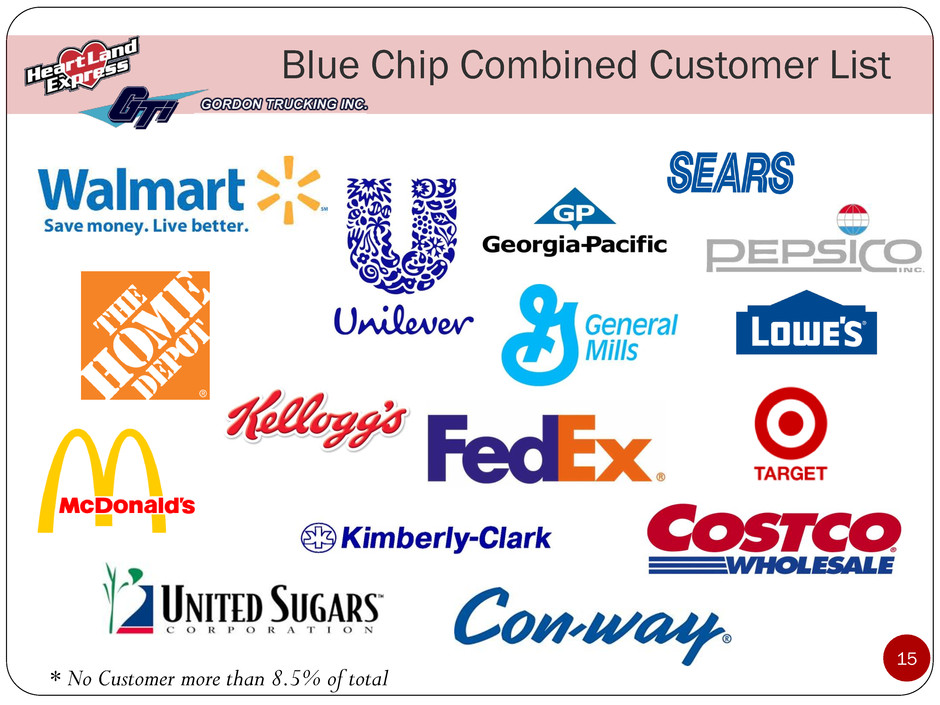
15 Blue Chip Combined Customer List * No Customer more than 8.5% of total

Asset-Based Truckload Leaders Asset-Based Carriers * 1. Schneider National 2. Swift Transportation 3. U.S. Xpress Enterprises 4. Werner Enterprises 5. Heartland Express /Gordon Trucking 6. Knight Transportation 7. Crete Carrier Corp. 8. Con-way Truckload 9. Celadon Trucking Services 10. Covenant Transport 16 * Company information and top for-hire asset-based truckload carriers in Transport Topics, July 2013

Combined Financial Snapshot 17 Heartland GTI Estimated Adjusted Combined Revenue before fuel surcharge 425,140$ 343,505$ 768,645$ Fuel surcharge revenue 109,962 89,539 199,501 Total operating revenue 535,102 433,044 968,146 Operating expenses, ex. deprec. and (gain)/loss 392,700 377,643 (1) 770,343 Depreciation 62,086 37,561 99,647 Gain on disposal of property and equipment (29,975) (4,799) (34,774) Total operating expenses 424,811 410,405 835,216 Operating income 110,291 22,639 132,930 Operating ratio, ex. (gain)/loss 89.86% Adjusted EBITDA (See reconciliation) Twelve Months Ended September 30, 2013 ESTIMATED COMBINED CONDENSED STATEMENTS OF INCOME DATA (in thousands) (unaudited) (1) GTI operating expenses are adjusted to eliminate owner compensation and other expenses that are not expected to continue after the closing and do not include all adjustments required or permitted by Regulation S-X. See non-GAAP reconciliation in Appendix.

Code Section 338(h)(10) Benefit GTI was an “S” Corporation (Most income taxes pass through to owners) Section 338(h)(10) election treats the transaction as an asset sale and liquidation Allows step-up of tax basis for depreciation of capital assets ~ $191 million tax basis in revenue equipment and other fixed assets (increase of approximately $150 million) Allows tax deduction of intangibles amortization ~ $76 million of intangibles at closing, may increase with earn-out and escrow release NPV of cash tax savings ~ $60 million, discounted at 6% 18
Synergy Goal – Minimum $30 million Major areas Optimize staffing and locations Maintenance programs improved and more insourced repairs Insurance programs Purchasing power Yield improvement/dispatch efficiency Earn-out strongly linked to consolidated adjusted EBIT goals to align all personnel (Adjusted EBIT excludes gain/loss on asset sales, transaction costs) Synergies expected to be achieved steadily through 2017 (approximately 25% annually), with stretch goal of three years Long-term goal is mid-to-low 80s consolidated operating ratio, debt-free balance sheet 19

Synergy Details Facilities • Eliminate drop lots where overlap • Combine Phoenix service center • Use regional clusters to consolidate some management functions • Savings in rent, utilities, taxes, insurance, security Maintenance • In-source repairs and maintenance over combined network (helps Heartland in West, GTI in East) • Optimize staffing and maintenance locations • Freshen GTI fleet • Savings in cost of outside repairs and tires, out of route miles, and equipment downtime Tractor/Non-Driver Ratio • Heartland ~ 6.0 to 1 • GTI ~ 3.5 to 1 • Combine certain back-office functions, obtain economies of scale, freshen fleet • Address gradually through growth of fleet, attrition, opportunity for relocation, and selective reduction Yield Improvement/Dispatch Efficiency • Opportunities to improve load matching, especially in each others’ geographic strong points • Replace lower-quality freight with a demand from combined customer list • Cross-sell services 20

Stockholder Perspective ~ $300 million closing enterprise value ~ 5.0x adjusted EBITDA, based on LTM September 2013 ~ 4.0x after considering NPV of expected future cash tax savings from Section 338(h)(10) election Strong alignment of Gordons with other stockholders $20 million earn-out represents .67x incremental consolidated adjusted EBIT $41 million in HTLD stock with holding requirement Gordon family becomes top 5 stockholder Cash investment (after payoff of assumed GTI debt) will be funded at annual after-tax cost of less than 1.00% ~ $95 million floating at LIBOR + 62.5 bps/year (currently 0.865%) ~ $165 million from HTLD cash balances which had been earning under 20 bps/year Heartland balance sheet remains strong $383 million in stockholders’ equity vs. $95 million debt < 0.5x Leverage Ratio (Debt/Combined LTM EBITDA) Expected to repay acquisition debt ~ YE 2015 Earnings accretion Immediately accretive, excluding transaction-related expenses Expected to be meaningfully accretive in 2014 Cash-flow benefits from Section 338(h)(10) election 21

Appendix – Financial Information 22 Red, White and Blue Across America! Two companies with great traditions come together to build an industry leading force in serving the top shippers in America, with the best CSA safety scores in the nation, and a relentless focus on employee success.

GTI Adjusted EBITDA This presentat ion contains EBITDA, Adjusted EBITDA, and Adjusted Operat ing Ratio, which are " non-GAAP financial measures" as that term is defined in Regulat ion G of the Securit ies Exchange Act of 1934. In accordance with Regulat ion G, Heart land has reconciled these non-GAAP financial measures to their most direct ly comparable U.S. GAAP measure. EBITDA, Adjusted EBITDA, and Adjusted Operat ing Ratio are included because Heart land used these measures in evaluat ing the GTI acquisit ion, and management believes these measures provide investors and securit ies analysts information used generally in evaluat ing acquisit ions in Heart land's industry. EBITDA, Adjusted EBITDA, and Adjusted Operat ing Ratio are not intended to represent, and should not be considered more meaningful than, or as an alternat ive to, net income. Investors should not place undue reliance on these measures, as Heart land primarily evaluates its results using net income. Estimated Twelve Months Ended September 30, 2013 Net Income(1) 16,331$ Plus: Income tax expense(1) 188 Interest expense 3,493 Depreciation and amortization 37,561 Earnings before interest, taxes, depreciation and amortization (EBITDA) 57,573 Adjustments:(2) Discontinued owner expenses 983 Discontinued facilities and aircraft costs 1,130 Other unusual items 410 Adjusted EBITDA 60,096$ (1) GTI was an S corporation prior to acquisition date and thus did not recognize federal or most state income taxes. (2) Adjustment items are not expected to continue. These do not constitute all adjustments that are required or permitted under Regulation S-X. 23

GTI Adjusted Operating Ratio (DOLLARS IN THOUSANDS) (Unaudited) Estimated Twelve Months Ended September 30, 2013 Total revenue 433,045$ Total operating expenses 413,161 Operating Ratio (Total operating expenses/total revenue) 95.4% Total revenue 433,045 Less: Fuel surcharge revenue 89,539 Revenue excluding fuel surcharge revenue 343,505$ Total operating expenses 413,161$ Adjusted for: Fuel surcharge revenue (89,539) Discontinued owner expenses (983) Discontinued facilities and aircraft costs (1,130) Other unusual items (410) Adjusted operating expense 321,099$ Adjusted operating ratio (Adjusted operating expense/Revenue exc. fuel surcharges) 93.5% 24
