Attached files
| file | filename |
|---|---|
| 8-K - 8-K - Fairway Group Holdings Corp | a13-23942_18k.htm |
Exhibit 99.1
|
|
Second Quarter Review November 7, 2013 0 |
|
|
Forward Looking Statements/ Safe Harbor Except for historical information contained herein, the statements in this release are forward-looking and made pursuant to the safe harbor provisions of the Private Securities Litigation Reform Act of 1995. Forward-looking statements involve known and unknown risks and uncertainties and other factors that may cause Fairway's actual results in current or future periods to differ materially from forecasted results. Food retail is a large and highly competitive industry, and Fairway’s business involves many risks and uncertainties, including, but not limited to: our ability to open new stores on a timely basis or at all; our ability to achieve sustained sales and profitable operating margins at new stores; the availability of financing to pursue our new store openings on satisfactory terms or at all; our ability to compete effectively with other retailers; our ability to maintain price competitiveness; the geographic concentration of our stores; our ability to maintain or improve our operating margins; our history of net losses; ordering errors or product supply disruptions in the delivery of perishable products; restrictions on our use of the Fairway name other than on the East Coast and in California and certain parts of Michigan and Ohio; our ability to retain and attract senior management, key employees and qualified store-level employees; rising costs of providing employee benefits, including increased healthcare costs and pension contributions due to unfunded pension liabilities; our ability to satisfy our ongoing capital needs and unanticipated cash requirements; and other risk factors detailed in our filings with the Securities and Exchange Commission (“SEC”), and available at the SEC's website at www.sec.gov. You are urged to consider these factors carefully in evaluating the forward-looking statements herein and are cautioned not to place undue reliance on such forward-looking statements, which are qualified in their entirety by this cautionary statement. The forward-looking statements made herein speak only as of the date of this presentation and the company undertakes no obligation to publicly update such forward-looking statements to reflect subsequent events or circumstances. Actual results could differ materially from anticipated results. More detailed information about these and other factors is set forth on Fairway’s Annual Report on Form 10-K for the fiscal year ended March 31, 2013 and in subsequent filings with the Securities and Exchange Commission. |
|
|
Chelsea, Manhattan store open (July 2013) Desirable high traffic location Nanuet, New York store open (Oct 2013) Exceeding initial expectations Signed lease for Lake Grove, Long Island store (Est. Spring 2014) Located in a premier retail corridor on Long Island Signed lease for TriBeCa, Manhattan store (Est. Fall 2014) Full-size NYC store to serve TriBeCa and Battery Park City Signed lease for Hudson Yards, Manhattan store (Est. Spring 2015) Fairway to be anchor food tenant at $15 billion redevelopment Signed LOI for another powerful New York City location Real Estate Pipeline 18 stores in operations or scheduled to operate by end of CY2015 |
|
|
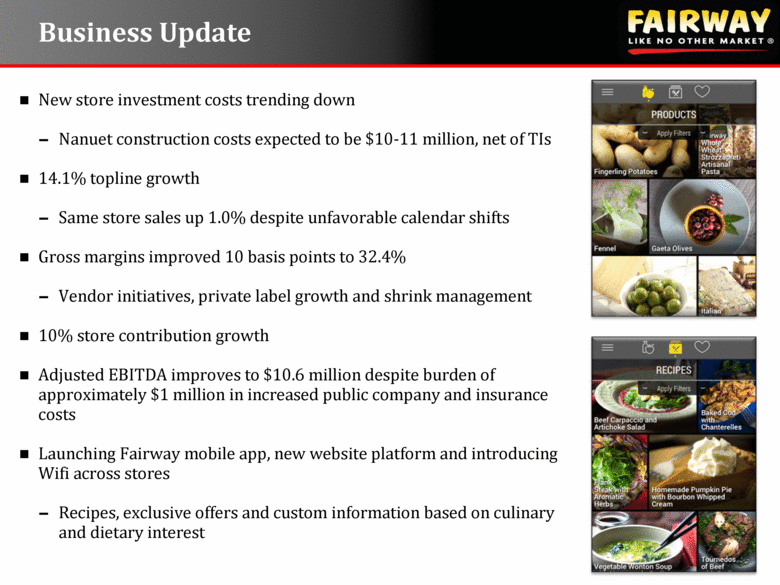
New store investment costs trending down Nanuet construction costs expected to be $10-11 million, net of TIs 14.1% topline growth Same store sales up 1.0% despite unfavorable calendar shifts Gross margins improved 10 basis points to 32.4% Vendor initiatives, private label growth and shrink management 10% store contribution growth Adjusted EBITDA improves to $10.6 million despite burden of approximately $1 million in increased public company and insurance costs Launching Fairway mobile app, new website platform and introducing Wifi across stores Recipes, exclusive offers and custom information based on culinary and dietary interest Business Update |
|
|
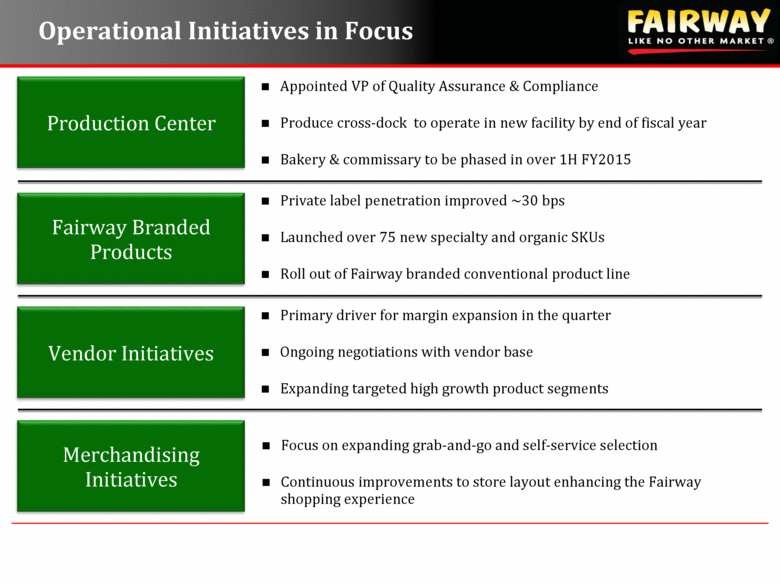
Operational Initiatives in Focus Production Center Appointed VP of Quality Assurance & Compliance Produce cross-dock to operate in new facility by end of fiscal year Bakery & commissary to be phased in over 1H FY2015 Private label penetration improved ~30 bps Launched over 75 new specialty and organic SKUs Roll out of Fairway branded conventional product line Primary driver for margin expansion in the quarter Ongoing negotiations with vendor base Expanding targeted high growth product segments Fairway Branded Products Vendor Initiatives Merchandising Initiatives Focus on expanding grab-and-go and self-service selection Continuous improvements to store layout enhancing the Fairway shopping experience |
|
|
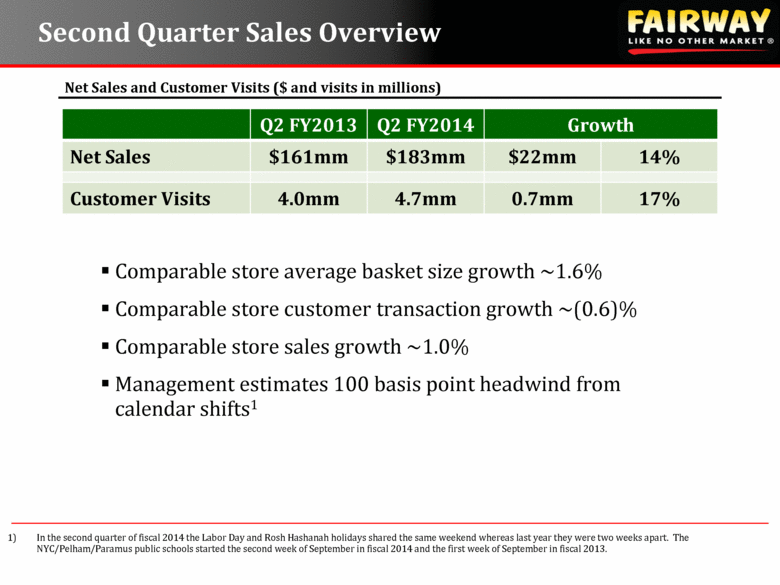
Net Sales and Customer Visits ($ and visits in millions) Second Quarter Sales Overview Q2 FY2013 Q2 FY2014 Growth Net Sales $161mm $183mm $22mm 14% Customer Visits 4.0mm 4.7mm 0.7mm 17% Comparable store average basket size growth ~1.6% Comparable store customer transaction growth ~(0.6)% Comparable store sales growth ~1.0% Management estimates 100 basis point headwind from calendar shifts1 In the second quarter of fiscal 2014 the Labor Day and Rosh Hashanah holidays shared the same weekend whereas last year they were two weeks apart. The NYC/Pelham/Paramus public schools started the second week of September in fiscal 2014 and the first week of September in fiscal 2013. |
|
|
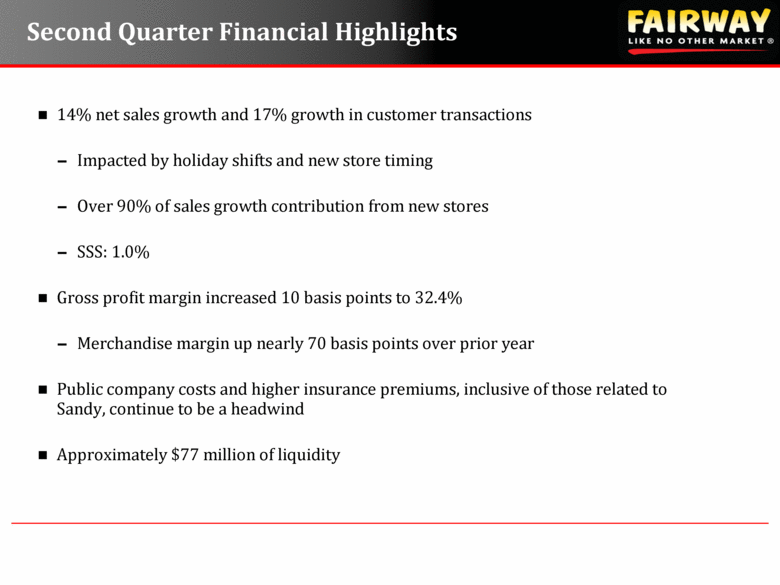
14% net sales growth and 17% growth in customer transactions Impacted by holiday shifts and new store timing Over 90% of sales growth contribution from new stores SSS: 1.0% Gross profit margin increased 10 basis points to 32.4% Merchandise margin up nearly 70 basis points over prior year Public company costs and higher insurance premiums, inclusive of those related to Sandy, continue to be a headwind Approximately $77 million of liquidity Second Quarter Financial Highlights |
|
|
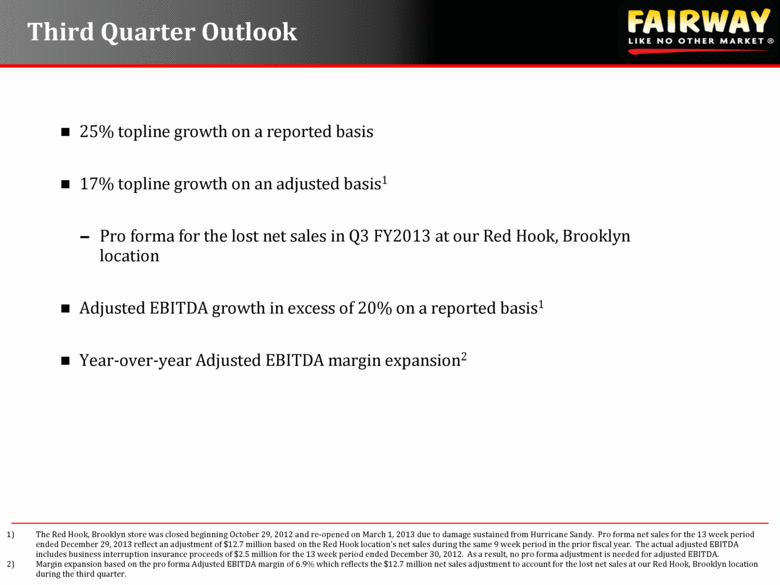
25% topline growth on a reported basis 17% topline growth on an adjusted basis1 Pro forma for the lost net sales in Q3 FY2013 at our Red Hook, Brooklyn location Adjusted EBITDA growth in excess of 20% on a reported basis1 Year-over-year Adjusted EBITDA margin expansion2 Third Quarter Outlook The Red Hook, Brooklyn store was closed beginning October 29, 2012 and re-opened on March 1, 2013 due to damage sustained from Hurricane Sandy. Pro forma net sales for the 13 week period ended December 29, 2013 reflect an adjustment of $12.7 million based on the Red Hook location’s net sales during the same 9 week period in the prior fiscal year. The actual adjusted EBITDA includes business interruption insurance proceeds of $2.5 million for the 13 week period ended December 30, 2012. As a result, no pro forma adjustment is needed for adjusted EBITDA. Margin expansion based on the pro forma Adjusted EBITDA margin of 6.9% which reflects the $12.7 million net sales adjustment to account for the lost net sales at our Red Hook, Brooklyn location during the third quarter. |

