Attached files
| file | filename |
|---|---|
| 8-K - 8-K - EQUITY ONE, INC. | d627106d8k.htm |
 Investor Presentation
November 2013
Improving retail real estate in urban communities
Exhibit 99.1 |
 Forward
Looking Statements 1
Certain matters discussed by Equity One in this presentation constitute forward-looking statements
within the meaning of the federal securities laws. Forward-looking statements can be
identified by the use of forward-looking terminology such as “may,”
“will,” “might,” “would,” “expect,” “anticipate,” “estimate,” “could,” “should,” “believe,” “intend,” “project,”
“forecast,” “target,” “plan,” or “continue” or the negative of
these words or other variations or comparable terminology. Although Equity One believes that
the expectations reflected in such forward-looking statements are based upon reasonable
assumptions, it can give no assurance that these expectations will be achieved. Factors that could cause
actual results to differ materially from current expectations include volatility in the capital
markets and changes in borrowing rates; changes in macro-economic conditions and the demand
for retail space in the states in which Equity One owns properties; the continuing financial
success of Equity One’s current and prospective tenants; the risks that Equity One may not
be able to proceed with or obtain necessary approvals for development or redevelopment projects
or that it may take more time to complete such projects or incur costs greater than anticipated; the
availability of properties for acquisition; the timing, extent and ultimate proceeds realized
from asset dispositions; the extent to which continuing supply constraints occur in geographic
markets where Equity One owns properties; the success of its efforts to lease up vacant space;
the effects of natural and other disasters; the ability of Equity One to successfully integrate
the operations and systems of acquired companies and properties; changes in Equity One’s credit
ratings; and other risks, which are described in Equity One’s filings with the Securities
and Exchange Commission.
This presentation also contains non-GAAP financial measures, including Funds from Operations, or
FFO. Reconciliations of these non-GAAP financial measures to the most directly
comparable GAAP measures can be found in Equity One’s quarterly supplemental information
package and in filings made with the SEC which are available on its website at
www.equityone.net. |
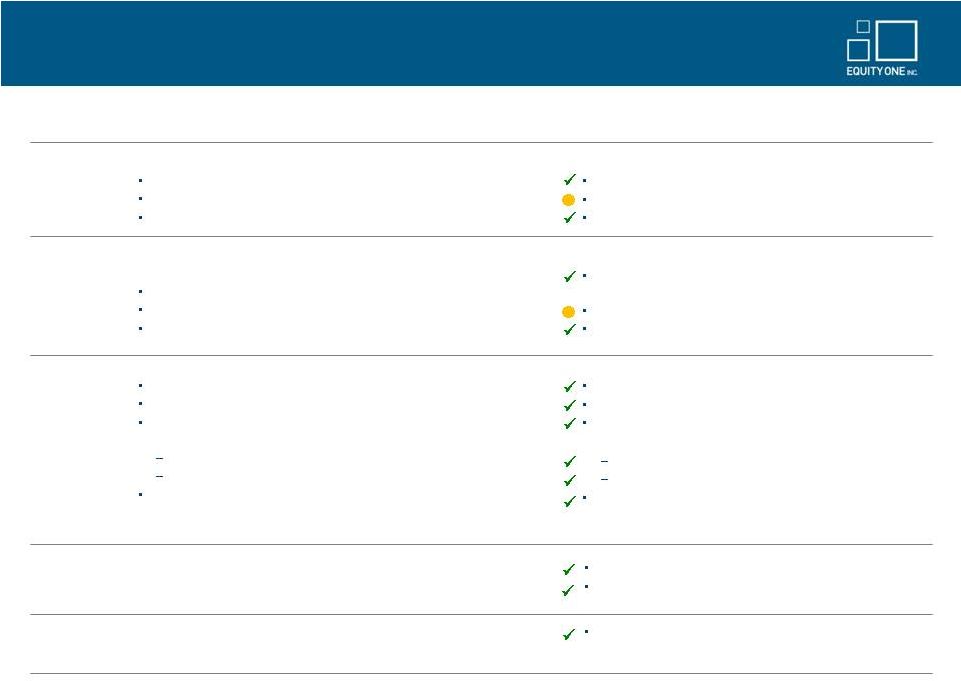
 Investment Considerations
2
•
Proven management team that has successfully executed a stated transformation
strategy to upgrade and diversify a portfolio of dominant retail assets in
the most densely populated coastal markets of the U.S. •
Five year capital recycling plan is nearly complete
–
Approximately $2 billion of acquisitions since 2009 in target markets
–
Approximately $1 billion of dispositions since 2009 of non-strategic,
non-core assets •
Upgraded portfolio provides attractive shadow pipeline of redevelopment
opportunities that reflect over $500 million of possible investment
•
Recent
acquisitions
include
many
anchor
leases
with
below
market
rents
and
short
term
expirations
•
Strong balance sheet with modest leverage, ample liquidity and well-laddered
debt maturities •
Financial capacity and proven ability to execute on additional opportunistic
acquisitions and redevelopments We are a premier operator of quality retail
properties and are positioned for continued growth |
 Corporate Snapshot
3
•
Equity One owns, manages, acquires, develops and redevelops quality retail properties located in
supply constrained communities in major coastal markets of the United States
•
As
•
Our capital recycling program has significantly improved our geographic diversification and portfolio
demographics
•
Our largest geographic markets as measured by approximate fair market values are Northeast (32%),
South Florida –
•
Our properties have average population density within 3 miles of 204k and average household income
within 3
•
The grocer sales in our portfolio average in excess of $550 per square foot
•
As of September 30, 2013, our total equity market capitalization and total enterprise value were $2.8
billion and •
We have investment grade credit ratings of Baa2 (stable) from Moody’s and BBB- (positive)
from S&P
(1)
Includes acquisitions and dispositions under contract as of 10/30/2013. Excludes land and
non-core assets not associated with retail centers. Additionally, we have joint
venture interests in eighteen retail properties and two office buildings totaling approximately 3.4
million sf. (2)
Based on total estimated fair market value of operating property portfolio as of 9/30/2013.
Includes acquisitions and dispositions under contract as of 10/30/2013. Excludes land and
unconsolidated JV properties.
(3)
Demographic data based on weighted estimated fair market value of assets. Includes acquisitions and
dispositions under contract as of 10/30/2013. Source: Sites USA.
(4)
Based on diluted shares of 129.4 million.
$4.3
billion,
respectively
(4)
miles of $95k
(3)
of
September
30,
2013,
we
owned
128
operating
properties
in
13
states
(1)
Non-core
properties
represent
only
7%
of
our
portfolio
(2)
(26%)
and
California
(22%)
(2) |
 3Q13
Summary Highlights Earnings
•
3Q13 FFO and Recurring FFO were both $0.30/share, Recurring FFO was up 7% over
3Q12 •
Recurring
FFO
guidance
was
increased
to
$1.22
to
$1.23/share
(from
$1.20
-
$1.23/share)
Operating fundamentals
•
Same property NOI increased 3.7% vs. 3Q12, and full year guidance was updated to
+3.0% to 3.5% •
Consolidated Shopping Center occupancy was 92.4%, a 90 bps increase vs. 2Q13
•
Same property occupancy increased 30 bps to 92.1% vs. 2Q13, and was flat compared
to 3Q12 •
Executed 139 new leases, renewals and options totaling 812,495 sf at an average
rent spread of 9.3% on a same space basis •
Average base rents were up 7.2% over the prior year to $15.52/sf, and up 1.1%
sequentially Disposition activities
•
Substantial progress on asset disposition plan which is on target to reach budgeted
levels 4
Investing activities
•
Closed on three of the seven Westwood Complex parcels for a gross purchase price of
$23 million. Net of $17.8 million of financing previously provided
against these three parcels, the additional funding was $5.2 million.
•
In October, closed on The Village Center in Westport, CT for a gross purchase price
of $54.3 million, consisting of four buildings totaling 90,000 sf that are
98% leased. •
In October, acquired Pleasanton Plaza in Pleasanton, CA for a gross purchase price
of $30.9 million, anchored by JCPenny Home Store, OfficeMax, and Cost Plus
World Market. The center is approximately 163,000 sf and 96% leased.
•
Joint
Venture
with
NY
Common
Retirement
Fund
acquired
Riverfront
Plaza
in
Hackensack,
NJ
for
$47.8
million,
a
129,000
sf
97%
leased
shopping
center
anchored
by
ShopRite.
The
acquisition
closed
in
October.
Development and redevelopment activities
•
Broadway Plaza development and Serramonte redevelopment progressing on plan
–
Year
to
date
through
10/30/13,
29
non-core
assets
were
sold
for
$236.2
million
and
an
additional
seven
non-core
assets
were
under contract
for
sale
for
$65.9
million
(including
pro
rata
share
of
a
JV
property).
The
weighted
average
capitalization
rate
of
non-core
assets disposed and under contract as of 9/30/13 is approximately 7%
|
 Meet
or exceed fundamental operating goals SS NOI growth + 2% to 3%
SS Occupancy + 50 to 100 bps
Recurring FFO of $1.18 to $1.22/share
Continue to upgrade portfolio quality and demographic profile
through strategic transactions
Core acquisition activity of $100 to $200 million
JV acquisition activity of $100 to $200 million
Non-core asset dispositions of $300 million
Continue to strengthen development and redevelopment pipeline
Complete lease up of The Gallery at Westbury Plaza
Significantly advance construction at the Broadway Plaza site
Establish additional redevelopment and densification plans at
Serramonte
Substantially complete Dick’s Sporting Goods
Develop expansion plans to add entertainment wing
Close on the Westwood Complex and work on redevelopment
plans
Maintain low leverage and ample liquidity
Continue to strengthen credit metrics and maintain large
unencumbered asset base
Upgrade
information
technology
systems
–
implement
IT
strategic plan that is aligned with our operational strategy
Operating
Fundamentals
Portfolio
Quality
Value
Creation
Balance
Sheet
Management
Operations
Progress Against 2013 Strategic Goals
2013 Goals
3Q Progress Assessment
Updated guidance to +3.0% to 3.5%
3Q SS Occupancy flat vs. 3Q12
Updated guidance to $1.22 to $1.23/share
On track for $100 to $200 million of core acquisition activity,
inclusive of Westwood
Revised JV acquisition guidance to $50 to $75 million in 2Q
As of 10/30/13, $236.2 million closed, $65.9 million under
contract (including pro rata share of JV)
The Gallery is now 95% leased or under LOI
Leases signed for 63% of GLA, additional 8% under LOI
Serramonte Phase II planning in process
On track to open Dick’s in 1Q 2014
In discussion with theater operators and restaurants
Closed on five Westwood parcels; remaining two
expected by January 2014 ($80 million value / $19.5
million net funding remaining)
42.9% net debt to gross real estate at 9/30/13
Unencumbered cash NOI exceeds 75% for 3Q
New budget system implementation completed,
utilized for 2014 budget cycle
5 |
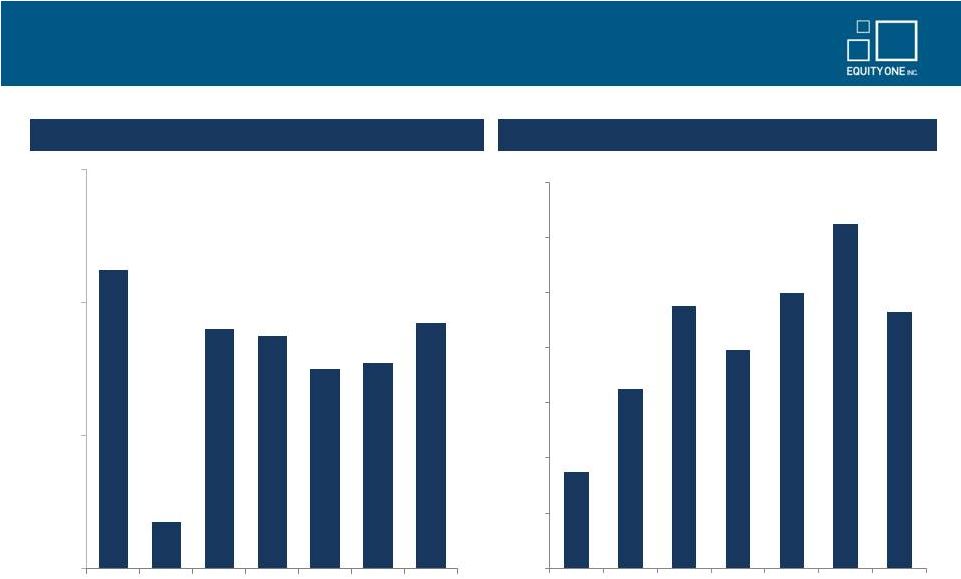 Improved Portfolio Quality Evident in Recent Operating Fundamentals
6
Rent
Spread
–
Total
New
Leases,
Renewals
&
Options
(2)
SS NOI Growth %
(1)
4.5%
0.7%
3.6%
3.5%
3.0%
3.1%
3.7%
0.0%
2.0%
4.0%
6.0%
Q1 '12
Q2 '12
Q3 '12
Q4 '12
Q1 '13
Q2 '13
Q3 '13
3.5%
6.5%
9.5%
7.9%
10.0%
12.5%
9.3%
0.0%
2.0%
4.0%
6.0%
8.0%
10.0%
12.0%
14.0%
Q1 '12
Q2 '12
Q3 '12
Q4 '12
Q1 '13
Q2 '13
Q3 '13
(1)
NOI growth is presented on a same property cash basis as of each respective quarter. (2)
Rent spreads for new leases reflect same-space leasing where amount of rent paid by prior tenant
is available regardless of the amount of time the space has been vacant. |
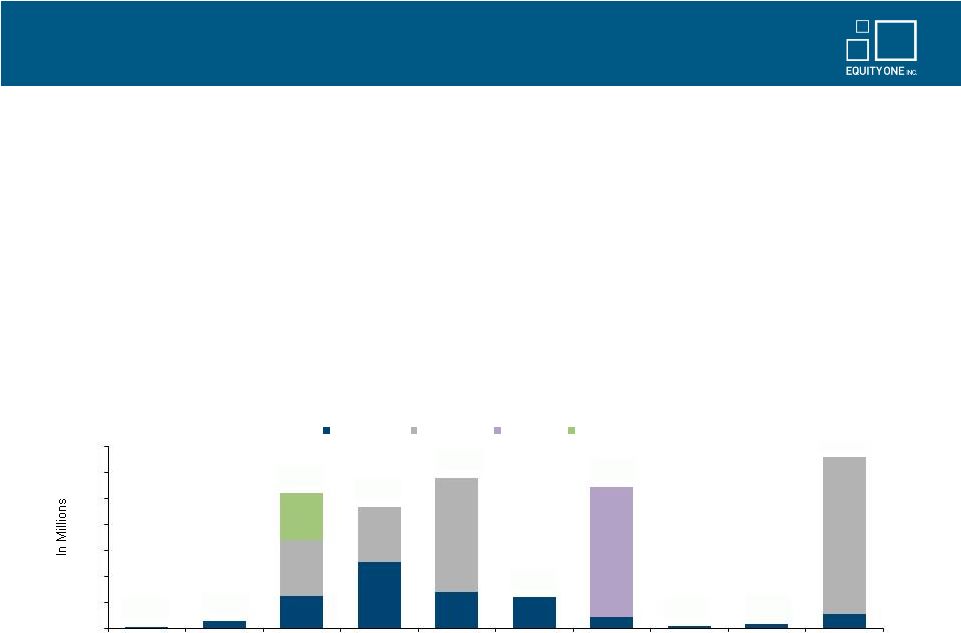
 Portfolio Growth Greatly Improved From Capital Recycling
7
Strategy
to
upgrade
and
diversify
asset
base
commenced
in
2009
and
is
largely
completed
(1)
Growth profile enhanced through the acquisition of high quality assets
Assets acquired are larger, dominant assets in major trade areas
Property acreage in newly acquired assets much greater than non-core assets
which provides redevelopment and expansion opportunities
Larger assets with higher occupancy are more efficient to operate
Stability of cash flows enhanced by selling non-core assets in secondary
markets (1)
See Appendix for selected property metrics which reflect these capital recycling
results Grocer anchor tenant sales volumes are about 50% lower than dominant
assets being acquired Rental streams more uncertain in non-core markets
as fewer barriers to entry exist and new tenant demand is subject to much
more competition Assets targeted for dispositions are in smaller markets (average 3 mile
populations around 50,000) with lower average incomes (less than $65k) |
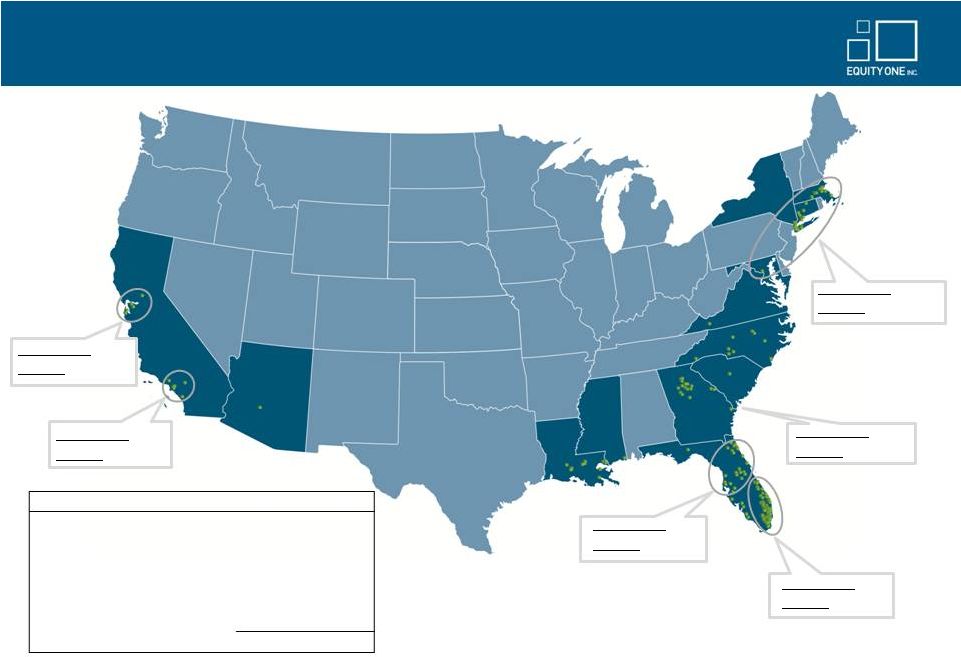 Portfolio Well Diversified in Major Supply Constrained Coastal Markets
8
Region
$ FMV
(1)
% FMV
Northeast
$1,217
32%
South Florida
$993
26%
West Coast
$826
22%
North Florida
$286
8%
Southeast
$202
5%
Non-Core (Southeast, Florida)
$245
7%
Total
$3,769
100%
(1)
Data includes acquisitions and dispositions completed and under contract as of
October 30, 2013. Excludes land and non-core assets not associated with retail
centers. IFRS fair market values are as of 9/30/13.
Estimated FMV: $1,217
% of FMV: 32%
Estimated FMV: $202
% of FMV: 5%
Estimated FMV: $993
% of FMV: 26%
Estimated FMV: $286
% of FMV: 8%
($ In Millions)
Estimated FMV: $185
% of FMV: 5%
Estimated FMV: $641
% of FMV: 17% |
 Below market leases
•
Recent acquisitions provide opportunity to capture market rents in coming
years –
1175
Third
Avenue
(New
York,
NY)
-
Food
Emporium
was
paying
$42
psf,
now
paying
$105
psf
–
Aventura
Square
(Aventura,
FL)
-
Old
Navy
pays
$18
psf
lease
expires
1/2014,
executed
renewal
during 2Q at $45 psf commencing 2/2014; DSW pays $20 psf, lease expires 2018
–
101
7th
Avenue
(New
York,
NY)
-
Loehmann’
s
pays
$25
psf,
lease
expires
3/31/2016
–
Westwood
(Bethesda,
MD)
-
Giant
Food
pays
$2.00
psf,
lease
expires
2019
–
Copps
Hill
(Ridgefield,
CT)
-
Kohl’s
pays
$2.40
psf,
lease
expires
2021
–
Circle
Centers
(Long
Beach,
CA)
-
three
anchor
tenants
expiring
2016,
2018
and
2022,
each
paying ~50% of market
–
The
Village
Center
(Westport,
CT)
–
several
below
market
leases
rolling
within
three
years
Increase occupancy with
focus on small shops
•
Small shop occupancy was 81.5% at 9/30/13 and represents opportunity to drive
incremental NOI •
“Mom and Pop”
shops being replaced by stronger franchise operators
•
Employment
and
housing
continue
to
strengthen,
especially
in
Florida
(1)
Redevelopment and site
densification
•
Recent acquisitions provide opportunity for redevelopment and densification
–
Serramonte
-
entertainment
wing
with
movie
theaters
and
restaurants
will
be
next
phase
–
Potrero -
opportunity to increase density
–
Danbury/Southbury/Compo
Acres/Darinor
Plaza
-
expansion
and
additional
outparcel
opportunities
Additional core
acquisitions
•
We plan to further build and increase our portfolio in our core urban
markets •
Assets
with
highly-productive
anchors,
below
market
anchor
rents,
and
redevelopment
opportunities
Expense control
•
Intense focus on managing general and administrative costs throughout
organization, and on cost recovery and careful management of
non-recoverable costs Our Path to Sustained NOI Growth
9
(1)
Florida unemployment rate at 7.1% in July 2013 (vs. 8.7% in July 2012 and 10.4% in July 2011), per
Bureau of Labor Statistics. Florida housing market improved with 14% year over year
increase in home price, per Florida Realtors for 2Q’13 vs. 2Q’12 for median price for single-family home, as of August 2013. |
 Our
Path to Increased Occupancy 10
•
Through a combination of organic leasing and capital recycling, goal is to grow occupancy from 92.4%
to 95% by end of
2014
Approximately 100 bps of increased occupancy is expected to come from same property organic leasing
and 150 bps is expected to come from dispositions and redevelopment
•
Organic occupancy growth is being driven by:
Targeting tenants benefitting from improved local economic conditions (food users, value oriented/
discounters, franchise operators, and specialty grocers)
Investment in site redevelopment and anchor re-tenanting, as new and better anchor tenants can
drive traffic to shop space and increase demand for shop space
Focus on attracting stronger shop operators, including national franchise operators
•
We will continue to divest lower quality assets that have higher vacancy rates
These assets are generally located in secondary or tertiary markets with lower density, lower
household income and weaker retail demand characteristics
Typically these assets have a value of less than $10 million
The “Bottom 10” assets, with a cumulative estimated IFRS value of approximately $75 million
(as of 9/30/2013), had average occupancy of 67% and average base rents of $10.49 psf at
9/30/2013
Divesting these “Bottom 10” assets would raise the portfolio average core occupancy from
92.4% to 94.4%, and the portfolio average shop occupancy from 81.5% to 84.1%
–
–
–
–
–
–
–
– |
 Disciplined Capital Allocation Has Preserved A Strong Balance Sheet
11
•
Key balance sheet statistics as of September 30, 2013:
•
Strong lending relationships with both traditional banks and life insurance
companies •
Demonstrated access to the public markets
•
$575 million revolving credit facility which matures September 30, 2015 with a one
year extension option •
Modest leverage, ample liquidity and well-laddered debt maturities
–
Adjusted EBITDA to fixed charges: 2.8x
–
Weighted
average
term
to
maturity
for
total
debt:
5.3
years
(1)
–
Weighted
average
interest
rate
on
total
debt:
4.99%
(1)
$2
$14
$259
$233
$289
$61
$273
$6
$9
$329
$0
$50
$100
$150
$200
$250
$300
$350
2013
2014
2015
2016
2017
2018
2019
2020
2021
Thereafter
Secured Debt
Senior Notes
Term Loan
Credit Facility
–
Net Debt to Total Market Cap: 32.8%
–
Net Debt to Gross Real Estate: 42.9%
–
Net Debt to Adjusted EBITDA: 6.6x
–
Adjusted EBITDA to interest expense: 3.1x
(1) Excludes amounts drawn under the revolving credit facility which expires on 9/30/15. Note: Debt maturity schedule as of 9/30/2013. Includes
scheduled principal amortization and excludes Brawley Commons. Credit facility is presented as due on the initial maturity
date. |
 Significant Development and Redevelopment Opportunities Will Help
Drive Future Growth
Our upgraded portfolio of larger, dominant assets has created a shadow pipeline of
redevelopment opportunities in excess of $500 million. The opportunities
being evaluated fall into the following categories: 1)
Larger
scale
expansions
and
new
ground
up
construction
(potential
range
$250
million
-
$300
million)
•
Serramonte Center
-
Dick’s, restaurant outparcels, theater/entertainment wing, new anchors
•
Westwood
Center
-
redevelop
existing
1950
neighborhood
center
to
take
advantage
of
superior
demographics
•
Potrero Center
-
further densify site/consider multi-family component
2)
Consolidate poorly utilized shop space for junior/mid box anchors
•
Kirkman Shoppes
–
LA Fitness (41k sf) backfilling poorly configured corner space, adding Walgreens
outparcel •
Pablo Plaza
–
identified 30k sf of shops that can be backfilled with two junior boxes
•
Alafaya Commons
–
eliminate 37k sf of shop space to backfill with 45k sf LA Fitness
3)
Replace underperforming anchor stores with stronger operators
•
Charlotte Square
–
backfill local furniture operator with large national discount retailer
•
Sheridan Plaza
–
relocate and downsize Office Depot, backfill with TJ Maxx
4)
Expand successful anchor tenants
•
Boynton Plaza
–
expand Publix to a new 54k sf store
•
Countryside
Shops
–
build
a
new
Publix
and
backfill
existing
box
with
value-oriented
retail
and
restaurants
5)
Add outparcels/expand existing food users
•
Darinor Plaza
–
add new Starbucks pad and relocate existing bank ATM pad
•
Point Royale
–
add bank pad to recently constructed Starbucks and Chipotle expansion
12 |
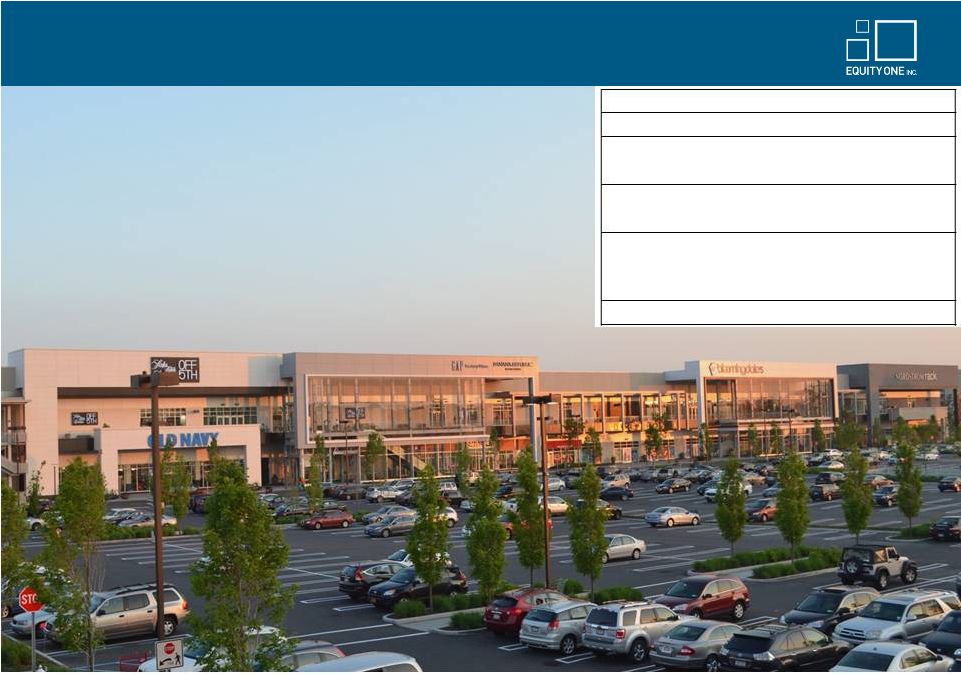 The
Gallery at Westbury Plaza – Garden City, NY
13
(1)
Net estimated cost including estimate of tax refunds for costs incurred as part of
participation in New York State’s Brownfield Cleanup Program.
Location
Westbury,
NY
GLA
312k sf
Development budget
(1)
$128.6 million
Estimated cost to complete as of 9/30/13
$10.3 million
Lease-up
Opened Fall 2012. 95% leased or under LOI as of 10/30/13.
Key tenants
Saks Fifth Avenue, Bloomingdale’s, Nordstrom Rack, Old
Navy, Trader Joe’s, Ulta, Home Goods, GAP, Banana Republic,
The Container Store, Shake Shack, Starbucks, SA Elite
Expected Stabilized yield
~11% |
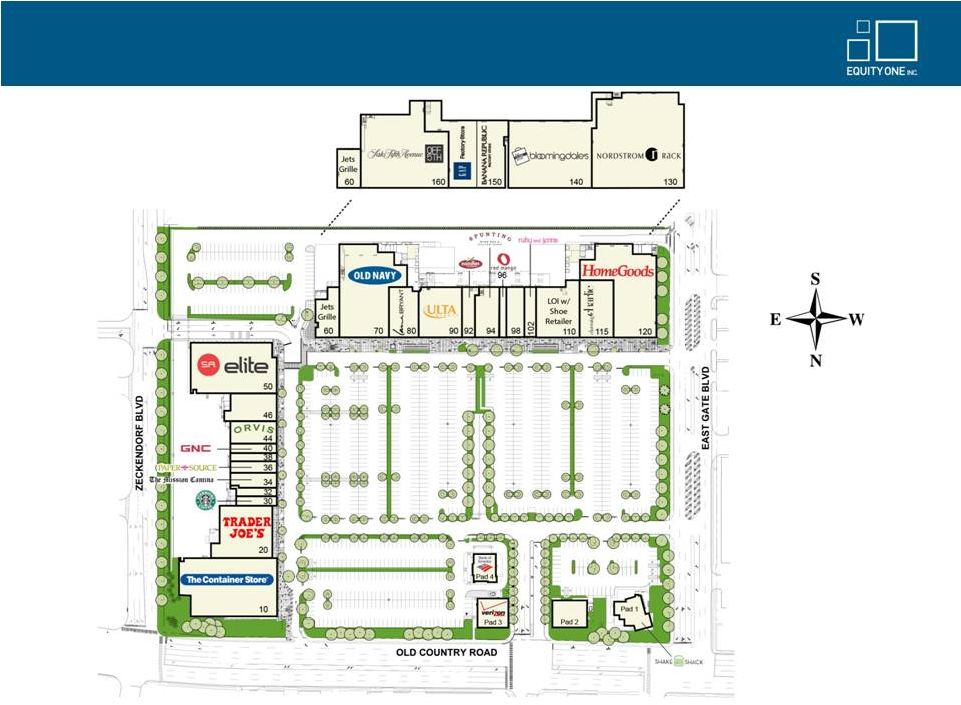 The
Gallery at Westbury Plaza – Garden City, NY (Continued)
14 |
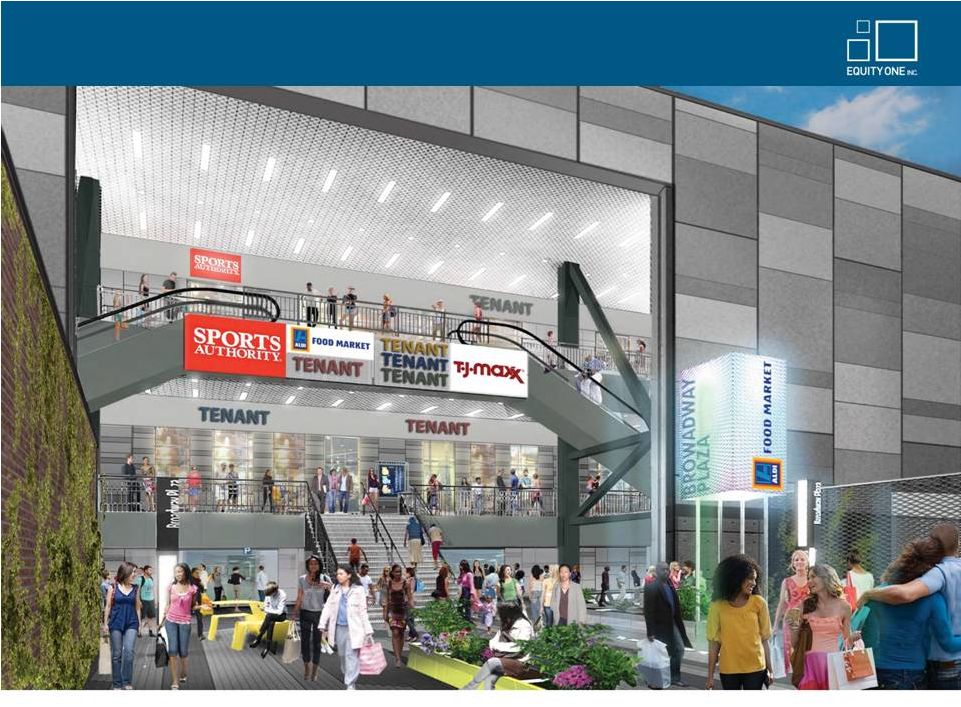
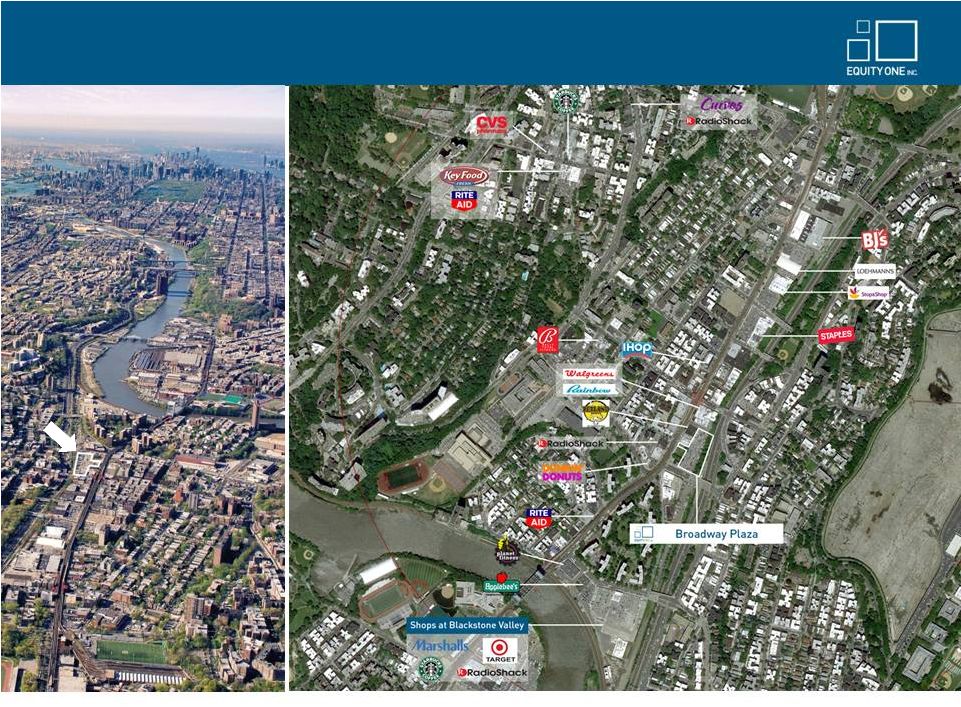 Broadway Plaza Development -
Bronx, New York
15 |
 Broadway Plaza Development -
Bronx, New York (Continued)
16
Location
Bronx, NY
GLA
115k sf
Development budget
$52.8 million
Incurred as of 9/30/13
(1)
$19.4 million
Estimated cost to complete
$33.4 million
Lease-up
Leases executed with TJ Maxx (24k sf), The
Sports Authority (30k sf), and Aldi’s (18k sf)
Est. construction completion
4Q 2014
Target NOI stabilization
2016
Expected stabilized yield
8% -
9%
(1) Includes land cost. |
 Broadway Plaza Development -
Bronx, New York (Continued)
17 |
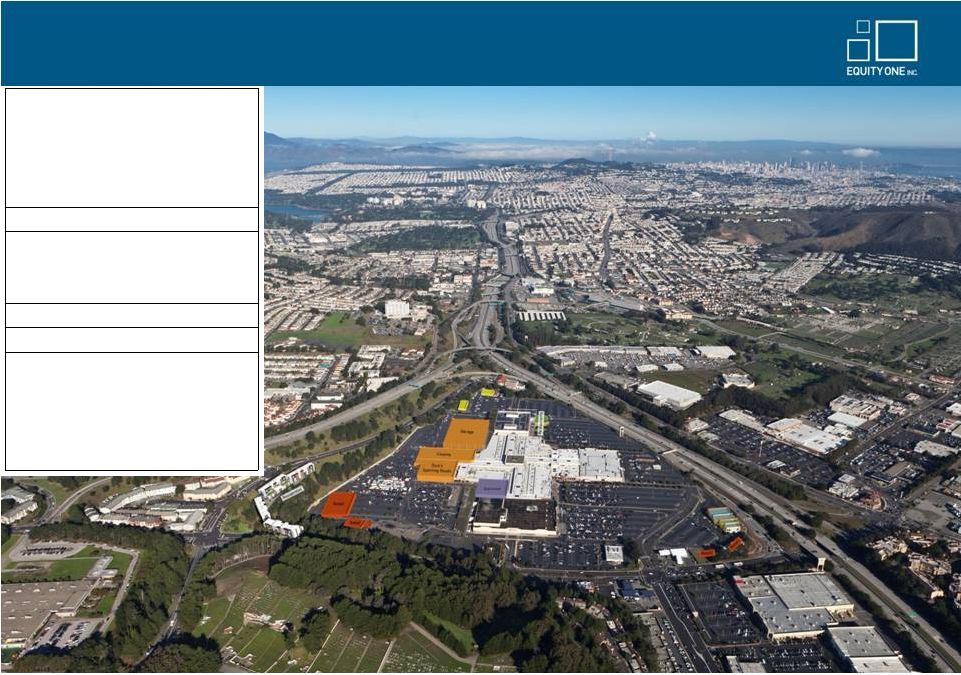 Serramonte Shopping Center -
Daly City, California
18
Active redevelopment
•
Constructing new two-story Dick’s
Sporting Goods which will become the
mall’s fourth anchor, joining Target, JC
Penney, and Macy’s
•
Phase I of a multi-phase plan to re-brand
and expand the property
Dick’s redevelopment GLA
83k sf
Redevelopment budget
$19.2 million
Incurred as of 9/30/13
$10.9 million
Estimated cost to complete
$8.3 million
Scheduled opening
Early 2014
Expected stabilized yield
~10%
Future redevelopment
•
Future phases at Serramonte will likely
add 150k to 200k sf of additional GLA
including a grocery store, pharmacy,
discounters, a theater, more restaurants,
entertainment, and possibly a residential
component. |
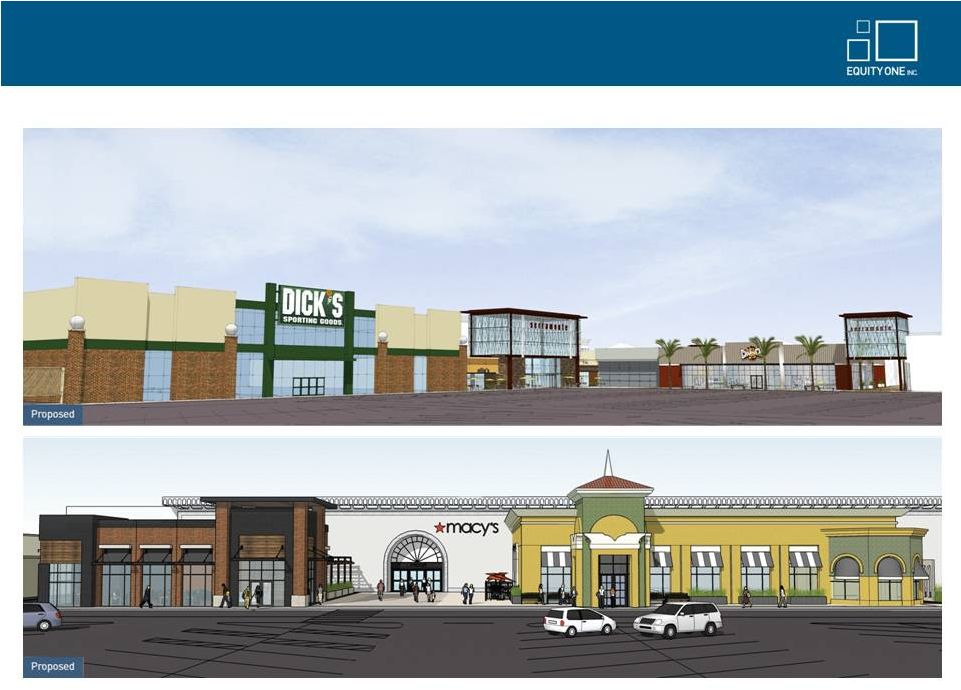 Serramonte Shopping Center -
Daly City, California (Continued)
19
Current Expansion Projects |
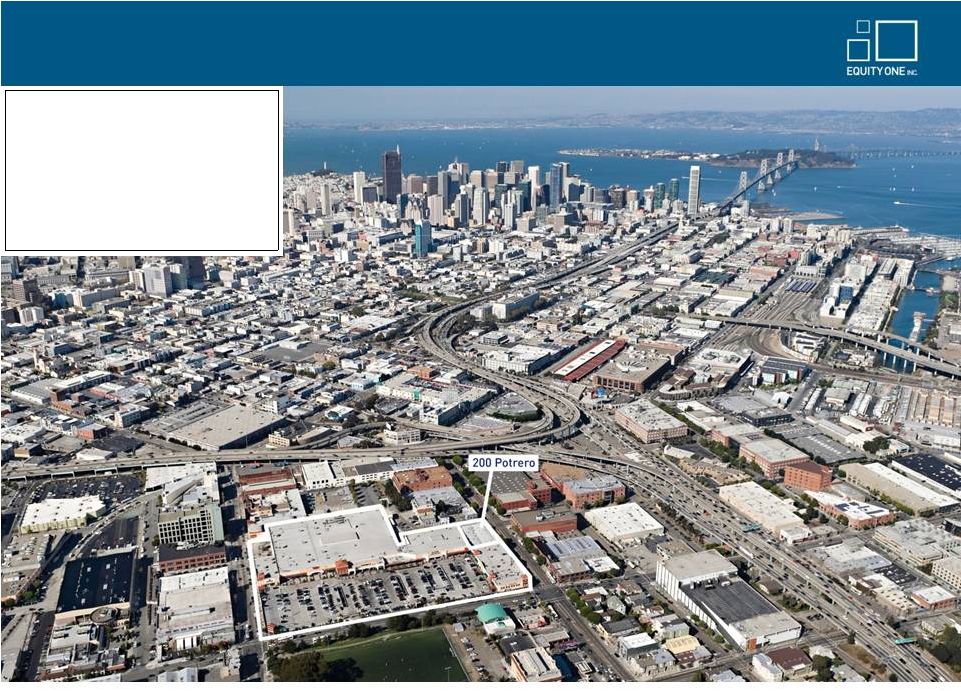 Potrero Shopping Center -
San Francisco, California
20
Future redevelopment goals
•
Densify the site with additional retail and
potentially residential units
•
May invest $75 million over the next several
years, excluding the residential component
•
Recently acquired 200 Potrero Avenue (an
adjacent 30k sf building) providing additional
flexibility to relocate tenants and improve
Potrero Center over time |
 Westwood Shopping Center -
Bethesda, Maryland
21
•
In 4Q 2012, announced agreement to acquire Westwood Complex, a 22 acre property in Bethesda, MD for
$140 million
215k sf of retail space in the highly affluent and supply constrained market outside Washington, D.C.
Superior demographics with 141k population within 3 miles and average household income of $199k
Initially structured as a $95 million funded mortgage loan, with outright purchase of property
anticipated by early 2014
•
Significant opportunities for value creation through below market rents, redevelopment and expansion
Asset has had only one owner and will benefit from capital investment and intensive asset management
Anchored by high volume Giant Food since 1959, with below market lease expiring 2019
Main center has parking ratio of 10 spaces per 1,000 sf, more than double typical shopping centers
•
Closed on five of the seven parcels comprising the Westwood Complex during second and third quarter
The remaining two parcels are expected to be acquired by January 2014
Remaining parcels purchase price of $80 million, $19.5 million net of existing financing
–
–
–
–
–
–
–
– |
 Westwood
Shopping
Center
-
Bethesda,
Maryland
(Continued)
22 |
 Westwood Shopping Center -
Bethesda, Maryland (Continued)
23 |
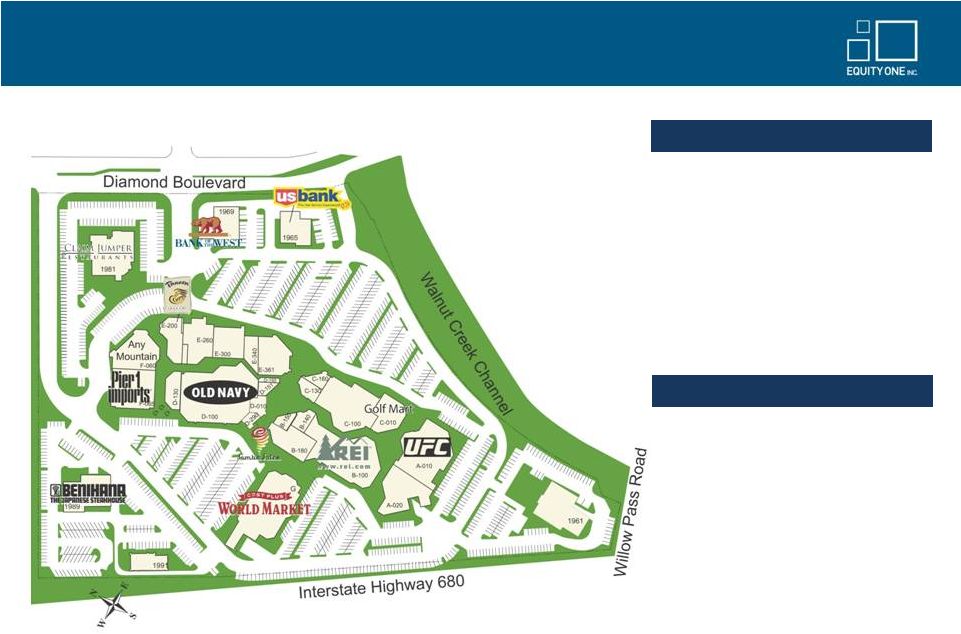 Willows Shopping Center Redevelopment –
Concord, CA
24
Redevelopment Plan
Challenges
•
Too many interior facing shop spaces
•
Poor traffic patterns limiting shopping in
the rear of the center
•
Insufficient gathering spaces and
amenities to take advantage of the
center’s longstanding connection to the
community
•
Architectural design is unconventional
and outdated
•
Create new access road to improve
circulation and visibility for shop
tenants
•
New architectural design to improve
roof lines, refresh color scheme and
use modern materials
•
Create a community plaza with play
areas and green space well suited to
host events and drive ancillary income
Current Site Plan |
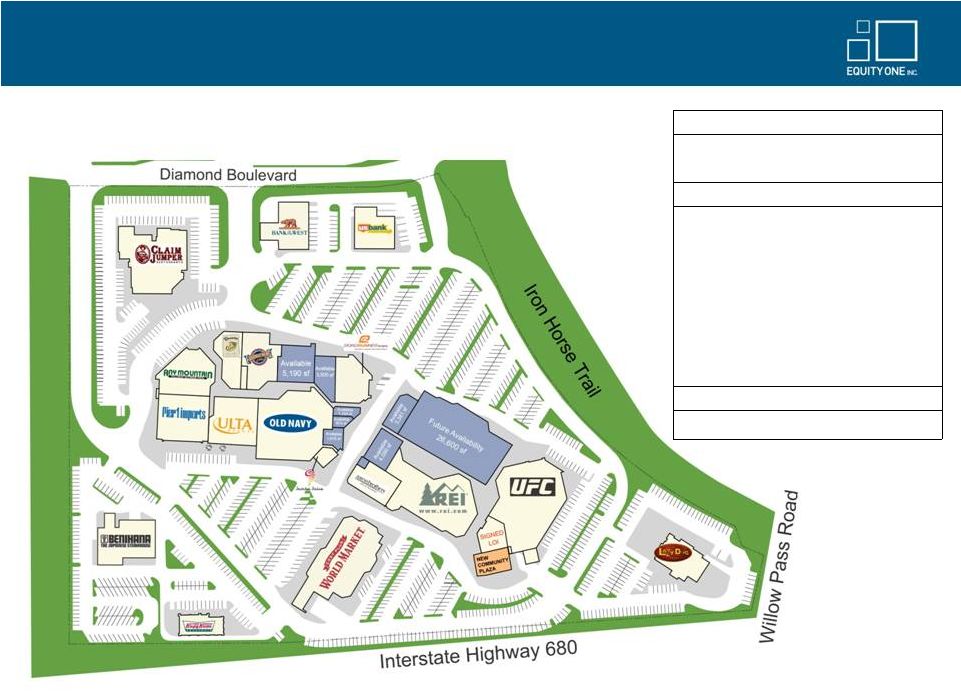 Willows
Shopping
Center
Redevelopment
–
Concord,
CA
(Continued)
25
Proposed Site Plan
Location
Concord, CA
GLA total center
251k sf
GLA redevelopment
~50k sf
Redevelopment budget
~$13 million
Project
•
Will invest $12 million to construct 20k sf of
new buildings for a new Ulta junior anchor,
an expanded UFC Gym, and new shop
space; renovate facades on 20k sf of
challenging shop space; and construct two
new vehicular roads and an open
pedestrian area.
•
An additional ~$1 million is being invested
to replace a 12k sf dated restaurant building
with a popular new concept occupying 9k sf
Target stabilization date
3Q 2015
Expected stabilized yield
~8% |
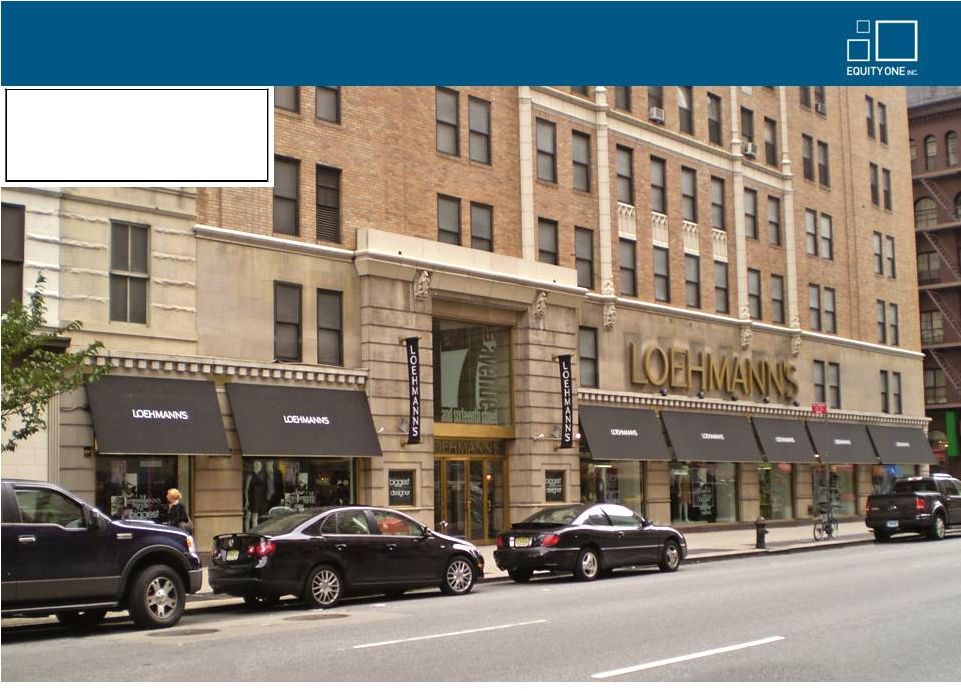 101
7
Avenue
-
New
York,
New
York
26
Highlights
•
57k sf four-story retail condominium
•
Loehmann’s lease expires March 2016
•
In-place rent of $25 psf, well below market
th |
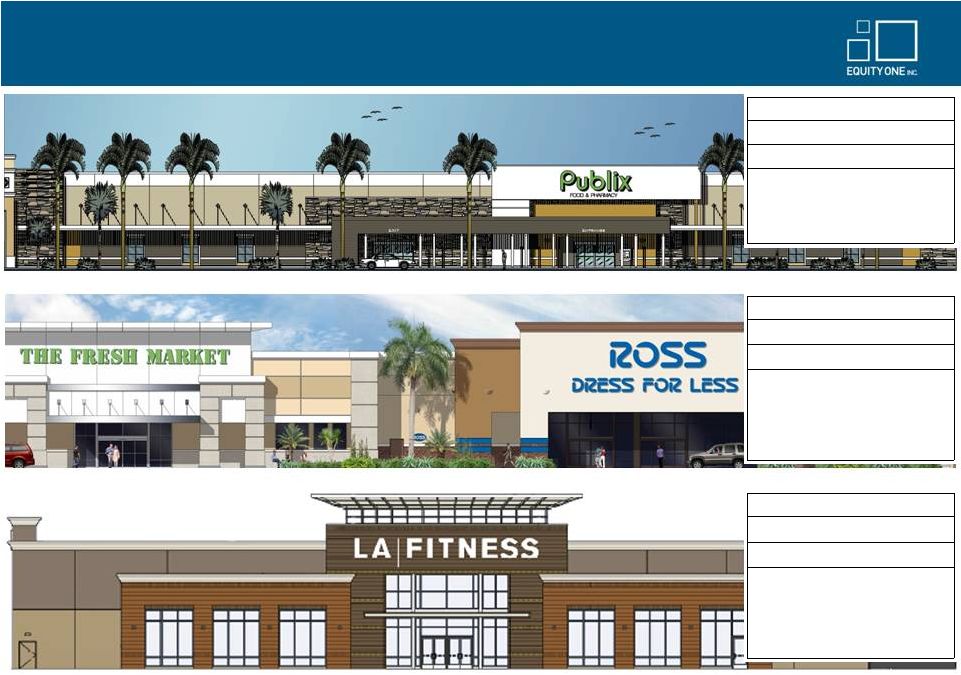 Florida Redevelopment Opportunities
27
Lake Mary Centre, Lake Mary, FL
Boynton Plaza, Boynton Beach, FL
Kirkman Shoppes, Orlando, FL
Budget
(1)
$7.6 million
Incurred as of 9/30/13
$0.3 million
Target stabilization
(2)
1Q15
Description
•
Publix expansion
•
54k sf project GLA, 107k sf
property GLA
Budget
$4.0 million
Incurred as of 9/30/13
$1.6 million
Target stabilization
(2)
3Q14
Description
•
Anchor re-tenanting (Ross and
Fresh Market)
•
Future phase includes
re-tenanting former Kmart space
Budget
$6.6 million
Incurred as of 9/30/13
$0.1 million
Target stabilization
(2)
3Q15
Description
•
Anchor re-tenanting with L.A.
Fitness
•
41k sf project GLA, 100k sf
property GLA
(1)
Net estimated project cost.
(2)
Date that construction is expected to be complete and the anchors commence
rent. |
 Florida Redevelopment Opportunities (Continued)
28
Boca Village, Boca Raton, FL
Budget
(1)
$10.9 million
Incurred as of 9/30/13
$7.5 million
Target stabilization
(2)
2Q14
Description
•
Redevelopment of CVS Pharmacy
adding a drive-thru
•
Eliminating interior courtyard
space and enhancing shop
visibility
•
42k sf project GLA, 93k sf property
GLA
(1)
Net estimated project cost.
(2)
Date that construction is expected to be complete and the anchors commence
rent. |
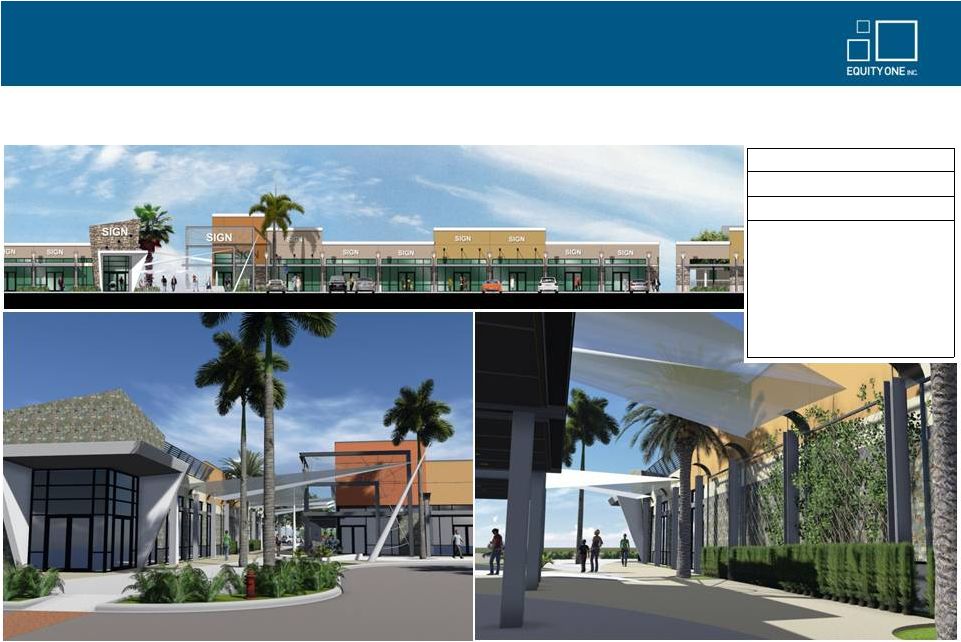
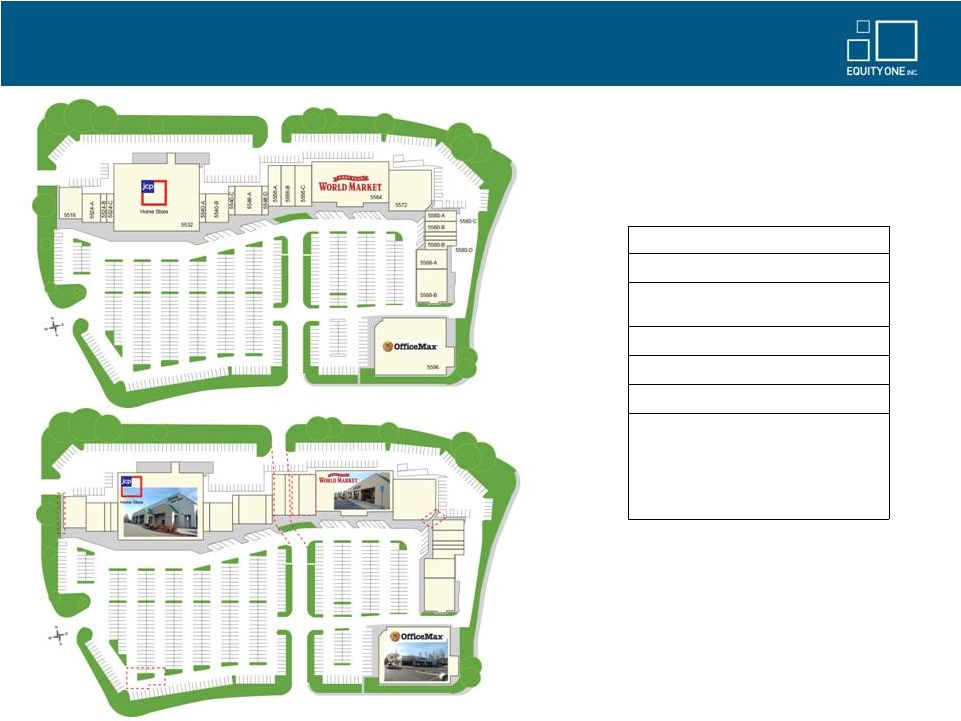 Recent Acquisition: Pleasanton Plaza –
Pleasanton, CA
29
Acquisition Date
October 2013
Price
$30.9 million
Debt
$20.0 million
due 6/15
Total sf
163,000
Leased Rate
96%
3 mile avg income
>$120k
Asset Strategy
•
Anchors significantly below market
•
Expansion and redevelopment opportunities
•
Upgrade facade, parking lot, and add
amenities and restaurants |
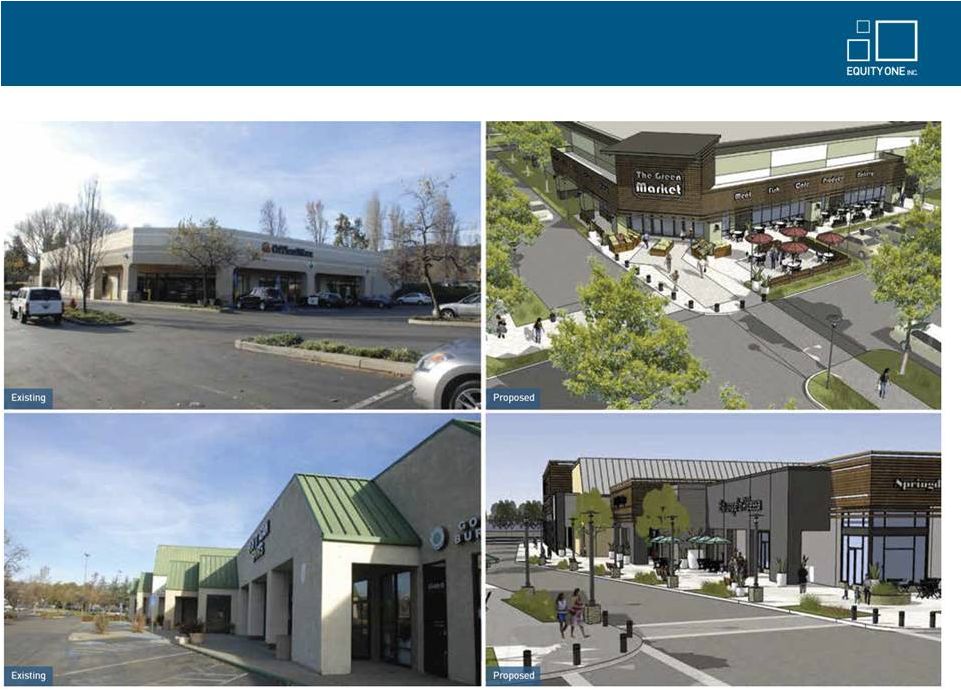 Recent Acquisition: Pleasanton Plaza –
Pleasanton, CA (Continued)
30
Possible Facade Improvement Plan |
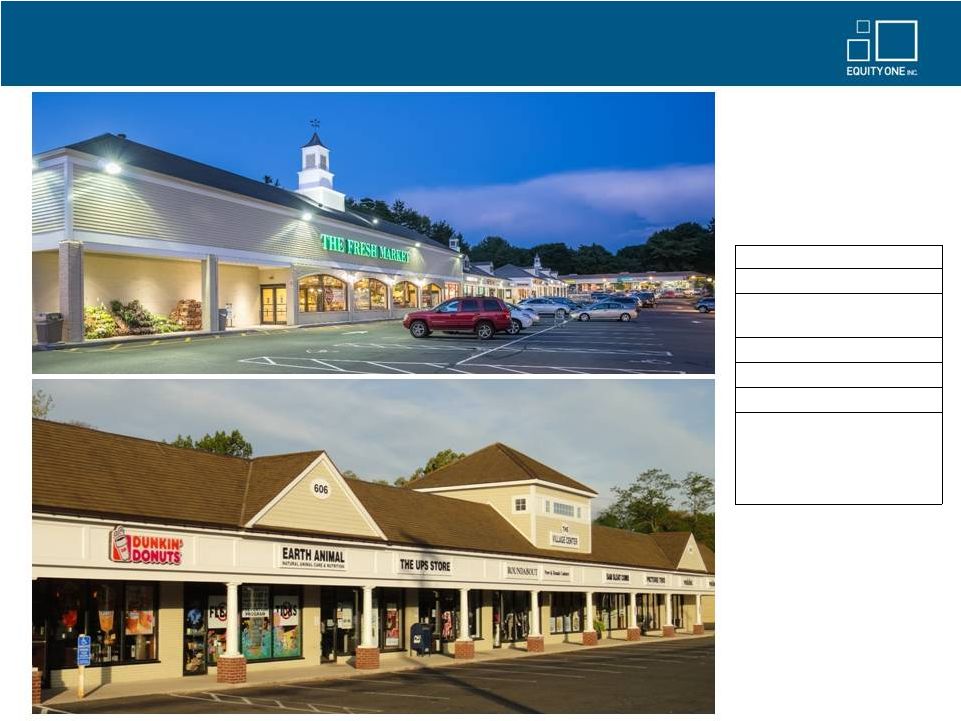 Recent Acquisition: The Village Center –
Westport, CT
31
Acquisition Date
October 2013
Price
$54.3 million
Debt
$15.7 million
due 6/19
Total sf
90,000
Leased Rate
98%
3 mile avg income
>$225k
Asset Strategy
•
Recapture below market leases
•
Redevelop center via significant
improvement to tenant mix and
upgraded retailer quality |
 Recent Acquisition: The Village Center –
Westport, CT (Continued)
32 |
 Appendix
33
•
Summary of Capital Recycling – 2009 to Date |
 Summary of Capital Recycling –
2009 to Date
34
Remaining
Pro Forma
+
-
=
Pro Forma
-
Non-Core
=
Core
12/31/2008
(1)
Acquisitions
(2)
Dispositions
(3)
10/30/2013
(4)
Properties
(5)
Portfolio
Number
of
Properties
(6)
171
37
80
128
33
95
Total
Gross
Leasable
Area
(GLA)
(6)
18,945,330
6,011,813
8,123,476
16,659,715
3,653,249
13,006,466
Average GLA per Property
110,791
162,481
101,543
130,154
110,705
136,910
Property
Value
(000s)
(7)
2,730,789
1,915,168
1,032,190
3,769,160
244,964
3,524,196
Property Value PSF
144
319
127
226
67
271
Average Property Value (000s)
15,970
51,761
12,902
29,447
7,423
37,097
Demographics
(8)
3-Mile Population
81,238
278,350
53,903
203,726
51,021
214,341
3-Mile Average Household Income
76,077
109,710
73,047
95,339
60,840
97,737
Grocer Sales PSF
(9)
473
854
441
558
336
609
Average
Rent
PSF
(9)
11.97
22.43
11.42
16.23
8.40
18.27
Please see footnotes on following page.
$
$
$
$
$
$
$
$
$
$
$
$
$
$
$
$
$
$
$
$
$
$
$
$
$
$
$
$
$
$
$
$
$
$
$
$ |
 Summary of Capital Recycling –
2009 to Date
Footnotes
35
(1)
Includes 21 DIM Vastgoed properties. Equity One owned 48% of the outstanding shares of DIM at
12/31/2008, and increased its voting control to 75% during 1Q 2009. The 12/31/2008
property value ascribed to DIM properties is the value paid as of 10/30/2013 for all DIM
equity, plus assumed mortgage debt at assessed market value as of 3/31/2009.
(2)
Acquisitions include properties acquired subsequent to 12/31/2008 or under contract for purchase as of
10/30/2013, as well as the budgeted cost of ground up development activities. (3)
Dispositions include properties sold subsequent to 12/31/2008 or under contract for sale as of
10/30/2013, and excludes the sales of outparcels. (4)
Includes properties under development or redevelopment based on 9/30/2013 IFRS fair values, except for
Broadway Plaza, which is included at budgeted construction cost. Excludes properties
under contract for sale as of 10/30/2013, which are included within Dispositions. (5)
Remaining Non-Core Properties consist of retail properties which are inconsistent with the
company's long-term strategy and which may be sold in the future. These properties
are generally in smaller, secondary or tertiary markets.
(6)
Number of Properties and associated value exclude Other/Non Retail Properties (except for those
properties acquired and subsequently disposed between 12/31/2008 and 10/30/2013) and Land Held
for Development. Gross Leasable Area (GLA) does not cross foot from 12/31/2008 to
10/30/2013 due to additions and reductions of GLA from redevelopment activities, outparcel
sales, and other activities that affect GLA.
(7)
Property Value is based on IFRS fair value except for (i) Acquisitions and Dispositions, which are
based on purchase price and sale price, respectively, (ii) the value of DIM Vastgoed assets
(see footnote above), and (iii) in-process ground up development, which is based on budgeted
construction cost. 12/31/2008 Property Value is based on IFRS fair value as of 12/31/2008;
10/30/2013 Property Value is based on IFRS fair value as of 9/30/2013. (8)
Demographic information derived from a third-party source. All demographic information, including
with respect to properties sold prior to 2013, is as of May 2013. (9)
All per square foot amounts are based on the gross leasable area (GLA). Grocer Sales PSF exclude
grocers who have vacated but are still paying rent. Average Rent PSF for Pro Forma
12/31/2008 and for Dispositions is as of 12/31/2008, except DIM Vastgoed properties which are
as of 12/31/2009; Average Rent PSF for Acquisitions and Pro Forma 10/30/2013 is as of
9/30/2013.
|
 www.equityone.net |