Attached files
| file | filename |
|---|---|
| 8-K - FORM 8-K - ENDURANCE SPECIALTY HOLDINGS LTD | d626297d8k.htm |
 Endurance
Specialty Holdings Investor Presentation
September 30, 2013
Exhibit 99.1 |
 Forward looking
statements & regulation G disclaimer 2
Safe Harbor for Forward Looking Statements
Some of the statements in this presentation may include forward-looking statements which
reflect our current views with respect to future events and financial performance. Such statements include
forward-looking statements both with respect to us in general and the insurance and
reinsurance sectors specifically, both as to underwriting and investment matters. Statements which include the
words "should," "expect," "intend," "plan,"
"believe," "project," "anticipate," "seek," "will," and similar statements of a future or forward-looking nature identify forward-looking statements in this
presentation for purposes of the U.S. federal securities laws or otherwise. We intend these
forward-looking statements to be covered by the safe harbor provisions for forward-looking statements in
the Private Securities Litigation Reform Act of 1995.
All forward-looking statements address matters that involve risks and uncertainties.
Accordingly, there are or may be important factors that could cause actual results to differ from those indicated in
the forward-looking statements. These factors include, but are not limited to, the
effects of competitors’ pricing policies, greater frequency or severity of claims and loss activity, changes in market
conditions in the agriculture insurance industry, termination of or changes in the terms of
the U.S. multiple peril crop insurance program, a decreased demand for property and casualty insurance or
reinsurance, changes in the availability, cost or quality of reinsurance or retrocessional
coverage, our inability to renew business previously underwritten or acquired, our inability to maintain our
applicable financial strength ratings, our inability to effectively integrate acquired
operations, uncertainties in our reserving process, changes to our tax status, changes in insurance regulations, reduce
acceptance of our existing or new products and services, a loss of business from and credit
risk related to our broker counterparties, assessments for high risk or otherwise uninsured individuals,
possible terrorism or the outbreak of war, a loss of key personnel, political conditions,
changes in insurance regulation, changes in accounting policies, our investment performance, the valuation of our
invested assets, a breach of our investment guidelines, the unavailability of capital in the
future, developments in the world’s financial and capital markets and our access to such markets, government
intervention in the insurance and reinsurance industry, illiquidity in the credit markets,
changes in general economic conditions and other factors described in our most recently filed Annual Report on
Form 10-K .
Forward-looking statements speak only as of the date on which they are made, and we
undertake no obligation publicly to update or revise any forward-looking statement, whether as a result of new
information, future developments or otherwise.
Regulation G Disclaimer
In presenting the Company’s results, management has included and discussed certain
non-GAAP measures. Management believes that these non-GAAP measures, which may be defined differently by
other companies, better explain the Company's results of operations in a manner that allows
for a more complete understanding of the underlying trends in the Company's business. However, these
measures should not be viewed as a substitute for those determined in accordance with
GAAP. For a complete description of non-GAAP measures and reconciliations, please review the Investor
Financial Supplement on our web site at www.endurance.bm.
The combined ratio is the sum of the loss, acquisition expense and general and
administrative expense ratios. Endurance presents the combined ratio as a measure that is commonly recognized as a
standard of performance by investors, analysts, rating agencies and other users of its
financial information. The combined ratio, excluding prior year net loss reserve development, enables investors,
analysts, rating agencies and other users of its financial information to more easily analyze
Endurance’s results of underwriting activities in a manner similar to how management analyzes Endurance’s
underlying business performance. The combined ratio, excluding prior year net loss
reserve development, should not be viewed as a substitute for the combined ratio.
Net premiums written is a non-GAAP internal performance measure used by Endurance in the
management of its operations. Net premiums written represents net premiums written and deposit
premiums, which are premiums on contracts that are deemed as either transferring only
significant timing risk or transferring only significant underwriting risk and thus are required to be accounted
for under GAAP as deposits. Endurance believes these amounts are significant to its
business and underwriting process and excluding them distorts the analysis of its premium trends. In addition to
presenting gross premiums written determined in accordance with GAAP, Endurance believes that
net premiums written enables investors, analysts, rating agencies and other users of its financial
information to more easily analyze Endurance’s results of underwriting activities in a
manner similar to how management analyzes Endurance’s underlying business performance. Net premiums
written should not be viewed as a substitute for gross premiums written determined in
accordance with GAAP. Return on Average Equity (ROAE) is comprised using the
average common equity calculated as the arithmetic average of the beginning and ending common equity balances for stated periods. Return
on Beginning Equity (ROBE) is comprised using the beginning common equity for stated
periods. The Company presents various measures of Return on Equity that are commonly recognized as a
standard of performance by investors, analysts, rating agencies and other users of its
financial information. |
 •
“A”
ratings from AM Best and S&P
•
$3.4 billion of total capital
•
Conservative, short-duration, AA
rated investment portfolio
•
Prudent reserves that have
historically been a source of value
•
Diversified and efficient capital
structure
•
Since inception, returned $2.0 billion
to investors through dividends and
share repurchases
Introduction to Endurance Specialty Holdings
Focused on generating strong profitability through specialty underwriting supported by
efficient operations
3
Transformation Underway
•
CEO John Charman has led a rapid
evolution of Endurance’s strategy
•
Substantially expanded our
global underwriting and
leadership talent
•
Rebalanced our insurance and
reinsurance portfolios to
lower volatility and improve
profitability
•
Streamlined support
operations to generate
significant savings to fund
underwriting additions
Diversified Portfolio of Businesses
•
Portfolio of approximately $2.0
billion in annual net written premium
•
Book of business diversified between
insurance and reinsurance as well as
short tail and long tail lines of
business
•
Proven leader in agriculture
insurance business
•
Focus on specialty lines of business
Strong Balance Sheet and Capital
We have built a strong franchise in our first eleven years of operation
•
Inception to date operating ROE of 11.0%
•
10 year book value per share plus dividends CAGR of 10.8% |
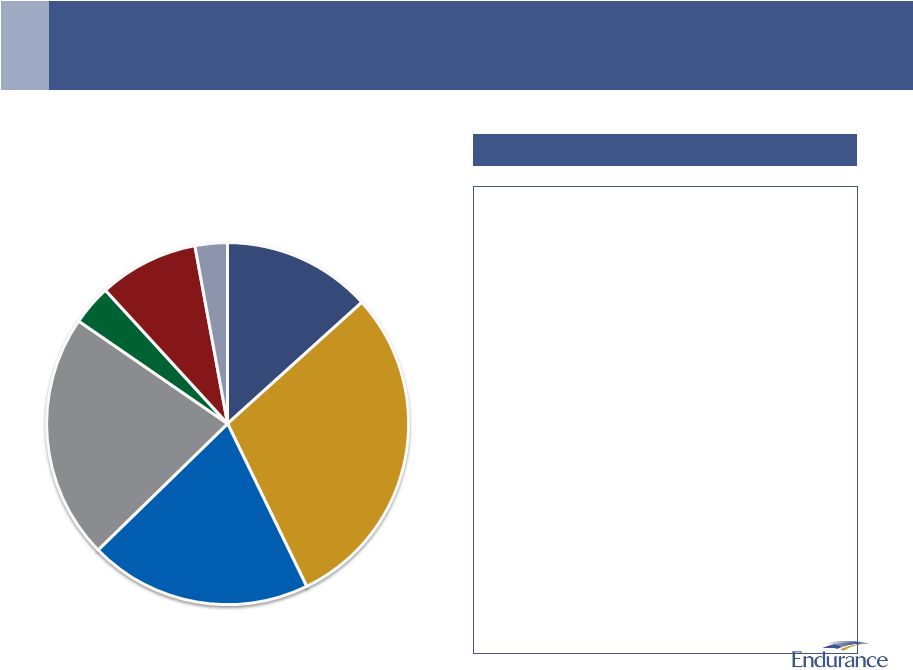
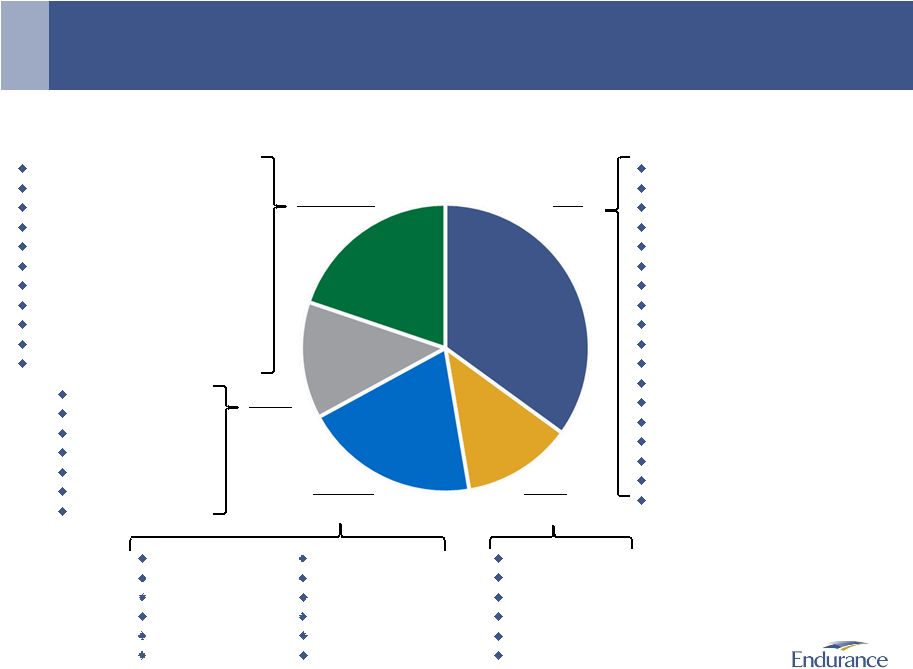
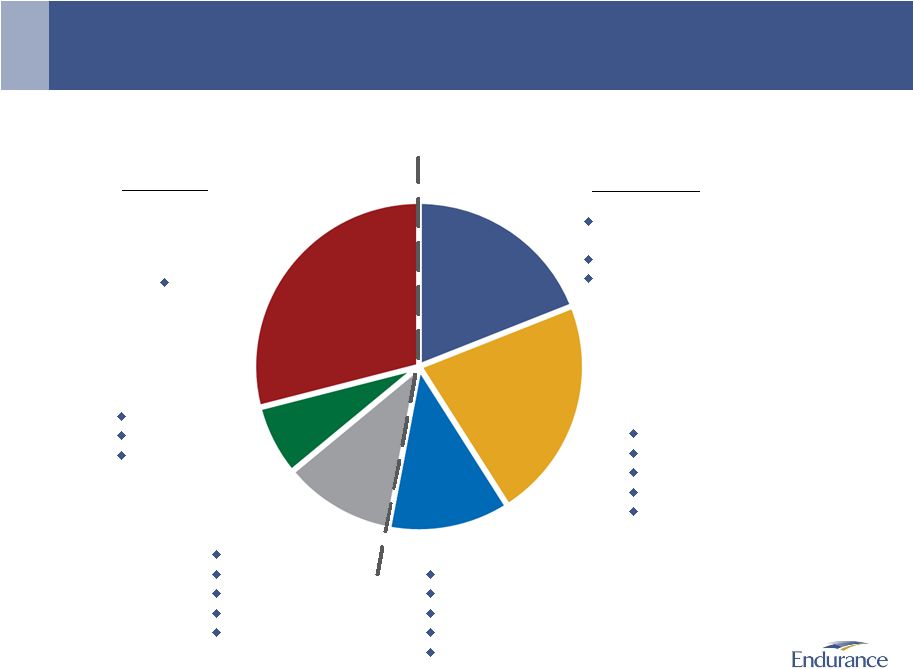 Diversified
Portfolio of Businesses Portfolio diversified by product, distribution source and
geography 4
Trailing Twelve Months Net Premiums Written as of September 30, 2013: $2.0 BN
Reinsurance
Insurance
Casualty
Professional Liability
Property Per Risk
Small Business
Surety
International Property
Catastrophe
US Property Catastrophe
Other Specialty (Aviation,
Clash)
ARMtech
Property
Casualty
Miscellaneous E&O
Healthcare
Ocean/Inland Marine
Healthcare
Excess Casualty
Professional Lines
International
12%
Bermuda
7%
U.S. Specialty
11%
Bermuda
19%
North America
22%
Casualty
Professional Lines
Property
Marine
Trade Credit/Surety
Agriculture
29% |
 Larger book of
business with
lower
volatility and
improved
return
characteristics
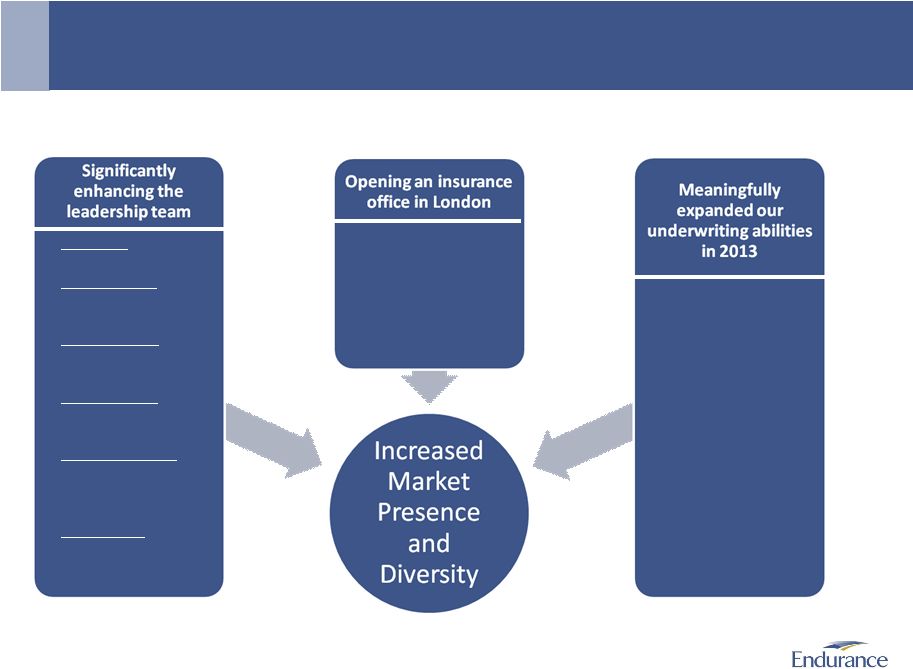
We Are Transforming Our Specialty Insurance and Reinsurance Businesses
Rebalancing our insurance and reinsurance portfolios while expanding our global
underwriting talent to enhance our positioning and relevance in the market
We
will
continue
to
invest
in
our
operations
through
additions
of
acknowledged
market
leaders
as
well
as
expanded
global
underwriting
talent.
Our
goal
is
to
produce
a
more
consistent
level
of
profitability
while
reducing
volatility
in
order
to
deliver
excellent
sustainable
results
for
our
shareholders.
5
Restructuring business
•
Withdrawal from
unprofitable lines and
accounts
•
Management of limits
•
Strategic purchases of
reinsurance/retrocession
al coverage
Improving
underwriting talent
•
Selectively adding
teams of high quality
underwriters
•
Significant progress in
2013
•
Strong pipeline of
underwriting talent
Expanding our
operations in
London and Asia
•
Hired Graham Evans
to lead international
insurance operations
•
Established London
insurance office |
 Specialty
Insurance Strategic Direction Expanding underwriting talent, refocusing our underwriting,
rebalancing our portfolio and improving positioning and relevance in the market
6
Initial products include:
•
Energy
•
Professional Lines
•
Misc. commercial
classes
•
Financial
institutions
•
Inland marine
•
Excess casualty (E&S
and retail)
•
Ocean marine
•
Numerous professional
line underwriters
•
Misc.
commercial
classes
•
Financial
institutions
•
Lawyers
•
Commercial
management liability
•
Surety
•
Healthcare
•
Jack Kuhn
CEO , Global Insurance
•
Graham Evans
EVP & Head of
International Insurance
•
Doug Worman
EVP & Head of U.S.
Insurance
•
Richard Allen*
EVP & Head of
Professional Lines
•
Richard Housley*
EVP & General
Manager of London
Insurance
•
Cliff Easton*
EVP & Global Head of
Energy
* Joining Endurance in 2014 |
 •
Hired Jerome Faure in March 2013 as CEO of Global
Reinsurance
•
Enhanced reinsurance leadership and will continue
to identify and hire global specialty underwriters
•
Completed the consolidation of our European
reinsurance underwriting in Zurich
•
Seeking profitable growth and diversification
through existing and new specialty reinsurance
units
•
Traditional P&C volume to be managed according to
the pricing cycle
Reinsurance Segment Strategic Direction
Enhancing profitability through recruiting top flight underwriting talent, developing strategic
partnerships with key clients and brokers, and honing our underwriting approach
7
Third
Quarter
2012
Additions
Pipeline of Additional Teams in Process
Strategic Priorities for Global Reinsurance
October 2013 –
Hired Chris Donelan,
Head
of
U.S.
Reinsurance
and
team
of
underwriters
August 2013 –
Hired Peter Mills Head of
Specialty Reinsurance
•
Engineering
Risk
Underwriter
•
Trade
Credit
and
Surety
Team
•
Global
Weather
Unit
Reinsurance focusing on growing specialty lines of business while deemphasizing standard
lines with more volatile exposures. Reinsurance premiums to be managed
taking into account the current challenging rate environment. |
 Reduced
senior level positions in corporate management by 30%
•
$20 million of annual cost savings
•
$5 million one-time charge (3Q13)
Consolidated European reinsurance
underwriting into Zurich office
Continuing drive to advance the
efficiency and cost base of our
operating model to improve overall
profitability
Operations Have Been Fundamentally Restructured at Endurance
Immediate and decisive actions have been taken to improve Endurance’s efficiency
Leadership
and
organizational
structure
have
been
streamlined.
Associated
savings
are
being
utilized
to
fund
the
investment in expanding Endurance’s specialty underwriting teams.
8
Streamlined Operations
John Charman, Chairman and CEO
John Del Col
General Counsel
Joan deLemps
Chief Risk Officer
Jerome Faure
CEO of Global Reinsurance
Cathy Kalaydjian
Chief Operations Officer
Jack Kuhn
CEO of Global Insurance
Mike McGuire
Chief Financial Officer
Streamlined Leadership Team |
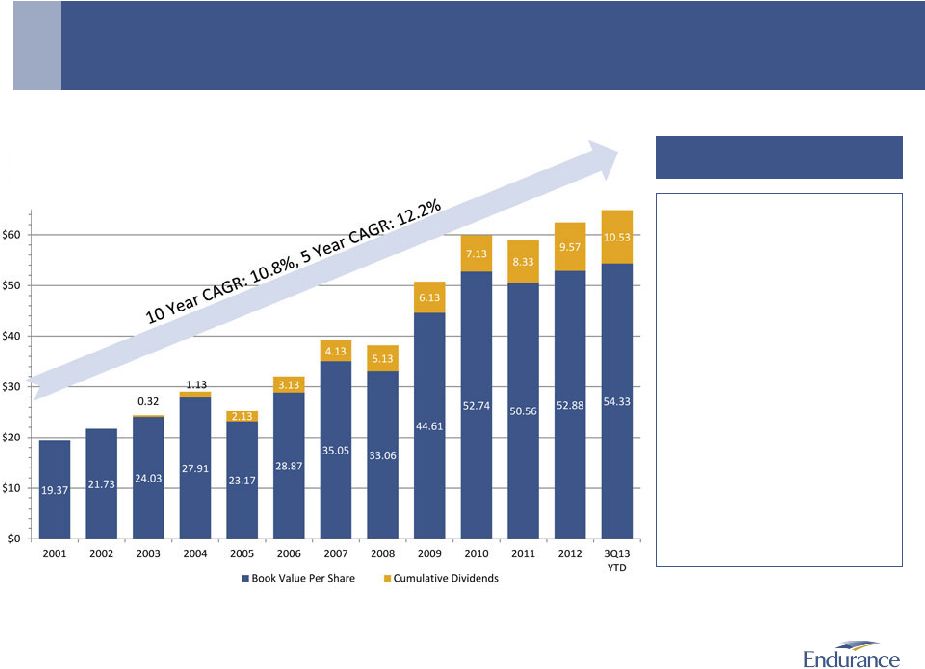 Endurance’s
Financial Results Diluted book value per common share has grown strongly in absolute
terms 9
Growth in Diluted Book Value Per Common Share ($)
From
December
31,
2001
–
September
30,
2013
•
2005 –
Hurricanes Katrina, Rita
and Wilma
•
2008 –
Credit crisis and related
impact of marking assets to
market
•
2011 –
High frequency of
global catastrophes
•
2012 –
Superstorm Sandy and
Midwest drought
Significant Impacts to Book Value |
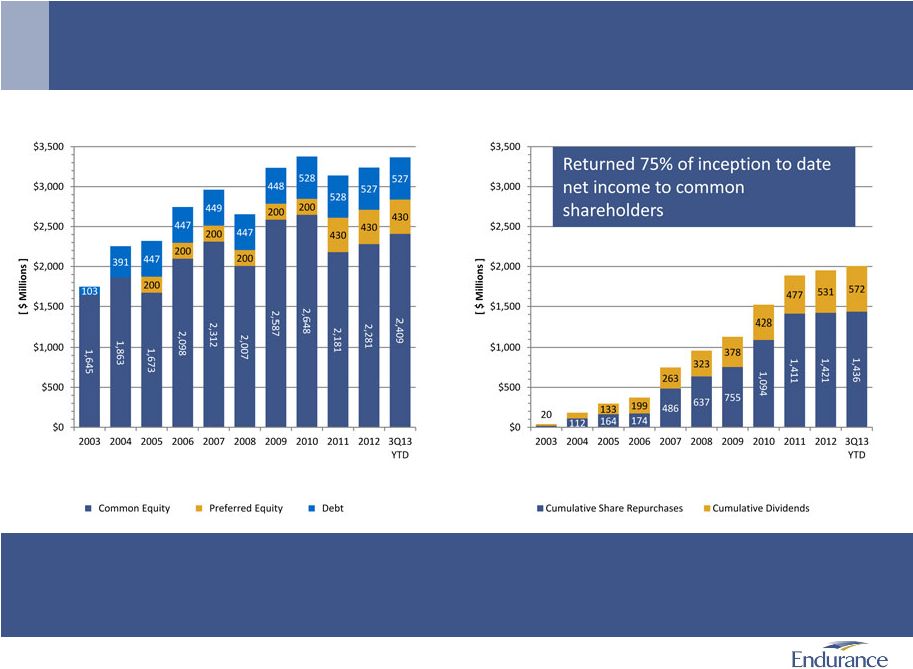 Growing and
Diversified Capital Base Organically generated capital will support current global
growth initiatives
Endurance has proven its ability to generate capital which has allowed for the return to its
shareholders of $2.0 billion through share repurchases and dividends while also
supporting organic growth. More recently, our capital levels have grown over the
last 18 months while we have also shrunk our net catastrophe exposures leading to an
expansion in our rating agency capital buffer which can be used to fund global growth
opportunities. 10
$2.0 Billion of Capital Cumulatively Returned to Shareholders
Endurance has a Diversified and Growing Capital Base |
 •
Fixed maturity portfolio duration is 3.1 years in
order to balance investment yield and interest rate
risk
•
Investment quality (AA average) has remained high
as the portfolio is conservatively managed in a
challenging economy
–
44.0% of investments are cash/short term
or US backed
–
No direct exposure to sovereign debt or
bank debt of European peripheral countries
•
Recently increased allocations to equities and
alternatives to diversify portfolio and reduce
interest rate risk
•
Other investments of $594.2 million consist of
alternative funds (74.3%) and specialty funds
(25.7%)
–
Alternative funds include hedge funds and
private equity funds
–
Specialty funds include high yield loan and
convertible debt funds
Strong Balance Sheet
Endurance maintains a high quality, short duration investment portfolio
11
$6.4 B Investment Portfolio at September 30, 2013
Cash and
Short Term
11.0%
U.S. Government /
and U.S. Government
Backed –
33.0%
Municipals and Foreign
Government
3.2%
Other
Investments
9.3%
Asset Backed and
Non Agency Mortgage
Backed –
21.4%
Corporate
Securities
17.9%
Equities
4.2%
Investment Portfolio Highlights |
 •
Endurance is undergoing a fundamental transformation
–
John Charman joined Endurance in late May 2013 as Chairman and CEO
–
Over the last 12 months, Jack Kuhn and Jerome Faure have joined the company as CEOs of our
insurance and reinsurance operations to build and expand our global specialty
insurance and reinsurance capabilities
–
Expanding our global underwriting talent in key markets and geographies
–
Rebalancing the insurance and reinsurance portfolios to lower volatility and improve
profitability –
In July 2013, completed cost savings initiatives which reduced number of senior corporate
executives by 30% and created annual cost savings of approximately $20 million which
will help fund the necessary build out and expansion of our underwriting
businesses •
Endurance maintains excellent balance sheet strength and liquidity
–
High quality, short duration investment portfolio; fixed maturity investments have an average
credit quality of AA
–
Prudent
reserving
philosophy
and
strong
reserve
position;
strong
history
of
favorable
development
–
Capital levels meaningfully exceed rating agency minimums, providing support for growth
•
The outlook for Endurance’s book of business remains attractive
–
Adding specialty underwriting talent that is being funded by corporate expense
reductions –
Actively
reduced
volatility
through
writing
less
catastrophe
and
property
business
–
Global geographic expansion of our specialty insurance franchise
–
The benefits of the newly added business are beginning to emerge
Conclusion
Endurance is a compelling investment opportunity
12 |
 Appendix
|
 Overview of
ARMtech |
 •
Multi Peril Crop Insurance (MPCI) is an insurance product regulated by the USDA that provides
farmers with yield or revenue protection
–
Offered by 17 licensed companies (18 for crop year 2014)
–
Pricing is set by the government and agent compensation limits are also imposed -
no pricing cycle exists
–
Reduced downside risks due to Federally sponsored reinsurance and loss sharing
–
Agriculture insurance provides strong return potential, diversification in Endurance’s
portfolio of (re)insurance risks and is an efficient user of capital
•
ARMtech is a leading specialty crop insurance business
–
Approximate 7% market share (with estimated 175,000 policies in force) and is 5th largest of
17 industry participants
–
MPCI 2013 crop year* estimated gross written premiums of $914 million
–
Portfolio is well diversified by geography and by crop
•
ARMtech was founded by software developers and has maintained a strong focus on providing
industry leading service through leveraging technology
•
Endurance purchased ARMtech in December 2007 at a purchase price
of approximately $125 million
–
Since the acquisition, ARMtech has generated in excess of $121 million in underwriting profit
for Endurance –
ARMtech has grown MPCI policy count by 44.4% since 2007
Overview of ARMtech
Acquisition of ARMtech has been a great success for Endurance
15
* 2013 crop year is defined as July 1, 2012 through June 30, 2013
|
 •
ARMtech has built a market leading specialty crop
insurance business through its focus on offering
excellent service supported by industry leading
technology.
•
MPCI policy count has grown 44.4% over the past
six years in a line of business not subject to the
property/casualty pricing cycle.
•
ARMtech is a leader in using technology to deliver
high quality service and to satisfy the intense
compliance and documentation standards imposed
on the industry by the U.S. Federal Government.
•
ARMtech has generated strong underwriting profits
since inception.
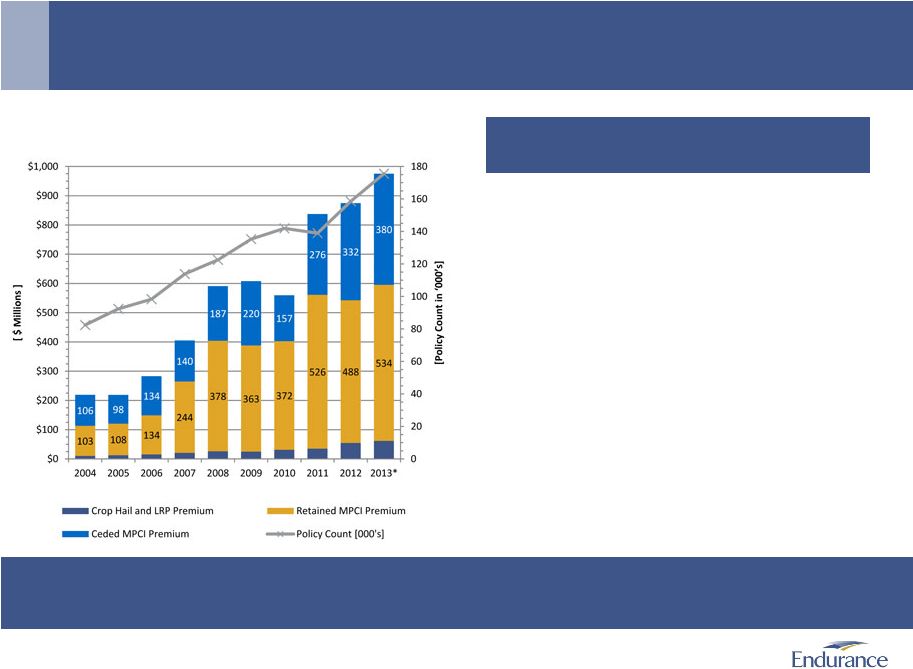
ARMtech is a Leader in the Crop Insurance Space
ARMtech’s focus on technology and service has allowed it to steadily grow its
business 16
Written Premiums and Policy Counts by Crop Year
Using technology and service to expand
premiums
ARMtech has demonstrated its ability to grow market share and premiums over time through its
leading edge technology and superior delivery of service and compliance.
* Estimated 2013 crop year premiums and policy count |
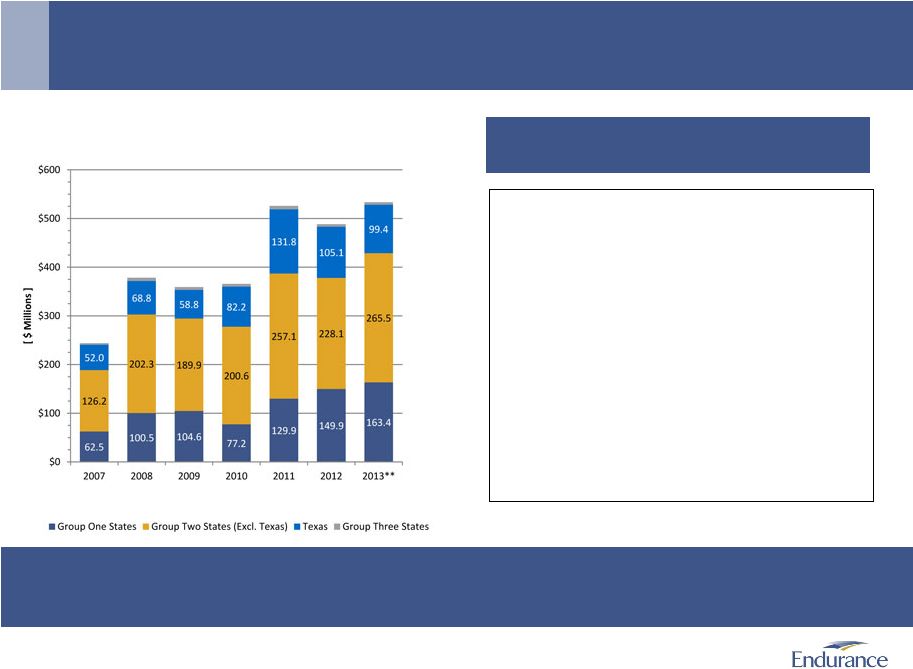 •
2013 estimated crop year MPCI net written premiums of
$533.5million are 9.2% higher than crop year 2012
–
Commodity prices on corn and soybeans were
relatively flat compared to the prior year while
cotton declined in excess of 10%
–
Estimated policy count growth in excess of 11%
–
Greater cessions due to continued dry conditions
in parts of the United States
•
The portfolio of crop risk is more balanced in 2013
through greater crop and geographic diversification and
through greater cessions in Texas (cotton concentration)
•
Purchased third party reinsurance to reimburse for
losses from 100% to 110%
ARMtech is Increasing Market Share and Geographic Diversification
2012 and 2013 were very strong marketing years for ARMtech
ARMtech
continues
to
focus
on
diversifying
its
business
geographically
while
managing
its
exposure
to
Texas
through
active
use
of
available
reinsurance
protections.
17
Estimated 2013 Net Written Crop Year
Premiums
* Group One States –
IL, IN, IA, MN, NE
Group Two States –
States other than Group One and Group Three states
Group Three States –
CT, DE, MA, MD, NV, NH, NJ, NY, PA, UT, WY, WV
** Estimated 2013 crop year premiums
MPCI Net Written Premiums
by Crop Year and State Grouping* |
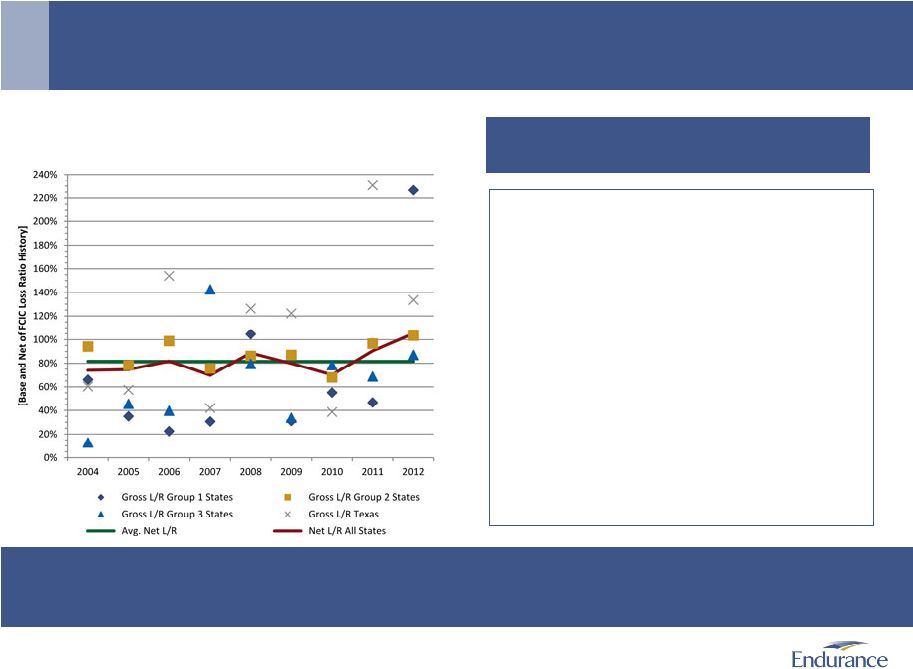 •
While individual states can produce large loss
ratios, the U.S. Federal reinsurance program has
historically reduced loss ratio volatility.
•
ARMtech’s business has historically produced stable
profits over time after reflecting the reinsurance
terms set out in the current standard crop
reinsurance agreement
–
Historic average loss ratio post U.S. Federal
cessions has been 81.6% [adjusted for the
2011 Federal reinsurance terms]
–
The best year was 2007 with a 69.8% net loss
ratio and the worst was 2012 with a 104.0%
net MPCI loss ratio
–
ARMtech’s current expense run rate after the
A&O subsidy is approximately 6% -
8%
Agriculture Insurance is Not Correlated with the P&C Cycle
FCIC reinsurance lowers volatility
18
Stable Results in Volatile Times
Historic MPCI Crop Year Loss Ratio Results
(Pre and Post Federal Retrocessions)
While individual states can produce highly varied gross loss ratios on a year to year basis,
the U.S. Federal reinsurance program has historically mitigated that volatility and
leaves ARMtech with a business which is not correlated to the traditional P&C
pricing cycle and has high risk adjusted return potential. |
 Overview of
ARMtech ARMtech’s recognition of premiums and earnings are influenced by
growing seasons
19
Seasonality of MPCI Business
First Quarter
Third Quarter
Second Quarter
Recognition of
annual written
premiums
60% -
65%
Spring crops
20% -
25%
Spring crop acreage
report adjustments
Winter crops
10% -
15%
Spring crop
adjustments due to
actual cessions
5% -
10%
Winter crop
adjustments
Recognition of
annual earned
premiums
10%-15%
Largely driven by
winter crops
30% -
35%
Largely driven by
spring crops
25% -
30%
Driven by spring
crops and winter
crops
25% -
30%
Largely driven by
spring crops
Harvest
Harvest of winter
crops
Harvest of spring
crops
Fourth Quarter
Commodity
price setting
Setting of base prices
for spring crops
(forward commodity
price for fourth
quarter)
Setting of base prices
for winter crops
(forward commodity
price for second
quarter)
Harvest price
determined for
winter crops
Harvest price
determined for
spring crops |
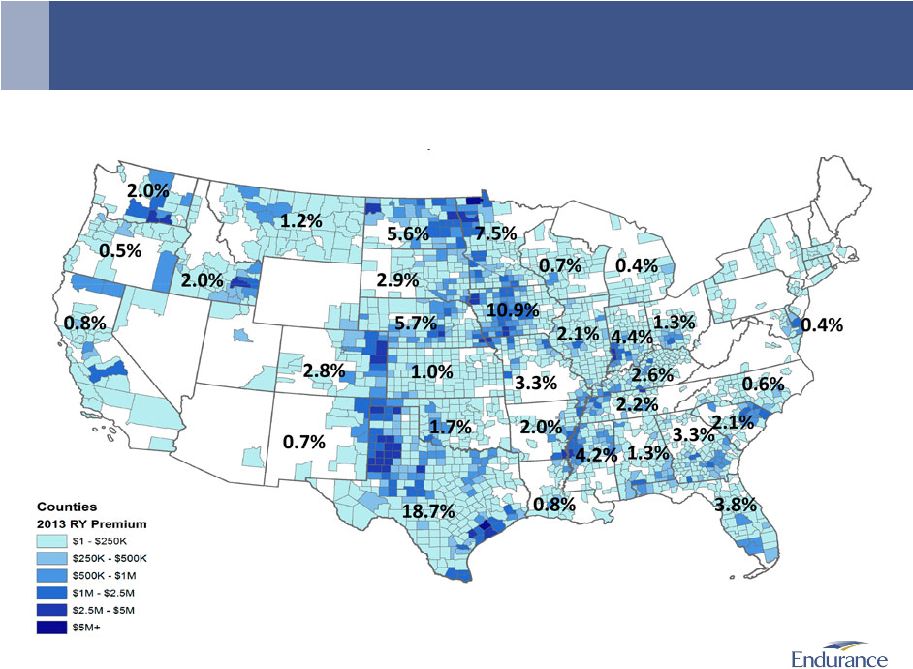 Geographic
Diversification of Crop Insurance Business ARMtech maintains a geographically diversified
portfolio of risk 20
2013 Estimated Crop Year Net Written Premiums |
 Diversification
of Crops Within ARMtech’s Portfolio Underwritten risks diversified by geography and
commodity type 21
ARMtech’s 2013 Estimated Crop Year MPCI Net Written Premiums
Iowa –
7.5%
Nebraska –
4.0%
Minnesota
–
3.6%
Indiana –
2.6%
Texas –
2.4%
North
Dakota
–
1.9%
Missouri –
1.9%
South Dakota –
1.8%
Illinois –
1.4%
Mississippi –
1.2%
Colorado –
1.2%
Kentucky –
0.8%
Ohio –
0.7%
Tennessee
–
0.6%
Arkansas –
0.6%
South Carolina –
0.6%
Wisconsin –
0.4%
All
other
states
–
2.2%
Corn
(35.4%)
Texas
–
8.3%
Georgia –
1.6%
Alabama –
0.6%
South
Carolina
–
0.5%
Mississippi –
0.4%
All other states –
0.8%
Cotton
(12.2%)
Soybeans
(20.2%)
Other Crops
(18.8%)
Wheat
(13.4%)
Texas –
3.7%
North Dakota –
1.4%
Colorado –
1.1%
Oklahoma –
1.1%
Idaho –
1.0%
Minnesota –
0.8%
All other states –
4.3%
Citrus, Nursery & Orange Trees -
3.2%
Grain Sorghum –
2.4%
Apples –
1.2%
Pasture, Rangeland, Forage –
1.1%
Potatoes –
1.1%
Barley –
0.9%
Rice –
0.9%
Peanuts –
0.8%
Tobacco –
0.8%
Dry
Beans
–
0.7%
All
other
crops
–
5.7%
Iowa –
3.3%
Minnesota –
2.5%
Mississippi –
2.2%
Indiana –
1.6%
Nebraska –
1.5%
Missouri –
1.1%
North Dakota –
1.1%
Kentucky –
1.2%
Tennessee
–
0.9%
Arkansas
–
0.9%
Illinois –
0.6%
All other states –
3.3% |
 Agriculture
Insurance Contains Three Layers of Risk Mitigation Farmers retention, ceding premiums to
the U.S. Federal Government and limitations on losses and gains
22
41.6% of MPCI Premiums Ceded to U.S. Federal Government
Assigned Risk Fund
“Higher Risk Policies”
Commercial Fund
“Lower Risk Policies”
Loss Sharing
(% of loss retained by
Loss Ratio
Loss Ratio
Group 1 States
Group 2 & 3 States
ARMtech within each
100 - 160
7.5%
100 - 160
65.0%
42.5%
applicable band when
160 - 220
6.0%
160 - 220
45.0%
20.0%
the loss raio is above 100%.)
220 - 500
3.0%
220 - 500
10.0%
5.0%
Gain Sharing
(% of gain retained by
Loss Ratio
Loss Ratio
Group 1 States
Group 2 & 3 States
ARMtech within each
65 - 100
22.5%
65 - 100
75.0%
97.5%
applicable band when
50 - 65
13.5%
50 - 65
40.0%
40.0%
the loss raio is below 100%.)
0 - 50
3.0%
0 - 50
5.0%
5.0%
2013 Crop Year
Gross Liability
68.8% of risk retained by ARMtech
31.2% of first dollar risk retained by
farmers
14.2% of 2013 Crop Year NWP
85.8% of 2013 Crop Year NWP |
  ARMtech Has Grown
Market Share Over Time Superior service and technology has driven growth in stable
market 23
Crop Year Market Share
% Change in
Market Share
MPCI Certified Companies (Owners)
2012
2011
2010
2009
2008
2007
2007 - 2012
Rural Community Insurance Company (Wells Fargo)
22.1%
21.8%
22.9%
24.7%
25.2%
25.1%
-3.0%
Rain and Hail (ACE)
(1)
21.3%
21.8%
22.6%
24.3%
24.1%
25.0%
-3.7%
NAU Country Insurance Company (QBE)
(1)
13.3%
14.8%
14.4%
13.7%
13.8%
13.3%
0.0%
Great American Insurance Co.
8.5%
8.7%
8.7%
9.1%
10.1%
10.6%
-2.1%
American Agri-Business Ins. Co. (Endurance)
7.4%
6.7%
7.0%
6.5%
5.7%
5.9%
1.6%
Producers Ag. Ins. Co. (CUNA Mutual)
5.5%
6.4%
6.3%
5.3%
5.2%
4.8%
0.7%
Farmers Mutual Hail Ins. of Iowa
4.4%
4.5%
4.2%
3.8%
4.0%
4.0%
0.4%
Guide One Mutual (CGB Diversified Services)
4.0%
2.7%
2.0%
1.2%
1.2%
1.1%
2.9%
John Deere Risk Protection, Inc.
3.3%
3.3%
3.8%
4.0%
3.3%
3.0%
0.2%
Agrinational Insurance Company (ADM)
2.5%
2.1%
1.5%
0.9%
1.0%
1.1%
1.4%
Heartland (Everest Re)
2.3%
2.4%
3.0%
3.4%
3.3%
3.2%
-1.0%
AgriLogic (Occidental Firs & Casualty Co)
1.8%
1.4%
0.1%
0.0%
0.0%
0.0%
1.8%
Hudson Insurance Company
(1)
1.6%
1.2%
1.2%
0.8%
0.6%
0.4%
1.2%
American Agricultural Ins. Co (Amer. Farm Bureau)
1.3%
1.3%
1.3%
1.4%
1.4%
1.2%
0.1%
Country Mutual Insurance Company
0.9%
0.9%
1.0%
1.1%
1.2%
1.4%
-0.5%
Source - National Crop Insurance Services (NCIS)
(1) 2007 Crop Year Market Share was increased to reflect the acquisition of a company between
2007 and 2012. |
 Other
Miscellaneous Information |
 Probable Maximum
Loss by Zone and Peril Largest
1
in
100
year
PML
as
of
July
1,
2013
is
equal
to
12.3%
of
Shareholders’
Equity
as
of
September 30, 2013
25
Values
in
$
Millions
Estimated Occurrence Net Loss as of July 1, 2013
July 1, 2012
July 1, 2011
10 Year
25 Year
50 Year
100 Year
250 Year
100 Year
100 Year
Return
Return
Return
Return
Return
Return
Return
Zone
Peril
Period
Period
Period
Period
Period
Period
Period
United States
Hurricane
$143
$225
$284
$350
$420
$468
$564
Europe
Windstorm
85
171
249
331
441
344
445
California
Earthquake
43
185
237
284
397
412
442
Japan
Windstorm
37
123
188
230
239
247
268
Northwest U.S.
Earthquake
-
5
31
89
194
184
241
Japan
Earthquake
10
55
105
137
195
138
185
United States
Tornado/Hail
38
57
73
89
113
96
98
Australia
Earthquake
1
6
29
87
189
83
95
New Zealand
Earthquake
1
3
9
23
51
22
34
Australia
Windstorm
3
12
30
58
109
37
39
New Madrid
Earthquake
-
-
-
7
70
11
14
The net loss estimates by zone above represent estimated losses related to our property,
catastrophe and other specialty lines of business, based upon our catastrophe models and
assumptions regarding the location, size, magnitude, and frequency of the catastrophe events
utilized to determine the above estimates. The net loss estimates are presented on an
occurrence basis, before income tax and net of reinsurance recoveries and reinstatement
premiums, if applicable. Return period refers to the frequency with which the related size
of a catastrophic event is expected to occur.
Actual realized catastrophic losses could differ materially from
our net loss estimates and our net loss estimates should not be
considered as representative of the actual losses
that we may incur in connection with any particular catastrophic
event.
The net loss estimates above rely significantly on computer models created to simulate the
effect of catastrophes on insured properties based upon data emanating from past
catastrophic events. Since comprehensive data collection regarding insured losses from catastrophe
events is a relatively recent development in the insurance industry, the data upon which
catastrophe models is based is limited, which has the potential to introduce inaccuracies
into estimates of losses from catastrophic events, in particular those that occur
infrequently. In addition, catastrophe models are significantly influenced by management's
assumptions regarding event characteristics, construction of insured property and the cost and
duration of rebuilding after the catastrophe. Lastly, changes in Endurance's
underwriting portfolio risk control mechanisms and other factors, either before or after the
date of the above net loss estimates, may also cause actual results to vary considerably
from the net loss estimates above. For a listing of risks related to Endurance and its
future performance, please see "Risk Factors" in our Annual Report on Form 10-K for the year
ended December 31, 2012. |
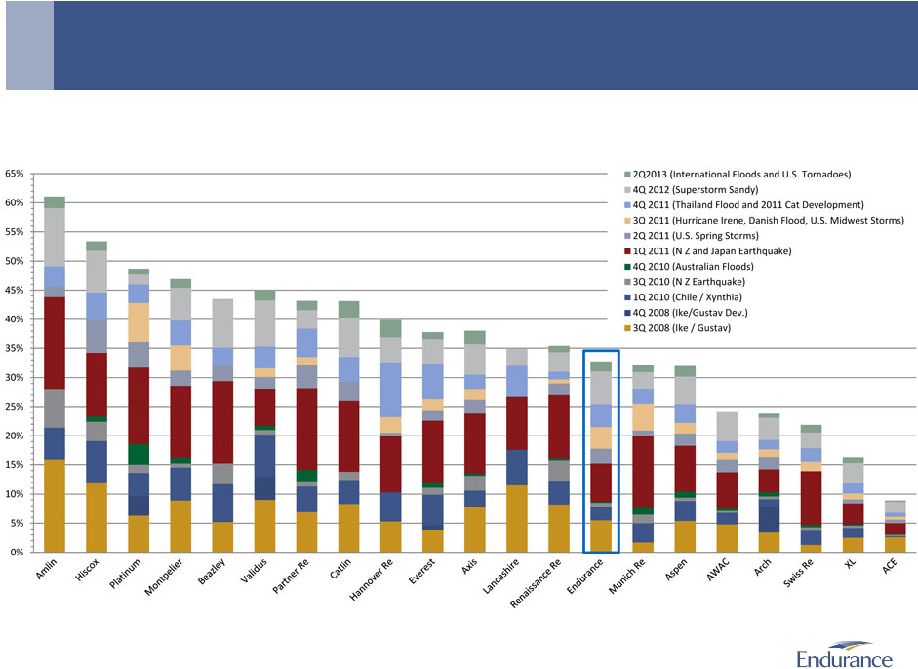 Endurance is
World Class at Risk Management Endurance has performed well versus peers in recent large
catastrophe events 26
Catastrophe Losses versus Shareholder Equity
From December 31, 2006 –
June 30, 2013
Note:
Catastrophe
loss
values
were
obtained
through
publicly
released
information
and
company
transcripts
for
each
quarter
and
include
current
quarter
losses
as
well
as
announced
loss
reserve
development
associated
with
prior
quarter
catastrophe
losses.
Catastrophe
losses
are
compared
with
starting
Total
Shareholder
Equity
for
each
loss
quarter. |
 •
Book value per common share, adjusted for dividends, expanded 5.2% during third quarter
2013 –
Net income attributable to common shareholders of $75.2 million
•
Improved accident loss ratios, excluding catastrophes, in both segments
–
Mark to market adjustments on fixed income portfolio of $38.0 million
•
Net written premiums of $395.3 million were 23.1% lower than third quarter 2012
–
Insurance net written premiums of $224.3 million increased 1.4% from third quarter 2012
•
Agriculture line of business net premiums written increased due to growth in spring crop
policy counts and were partially offset by lower premiums from fall crops that were
impacted by lower commodity prices •
Increase in casualty and other specialty lines of business driven by the addition of new
underwriting teams in ocean and inland marine and within excess casualty
•
Reduction in professional lines as a result of exiting a program
relationship in late 2012
–
Reinsurance net written premiums of $171.0 million declined 41.6% compared to third quarter
2012 •
Property premiums declined in the current quarter compared to a year ago reflecting reduced
participation on a few large contracts where pricing and terms were not adequate
•
Reduction in catastrophe premiums reflecting the purchase of peak zone retrocessional
coverage, which reduced net premiums written
•
Casualty premiums declined as the Company non-renewed business that no longer met
profitability targets and a smaller level of premium adjustments were realized in the
current quarter compared to a year ago Third Quarter 2013 Highlights
Results were driven by strong underwriting margins supported by light catastrophe losses
and favorable development
27 |
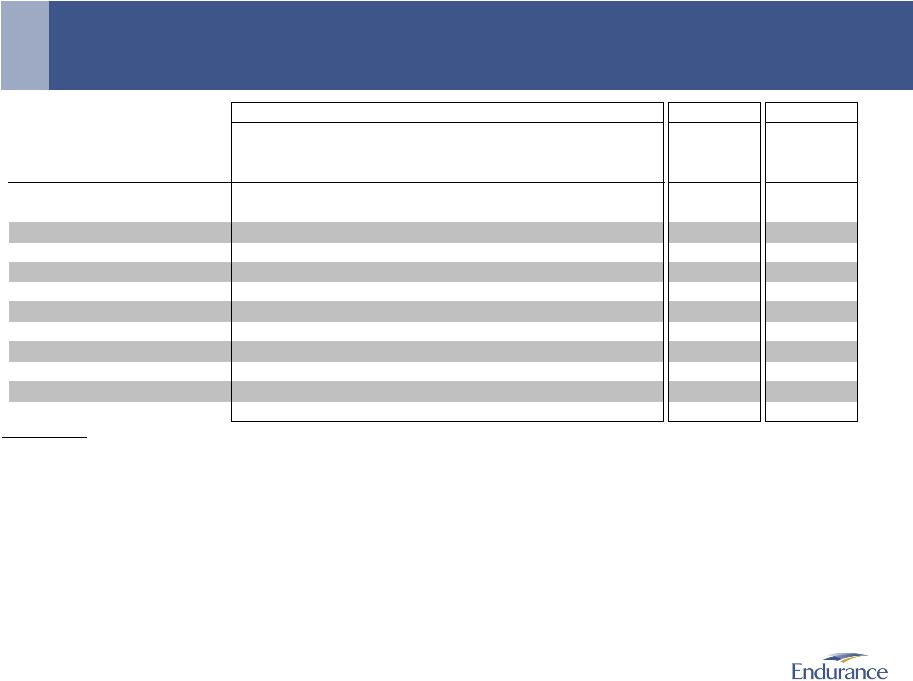
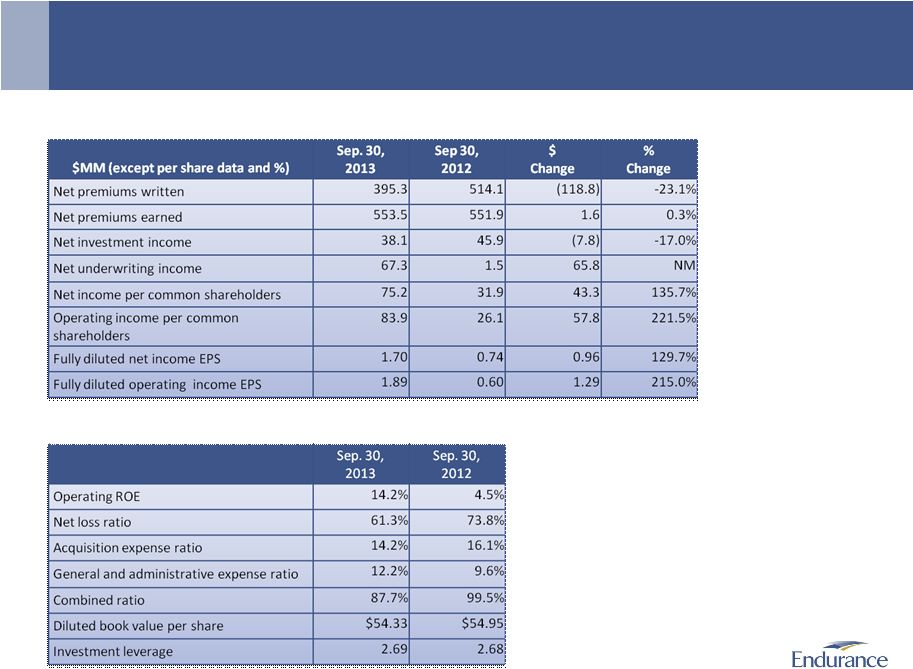 Financial
Results for Third Quarter 2013 28
Financial highlights
Key operating ratios |
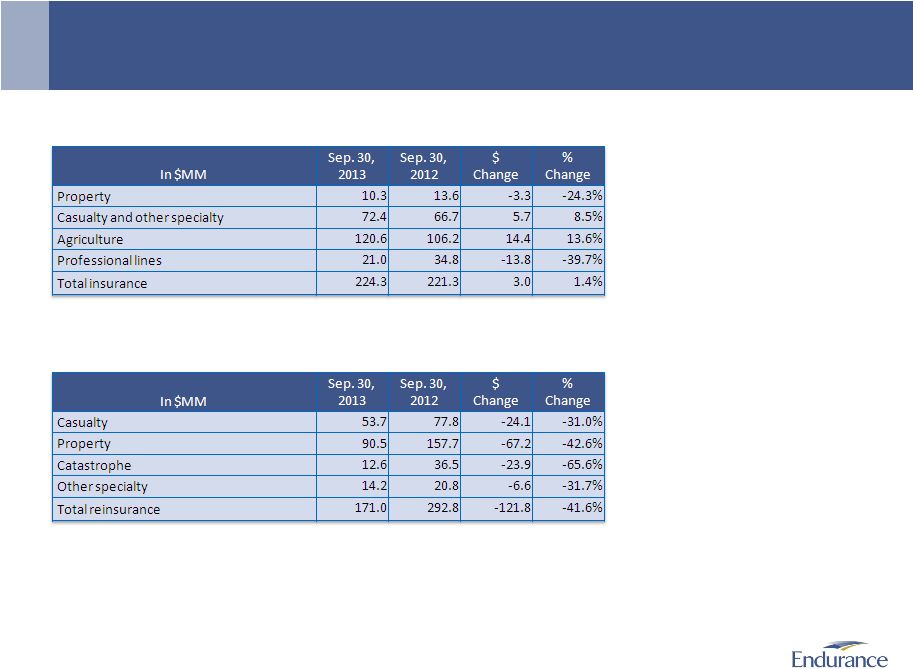 Third Quarter
2013 Net Written Premiums 29
Insurance Segment
Reinsurance Segment |
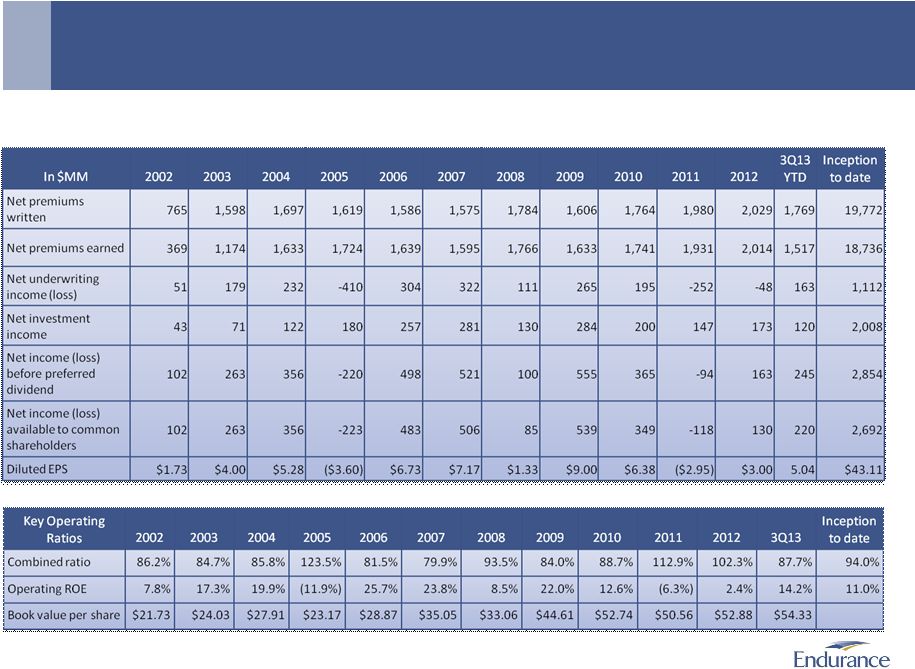 Financial
Overview: Inception to Date Financial Performance 30
Financial highlights from 2002 through September 30, 2013 |