Attached files
| file | filename |
|---|---|
| 8-K/A - 8-K/A - Bristow Group Inc | d626357d8ka.htm |
 Second Quarter FY14
Earnings Presentation
Bristow Group Inc.
November 8, 2013
Exhibit 99.1 |
 2
Second quarter earnings call agenda
Introduction
CEO remarks and operational highlights
Current and future financial performance
Closing remarks
Questions and answers
Linda McNeill, Director Investor Relations
Bill Chiles, President and CEO
Jonathan Baliff, SVP and CFO
Bill Chiles, President and CEO |
 3
Forward-looking statements
This
presentation
may
contain
“forward-looking
statements”
within
the
meaning
of
the
Private
Securities
Litigation
Reform
Act
of
1995.
Forward-looking
statements
include
statements
about
our
future
business,
operations, capital expenditures, fleet composition,
capabilities and results; modeling information, earnings and adjusted earnings
growth guidance, expected operating margins, cash flow stability and other
financial projections; future dividends, share repurchases and other uses of excess cash; plans, strategies
and objectives of our management, including our plans and strategies to grow
earnings and our business, our general strategy going
forward
and
our
business
model;
expected
actions
by
us
and
by
third parties, including our customers, competitors and
regulators; impact of grounding and the effects thereof; the valuation of our
company and its valuation relative to relevant financial indices;
assumptions underlying or relating to any of the foregoing, including assumptions regarding factors impacting our business,
financial
results
and
industry;
and
other
matters.
Our
forward-looking
statements
reflect
our
views
and
assumptions
on
the
date
of
this
presentation
regarding
future
events
and
operating
performance.
They
involve
known
and
unknown
risks,
uncertainties
and
other
factors,
many
of
which
may
be
beyond
our
control,
that
may
cause
actual
results
to
differ
materially
from
any
future
results,
performance or achievements expressed or implied by the forward-looking
statements. These risks, uncertainties and other factors include fluctuations in the demand for our services; fluctuations in worldwide prices of and demand for natural gas and oil;
fluctuations in levels of natural gas and oil exploration and development
activities; the impact of competition; actions by customers; the risk of
reductions in spending on helicopter services by governmental agencies; changes in tax and other laws and regulations;
changes
in
foreign
exchange
rates
and
controls;
risks
associated
with international operations; operating risks inherent in our
business, including the possibility of declining safety performance; general
economic conditions including the capital and credit markets; our ability to
obtain financing; the risk of grounding of segments of our fleet for extended periods of time or indefinitely; our
ability to re-deploy our aircraft to regions with greater demand; our ability
to acquire additional aircraft and dispose of older aircraft through sales
into the aftermarket; the possibility that we do not achieve the anticipated benefit of our fleet investment program;
availability
of
employees;
political
instability,
war
or
acts
of
terrorism in any of the countries where we operate; and those discussed
under
the
captions
“Risk
Factors”
and
“Management’s
Discussion
and
Analysis
of
Financial
Condition
and
Results
of
Operations”
in
our Annual Report on Form 10-K for the fiscal year ended March 31, 2013 and our
Quarterly Report on Form 10-Q for the quarter ended September 30, 2013.
We do not undertake any obligation, other than as required by law, to update or revise any forward-
looking statements, whether as a result of new information, future events or
otherwise. |
 4
Chief Executive Officer comments
Bill Chiles,
President
and
CEO |
 0.09
0.23
0.21
0.19
0.17
0.16
1.26
0.59
0.40
0.59
0.58
0.44
0
0.5
1
1.5
O
N
D
J
F
M
A
M
J
J
A
S
0.54
0.53
0.53
0.96
0
0
1
2
3
FY10
FY11
FY12
FY13
YTD FY14
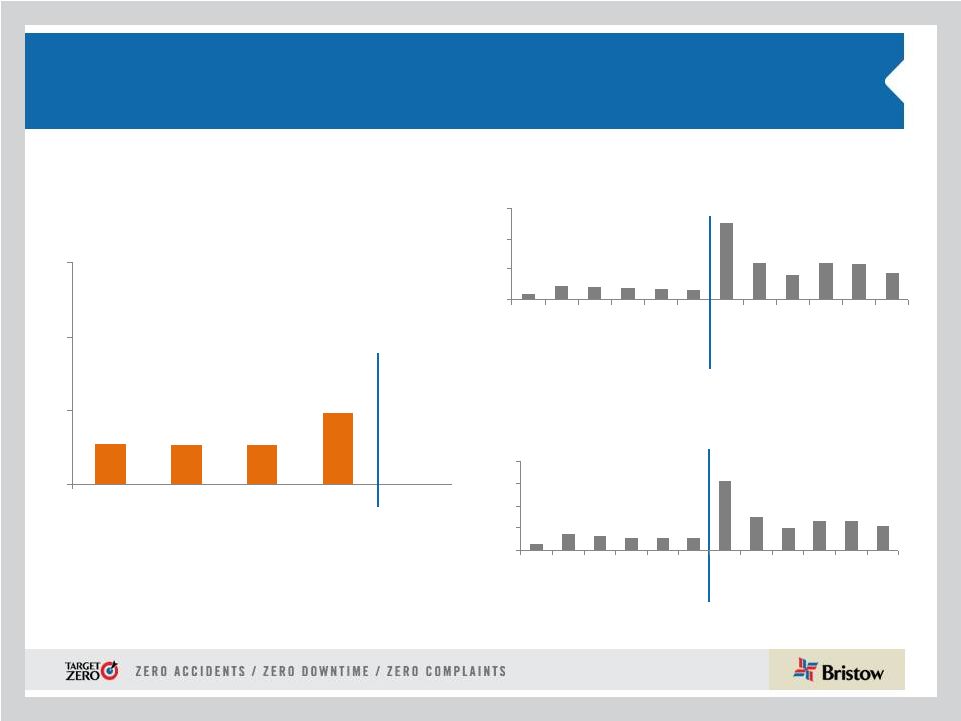
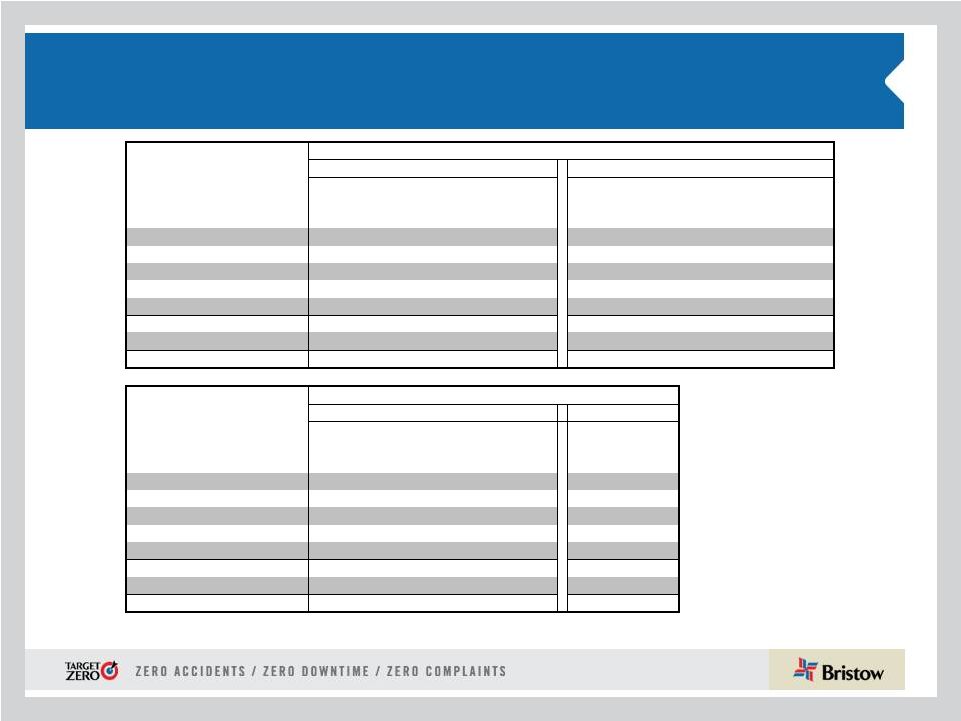
Operational safety review
* Includes consolidated commercial operations only
Total Recordable Injury Rate* per 200,000
man hours (cumulative)
Lost
Work
Case
Rate
*
per
200,000
man hours (cumulative)
Commercial
Air
Accident
Rate
*
per
100,000
flight hours (fiscal year)
FY13
FY14
FY13
FY14
5
0.13
0.35
0.31
0.28
0.28
0.26
1.57
0.74
0.50
0.66
0.64
0.54
0
0.5
1
1.5
2
O
N
D
J
F
M
A
M
J
J
A
S |
 6
Q2 FY14 highlights
* Adjusted
EPS
and
adjusted
EBITDAR
amounts
exclude
gains
and
losses
on
dispositions
of
assets
and
any
special
items
during
the
period.
See
reconciliation
of
these
items
to
GAAP
measures
in
the
appendix
hereto
and
in
our
earnings
release
for
the
quarter
ended September 30, 2013.
** Please see our earnings release for more information regarding earnings
guidance. •
Q2 operating revenue of $378.6M (16.2% increase from Q2 FY13, 5.3% increase from
Q1 FY14) •
Q2
GAAP
EPS
of
$3.01
(267.1%
increase
from
Q2
FY13,
306.8%
increase
from
Q1
FY14)
•
Q2 adjusted EPS* of $1.27 (58.8% increase from Q2 FY13, 27% increase from Q1
FY14) •
Q2
adjusted
EBITDAR*
of
$108.5M
(27.8%
increase
from
Q2
FY13,
5.9%
increase
from Q1 FY14) •
Excellent top-line performance in Q2 FY14 with an increase in adjusted
EBITDAR driven by EBU and WASBU and the FY14 contribution from Cougar
•
GAAP
EPS
of
$3.01
includes
the
after
tax
gain
on
the
sale
of
our
interest in FB
Heliservices of $1.85 per share; adjusted EPS is $1.27
•
Total liquidity was $618 million even after the record first half’s ~$340
million capex spend for growth
•
Adjusted
EPS
guidance
for
the
full
FY14
is
increased
to
$4.25
-
$4.55** |
 7
•
Regulatory approved interim solutions are being implemented, which
include aircraft modifications and new maintenance/operating
procedures. The new redesigned gear shaft is expected to be
available at the earliest in mid-CY14.
•
Five of our EC225s returned to full revenue service in Q2 FY14 and
we estimate that our remaining EC225 aircraft will be available for
return to full revenue service in the second half of FY14
•
Subsequent to the August 2013 AS332 L2 accident in U.K. Bristow
joined Avincis/Bond and CHC in a Joint Operator’s Review of Safety
to identify and share best practices in the offshore helicopter industry,
with a view to significantly enhance safety
•
Bristow intends to readily and actively participate in the U.K.’s
Parliamentary Inquiry on helicopter safety which commenced
November 6, 2013
Super Puma fleet update |
 8
•
Europe contributed 43% of Bristow operating
revenue and 47% of adjusted EBITDAR* in Q2
FY14
•
Operating revenue increased to $156.4M in Q2
FY14 from $125.0M in Q2 FY13 with the addition
of eight new large a/c over the comparable
quarter and new contracts in the Northern North
Sea
•
Adjusted EBITDAR increased to $55.2M in Q2
FY14 from $43.2M in Q2 FY13 and adjusted
EBITDAR margin increased to 35.3% in Q2 FY14
from 34.6% in Q2 FY13 due to top line growth
and start of the GAP SAR operations
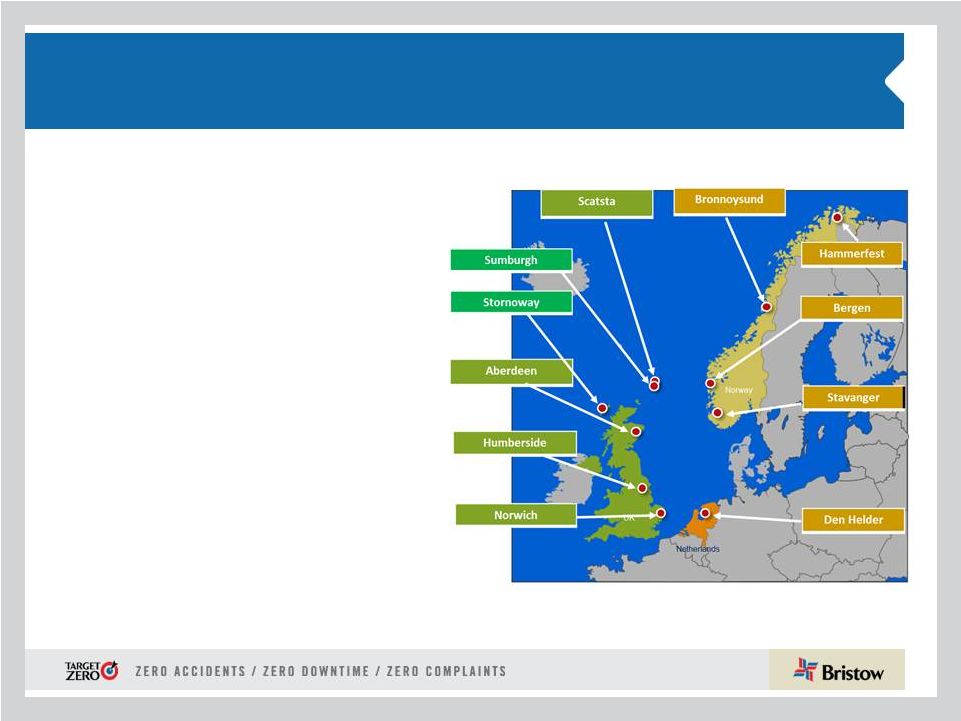
Outlook:
•
Previously announced a/c awards now
entering service
•
Expanding Sumburgh base for future
opportunities in East and West Shetlands
FY14 adjusted EBITDAR margin
Europe (EBU)
* Operating revenue and adjusted EBITDAR percentages exclude corporate and
other expected to be ~ mid thirties |
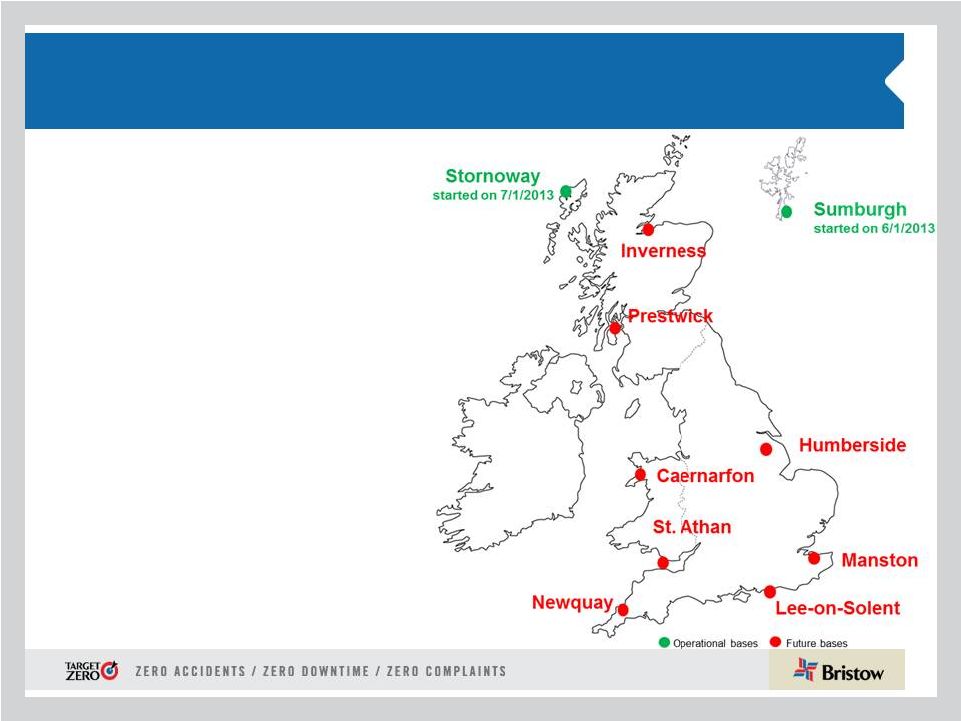 9
SAR update
•
Since the start of the Gap SAR contract,
we have conducted over 120 missions
and rescued and/or assisted over 110
persons
•
Sumburgh and Stornoway bases
generated $11.9M of revenue in Q2
FY14
•
Construction of first two UK SAR bases
has commenced
Outlook:
•
Finalizing lease documents for
aircraft
•
Up to 16 new SAR a/c
opportunities in various countries
including Australia, Brazil, the
Falklands, Libya, Netherlands and
Nigeria |
 10
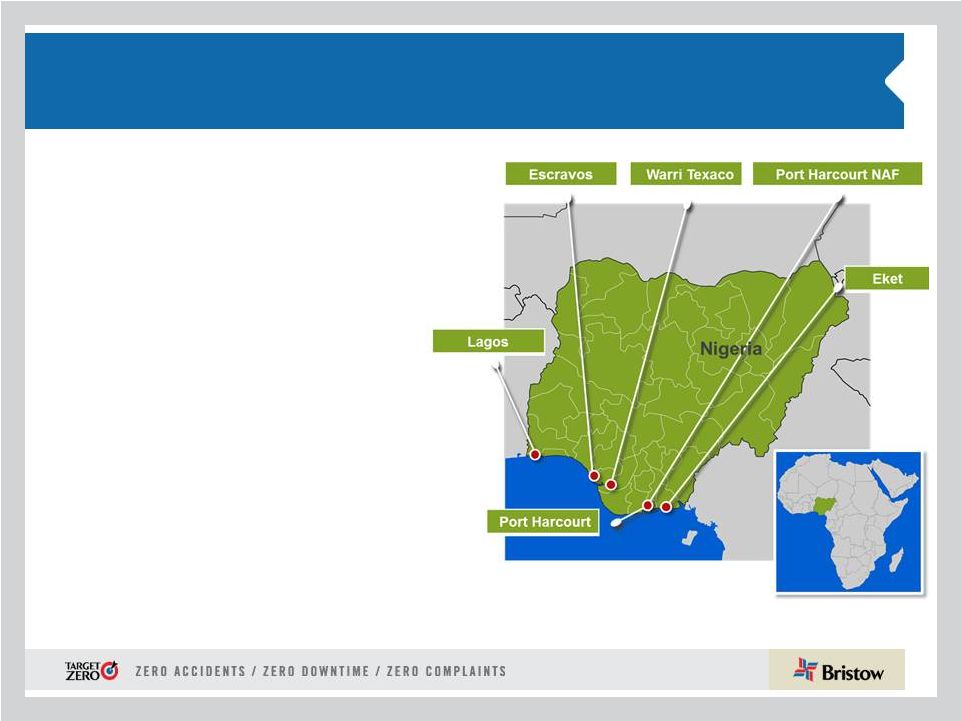
West Africa (WASBU)
•
Nigeria contributed 21% of Bristow operating
revenue and 20% of adjusted EBITDAR* in Q2
FY14
•
Operating revenue increased by 16.2% to $75.9M
in Q2 FY14 from $65.3M in Q2 FY13 due to
increased pricing, ad hoc flying and new contracts
•
Adjusted EBITDAR increased to $23.1M in Q2
FY14 from $17.3M in Q2 FY13 and adjusted
EBITDAR margin increased to 30.4% in Q2 FY14
vs. 26.5% in Q2 FY13 due to increased revenue
that was partially offset by an increase in
maintenance expense
Outlook:
•
Discussions with several IOCs for additional
deepwater support
•
Ongoing renewal tenders for twelve older
technology medium a/c with new technology
a/c
* Operating revenue and adjusted EBITDAR percentages exclude corporate and
other FY14 adjusted EBITDAR margin
expected to be ~ low thirties |
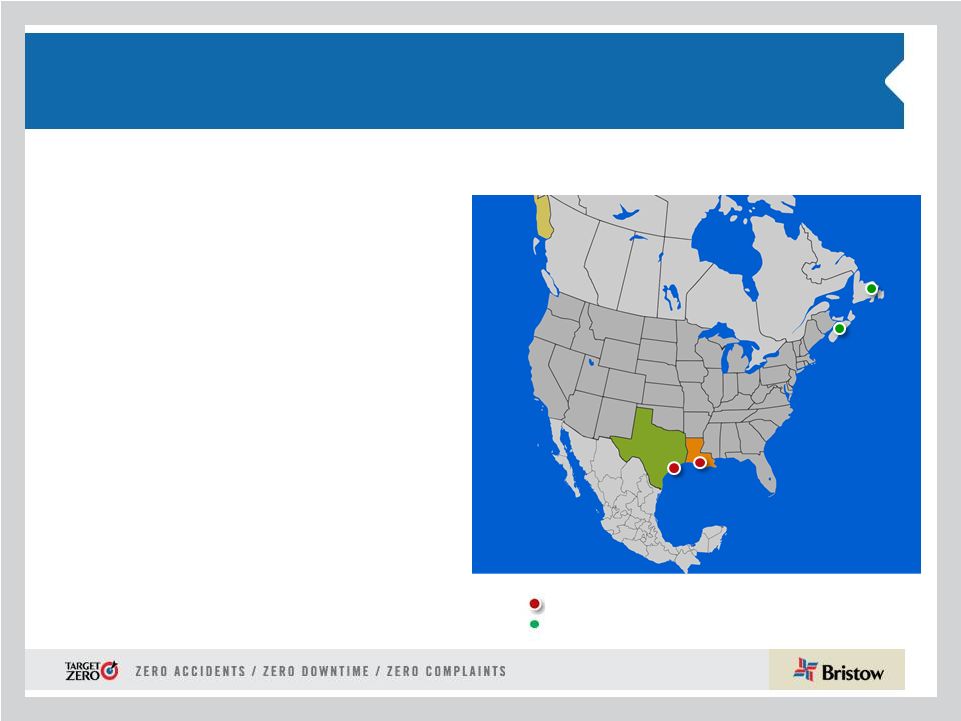 11
•
North America contributed 17% of Bristow operating
revenue and 16% of adjusted EBITDAR* in Q2 FY14
•
Operating revenue increased 5.9% to $60.4M in Q2
FY14 from $57.0M in Q2 FY13 primarily as a result
of the addition of eight aircraft dry leased to Cougar
in Canada offset by a decline in small a/c revenue
elsewhere
•
Adjusted EBITDAR increased to $18.7M in Q2 FY14
vs. $11.8M in Q2 FY13 and adjusted EBITDAR
margin increased to 31.0% vs. 20.7% in Q2 FY13
Outlook:
•
In the process of exiting our non core business in
Alaska
•
We continue to divest small a/c in response to
clients’
increasing demand for larger new
technology a/c
•
Recently signed LOI to sell our entire fleet of Bell
206 L4s as we focus on future deepwater growth
with higher margin large a/c
FY14 adjusted EBITDAR margin
expected to be ~ low thirties
North America (NABU)
* Operating revenue and adjusted EBITDAR percentages exclude corporate and
other Bristow operated bases
Cougar operated bases |
 12
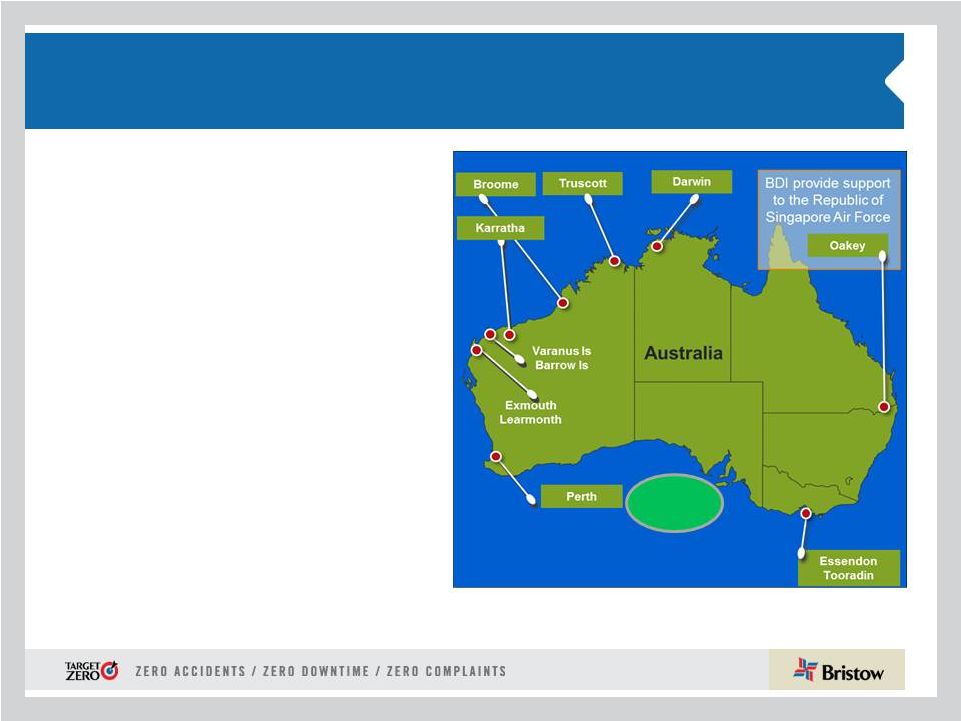
Australia (AUSBU)
•
Australia contributed 10% of Bristow operating
revenue and 6% of adjusted EBITDAR* in Q2
FY14
•
Operating revenue decreased to $35.3M in Q2
FY14 from $38.4M in Q2 FY13 due to the ending
of short term contracts and the negative impact of
foreign currency exchange rate changes
•
Adjusted EBITDAR decreased to $7.4M in Q2
FY14 from $10.8M in Q2 FY13 and adjusted
EBITDAR margin decreased to 21.0% in Q2 FY14
from 28.0% in Q2 FY13 due to costs incurred in
anticipation of contracts that are due to start in Q4
FY14, including INPEX
Outlook:
•
Two S-92s to arrive this month for new work
starting in Q4 FY14
•
Two new oil and gas SAR opportunities
•
Exploration opportunities materializing in the
Great Australian Bight
FY14 adjusted EBITDAR margin
* Operating revenue and adjusted EBITDAR percentages exclude corporate and
other Great
Australian
Bight
expected to be ~ low twenties
Great
Australian
Bight |
 13
Other International (OIBU)
Other International (OIBU)
•
Other International contributed 9% of Bristow operating
revenue and 11% of adjusted EBITDAR* in Q2 FY14
•
Operating revenue slightly increased to $32.2M in Q2
FY14 vs. $32.1M in Q2 FY13 due to increased activity
in Trinidad and Brazil offset by a decline in aircraft on
contract in Malaysia and the end of a short term
contract in Guyana
•
Adjusted EBITDAR decreased to $12.6M in Q2 FY14
from $14.2M in Q2 FY13 and adjusted EBITDAR margin
decreased to 39.3% in Q2 FY14 from 44.2% in Q2
FY13 due to decline in a/c on contract in Malaysia and
increase in maintenance expense in Russia offset by
increased activity in Brazil and Trinidad.
* Operating revenue and adjusted EBITDAR percentages exclude corporate and
other Consolidated in OIBU
Unconsolidated Affiliate
Outlook
:
•
Additional potential contracts in East and North Africa, Russia,Trinidad
and the Falklands
•
•
Líder’s EBITDAR remains very strong
FY14 adjusted EBITDAR margin
expected to be ~ low to mid forties
Petrobras
is
expected
to
issue
a
bid
for
SAR
a/c
in
CY15
–
CY
16 |
 14
Financial discussion
Jonathan
Baliff,
SVP and CFO |
 15
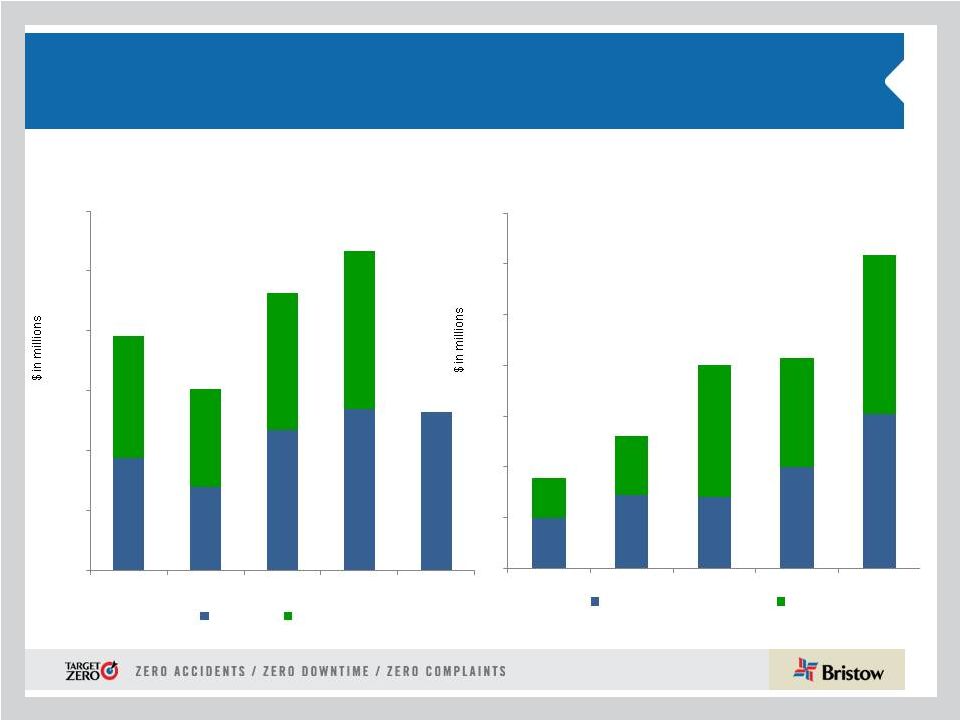
$84.9
$108.5
$23.6
$3.3
$3.3
Q2 FY13
Operations
Corporate and Other
FX Changes
Q2 FY14
$0.80
$1.27
$0.61
$0.06
$0.08
Q2 FY13
Operations
Corporate and Other
FX Changes
Q2 FY14
Financial highlights Q2:
Adjusted EPS and EBITDAR summary
Q2 FY13 to Q2 FY14 adjusted EPS bridge
Q2 FY13 to Q2 FY14 adjusted EBITDAR bridge (in millions)
* Adjusted EPS and EBITDAR amounts exclude gains and losses on dispositions of
assets and any special items. See reconciliation of these items to GAAP in the appendix hereto and in our earnings release for the quarter ended
September 30, 2013. |
 16
$168.7
$211.8
$38.0
$6.4
$1.3
YTD FY13
Operations
Corporate and Other
FX Changes
YTD FY14
$1.60
$2.28
$0.62
$0.09
$0.03
YTD FY13
Operations
Corporate and Other
FX Changes
YTD FY14
Financial highlights YTD:
Adjusted EPS and EBITDAR summary
YTD FY13 to YTD FY14 adjusted EPS bridge
YTD FY13 to YTD FY14 adjusted EBITDAR bridge (in millions)
* Adjusted EPS and EBITDAR amounts exclude gains and losses on dispositions of
assets and any special items. See reconciliation of these items to GAAP in the appendix hereto and in our earnings release for the quarter ended
September 30, 2013. |
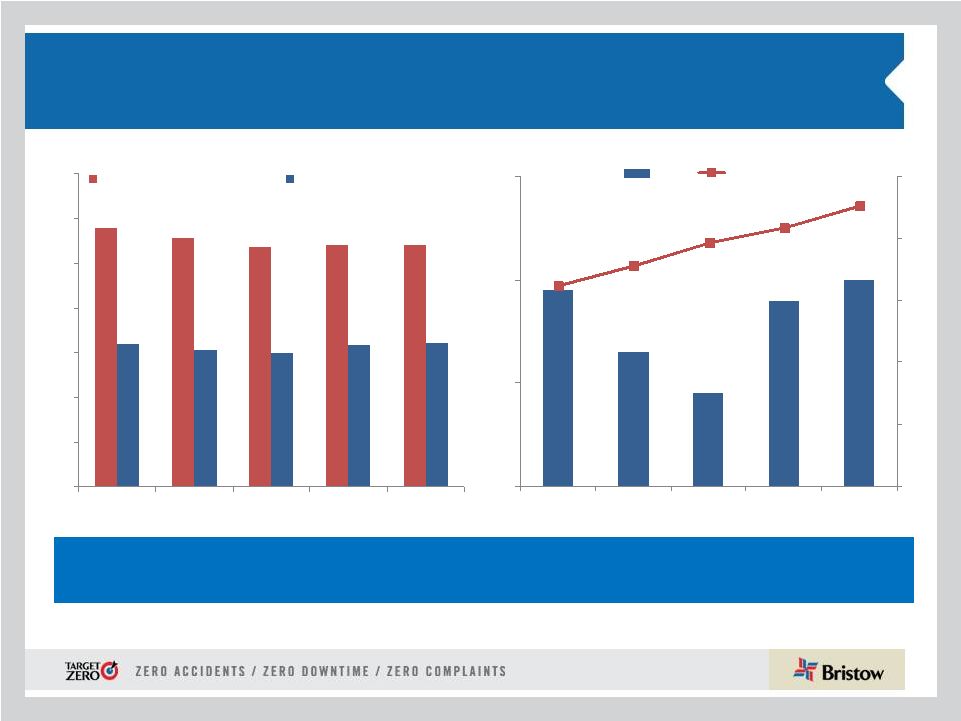 17
LACE and LACE rate continue to increase led by
new technology a/c and improved utilization/terms
($ in millions)
* See appendix hereto for more information on LACE and LACE Rate. LACE
and LACE Rate excludes Bristow Academy, affiliate a/c, aircraft held for sale, a/c
construction in progress, and reimbursable revenue.
290
279
268
271
271
159
153
149
158
160
0
50
100
150
200
250
300
350
FY10
FY11
FY12
FY13
YTD FY14
159
153
149
158
160
6.494
7.15
7.89
8.35
9.07
0
2
4
6
8
10
140
150
160
170
FY10
FY11
FY12
FY13
YTD FY14
LACE*
LACE Rate*
Shift in fleet management strategy to larger aircraft has led to a slight decrease in FY14 LACE
guidance to 160 - 164 and to an increase in LACE rate guidance of $8.95 - $9.25 Consolidated
commercial
aircraft
Large Aircraft Equivalent (LACE)* |
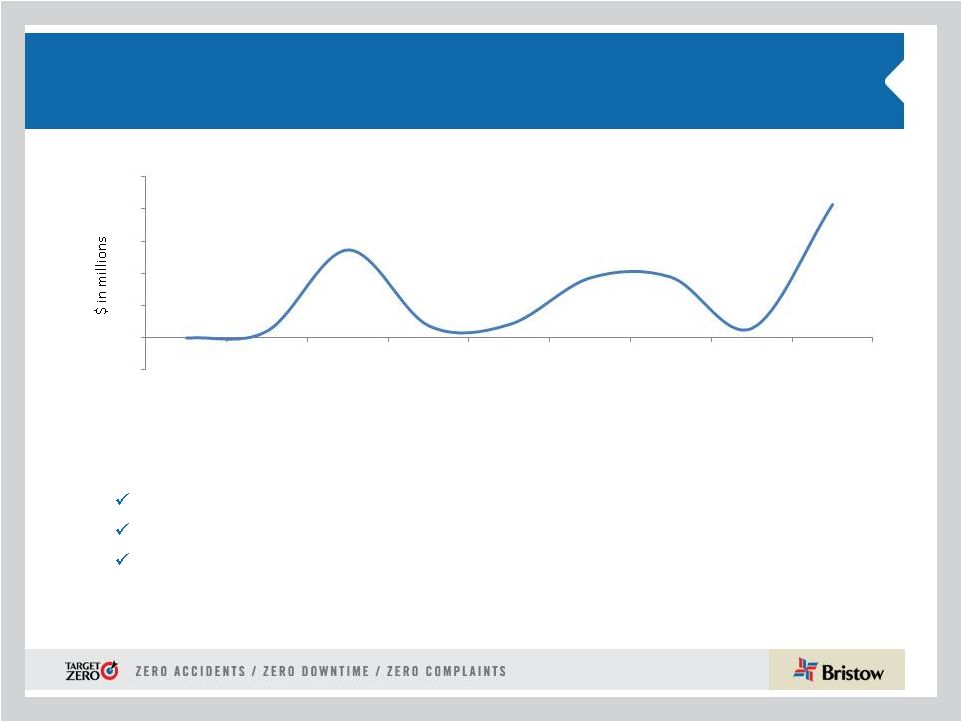 18
Combination of revenue growth and capital efficiency
drives quarterly BVA improvement
•
Bristow Value Added (BVA) is calculated by taking gross cash flow less the product
of gross operating assets times a capital charge of 10.5%. Example calculation for
Q2 FY14 and Q2 FY13 can be found in the appendix hereto.
Absolute
BVA*
Q2
FY12
–
Q2
FY14
•
Q2 FY14 BVA is positive $20.6M, record improvement of $18.5M over Q2 FY13
•
YTD FY14 consolidated BVA is positive $22.1M, a $18.1M increase from YTD
FY13 •
Year-over-year change in BVA is driven by:
Excellent top line growth which offset record organic capex
Margin improvement and capital efficiency efforts including our successful lease
strategy Lider contributed $11.0M to the YTD BVA of the total business
•
WASBU, EBU and OIBU are the key performers year-over-year
0.0
1.1
13.6
1.9
2.1
9.3
9.4
1.5
20.6
-5
0
5
10
15
20
25
Q2 FY12
Q3 FY12
Q4 FY12
Q1 FY13
Q2 FY13
Q3 FY13
Q4 FY13
Q1 FY14
Q2 FY14 |
 Our
progress on BVA yields stronger liquidity for growth . . .
Net cash provided by operating activities*
* See 10-Q for more information on cash flow provided by operating
activities Total liquidity
94
69
117
135
132
0
50
100
150
200
250
300
FY10
FY11
FY12
FY13
YTD FY14
YTD period
Full year
195
151
267
231
100
144
140
199
305
78
116
262
216
314
-
100
200
300
400
500
600
700
FY10
FY11
FY12
FY13
YTD FY14
Undrawn borrowing capacity
Cash
178
261
402
415
618
19 |
 20
…
with FY14 guidance increased
•
FY14
adjusted
EPS
guidance
increased
to
$4.25
-
$4.55,
excluding
special items and a/c sales. Other specific items include:
* Assuming FY14 revenue earned in same regions and same mix as in FY13
Long
term
adjusted
EPS
growth
of
10
-
15%
combined
with
a
20
-
30%
dividend payout policy reflects management’s commitment to deliver a
more stable, growing and predictable total return for shareholders
LACE (Large AirCraft Equivalent)
~160 - 164
Interest expense
~ $30 - $35M
LACE Rate
~ $8.95 - $9.25M
Rent expense (a/c only)
~$85 - $90M
G & A expense (all inclusive)
~ $160 - $170M
Tax rate*
~ 21 - 24%
Depreciation expense
~ $95 - $100M
Adj. EPS guidance
$4.25 - $4.55 |
 21
Conclusions
•
Safety continues to be our #1 core value as we strive to achieve
Target
Zero
•
Bristow
is
positioned
in
the
major
markets
that
have
high
growth
for
helicopter services required for offshore drilling, production and SAR
•
Clients are turning to Bristow as their provider of choice due to our size,
global reach, financial strength and operational safety performance
•
Confidence in continued revenue growth and excellent cash flow from core
business
allows
us
to
increase
our
adjusted
EPS
guidance
in
FY14
to
$4.25
-
$4.55
•
Investor Day on November 21, 2013 in New York, where we will focus on
Líder, our affiliate in Brazil, and prospects for this market
|
 22
Appendix |
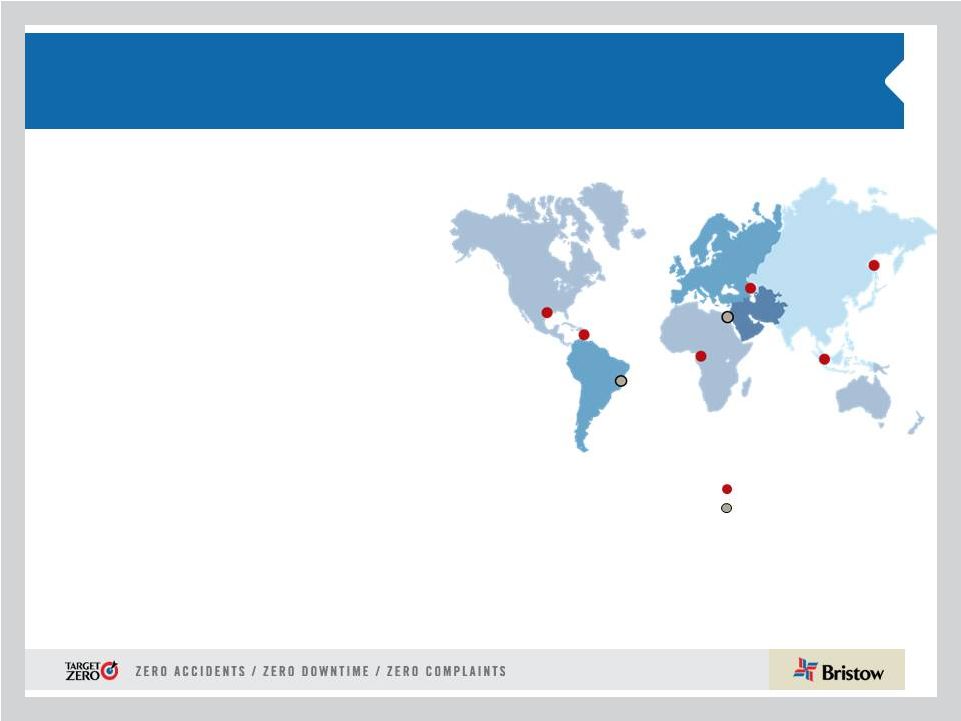
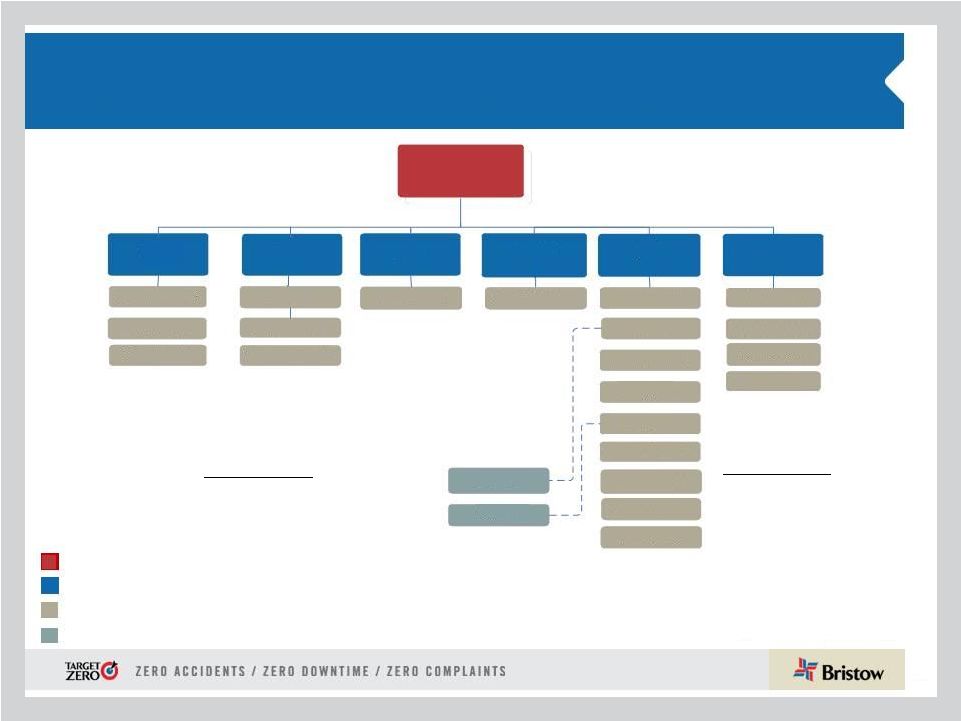 23
Organizational chart -
as of September 30, 2013
Business Unit
(% of FY14 operating revenue)
Corporate
Region
( # of a/c / # of Locations)
Joint Venture
(# of a/c)
Key
Operated Aircraft
Bristow owned and/or operated 350
aircraft as of September 30, 2013
Affiliated Aircraft
Bristow affiliates and joint
ventures operated 127 aircraft
as of September 30, 2013
* Includes corporate and other
Bristow
NABU
16
%
Trinidad –
10/1
Alaska
–
12/3
Mexico –
6/6
Brazil –
11/9
Lider -
85
Norway –
17/4
Nigeria –
44/6
Australia –
24/10
Other –
6/3
Russia –
7/3
Egypt
–
–/–
Turkmenistan
–
2/1
PAS -
42
AUSBU
10
%
EBU
40
%
Florida
–
57/1
Louisiana
–
13/1
U.K. –
3/1
WASBU
21
%
OIBU
9%
BRS Academy
4
%*
Canada
–
8/2
Netherlands –
2/1
Malaysia
-
3/2
Nevada
–
3/1
Tanzania –
21
U.S.
GoM
–
73/6
UK –
45/5 |
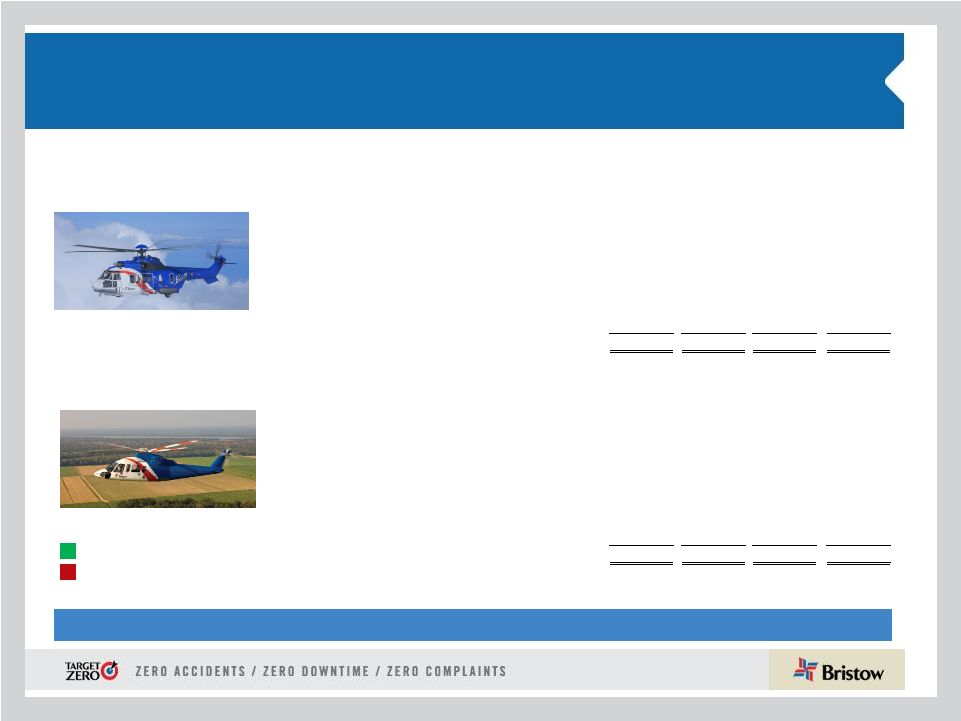  24
Aircraft Fleet –
Medium and Large
as of September 30, 2013
Next Generation Aircraft
Medium capacity 12-16 passengers
Large capacity 16-25 passengers
Mature Aircraft
Aircraft
Type
No. of PAX
Engine
Consl
Unconsl
Total
Ordered
Large Helicopters
AS332 L Super Puma
18
Twin Turbine
20
-
20
-
AW189
16
Twin Turbine
-
-
-
17
EC175
16
Twin Turbine
-
-
-
5
EC225
25
Twin Turbine
20
-
20
3
Mil MI 8
20
Twin Turbine
7
-
7
-
Sikorsky S-61
18
Twin Turbine
2
-
2
-
Sikorsky S-92
19
Twin Turbine
50
7
57
17
99
7
106
42
LACE
99
Medium Helicopters
AW139
12
Twin Turbine
14
2
16
5
Bell 212
12
Twin Turbine
-
14
14
-
Bell 412
13
Twin Turbine
29
17
46
-
EC155
13
Twin Turbine
1
-
1
-
Sikorsky S-76A/A++
12
Twin Turbine
4
5
9
-
Sikorsky S-76C/C++
12
Twin Turbine
51
34
85
-
Sikorsky S-76D
12
Twin Turbine
-
-
-
10
99
72
171
15
LACE
47
Fair market value of our owned fleet is ~$2.0 billion and leased fleet is ~$750 million |
 25
Aircraft Fleet –
Small, Training and Fixed
as of September 30, 2013 (continued)
Mature Aircraft
Small capacity 4-7 passengers
Training capacity 2-6 passengers
* LACE does not include held for sale, training helicopters and fixed wing
Next Generation Aircraft
Aircraft
Type
No. of PAX
Engine
Consl
Unconsl
Total
Ordered
Small Helicopters
AS350BB
4
Turbine
-
2
2
-
Bell 206B
4
Turbine
1
2
3
-
Bell 206 L Series
6
Turbine
28
6
34
-
Bell 407
6
Turbine
36
-
36
-
BK 117
7
Twin Turbine
2
-
2
-
BO-105
4
Twin Turbine
2
-
2
-
EC135
7
Twin Turbine
4
3
7
-
73
13
86
-
LACE
14
Training Helicopters
AS 355
5
Twin turbine
3
-
3
-
Bell 206B
4
Single Engine
12
-
12
-
Robinson R22
2
Piston
11
-
11
-
Robinson R44
4
Piston
5
-
5
-
Sikorsky 300CB/CBi
2
Piston
44
-
44
-
Fixed Wing
1
-
1
-
76
-
76
-
Fixed Wing
3
35
38
-
Total
350
127
477
57
TOTAL LACE (Large Aircraft Equivalent)*
160 |
 26
Operating lease strategy: lowering the cost and amount of
capital needed to grow
•
Of the 76 a/c currently leased in our fleet, 46 are commercial (35 LACE) and 30
are training 35 LACE a/c represent approximately 22% of our commercial fleet
•
Our
goal
is
for
commercial
fleet
operating
leases
to
account
for
approximately
30-35% of our LACE
Leased aircraft as of September 30, 2013
Small
Medium
Large
Total
Leased LACE
Total LACE
% Leased
EBU
-
1
20
21
21
59
35%
WASBU
-
1
-
1
1
21
2%
NABU
1
13
3
17
10
33
29%
AUSBU
2
2
3
7
5
19
24%
OIBU
-
-
-
-
-
28
-
Total
3
17
26
46
35
160
22%
See
10-Q
Note
5
“Commitments
and
contingencies”
for
more
information
provided
on
operating
leases |
  27
Small
Medium
Large
Training
Total
EBU
-
1
20
-
21
WASBU
-
1
-
-
1
NABU
1
13
3
-
17
AUSBU
2
2
3
-
7
OIBU
-
-
-
-
-
Academy
-
-
-
30
30
Total
3
17
26
30
76
Leased aircraft in consolidated fleet
Consolidated fleet changes and aircraft sales for
Q2 FY14
See 10-Q Note 5
“Commitments and contingencies”
for more information provided on operating leases.
Additionally, during Q2 FY14 we sold seven aircraft $145.6M, which we subsequently
leased back. Small
Medium
Large
Training
Total
EBU
-
-
-
-
-
WASBU
-
1
-
-
1
NABU
19
-
-
-
19
AUSBU
-
-
-
-
-
OIBU
-
4
-
-
4
Academy
-
-
-
2
2
Total
19
5
-
2
26
Held for sale aircraft in consolidated fleet
# of a/c Sold
Cash
received*
Q1 FY14
4
2.0
$
Q2 FY14
4
7.9
Total
8
9.9
$
* Amounts stated in millions
Q1 FY14
Q2 FY14
YTD
Fleet Count Beginning
351
353
351
Delivered
-
Large
3
2
5
Medium
2
3
5
Total Delivered
5
5
10
Removed
Sales
(4)
(4)
(8)
Other*
1
(4)
(3)
Total Removed
(3)
(8)
(11)
353
350
350
* Includes lease returns and commencements
Fleet changes |
 28
Operating revenue, LACE and LACE Rate by BU
1)
$ in millions
2)
LACE Rate is annualized
3)
$ in millions per LACE
4)
Excludes Bristow Academy
Op revenue
1
LACE
LACE Rate
2,3
EBU
$294
59
$9.95
WASBU
152
21
14.62
NABU
119
33
7.13
AUSBU
74
19
7.74
OIBU
65
28
4.73
Total
$724
160
$9.07
Operating Revenue, LACE and LACE Rate by BU
as of September 30, 2013
4 |
 29
Historical LACE by BU
Q1
Q2
Q3
Q4
Q1
Q2
Q3
Q4
Q1
Q2
Q3
Q4
EBU
45
45
45
42
42
43
48
46
44
46
46
45
WASBU
23
23
24
25
24
24
21
22
23
22
22
22
NABU
39
36
36
36
39
35
34
29
30
29
30
30
AUSBU
20
20
22
22
20
23
24
20
19
20
20
19
OIBU
36
34
34
35
33
33
33
38
39
38
38
34
Consolidated
163
158
161
160
157
158
159
154
154
154
155
149
Q1
Q2
Q3
Q4
Q1
Q2
EBU
47
45
51
55
57
59
WASBU
22
22
20
21
21
21
NABU
30
31
39
37
37
33
AUSBU
18
17
17
19
19
19
OIBU
32
28
27
27
27
28
Consolidated
147
142
154
158
161
160
LACE
FY11
FY12
FY10
FY13
FY14 |
 30
Historical LACE Rate by BU
1) $ in millions
2) LACE Rate is annualized
Q1
Q2
Q3
Q4
Q1
Q2
Q3
Q4
Q1
Q2
Q3
Q4
EBU
$8.36
$8.28
$8.40
$8.76
$8.20
$8.50
$7.90
$8.40
$9.80
$9.60
$9.63
$10.09
WASBU
9.08
8.81
8.66
8.34
9.70
9.40
10.70
9.90
9.10
10.30
11.17
11.46
NABU
5.05
5.44
5.26
5.23
5.40
6.10
6.00
6.60
5.80
6.30
5.89
5.79
AUSBU
5.38
5.56
5.59
5.67
6.80
6.00
6.00
7.50
8.60
7.10
6.96
7.78
OIBU
3.66
4.09
4.06
3.78
3.90
4.10
4.40
3.90
3.50
3.70
3.78
4.22
Consolidated
6.31
6.52
6.49
6.45
6.70
6.90
6.90
7.10
7.30
7.40
7.43
7.89
Q1
Q2
Q3
Q4
Q1
Q2
EBU
$10.60
$11.03
$9.74
$9.13
$9.63
$9.95
WASBU
12.35
12.24
13.71
13.28
14.26
14.62
NABU
7.05
7.11
5.84
6.12
6.34
7.13
AUSBU
8.48
9.29
9.55
8.58
8.04
7.74
OIBU
4.22
4.62
4.76
4.94
4.97
4.73
Consolidated
8.55
8.95
8.49
8.35
8.78
9.07
LACE Rate
1,2
FY10
FY11
FY12
FY13
FY14 |
 31
Order and options book as of September 30, 2013
* 22 large a/c on order and 6 large a/c on option are subject to the
successful development and certification of the aircraft #
Helicopter
Class
Delivery Date
Location
Contracted
1
Medium
December 2013
OIBU
1 of 1
3
Medium
December 2013
NABU
3
Large
December 2013
EBU
2 of 3
2
Large
December 2013
AUSBU
1
Large
December 2013
WASBU
1
Medium
March 2014
OIBU
1 of 1
1
Large
March 2014
OIBU
1
Large
March 2014
NABU
1 of 1
3
Medium
June 2014
OIBU
3 of 3
1
Large
June 2014
EBU
1
Large
June 2014
OIBU
4
Medium
September 2014
WASBU
2
Medium
September 2014
OIBU
1
Medium
September 2014
NABU
3
Large
September 2014
EBU
2 of 3
1
Large
December 2014
EBU
1
Large
December 2014
AUSBU
1 of 1
1
Large
March 2015
EBU
1
Large
June 2015
EBU
1
Large
September 2015
NABU
1
Large
December 2015
NABU
1
Large
March 2016
EBU
2
Large
March 2016
NABU
1
Large
June 2016
NABU
1
Large
June 2016
EBU
39
11 of 39
ORDER BOOK*
#
Helicopter
Class
Delivery Date
3
Medium
December 2014
4
Large
March 2015
2
Medium
March 2015
3
Large
June 2015
3
Medium
June 2015
3
Large
September 2015
2
Medium
September 2015
3
Large
December 2015
2
Medium
December 2015
3
Large
March 2016
1
Medium
March 2016
3
Large
June 2016
2
Medium
June 2016
3
Large
September 2016
2
Medium
September 2016
4
Large
December 2016
2
Medium
December 2016
3
Large
March 2017
1
Medium
March 2017
3
Large
June 2017
1
Medium
June 2017
3
Large
September 2017
1
Medium
September 2017
4
Large
December 2017
1
Medium
December 2017
1
Large
March 2017
63
OPTIONS BOOK |
 32
Order and options book as of September 30, 2013
(continued)
#
Helicopter
Class
Delivery Date
Location
Contracted
1
Large
June 2014
EBU
1 of 1
3
Large
September 2014
EBU
3 of 3
2
Large
December 2014
EBU
2 of 2
4
Large
March 2015
EBU
4 of 4
2
Large
June 2015
EBU
2 of 2
4
Large
September 2015
EBU
4 of 4
2
Large
December 2015
EBU
2 of 2
18
18 of 18
SAR CONFIGURED ORDER BOOK |
 33
Adjusted EBITDAR margin* trend
Q1
Q2
Q3
Q4
Full Year
Q1
Q2
Q3
Q4
Full Year
EBU
29.8%
31.5%
34.6%
34.4%
32.7%
33.0%
31.4%
30.7%
36.1%
32.9%
WASBU
33.7%
36.9%
35.8%
34.3%
35.2%
29.5%
35.5%
37.2%
36.6%
35.0%
NABU
20.8%
25.8%
15.9%
8.5%
18.5%
14.3%
20.6%
14.8%
19.4%
17.3%
AUSBU
33.2%
26.1%
27.0%
31.1%
29.3%
20.2%
14.4%
23.5%
35.6%
24.3%
OIBU
18.3%
40.2%
37.4%
59.4%
39.3%
48.1%
19.1%
47.8%
42.9%
39.5%
Consolidated
23.8%
27.5%
25.9%
29.6%
26.7%
23.4%
24.0%
27.6%
31.2%
26.6%
Q1
Q2
Q3
Q4
Full Year
Q1
Q2
EBU
32.2%
34.6%
39.5%
38.3%
36.2%
30.3%
35.3%
WASBU
31.9%
26.5%
35.0%
31.8%
31.5%
31.3%
30.4%
NABU
23.2%
20.7%
29.1%
29.5%
25.7%
29.2%
31.0%
AUSBU
27.0%
28.0%
27.3%
26.0%
27.1%
17.7%
21.0%
OIBU
36.2%
44.2%
55.7%
51.6%
46.6%
67.4%
39.3%
Consolidated
26.3%
26.1%
31.5%
29.4%
28.3%
28.5%
28.7%
2011
2012
2013
2014
* Adjusted EBITDAR excludes special items and asset dispositions and margin is calculated by taking
adjusted EBITDAR divided by operating revenue |
 34
Adjusted EBITDAR* reconciliation
* Adjusted EBITDAR excludes special items and asset dispositions
($ in millions)
Q1
Q2
Q3
Q4
Full Year
Q1
Q2
Q3
Q4
Full Year
Net income
$20.9
$38.8
$42.3
$31.2
$133.3
$21.2
$3.0
$26.5
$14.6
$65.2
Income tax expense
8.5
3.3
-11.8
7.1
7.1
6.6
-1.9
7.1
2.4
14.2
Interest expense
11.1
11.5
13.8
9.9
46.2
9.0
9.5
9.8
10.0
38.1
Gain on disposal of assets
-1.7
-1.9
0.0
-5.1
-8.7
-1.4
1.6
2.9
28.6
31.7
Depreciation and amortization
19.3
21.0
21.3
27.7
89.4
22.7
25.4
22.7
25.3
96.1
Special items
0.0
0.0
-1.2
2.4
1.2
0.0
24.6
0.0
3.4
28.1
Adjusted EBITDA Subtotal
58.1
72.7
64.4
73.3
268.5
58.1
62.1
68.9
84.3
273.4
Rental expense
6.6
6.1
8.7
7.7
29.2
9.0
9.1
12.8
15.1
46.0
Adjusted EBITDAR
$64.7
$78.8
$73.1
$81.1
$297.7
$67.0
$71.2
$81.8
$99.5
$319.5
($ in millions)
Q1
Q2
Q3
Q4
Full Year
Q1
Q2
Net income
$24.2
$30.4
$36.7
$40.4
$131.7
$26.9
$109.9
Income tax expense
6.2
8.3
7.8
12.7
35.0
7.6
41.1
Interest expense
8.8
8.6
14.7
10.3
42.4
20.4
9.1
Gain on disposal of assets
5.3
1.3
-7.4
-7.2
-8.1
1.7
3.1
Depreciation and amortization
21.4
23.3
24.9
26.7
96.3
22.8
23.9
Special items
2.2
-2.3
14.9
1.9
16.2
0.0
-101.8
Adjusted EBITDA Subtotal
68.0
69.6
91.6
84.8
313.5
79.4
85.2
Rental expense
16.3
15.3
17.6
18.3
67.4
23.1
23.3
Adjusted EBITDAR
$84.3
$84.9
$109.2
$103.0
$381.0
$102.5
$108.5
Fiscal year ended,
3/31/2011
3/31/2012
3/31/2013
3/31/2014
Fiscal year ended, |
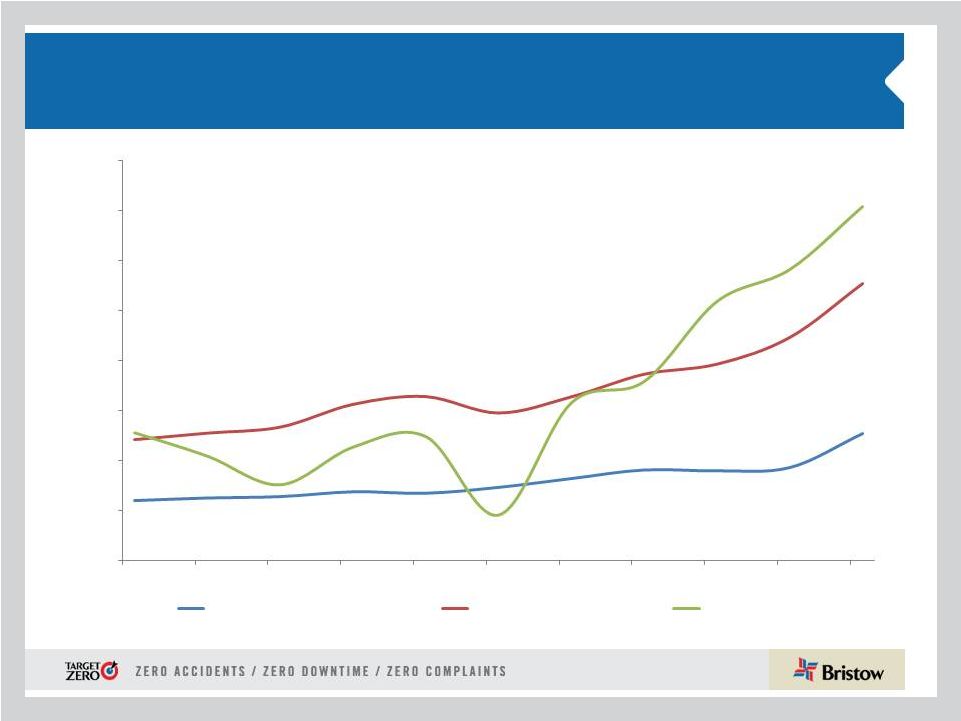 35
Bristow stock price reflects improved operational
performance and increasing shareholder returns
Note: The net asset FMV per share does not include our UK SAR aircraft
47.67
62.68
70.39
35.00
40.00
45.00
50.00
55.00
60.00
65.00
70.00
75.00
Mar-11
Jun-11
Sep-11
Dec-11
Mar-12
Jun-12
Sep-12
Dec-12
Mar-13
Jun-13
Sep-13
Book value of equity per share
Net asset FMV per share
Average stock price
$
$
$ |
 36
Net asset fair market value (FMV) per share
calculation as of September 30, 2013
(in millions)
(+) FMV of a/c
1,896
$
(+) FMV of leased a/c
753
(+) NBV of PPE w/o a/c
446
(+) Working capital
521
(-) LT debt
(824)
(-) Leased imputed debt
(349)
(-) Pension liability
(127)
Net asset FMV
2,316
$
# of common shares
37
Net asset FMV per share
62.68
$ |
 37
Bristow Value Added (BVA)
Sample calculation for Q2 FY14 and Q2 FY13
Bristow
Value
Added
=
Gross
Cash
Flow
–
(Gross
Operating
Assets
X
Capital
Charge)
BVA
= GCF -
(
GOA X 10.5%** )
Bristow Value Added calculation for Q2 FY14
$20.6
= $109.2* -
( $3,376*
X 2.625%**) Bristow Value Added
calculation for Q1 FY13 $2.1
=
$78.8*
-
(
$2,922*
X
2.625%**)
* Reconciliation for these items follows right after this
slide ** Quarterly capital charge of 2.625% is based on annual
capital charge of 10.5% |
 38
Gross cash flow reconciliation
(in millions)
Gross Cash Flow Reconciliation
Q2 FY13
Q2 FY14
Net Income
29.7
110.6
Depreciation and Amortization
23.3
23.9
Interest Expense
8.6
9.1
Interest Income
(0.3)
(0.8)
Rent
15.3
23.3
Other Income/expense-net
0.2
(1.5)
Gain/loss on Asset Sale
1.3
3.1
Gain on sale of unconsolidated affiliate - net of tax
0.0
(67.9)
Special Items
0.0
2.9
Tax Effect from Special Items
0.3
(1.3)
Earnings (losses) from Unconsolidated Affiliates, Net
(7.0)
(3.1)
Non-controlling Interests
0.8
(0.7)
Gross Cash Flow (before Lider)
72.2
97.6
Gross Cashflow -Lider proportional
6.6
11.6
Gross Cash Flow after Lider
78.8
109.2 |
 39
Adjusted gross operating assets reconciliation
(in millions)
Adjusted Gross Operating Assets Reconciliation
Q2 FY13
Q2 FY14
Total Assets
3,166
Accumulated Depreciation
518
Capitalized Operating Leases
225
373
Cash and Cash Equivalents
(348)
(314)
Investment in Unconsolidated Entities
(215)
(272)
Goodwill
(30)
(30)
Intangibles
(4)
(2)
Assets Held for Sale: Net
(20)
(27)
Assets Held for Sale: Gross
83
56
Adj. for gains & losses on assets sales
120
59
Accounts Payable
(56)
(70)
Accrued Maintenance and Repairs
(19)
(17)
Other Accrued Taxes
(8)
(10)
Accrued Wages, Benefits and Related Taxes
(45)
(49)
Other Accrued Liabilities
(27)
(24)
Income Taxes Payable
(13)
(33)
Deferred Revenue
(13)
(21)
ST Deferred Taxes
(15)
(2)
LT Deferred Taxes
(144)
(155)
Adjusted Gross Operating Assets before Lider
$2,723
$3,146
Adjusted Gross Operating Assets-Lider proportional
199
230
Adjusted Gross Operating Assets after Lider
$2,922
$3,376
2,785
464 |
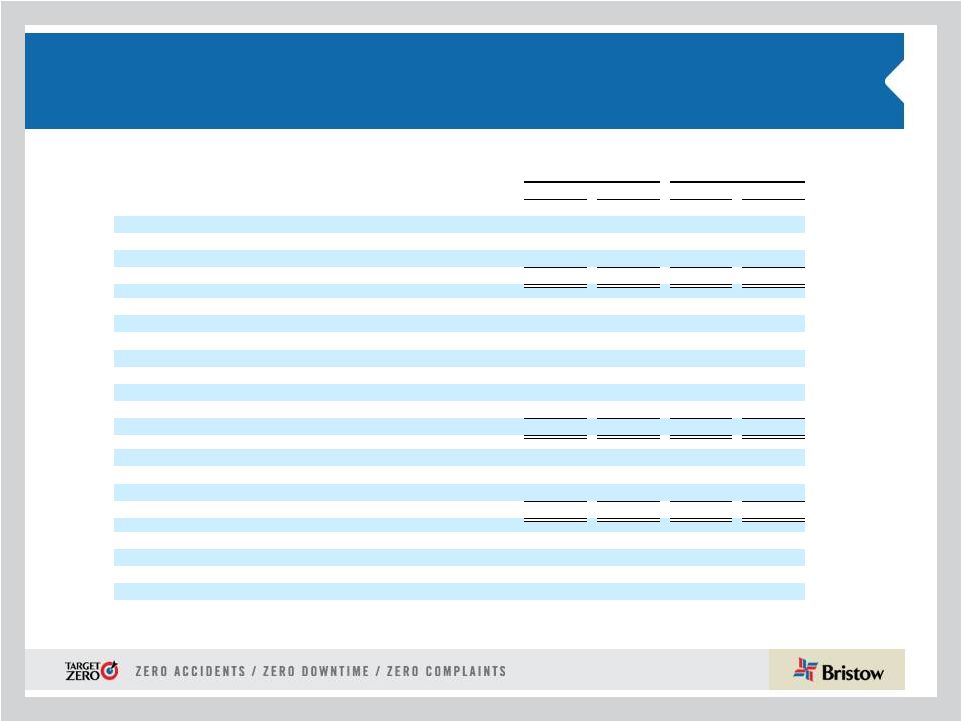 40
GAAP reconciliation
(i) See information about special items in 10-Q or earnings release for Q2
FY14 (ii)
These amounts are presented after applying the appropriate tax effect to each item
and dividing by the weighted average shares outstanding during the related period to calculate the earnings per share impact
Three Months Ended
September 30,
Six Months Ended
September 30,
2013
2012
2013
2012
(In thousands, except per share amounts)
Adjusted operating income
$
59,087
$
46,274
$
117,752
$
93,276
Loss on disposal of assets
(3,064)
(1,262)
(4,785)
(6,577)
Special items
(i)
(2,088)
2,316
(2,913)
622
Operating income
$
53,935
$
47,328
$
110,054
$
87,321
Adjusted EBITDAR
$
108,508
$
84,922
$
211,806
$
168,727
Loss on disposal of assets
(3,064)
(1,262)
(4,785)
(6,577)
Special items
(i)
101,836
2,316
101,011
622
Depreciation and amortization
(23,858)
(23,321)
(46,677)
(44,693)
Rent expense
(23,314)
(15,282)
(46,375)
(31,556)
Interest expense
(9,078)
(8,597)
(29,448)
(17,371)
Provision for income taxes
(41,146)
(8,342)
(48,736)
(14,522)
Net
income
$
109,884
$
30,434
$
136,796
$
54,630
Adjusted net income
$
46,504
$
29,153
$
83,544
$
58,425
Loss on disposal of assets
(ii)
(2,438)
(990)
(3,780)
(5,196)
Special items
(i) (ii)
66,540
1,505
57,728
101
Net income attributable to Bristow Group
$
110,606
$
29,668
$
137,492
$
53,330
Adjusted diluted earnings per share
$
1.27
$
0.80
$
2.28
$
1.60
Loss on disposal of assets
(ii)
(0.07)
(0.03)
(0.10)
(0.14)
Special items
(i) (ii)
1.81
0.04
1.58
—
Diluted earnings per share
3.01
0.82
3.75
1.46 |
 41
Leverage reconciliation
*Adjusted EBITDAR excludes gains and losses on dispositions of assets
Debt
Investment
Capital
Leverage
(a)
(b)
(c) = (a) + (b)
(a) / (c)
(in millions)
As of September 30, 2013
831.1
$
1,760.5
$
2,591.6
$
32.1%
Adjust for:
Unfunded Pension Liability
127.3
127.3
NPV of Lease Obligations
348.9
348.9
Letters of credit
2.4
2.4
Adjusted
1,309.6
$
(d)
1,760.5
$
3,070.1
$
42.7%
Calculation of debt to adjusted EBITDAR multiple
TTM Adjusted EBITDAR*:
FY 2014
424.0
$
(e)
= (d) / (e)
3.09:1 |
 42
Bristow Group Inc. (NYSE: BRS)
2103
City
West
Blvd.,
4
Floor
Houston, Texas 77042
t
713.267.7600
f
713.267.7620
bristowgroup.com
Contact Us
th |