Attached files
| file | filename |
|---|---|
| 8-K - 8-K - NEWTEK BUSINESS SERVICES, INC. | d626818d8k.htm |
 www.thesba.com
Newtek Business Services, Inc.
Newtek Business Services, Inc.
“The Small Business Authority®”
“The Small Business Authority®”
Hosted by:
Hosted by:
Barry Sloane, President & CEO
Barry Sloane, President & CEO
Jennifer Eddelson, EVP & CAO
Jennifer Eddelson, EVP & CAO
Third Quarter Quarter 2013
Third Quarter Quarter 2013
Financial Results Conference Call
Financial Results Conference Call
November 6, 2013 4:15pm ET
November 6, 2013 4:15pm ET
NASDAQ: NEWT
NASDAQ: NEWT
www.thesba.com
www.thesba.com
Investor Relations
Public Relations
Newtek IR
Hayden Investor Relations
Newtek PR
Jayne Cavuoto
Director of IR
jcavuoto@thesba.com
(212) 273-8179
Brett Maas
brett@haydenir.com
(646) 536-7331
Peter Seltzberg
peter@haydenir.com
(646) 415-8972
Simrita Singh
Director of Marketing
ssingh@thesba.com
(212) 356-9566
Exhibit 99.1 |
 www.thesba.com
Safe Harbor Statement
Safe Harbor Statement
The statements in this slide presentation including statements regarding anticipated future
financial performance, Newtek's beliefs, expectations, intentions or strategies for the
future, may be "forward-looking statements" under the Private Securities
Litigation Reform Act of 1995. All forward-looking statements involve a number of
risks and uncertainties that could cause actual results to differ materially from the
plans, intentions and expectations reflected in or suggested by the forward-looking
statements. Such risks and uncertainties include, among others, intensified
competition, operating problems and their impact on revenues and profit margins,
anticipated future business strategies and financial performance, anticipated future
number of customers, business prospects, legislative developments and similar matters. Risk
factors, cautionary statements and other conditions which could cause Newtek’s
actual results to differ from management's current expectations are contained in
Newtek’s filings with the Securities and Exchange Commission and available through
http://www.sec.gov 2 |
 www.thesba.com
N2 Registration Statement
N2 Registration Statement
We will not comment on this call on
anything outside the registration
statement until its effective date.
3 |
 Recent 2013
Financial Highlights Recent 2013 Financial Highlights
4
www.thesba.com
Q3 2013: diluted EPS was $0.05; a year-over-year increase of 66.7%
Nine months ended 9/30/2013: diluted EPS was $0.14; a year-over-year increase
of 40%
Q3 2013: operating revenues were $34.8 million; a year-over-year increase of 3.9%
Nine months ended 9/30/2013: operating revenues were $105.9; a year-over-year
increase of 9.7%
Nine months ended 9/30/2013: net income attributable to Newtek Business Services,
Inc. was $5.1 million; a year-over-year increase of 43.2%
Nine months ended 9/30/2013: pretax net income was $7.0 million;
a year-over-year
increase of 12.8%
Reaffirmed 2013 consolidated guidance
•
2013 Diluted EPS target: range of $0.17 to $0.19; midpoint of $0.18
Issued 2014 consolidated guidance
•
2014 Diluted EPS target: range of $0.20 to $0.26; midpoint of $0.23
|
 Recent 2013
Operational Highlights Recent 2013 Operational Highlights
For the nine months ended September 30, 2013, funded $120.0 million in loans,
a 66.3% year-over-year increase
Funded $17.0 million in loans in the month of October
Company on track to fund $175 million of SBA 7(a) loans in 2013
As of September 30, 2013, total loan pipeline* increased year-over-year by
55.8% to $437.9 million
Lender on a run rate to receive between $4.5 –
$5.0 billion in referrals for 2013,
representing approximately 2x the $2.3 billion in referrals received in 2012
Entered into Letter of Commitment for $75 million revolving credit facility with
Goldman Sachs Bank USA
Selected to service a $400 million portfolio for a large institutional client; current
total loan servicing portfolio exceeds $1.0 billion
5
*Total loan pipeline = Open loan referrals + Prequalified loans + Loans in underwriting +
Loans approved and pending closing www.thesba.com |
 www.thesba.com
Reaffirming 2013 Guidance
Reaffirming 2013 Guidance
6
Operating Revenue:
•
Midpoint of $148.2 million, with a range of $145.1 million and $151.2
million
•
Increase of 13.0% over 2012 revenue of $131.1 million
Pretax Income:
•
Midpoint of $11.5 million, with a range of $10.0 million and $13.0 million
•
Increase of 22.3% over 2012 pretax income of $9.4 million
Diluted EPS:
•
Midpoint of $0.18, with a range of $0.17
-
$0.19
per
share
•
Increase of 20.0% over 2012 diluted EPS of $0.15 per share
Adjusted EBITDA*:
•
Midpoint of $20.9 million, with a range of $19.3 million and $22.4 million
•
Increase of 25.1% over 2012 Adjusted EBITDA* of $16.7 million
*See slide 30 for definition of Adjusted EBITDA |
 www.thesba.com
Issued 2014 Guidance
Issued 2014 Guidance
7
Operating Revenue:
•
Midpoint of $164.0 million, with a range of $157.0 million and $171.0
million
•
Increase of 10.7% over 2013 revenue midpoint guidance of $148.2 million
Pretax Income:
•
Midpoint of $14.6 million, with a range of $11.8 million and $17.9 million
•
Increase of 27.0% over 2013 pretax income midpoint guidance of $11.5
million
Diluted EPS:
•
Midpoint
of
$0.23,
with
a
range
of
$0.20
-
$0.26
per
share
•
Increase of 27.8% over 2013 diluted EPS midpoint guidance of $0.18
Adjusted EBITDA*:
•
Midpoint of $27.4 million, with a range of $24.4 million and $30.2 million
•
Increase of 31.1% over 2013 Adjusted EBITDA* midpoint guidance of $20.9
million
*See slide 30 for definition of Adjusted EBITDA |
 www.thesba.com
Segment Results
Segment Results
8
Q3 2013
Nine-Months Ended
September, 30 2013
Year-over-Year Comparisons
•
Pre-tax
Income:
$1.7
million;
a
12.9%
decrease
Small
Business
Finance
(SBF)
Electronic
Payment
Processing
(EPP)
•
Revenue:
$22.2
million;
a
2.3%
increase
•
Pre-tax
Income:
$1.9
million;
a
7.9%
increase
Managed
Technology
Solutions
(MTS)
•
Pre-tax
Income:
$881
thousand;
a
24.8%
decrease
Small
Business
Finance
(SBF)
•
Pre-tax Income:
$5.9 million; a 20.4%
increase
Electronic
Payment
Processing
(EPP)
Managed
Technology
Solutions
(MTS)
•
Revenue:
$23.4
million;
a
33.4%
increase
•
Revenue:
$7.6
million;
a
12.4%
increase
•
Revenue:
$4.5
million;
a
1.6%
decrease
•
Revenue:
$13.4
million;
a
2.5%
decrease
•
Pre-tax
Income:
$2.8
million;
a
16.8%
decrease
•
Revenue:
$67.3 million; a 5.7% increase
•
Pre-tax
Income:
$6.2 million; a 17.6%
increase |
   www.thesba.com
Q4 2013 Guidance vs. Q4 2012 Actual
Q4 2013 Guidance vs. Q4 2012 Actual
9
Guidance
Actual
For the three
For the three
Months ended
Months ended
December 31, 2013
December 31, 2012
Consolidated Revenues
38.6
$
34.6
$
11.6%
Consolidated Income before income taxes
4.3
$
3.2
$
34.4%
Adjusted EBITDA adjustments
Income from tax credits
0.0
-0.1
Interest expense
1.6
1.3
Amortization of 2011 accrued loss on lease restructure
-0.1
-0.1
Non-cash stock comp expense
0.2
0.1
Depreciation and amortization
0.8
0.8
Consolidated Adjusted EBITDA*
6.8
$
5.2
$
30.2%
Change
*See slide 30 for definition of Adjusted EBITDA |
 www.thesba.com
Issued 2014 Guidance
Issued 2014 Guidance
10
Operating Revenue:
•
Midpoint of $164.0 million, with a range of $157.0 million and $171.0
million
•
Increase of 10.7% over 2013 revenue midpoint guidance of $148.2 million
Pretax Income:
•
Midpoint of $14.6 million, with a range of $11.8 million and $17.9 million
•
Increase of 27.0% over 2013 pretax income midpoint guidance of $11.5
million
Diluted EPS:
•
Midpoint of $0.23, with a range of $0.20
-
$0.26
per
share
•
Increase of 27.8% over 2013 diluted EPS midpoint guidance of $0.18
Adjusted EBITDA*:
•
Midpoint of $27.4 million, with a range of $24.4 million and $30.2 million
•
Increase of 31.1% over 2013 Adjusted EBITDA* midpoint guidance of $20.9
million
*See slide 30 for definition of Adjusted EBITDA |
 www.thesba.com
11
Consolidated Earnings Performance
Consolidated Earnings Performance
Diluted Earnings per Share
Expect 20% growth in diluted EPS for 2013 vs. 2012
•
66.7%
increase year over year in
diluted EPS in Q3 2013
•
40.0%
increase year over year in
diluted EPS for the nine months ended
September 30, 2013
$0.00
$0.03
$0.05
$0.00
$0.02
$0.04
Diluted Earnings Per Share
Q3 2012
Q3 2013
$0.06
$0.10
$0.14
$0.03
$0.06
$0.09
$0.12
$0.15
Diluted Earnings Per Share
9 Months 2012
9 Months 2013 |
 Q3 YTD 2013
Financial Results Q3 YTD 2013 Financial Results
12
43.2%
year-over-year increase
Pre-tax Net Income
21.9%
year-over-year increase
12.8%
year-over-year increase
9.7%
year-over-year increase
Adjusted EBITDA*
Net Income
(Attributable to Newtek Business Services, Inc.)
$ in millions
$ in millions
$ in millions
*See slide 30 for definition of Adjusted EBITDA
Total Operating Revenues
$ in millions
www.thesba.com
$6.2
$7.0
9/30/2012
9/30/2013
9/30/2012
9/30/2013
9/30/2012
9/30/2013
9/30/2012
9/30/2013
$96.5
$105.9
$5.1
$3.6
$11.4
$13.9 |
 www.thesba.com
Consolidated Balance Sheet
Consolidated Balance Sheet
Cash Position:
•
Decrease of $4.5 million in cash and cash equivalents*
–
Cash per diluted share equaled $0.48 at September 30, 2013
13
$ in thousands
Balance
September 30, 2013
Balance
Dec 31, 2012
Total Cash & Cash Equivalents*
$18,160
$22,685
Total Assets
$176,971
$152,742
Total Liabilities
$102,522
$83,840
Total Equity
$74,449
$68,902
Selected Items
*Includes restricted cash of $10.4 million at September 30, 2013, and $8.5 million at December
31, 2012 |
 Small Business
Finance Small Business Finance
14
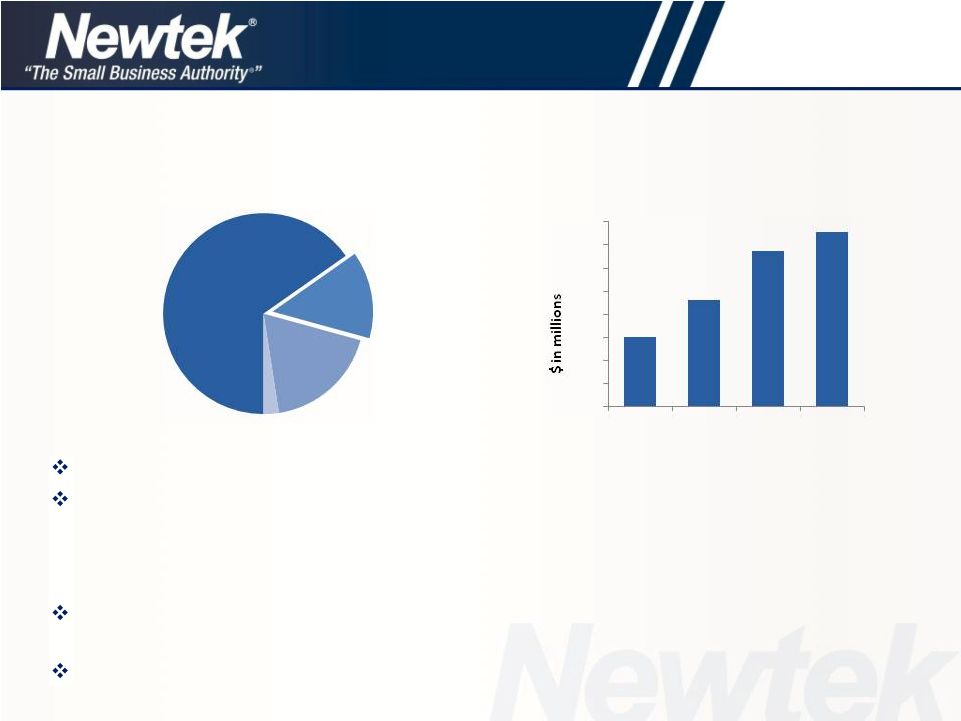
Q3 2013 SBF revenue increased by 12.4% to $7.6 million
Funded $120.0 million in loans in the nine months ended 9/30/2013, a 66.3%
year-over-year increase
•
Funded $17.0 million in loans in the month of October 2013
•
Company on track to fund $175 million in SBA 7(a) loans in 2013
Entered into Letter of Commitment for a $75 million revolving credit facility with Goldman
Sachs Bank USA
Addition of Goldman financing facility, and potential equity raise, should enable us to issue
larger securitizations with better execution on a go-forward basis
Q3 2013 SBF revenue was 21.8% of total operating revenue
Newtek Business Services
Q3
2013
Total
Operating
Revenue:
$34.8
million
SBF
$7.6M
$8
$7
$6
$5
$4
$3
$2
$1
$-
Q3'
10
Q3 '11
Q3 '12
Q3 '13
$3.0
$4.6
$6.7
$7.6
SBF Revenue Trend
www.thesba.com |
  www.thesba.com
Loan-Pricing Trends
Loan-Pricing Trends
15
Q2 2013
Q3 2013
Oct-13
Q3 2012
Q3 2013
112.53
110.74
112.53
112.41
110.74
Year-Over-Year
Sequential
Weighted-Average Net Price to NSBF |
 www.thesba.com
Key Variables in Loan Sale Transaction
Loan Amount
$1,000,000
Guaranty Percent
75%
Guaranteed Balance
$750,000
Unguaranteed Balance
$250,000
Premium*
12.5%
16
Small Business Finance
Small Business Finance
Direct
Revenue
/
Expense
of
a
Loan
Sale
Transaction
–
An
Example
Resulting Revenue (Expense)
Associated Premium**
$93,750
Servicing Asset***
$18,630
Total Premium Income
$112,380
Packaging Fee Income
$2,500
FV Discount
$(18,750)
Referral Fees
$(7,500)
Total Direct Expenses
$(26,250)
Net Risk-adjusted Profit Recognized
$88,630
Net Cash Created pretax
(post securitization)****
$11,250
**Assumes 12.5% of the Guaranteed balance
***
Value determined by GAAP servicing value
**** Assuming the loan is sold in a securitization in
12 months
*Premium above 10% split 50/50 with SBA |
 www.thesba.com
Small Business Finance –
Small Business Finance –
Total Pipeline
Total Pipeline
17
As of September 30, 2013, total loan pipeline* increased by 55.8%, to $437.9
million year over year:
•
Open Referrals increased by $79.4 million, or 37.9%
•
Prequalified volume increased by $31.5 million, or 123.6%
•
Loans In Underwriting increased by $27.2 million, or 117.4%
•
Approved and Pending Closing increased by $18.7 million, or 80.7%
The Lender is on a run rate to receive between $4.5
-
$5.0
billion
in
referrals
for
2013,
approximately
2x
the
$2.3
billion
in
total
referrals
received
in
2012
*Total loan pipeline = Open loan referrals + Prequalified loans + Loans in underwriting +
Loans approved and pending closing $209.2
$25.5
$23.2
$23.2
$288.6
$57.0
$50.4
$41.9
Open Referrals
Prequalified
In Underwriting
Approved & Pending
Closing
9/30/2012
9/30/2013 |
 www.thesba.com
18
Comparative Loan Portfolio Data
Comparative Loan Portfolio Data
Loan Characteristic
As of 12/31/10
As of 9/30/13
Business Type:
Existing Businesses
53.93%
81.38%
Business Acquisition
25.89%
11.54%
Start-Ups
20.18%
7.08%
Primary Collateral:
Commercial RE
45.33%
50.82%
Machinery & Equipment
22.79%
26.61%
Residential RE
22.27%
12.87%
Other
9.61%
7.20%
Percentage First Lien on RE:
Commercial RE
84.84%
94.50%
Residential RE
9.87%
22.49%
Other:
Weighted Average Mean FICO
675
710
Weighted Average Current LTV
78.23%
72.76%
(12/31/10 vs. 9/30/2013)
Loan Characteristic
As of 12/31/10
Loan Characteristic
As of 9/30/13
Industry:
Industry:
Restaurant
10.60%
Restaurant
7.87%
Hotels & Motels
7.58%
Amusement,
Gambling and
Recreation
6.13%
State Concentration:
State Concentration:
Florida
21.55%
New York
12.18%
New York
12.66%
Florida
9.63%
Georgia
14.08%
Texas
7.16% |
 www.thesba.com
Servicing Portfolio
Servicing Portfolio
19
The SBF servicing portfolio –
September 30, 2013 vs. 2012:
•
Total servicing portfolio increased by 5.4% to $619.3 million
–
Newtek portfolio increased by 35.2%; third-party servicing portfolio decreased by
32.5%
–
Decrease in third-party servicing portfolio due to external client decision to sell a
significant group of loans from the portfolio
–
In Q4 2013, added approximately $400 million in external servicing for a large
institutional
client;
total
loan
servicing
portfolio
now
exceeds
$1.0
billion
*Principal balance of loans
serviced (dollars in millions)
$328.9
$258.8
$587.6
$444.7
$174.6
$619.3
NEWT Loans*
Servicing Other Loans*
Total Loans*
30-Sep-12
30-Sep-13 |
 Q3 2013 EPP
revenue increased by 2.2% to $22.2 million Q3 2013 average monthly processing volume per
merchant increased by
approximately 5% over Q3 2012
•
Expect approximately $4.5 billion of annualized electronic payment processing
volume by the end of 2013
20
EPP
Revenue
$22.2M
Q3 2013 EPP revenue was 63.8% of total operating revenue
Newtek Business Services
Q3 2013 Total Operating Revenue:
Electronic Payment Processing
Electronic Payment Processing
www.thesba.com
$34.8 million
EPP Revenue Trend
$25
$20
$15
$10
$5
$0
Q3 '10
Q3 '11
Q3 '12
Q3 '13
$20.5
$20.7
$21.7
$22.2 |
 www.thesba.com
Electronic Payment Processing
Electronic Payment Processing
21
During 2013, the Louisville, KY group:
Closed 114 new merchant accounts thus far in 2013
As of September 30, 2013:
•
Annualized processing volume of $45.9 million
•
Average processing volume per client per month* of $33,530
thousand
Independent Sales Organization (ISO) Contribution
*Calculated using annualized processing volume of $45.9 million
|
 Managed
Technology Solutions Managed Technology Solutions
22
MTS
$4.5M
Q3 2013 MTS revenue decreased slightly by 1.6% to $4.5 million
This segment is being transformed to take advantage of shift to cloud-based business
trends including: eCommerce, Payroll and Insurance
•
Q3 2013 average Cloud revenue per user up 22.0% over Q3 2012
Upgrade to Linux-based platforms expected to help increase revenues and margins in this
segment going forward
Issues with MTS
•
Capital expenditure for development vs. current expense
Q3 2013 MTS revenue was 12.8% of total operating revenue
Newtek Business Services
Q3
2013
Total
Operating
Revenue:
$34.8
million
www.thesba.com
$6
$5
$4
$3
$2
$1
$-
$4.8
$4.8
$4.5
$4.5
Q3 '10
Q3 '11
Q3 '12
Q3 '13
MTS Revenue Trend |
 Invested for
the Future Invested for the Future
23
During Q3 2013:
•
Total shared Linux accounts increased by 43.1%, to 1,765 accounts
•
Total cloud service accounts increased by 22.7%, to 35,150* accounts
*Includes the 1,765 shared Linux accounts
Linux and Cloud
www.thesba.com
Growth in New Shared Linux Accounts in
Cloud Environment
Growth in Total Cloud Services
2,000
1,500
1,000
500
0
Jun '13
Jul '13
Aug '13
Sept '13
1,233
1,442
1,569
1,765
28,637
30,010
32,429
35,150
40,000
35,000
30,000
25,000
20,000
15,000
10,000
5,000
0
Jun '13
Jul '13
Aug '13
Sept '13 |
 MTS Referral
Trends MTS Referral Trends
24
Q3 2012 vs. Q3 2013
Q3 2012 vs. Q3 2013
•
Total MTS referrals increased by 64.8% to 4,126
•
Total closed referrals increased by 72.1% to 3,177
•
Q3 2013: 77.0% referral close rate
5,000
4,000
3,000
2,000
1,000
0
Q3 2012
Q3 2013
2,504
4,126
4,000
3,000
2,000
1,000
0
Q3 2012
Q3 2013
3,177
1,846
Total Closed MTS Referrals
Total MTS Referrals
www.thesba.com |
 25
Growth Strategy
Growth Strategy
Increased
advertising
budget by
50%
Grow brand
organically & via
www.thesba.com
Corporate
re-brand:
authoritative
presence in small
business economy
Cross sell,
cross market &
bundle
products
Continue to
grow alliance
channels
Grow
applications
hosted in the
Cloud
•
Remain #1 in Non-bank
Government Guaranteed
SBA 7(a) Lender
•
Grow Newtek
Advantage™
Platform
•
Expect to grow revenues
by 13% organically in
2013
www.thesba.com |
 www.thesba.com
Comparable Company Statistics
Comparable Company Statistics
On Deck Capital –
$500 million market valuation
Lending Club –
$1.55 billion market valuation
Digital River (DRIV) announced purchase of LML Payment Systems (LMLP)
Universal Business Payment Solutions (UBPS) announced $179 million planned
acquisition of credit/debit card sales and processing, payroll processing and tax filing
companies
GoDaddy announced strategic purchase of a cloud-based financial management
application company to reach more small businesses
Newtek has the advantage of experience providing a “suite
of
services”
which
operate
on a similar, coordinated platform, and will also be available in the cloud; it’s called
The
Newtek Advantage™
26
Publicly Traded Comparables
Medallion Financial Corp (TAXI)
Heartland Payment Systems (HPY)
Web.com Group, Inc. (WWWW)
Cbeyond, Inc.
(CBEY)
8 x 8,
Inc. (EGHT)
ReachLocal, Inc. (RLOC)
Stamps.com,
Inc. (STMP)
Universal Business Payment
Solutions (UBPS)
Marchex,
Inc. (MCHX)
Digital River (DRIV)
Vistaprint, NV (VPRT)
Vantiv
(VNTV) |
 Investment
Summary Investment Summary
Publicly traded Company since 2000
Management’s interests aligned with shareholders
•
CEO alone owns approximately 13.4% of outstanding shares*
Trades at approximately 5x 2013 forecasted Adjusted EBITDA**
•
2013 forecasted Adjusted EBITDA** of $20.9 million, an increase of approximately
25.1% over FY 2012 Adjusted EBITDA** of $16.7 million
Trades at approximately 3.9x 2014 forecasted Adjusted EBITDA**
Trades at approximately 1.7x book value
Growing revenues
•
Expect to grow revenues by approximately 13% in 2013
Tremendous opportunity to penetrate market
•
Over 27.5 million small businesses in the U.S.
Inexpensive relative to market comparables
•
Market comps: DRIV, WWWW, VNTV, UBPS, LMLP
27
*As of 11/5/2013
**See slide 30 for definition of Adjusted EBITDA
www.thesba.com |
 Key Statistics
– Key Statistics –
NASDAQ: NEWT
NASDAQ: NEWT
28
Stock
Price $2.99
52-Week
Range $1.66-$3.15
Common Shares O/S 35.4M
Market
Cap $105.8M
Avg. Daily Trading Vol. 55,038
(200-day average)
Share Statistics* (USD)
Revenue
$148.2M
Pre-tax Income
$11.5M
Diluted EPS
$0.18
Adjusted EBITDA**
$20.9M
*As of 11/5/2013
**See slide 30 for definition of Adjusted EBITDA
*** Represents midpoint of expected range
2014 Guidance***
2013 Guidance***
Revenue
$164.0M
Pre-tax Income
$14.6M
Diluted EPS
$0.23
Adjusted EBITDA**
$27.4M
www.thesba.com |
 Financial
Review Financial Review
Jennifer C. Eddelson -
Jennifer C. Eddelson -
CAO
CAO
www.thesba.com |
 www.thesba.com
Non-GAAP Financial Measures
Non-GAAP Financial Measures
In evaluating its business, Newtek considers and uses adjusted EBITDA as a supplemental measure
of its operating performance. The Company defines adjusted EBITDA as earnings
before income from tax credits, interest expense, taxes, depreciation and amortization,
stock compensation expense, other than temporary decline
in
value
of
investments,
Capco
fair
value
change
and
the
amortization
of
the
2011
accrued
loss
on
the lease restructure. Newtek uses adjusted EBITDA as a supplemental measure to review and
assess its operating performance. The Company also presents adjusted EBITDA because
it believes it is frequently used by securities analysts, investors and other interested
parties as a measure of financial performance. The term adjusted EBITDA is not defined
under U.S. generally accepted accounting principles, or U.S. GAAP, and is not a measure
of operating income(loss), operating performance or liquidity presented in accordance
with
U.S.
GAAP.
Adjusted
EBITDA
has
limitations
as
a
analytical
tool
and,
when
assessing
the
Company’s
operating performance, investors should not consider adjusted EBITDA in isolation, or as a
substitute for net income (loss) or other consolidated income statement data prepared in
accordance with U.S. GAAP. Among other things, adjusted EBITDA does not reflect the
Company’s actual cash expenditures. Other companies may calculate
similar
measures
differently
than
Newtek,
limiting
their
usefulness
as
comparative
tools.
Newtek
compensates
for
these
limitations
by
relying
primarily
on
its
GAAP
results
and
using
adjusted
EBITDA only supplementally.
Our
Capcos
operate
under
a
different
set
of
rules
in
each
of
the
7
jurisdictions
and
these
place
varying
requirements
on
the
structure
of
our
investments.
In
some
cases,
particularly
in
Louisiana
or
in
certain
situations in New York, we do not control the equity or management of a qualified business, but
that cannot always be presented orally or in written presentations.
30 |
 In
millions of dollars *Note: totals may not add due to rounding
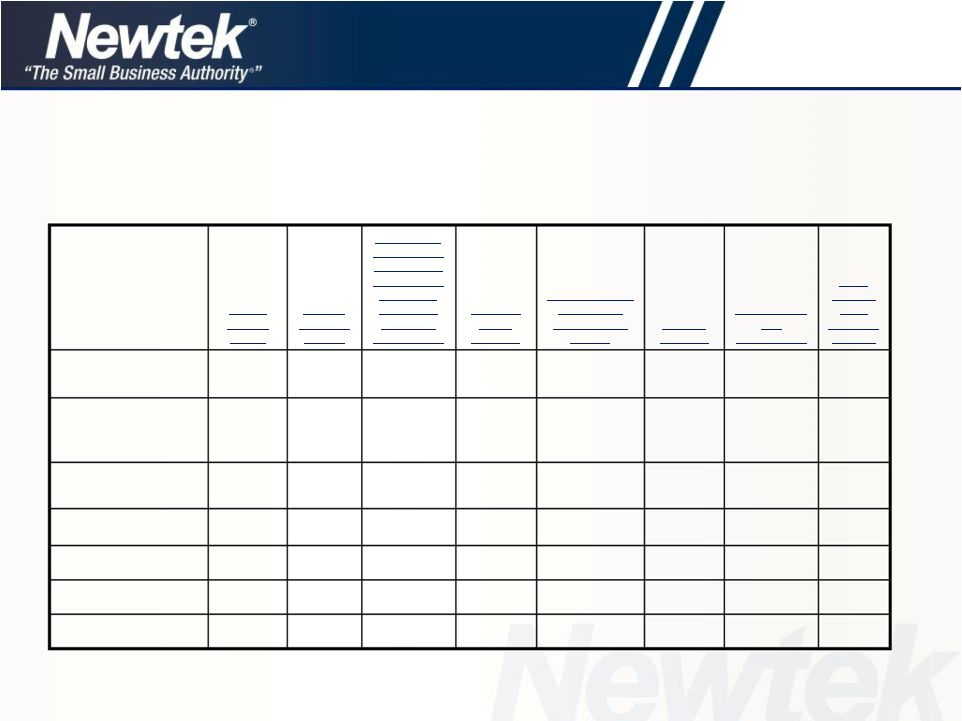
Q3 2013 Actual vs. Q3 2012 Actual
Q3 2013 Actual vs. Q3 2012 Actual
31
Revenue For
The Quarter
Ended
September 30,
2013
Revenue For
The Quarter
Ended
September 30,
2012
Pretax Income
(Loss) For The
Quarter Ended
September 30,
2013
Pretax Income
(Loss) For The
Quarter Ended
September 30,
2012
ADJUSTED
EBITDA For The
Quarter Ended
September 30,
2013
ADJUSTED
EBITDA For The
Quarter Ended
September 30,
2012
Electronic
Payment
Processing
22.177
21.687
1.879
1.742
1.972
1.922
Small
Business
Finance
7.575
6.737
1.728
1.984
3.472
3.337
Managed
Technology
Solutions
4.455
4.526
0.881
1.172
1.267
1.517
All Other
0.689
0.517
(0.311)
(0.179)
(0.251)
(0.165)
Corporate
Activities
0.250
0.200
(1.847)
(1.674)
(1.722)
(1.609)
CAPCO
0.042
0.125
(0.377)
(0.386)
(0.366)
(0.375)
Interco
Eliminations
(0.414)
(0.334)
–
–
–
–
Total
34.774
33.458
1.953
2.659
4.372
4.627
www.thesba.com |
 In
millions of dollars *Note: totals may not add due to rounding
Q3 YTD 2013 Actual vs. Q3 YTD 2012 Actual
Q3 YTD 2013 Actual vs. Q3 YTD 2012 Actual
32
Revenue For
The Nine
Months Ended
September 30,
2013
Revenue For
The Nine
Months Ended
September 30,
2012
Pretax Income
(Loss) For The
Nine Months
Ended
September 30,
2013
Pretax Income
(Loss) For The
Nine Months
Ended
September 30,
2012
ADJUSTED
EBITDA For The
Nine Months
Ended
September 30,
2013
ADJUSTED
EBITDA For
The Nine
Months Ended
September 30,
2012
Electronic
Payment
Processing
67.303
63.678
6.179
5.256
6.477
5.865
Small
Business
Finance
23.399
17.538
5.932
4.928
10.832
8.280
Managed
Technology
Solutions
13.449
13.789
2.818
3.388
3.917
4.393
All Other
1.992
1.400
(1.213)
(0.738)
(1.037)
(0.691)
Corporate
Activities
0.650
0.654
(5.722)
(5.403)
(5.379)
(5.245)
CAPCO
0.131
0.581
(0.958)
(1.193)
(0.920)
(1.157)
Interco
Eliminations
(0.995)
(1.115)
–
–
–
–
Total
105.929
96.525
7.036
6.238
13.890
11.445
www.thesba.com |
 2013 Segment
Guidance 2013 Segment Guidance
*Note: totals may not add due to rounding
In millions of dollars
Electronic
Small
Managed
Total
Inter-
Payment
Business
Technology
All
Corporate
Business
CAPCO
Company
Processing
Finance
Solutions
Other
Activities
Segments
Segment
Eliminations
Total
Low
High
Low
High
Low
High
Low
High
Low
High
Low
High
Low
High
Low
High
2013 Full Year
Revenue
90.4
94.1
34.0
35.6
18.4
19.2
2.2
2.2
0.8
0.8
145.8
151.9
0.1
0.1
(0.8)
145.1
151.2
Pretax Income (Loss)
8.2
9.0
10.0
10.8
3.9
4.7
(1.1)
(0.9)
(9.6)
(9.3)
11.4
14.3
(1.5)
(1.3)
-
10.0
13.0
Income from tax credits
-
-
-
-
-
-
-
-
-
-
-
-
(0.1)
(0.1)
-
(0.1)
(0.1)
Net change in fair value of
credits in lieu of cash and
notes payable in credits in
lieu of cash
-
-
-
-
-
-
-
-
-
-
-
-
-
-
-
-
-
Deferred compensation
expense
-
-
-
-
-
-
-
-
0.4
0.4
0.4
0.4
-
-
-
0.4
0.4
Lease loss amortization
-
-
-
-
-
-
-
-
(0.3)
(0.3)
(0.3)
(0.3)
-
-
-
(0.3)
(0.3)
Interest Expense
-
-
5.9
5.9
0.1
0.1
-
-
-
-
6.0
6.0
0.2
0.2
-
6.2
6.2
Depreciation and
Amortization
0.3
0.3
1.2
1.2
1.5
1.5
0.1
0.1
0.1
0.1
3.2
3.2
-
-
-
3.2
3.2
Adjusted EBITDA
8.5
9.3
17.1
17.9
5.5
6.3
(1.0)
(0.8)
(9.4)
(9.1)
20.7
23.6
(1.4)
(1.2)
-
19.3
22.4
33
www.thesba.com |
 www.thesba.com
2014 Segment Guidance
2014 Segment Guidance
*Note: totals may not add due to rounding
In millions of dollars
Electronic
Small
Managed
Total
Inter-
Payment
Business
Technology
All
Corporate
Business
CAPCO
Company
Processing
Finance
Solutions
Other
Activities
Segments
Segment
Eliminations
Total
Low
High
Low
High
Low
High
Low
High
Low
High
Low
High
Low
High
Low
High
2014 Full Year
Revenue
90.2
99.2
46.5
49.5
17.9
19.7
2.6
2.8
0.8
0.8
158.0
172.0
0.2
0.2
(1.2)
157.0
171.0
Pretax Income (Loss)
8.3
9.2
12.4
15.8
3.8
4.2
(1.2)
(0.9)
(10.1)
(9.2)
13.2
19.1
(1.4)
(1.2)
-
11.8
17.9
Income from tax credits
-
-
-
-
-
-
-
-
-
-
-
-
(0.1)
(0.1)
-
(0.1)
(0.1)
Net change in fair value of
credits in lieu of cash and
notes payable in credits in
lieu of cash
-
-
-
-
-
-
-
-
-
-
-
-
-
-
-
-
-
Deferred compensation
expense
-
-
0.1
0.1
0.1
-
-
-
0.6
0.5
0.9
0.7
-
-
-
0.9
0.7
Lease loss amortization
-
-
-
-
-
-
-
-
(0.3)
(0.3)
(0.3)
(0.3)
-
-
-
(0.3)
(0.3)
Interest Expense
-
-
8.5
8.3
0.1
0.1
-
-
-
-
8.6
8.4
0.2
0.2
-
8.8
8.6
Depreciation and
Amortization
0.4
0.4
1.5
1.5
1.5
1.3
0.1
0.2
0.1
0.1
3.5
3.5
-
-
-
3.5
3.5
Adjusted EBITDA
8.7
9.5
22.3
25.8
5.3
5.7
(1.0)
(0.7)
(9.6)
(8.9)
25.7
31.4
(1.3)
(1.2)
-
24.4
30.2
34 |
 www.thesba.com
Addenda
Addenda |
 www.thesba.com
Pretax
Income
(Loss)
Income
from Tax
Credits
Net Change
in Fair Value
of Credits in
Lieu of Cash
and Notes
Payable in
Credits in
Lieu of Cash
Deferred
Comp
Expense
Amortization of
2011 Lease
restructuring
charge
Interest
Expense
Depreciation
and
amortization
Third
Quarter
2013
Adjusted
EBITDA
Electronic Payment
Processing
1.879
-
-
0.009
-
-
0.084
1.972
Small Business Finance
1.728
-
-
0.028
-
1.387
0.329
3.472
Managed Technology
Solutions
0.881
-
-
0.015
-
0.044
0.327
1.267
All Other
(0.311)
-
-
0.010
-
-
0.050
(0.251)
Corporate Activities
(1.847)
-
-
0.152
(0.073)
0.007
0.039
(1.722)
CAPCO
(0.377)
(0.031)
-
-
-
0.041
0.001
(0.366)
Total
1.953
(0.031)
-
0.214
(0.073)
1.479
0.830
4.372
Adjusted EBITDA Reconciliation
Adjusted EBITDA Reconciliation from Pretax Income (Loss)
For the three months ended September 30, 2013
In millions of dollars
*Note: totals may not add due to rounding
36 |
 www.thesba.com
Pretax
Income
(Loss)
Income
from Tax
Credits
Net Change
in Fair Value
of Credits in
Lieu of Cash
and Notes
Payable in
Credits in
Lieu of Cash
Deferred
Comp
Expense
Amortization of
2011 Lease
restructuring
charge
Interest
Expense
Depreciation
and
amortization
Third
Quarter
2012
Adjusted
EBITDA
Electronic Payment
Processing
1.742
-
-
0.009
-
-
0.171
1.922
Small Business Finance
1.984
-
-
0.016
-
1.098
0.239
3.337
Managed Technology
Solutions
1.172
-
-
0.008
-
0.019
0.318
1.517
All Other
(0.179)
-
-
0.008
-
-
0.006
(0.165)
Corporate Activities
(1.674)
-
-
0.106
(0.073)
0.003
0.029
(1.609)
CAPCO
(0.386)
(0.122)
0.020
-
-
0.112
0.001
(0.375)
Total
2.659
(0.122)
0.020
0.147
(0.073)
1.232
0.764
4.627
Adjusted EBITDA Reconciliation
Adjusted EBITDA Reconciliation from Pretax Income (Loss)
For the three months ended September 30, 2012
In millions of dollars
*Note: totals may not add due to rounding
37 |
 Pretax
Income
(Loss)
Income
from Tax
Credits
Net
Change
in
Fair
Value
of
Credits
in
Lieu
of
Cash
and
Notes
Payable
in
Credits
in
Lieu
of
Cash
Deferred
Comp
Expense
Amortization of
2011 Lease
restructuring
charge
Interest
Expense
Depreciation
and
amortization
Adjusted
EBITDA
for
the nine
months ended
September 30,
2013
Electronic Payment
Processing
6.179
-
-
0.009
-
-
0.289
6.477
Small Business Finance
5.932
-
-
0.077
-
3.927
0.896
10.832
Managed Technology
Solutions
2.818
-
-
0.036
-
0.074
0.989
3.917
All Other
(1.213)
-
-
0.025
-
-
0.151
(1.037)
Corporate Activities
(5.722)
-
-
0.418
(0.218)
0.019
0.124
(5.379)
CAPCO
(0.958)
(0.086)
(0.026)
-
-
0.143
0.007
(0.920)
Total
7.036
(0.086)
(0.026)
0.565
(0.218)
4.163
2.456
13.890
Adjusted EBITDA Reconciliation
Adjusted EBITDA Reconciliation from Pretax Income (Loss)
For the nine months ended September 30, 2013
In millions of dollars
*Note: totals may not add due to rounding
38
www.thesba.com |
 www.thesba.com
Pretax
Income
(Loss)
Income
from Tax
Credits
Net Change
in Fair Value
of Credits in
Lieu of Cash
and Notes
Payable in
Credits in
Lieu of Cash
Deferred
Comp
Expense
Amortization of
2011 Lease
restructuring
charge
Interest
Expense
Depreciation
and
amortization
Adjusted
EBITDA for
the nine
months ended
September 30,
2012
Electronic Payment
Processing
5.256
-
-
0.028
-
-
0.581
5.865
Small Business Finance
4.928
-
-
0.044
-
2.644
0.664
8.280
Managed Technology
Solutions
3.388
-
-
0.024
-
0.062
0.919
4.393
All Other
(0.738)
-
-
0.025
-
-
0.022
(0.691)
Corporate Activities
(5.403)
-
-
0.286
(0.218)
0.007
0.083
(5.245)
CAPCO
(1.193)
(0.442)
(0.021)
-
-
0.493
0.006
(1.157)
Total
6.238
(0.442)
(0.021)
0.407
(0.218)
3.206
2.275
11.445
Adjusted EBITDA Reconciliation
Adjusted EBITDA Reconciliation from Pretax Income (Loss)
For the nine months ended September 30, 2012
In millions of dollars
*Note: totals may not add due to rounding
39 |