Attached files
| file | filename |
|---|---|
| 8-K - 8-K - CyrusOne Inc. | a3rdqtrer8-k.htm |
| EX-99.1 - EXHIBIT 99.1 - CyrusOne Inc. | exhibit991-earningsrelease.htm |
13 29 93 204 223 234 255 153 0 0 116 173 20 157 197 231 240 245 104 203 241 238 235 236 0 116 173 www.cyrusone.com Third Quarter 2013 Financial Results November 6, 2013

13 29 93 204 223 234 255 153 0 0 116 173 20 157 197 231 240 245 104 203 241 238 235 236 0 116 173 www.cyrusone.com Safe Harbor 2 This presentation contains forward-looking statements regarding future events and our future results that are subject to the “safe harbor” provisions of the Private Securities Litigation Reform Act of 1995. All statements, other than statements of historical facts, are statements that could be deemed forward-looking statements. These statements are based on current expectations, estimates, forecasts, and projections about the industries in which we operate and the beliefs and assumptions of our management. Words such as “expects,” “anticipates,” “predicts,” “projects,” “intends,” “plans,” “believes,” “seeks,” “estimates,” “continues,” “endeavors,” “strives,” “may,” variations of such words and similar expressions are intended to identify such forward-looking statements. In addition, any statements that refer to projections of our future financial performance, our anticipated growth and trends in our businesses, and other characterizations of future events or circumstances are forward-looking statements. Readers are cautioned these forward-looking statements are based on current expectations and assumptions that are subject to risks and uncertainties, which could cause our actual results to differ materially and adversely from those reflected in the forward-looking statements. Factors that could cause or contribute to such differences include, but are not limited to, those discussed in this release and those discussed in other documents we file with the Securities and Exchange Commission (SEC). More information on potential risks and uncertainties is available in our recent filings with the SEC, including CyrusOne’s Form 10-K and Form 8-Ks. Actual results may differ materially and adversely from those expressed in any forward-looking statements. We undertake no obligation to revise or update any forward-looking statements for any reason.

13 29 93 204 223 234 255 153 0 0 116 173 20 157 197 231 240 245 104 203 241 238 235 236 0 116 173 www.cyrusone.com Highlights Record leasing of 62,000 CSF(1), a 68% increase from the prior quarter and over 500% of the square footage leased in the third quarter of 2012 Revenue of $67.5 million increased 19% over the third quarter of 2012. Normalized FFO and AFFO increased 44% and 46%, respectively, over the third quarter of 2012. Adjusted EBITDA increase of 21% over the third quarter of 2012 Revenue and Adjusted EBITDA increased 6% and 19%, respectively, over prior quarter. Sequential Normalized FFO and AFFO growth of 37% and 30% Completely leased the San Antonio data center one year ahead of schedule, leased over 60% of the Phoenix data center, and pre-leased over 25% of the second data hall in the Carrollton facility Launched CyrusOne Market Place and CyrusOne Express in early October, an innovative online tool and product line, that provide simple and efficient data center solutions for small and medium sized businesses Added six Fortune 1000 companies(2), bringing total Fortune 1000 customers to 128 Third Quarter 2013 Note: 1. Colocation square feet (CSF) represents NRSF currently leased or available for lease as colocation space, where customers locate their servers and other IT equipment. Net rentable square feet (NRSF) represents the total square feet of a building currently leased or available for lease, based on engineers’ drawings and estimates but does not include space held for development or space used by CyrusOne. 2. Customer’s ultimate parent is a Fortune 1000 company or a foreign or private company of equivalent size. 3
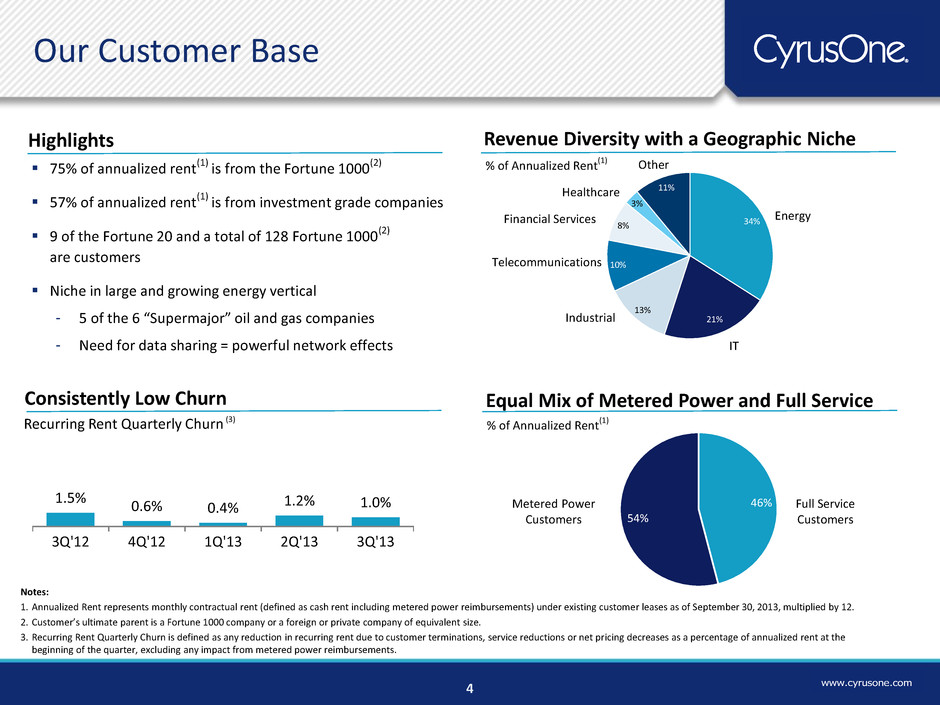
13 29 93 204 223 234 255 153 0 0 116 173 20 157 197 231 240 245 104 203 241 238 235 236 0 116 173 www.cyrusone.com 34% 21% 13% 10% 8% 3% 11% 46% 54% 75% of annualized rent(1) is from the Fortune 1000(2) 57% of annualized rent(1) is from investment grade companies 9 of the Fortune 20 and a total of 128 Fortune 1000(2) are customers Niche in large and growing energy vertical - 5 of the 6 “Supermajor” oil and gas companies - Need for data sharing = powerful network effects Notes: 1. Annualized Rent represents monthly contractual rent (defined as cash rent including metered power reimbursements) under existing customer leases as of September 30, 2013, multiplied by 12. 2. Customer’s ultimate parent is a Fortune 1000 company or a foreign or private company of equivalent size. 3. Recurring Rent Quarterly Churn is defined as any reduction in recurring rent due to customer terminations, service reductions or net pricing decreases as a percentage of annualized rent at the beginning of the quarter, excluding any impact from metered power reimbursements. Revenue Diversity with a Geographic Niche Energy Other Telecommunications Financial Services Healthcare IT Our Customer Base Full Service Customers Metered Power Customers % of Annualized Rent (1) Equal Mix of Metered Power and Full Service % of Annualized Rent (1) 1.5% 0.6% 0.4% 1.2% 1.0% 3Q'12 4Q'12 1Q'13 2Q'13 3Q'13 Consistently Low Churn Recurring Rent Quarterly Churn (3) 4 Industrial Highlights

13 29 93 204 223 234 255 153 0 0 116 173 20 157 197 231 240 245 104 203 241 238 235 236 0 116 173 www.cyrusone.com 514 526 554 573 598 Q3 2012 Q4 2012 Q1 2013 Q2 2013 Q3 2013 460 480 500 520 540 560 580 600 620 108 115 119 122 128 95 100 105 110 115 120 125 130 135 140 Q3 2012 Q4 2012 Q1 2013 Q2 2013 Q3 2013 Total Customers Fortune 1000 Customers 5 Sales Plan Execution … becoming the preferred provider to the Fortune 1000

13 29 93 204 223 234 255 153 0 0 116 173 20 157 197 231 240 245 104 203 241 238 235 236 0 116 173 www.cyrusone.com National IX CyrusOne Market Place CyrusOne Express Description: CyrusOne National IX creates a virtual data center platform that mirrors the data center architecture deployed by most Fortune 1000 companies Approximately 75% of the new leases this quarter included IX services, up from 68% last quarter IX products increased average monthly rent for these customers by 29% Strategic Benefits: Creates a more valuable platform Increases revenue per foot and thus returns Accelerates revenue growth through expansion of different industry verticals Not Retail vs. Wholesale …It is about product innovation and solution creation 6 Description: Launched in early October, an innovative online tool that provides simple data center solutions for small and medium-sized businesses (SMB) The online tool simplifies doing business by enabling small and medium-sized businesses to quickly and efficiently identify and secure available data center space Strategic Benefits: Highlights company’s innovation platform Enables the “Easy” button for customers Further increases customer touches Description: Offered through online Market Place Addresses a large and growing SMB market that is currently served by the "Do-It-Yourself" IT guy who stands up a rack in his office Simple month-to-month agreements lower outsourcing barriers and enable firms to better focus scarce resources on growing their core business, rather than managing their IT footprint Strategic Benefits: Effectively targets large DIY market No long-term contract policy ensures CyrusOne will earn customers’ business every day Optimizes yield, by selling available nooks and crannies in data centers

13 29 93 204 223 234 255 153 0 0 116 173 20 157 197 231 240 245 104 203 241 238 235 236 0 116 173 www.cyrusone.com Return Profile …Benefits of Massively ModularTM Spotlight: San Antonio 7 Notes 1. Development Yield is calculated by dividing annualized Net Operating Income (NOI) by total investment in real estate, less construction in progress Fully leased in one year, one year ahead of plan and validated local market demand Facility was delivered at higher cost per MW than our target cost due to the smaller footprint in this new market Facility leased at a lower than typical average price as a result of a large anchor tenant Estimated development yield of 15% Development yield of 17% includes development properties that are not yet stabilized Development yield is lower than historical levels due to significant recent expansions The yield for development properties is projected to improve over time as high fixed costs are allocated across incremental leasing Overall Development Yield 16% Development Yield(1) 17% Investment in Real Estate, less CIP $951 $156 $174 2Q'13 3Q'13 Annualized NOI $994 ($ in millions)
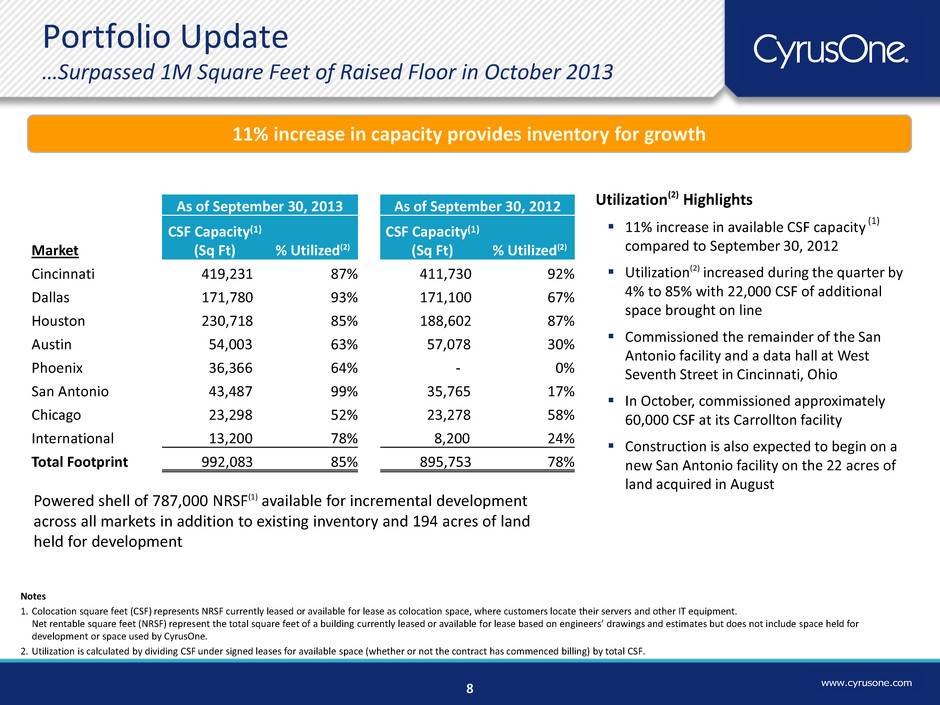
13 29 93 204 223 234 255 153 0 0 116 173 20 157 197 231 240 245 104 203 241 238 235 236 0 116 173 www.cyrusone.com Portfolio Update …Surpassed 1M Square Feet of Raised Floor in October 2013 11% increase in capacity provides inventory for growth Powered shell of 787,000 NRSF(1) available for incremental development across all markets in addition to existing inventory and 194 acres of land held for development 8 (1) (1) Notes 1. Colocation square feet (CSF) represents NRSF currently leased or available for lease as colocation space, where customers locate their servers and other IT equipment. Net rentable square feet (NRSF) represent the total square feet of a building currently leased or available for lease based on engineers’ drawings and estimates but does not include space held for development or space used by CyrusOne. 2. Utilization is calculated by dividing CSF under signed leases for available space (whether or not the contract has commenced billing) by total CSF. As of September 30, 2013 As of September 30, 2012 Market CSF Capacity(1) (Sq Ft) % Utilized(2) CSF Capacity(1) (Sq Ft) % Utilized(2) Cincinnati 419,231 87% 411,730 92% Dallas 171,780 93% 171,100 67% Houston 230,718 85% 188,602 87% Austin 54,003 63% 57,078 30% Phoenix 36,366 64% - 0% San Antonio 43,487 99% 35,765 17% Chicago 23,298 52% 23,278 58% International 13,200 78% 8,200 24% Total Footprint 992,083 85% 895,753 78% Utilization(2) Highlights 11% increase in available CSF capacity (1) compared to September 30, 2012 Utilization(2) increased during the quarter by 4% to 85% with 22,000 CSF of additional space brought on line Commissioned the remainder of the San Antonio facility and a data hall at West Seventh Street in Cincinnati, Ohio In October, commissioned approximately 60,000 CSF at its Carrollton facility Construction is also expected to begin on a new San Antonio facility on the 22 acres of land acquired in August

13 29 93 204 223 234 255 153 0 0 116 173 20 157 197 231 240 245 104 203 241 238 235 236 0 116 173 www.cyrusone.com Third Quarter Review

13 29 93 204 223 234 255 153 0 0 116 173 20 157 197 231 240 245 104 203 241 238 235 236 0 116 173 www.cyrusone.com $56.7 $67.5 3Q'12 3Q'13 Revenue Third Quarter ($ in millions) 10 1.5% 0.6% 0.4% 1.2% 1.0% 3Q'12 4Q'12 1Q'13 2Q'13 3Q'13 Consistently Low Churn Recurring Rent Quarterly Churn (1) Notes: 1. Recurring Rent Quarterly Churn is defined as any reduction in recurring rent due to customer terminations, service reductions or net pricing decreases as a percentage of annualized rent at the beginning of the quarter, excluding any impact from metered power reimbursements. 2. Annualized Rent represents monthly contractual rent (defined as cash rent including metered power reimbursements) under existing customer leases as of September 30, 2013, multiplied by 12. 3. Colocation square feet (CSF) represents NRSF currently leased or available for lease as colocation space, where customers locate their servers and other IT equipment. Net rentable square feet (NRSF) represent the total square feet of a building currently leased or available for lease based on engineers’ drawings and estimates but does not include space held for development or space used by CyrusOne. Leased 62,000 CSF(3) in the quarter as compared to 11,000 CSF(3) in Q3 2012 More than 500% of the square footage leased in Q3 2012 86% of the CSF(3) was leased to metered power customers with a weighted average lease term of 57 months Renewed 8,550 CSF and 2.9MW in Q3 2013 94% of renewals have escalators at a weighted average rate of 2.95% Revenue growth of 19% driven by Expansion of customer base to 598, an increase of 84 from Q3 2012 Annualized rent(2) increased 22% from Q3 2012 Existing customers drove 46% of rent growth

13 29 93 204 223 234 255 153 0 0 116 173 20 157 197 231 240 245 104 203 241 238 235 236 0 116 173 www.cyrusone.com Revenue growth over prior year of 19% NOI of $43.3M, up 18% over prior year, with a slight 1% decline in margin Adjusted EBITDA of $36.5M, 21% increase over prior year, with a slight 1% margin improvement 44% increase in Normalized FFO primarily due to growth in Adj EBITDA with lower interest expense 11 $ in millions Q3 2013 Q3 2012 $ % Revenue 67.5$ 56.7$ 10.8$ 19% Property operating expenses 24.2 20.0 (4.2) -21% Net Operating Income (NOI) 43.3 36.7 6.6 18% NOI Margin 64% 65% Sales and Marketing 2.3 2.1 (0.2) -10% General and Administrative (1) 6.5 6.2 (0.3) -5% Less: Non-cash Compensation (2.0) (1.7) 0.3 18% Adjusted EBITDA 36.5$ 30.1$ 6.4$ 21% Adjusted EBITDA Margin 54% 53% Normalized FFO(2) 21.9$ 15.2$ 6.7$ 44% AFFO 19.3$ 13.2$ 6.1$ 46% Three Months Ended Fav/(Unfav) Year over Year P&L Analysis Notes: 1. 2012 presentation includes Management fees charged by Cincinnati Bell; no fees were charged in 2013. Legal claim costs of $0.7 million are omitted from this presentation as they are excluded from Adjusted EBITDA 2. Definition of Normalized FFO revised to exclude restructuring charges and legal claim costs in Q3 2013 ($ in millions)

13 29 93 204 223 234 255 153 0 0 116 173 20 157 197 231 240 245 104 203 241 238 235 236 0 116 173 www.cyrusone.com Essentially flat property operating expenses due to lower maintenance and facilities expenses partially offset by higher electricity costs Fewer sponsorship and marketing events reduced S&M expenses while lower legal and consulting expenses reduced G&A Normalized FFO and AFFO increased significantly on higher Adj EBITDA with lower interest expense 12 $ in millions Q3 2013 Q2 2013 $ % Revenue 67.5$ 63.6$ 3.9$ 6% Property operating expenses 24.2 24.6 0.4 2% Net Operating Income (NOI) 43.3 39.0 4.3 11% NOI Margin 64% 61% Sales and Marketing 2.3 2.9 0.6 21% General and Administrative (1) 6.5 7.1 0.6 8% Less: Non-cash Compensation (2.0) (1.8) 0.2 11% Adjusted EBITDA 36.5$ 30.8$ 5.7$ 19% Adjusted EBITDA Margin 54% 48% Normalized FFO(2) 21.9$ 16.0$ 5.9$ 37% AFFO 19.3$ 14.8$ 4.5$ 30% Three Months Ended Fav/(Unfav) Sequential P&L Analysis Notes: 1. 2012 presentation includes Management fees charged by Cincinnati Bell; no fees were charged in 2013. Legal claim costs of $0.7 million are omitted from this presentation as they are excluded from Adjusted EBITDA 2. Definition of Normalized FFO revised to exclude restructuring charges and legal claim costs in Q3 2013 ($ in millions)

13 29 93 204 223 234 255 153 0 0 116 173 20 157 197 231 240 245 104 203 241 238 235 236 0 116 173 www.cyrusone.com Capital Expenditures (87%) (88%) (88%) (78%) (2) Third Quarter ($ in millions) $41.6 $64.3 3Q'12 3Q'13 3% Recurring Capex 13 Highlights 2% NRSF(1) as of Q3 2013 = 1,897,967 NRSF(1) as of Q3 2012 = 1,628,717 October 2013 Update Notes: 1. Net rentable square feet (NRSF) represent the total square feet of a building currently leased or available for lease based on engineers’ drawings and estimates but does not include space held for development or space used by CyrusOne. 2. Colocation square feet (CSF) represents NRSF currently leased or available for lease as colocation space, where customers locate their servers and other IT equipment. Purchased 22 acres of land in San Antonio for $6.7 million Commissioned and leased the remainder of the San Antonio facility Constructed an additional data hall at West Seventh Street in Cincinnati Completed construction and power for the first phase of Houston West 2 facility Commissioned approximately 60,000 CSF (2) at the Carrollton facility, of which more than 25% was pre-leased

13 29 93 204 223 234 255 153 0 0 116 173 20 157 197 231 240 245 104 203 241 238 235 236 0 116 173 www.cyrusone.com 11 September 30, 2013 6.375% Senior Unsecured Notes due 2022 $525.0 Capital lease obligations 18.8 Less: Cash and cash equivalents (213.2) Net debt $330.6 Liquidity $438.2 14 ($ in millions) Notes: 1. Calculated as net debt as of September 30, 2013 divided by Adjusted EBITDA for the last quarter annualized. $ in millions (except for Market Prices) Shares or Equivalents Outstanding Market Price as of September 30, 2013 Market Value Equivalents Common Shares 22.1 $19.00 $420.2 Operating Partnership Units 42.6 19.00 809.1 Total Equity Value $1,229.3 Net Debt 330.6 Total Enterprise Value (TEV) $1,559.9 Net leverage of 2.3x (1) CyrusOne Inc. paid a dividend of $0.16 per share and share equivalent on October 15, 2013 Net Debt and Market Capitalization
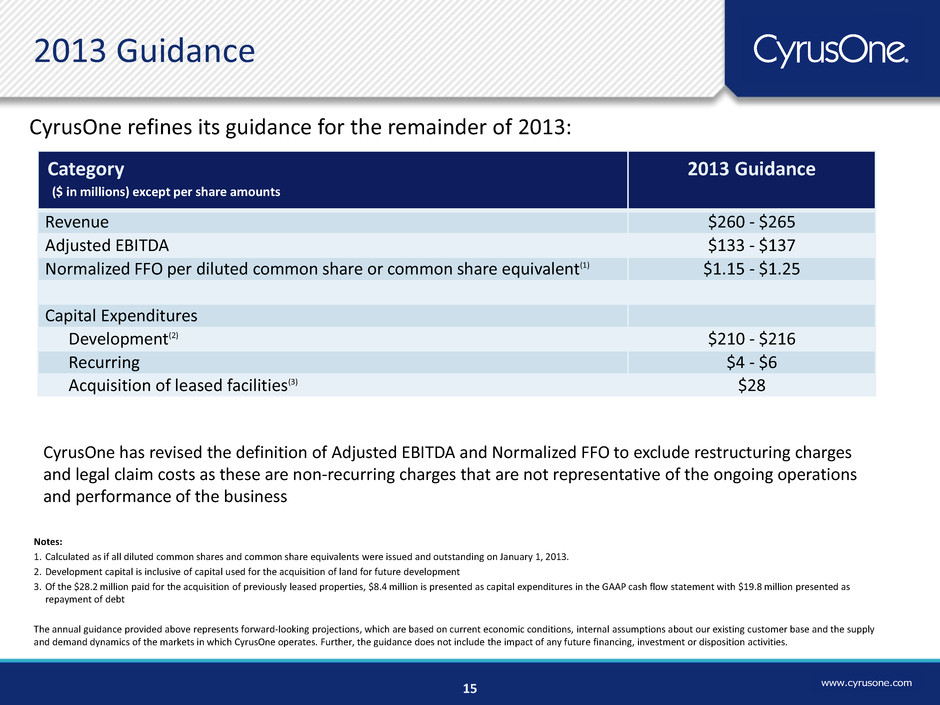
13 29 93 204 223 234 255 153 0 0 116 173 20 157 197 231 240 245 104 203 241 238 235 236 0 116 173 www.cyrusone.com 2013 Guidance Category 2013 Guidance Revenue $260 - $265 Adjusted EBITDA $133 - $137 Normalized FFO per diluted common share or common share equivalent(1) $1.15 - $1.25 Capital Expenditures Development(2) $210 - $216 Recurring $4 - $6 Acquisition of leased facilities(3) $28 15 CyrusOne refines its guidance for the remainder of 2013: ($ in millions) except per share amounts Notes: 1. Calculated as if all diluted common shares and common share equivalents were issued and outstanding on January 1, 2013. 2. Development capital is inclusive of capital used for the acquisition of land for future development 3. Of the $28.2 million paid for the acquisition of previously leased properties, $8.4 million is presented as capital expenditures in the GAAP cash flow statement with $19.8 million presented as repayment of debt The annual guidance provided above represents forward-looking projections, which are based on current economic conditions, internal assumptions about our existing customer base and the supply and demand dynamics of the markets in which CyrusOne operates. Further, the guidance does not include the impact of any future financing, investment or disposition activities. CyrusOne has revised the definition of Adjusted EBITDA and Normalized FFO to exclude restructuring charges and legal claim costs as these are non-recurring charges that are not representative of the ongoing operations and performance of the business

13 29 93 204 223 234 255 153 0 0 116 173 20 157 197 231 240 245 104 203 241 238 235 236 0 116 173 www.cyrusone.com . . See Earnings Release Supplement at www.cyrusone.com for reconciliations of Non-GAAP financial measures
13 29 93 204 223 234 255 153 0 0 116 173 20 157 197 231 240 245 104 203 241 238 235 236 0 116 173 www.cyrusone.com
