Attached files
| file | filename |
|---|---|
| 8-K - THE BANCORP, INC. FORM 8-K - Bancorp, Inc. | bancorp8k.htm |

Investor Presentation
Third Quarter, 2013
Third Quarter, 2013
NASDAQ: TBBK

Forward Looking
Statements
Statements
Safe Harbor Statement under the Private Securities Litigation Reform Act of 1995:
Statements in this presentation regarding The Bancorp, Inc.’s business that are not historical facts are “forward-looking statements”
that involve risks and uncertainties. These statements may be identified by the use of forward-looking terminology, including the
words “may,” “believe,” “will,” “expect,” “anticipate,” “estimate,” “continue,” or similar words.
For further discussion of these risks and uncertainties, see The Bancorp, Inc.’s filings with the SEC, including the “risk factors” section
of The Bancorp, Inc.’s Form 10-K. These risks and uncertainties could cause actual results to differ materially from those projected in
the forward-looking statements. The forward-looking statements speak only as of the
date of this presentation. The Bancorp, Inc. does not undertake to publicly revise or update forward-looking statements in this
presentation to reflect events or circumstances that arise after the date of this presentation, except as may be required under
applicable law.
1

The Bancorp, Inc.
Planning for Growth with
Safety and Soundness
• Strategic Goal:
– Create and grow a stable, profitable institution with the optimum reliance on capital, risk
management and technology, and manage it with knowledgeable and experienced management
and senior officers
management and technology, and manage it with knowledgeable and experienced management
and senior officers
• Tactical Approach:
– Deposits - Utilize a branchless banking network to gather scalable deposits through strong
contractual relationships at costs significantly below peers
contractual relationships at costs significantly below peers
– Assets - Focus on asset classes including loans and securities appropriate to our expertise to
achieve returns above risk-adjusted peer net interest margins
achieve returns above risk-adjusted peer net interest margins
– Non-Interest Income - Grow non-interest income disproportionately in relation to non-interest
expense through our deposit and asset approaches
expense through our deposit and asset approaches
– Operating Leverage - Leverage infrastructure investment to grow earnings by creating efficiencies
of scale
of scale
2

The Bancorp, Inc.
Planning for Growth
Planning for Growth
Sources: Federal Reserve, FRB Boston, FRB Philadelphia, SRI Consulting, University of Michigan, Mintel, Celent,
Bank of America, comScore, Nielsen Mobile, Wall Street Journal, AlixPartners
Bank of America, comScore, Nielsen Mobile, Wall Street Journal, AlixPartners
3
4
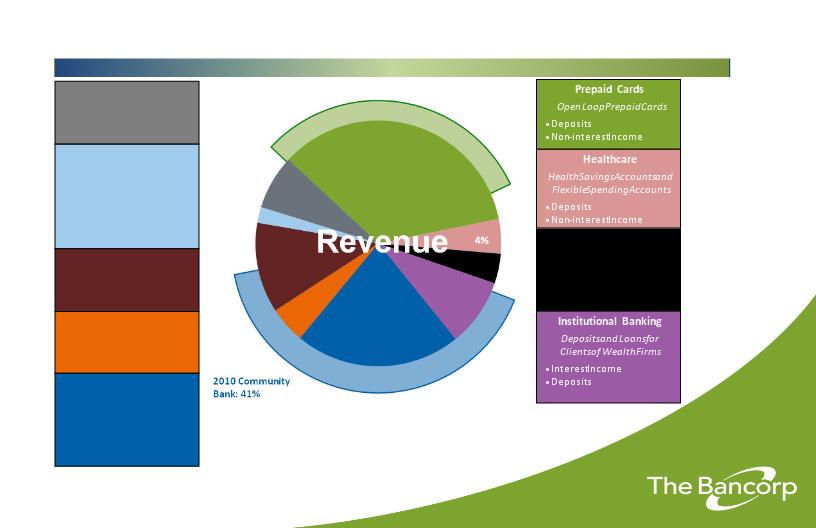
Business Model: A Distinct Business Strategy (1)
Assets Deposits
Securities Portfolio
Primarily highly rated
government obligations
government obligations
•Interest Income
Government Guaranteed
Lending (GGL)
Lending (GGL)
Includes loans to
franchisees;
75% guaranteed by
U.S. government
franchisees;
75% guaranteed by
U.S. government
•Interest Income
Commercial Mortgage
Backed Securities (CMBS)
Backed Securities (CMBS)
Commercial Loan Sales
• Non- Interest Income
Automobile Fleet Leasing
•Interest Income
•Non-interest Income
Community Bank
Traditional Community
Banking Products
Banking Products
•Interest Income
•Deposits
•Non-interest Income
•Non-interest Income
Payment Acceptance
Credit, Debit Card, and
ACH Processing
ACH Processing
•Deposits
•Non-interest Income
35%
4%
9%
5%
22%
2%
7%
2010 Prepaid
Cards: 31%
12%
(1) For the above presentation, revenue for asset-generating departments includes
all revenue from the assets they fund with deposits they generate. It also
includes half the revenue on assets they generate but do not fund. The other half
of that revenue is allocated to deposit-producing departments. The revenue
shown was generated in the third quarter of 2013 with the exception of
segments marked 2010, which represent the third quarter
of that year.
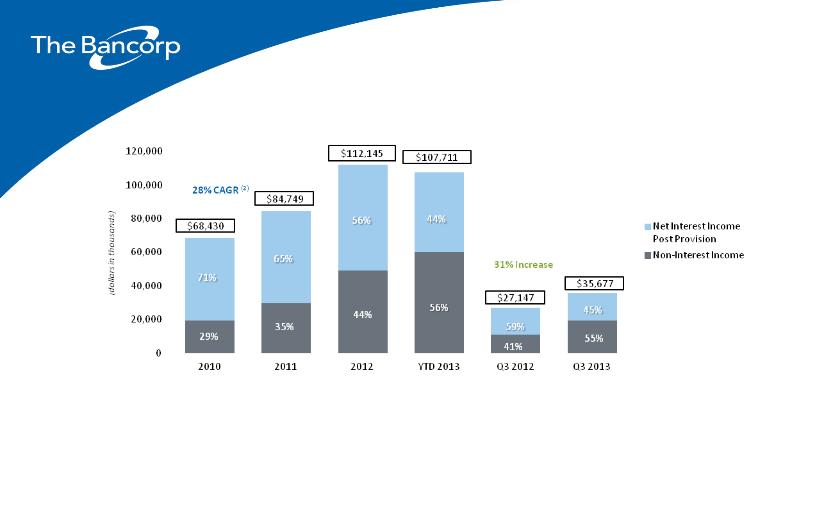
Revenue Composition
Post Provision Income (1)
(1) Post provision income is calculated as follows: net interest income less provision for loan and lease losses plus non-interest income
excluding gains on sales of investment securities and other than temporary impairment on securities. For reconciliation detail, please see
Appendix
excluding gains on sales of investment securities and other than temporary impairment on securities. For reconciliation detail, please see
Appendix
(2) Compound annual growth rate is calculated for the years 2010 through 2012
$
5
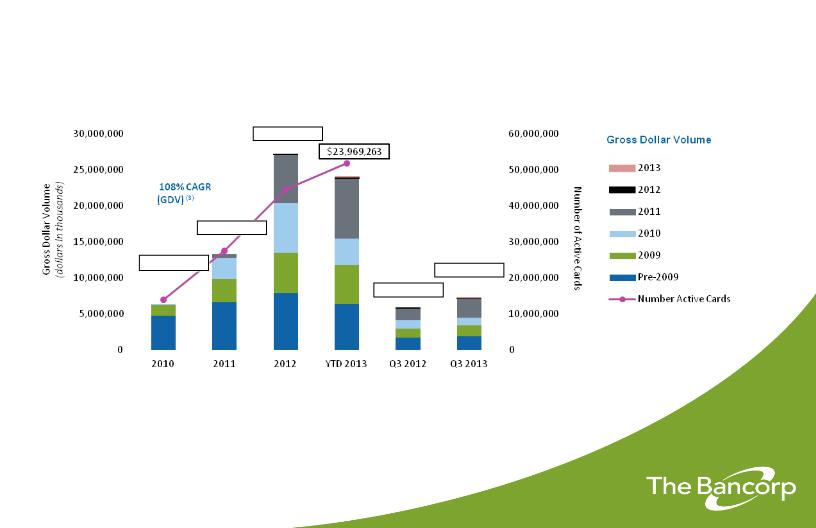
Prepaid Gross Dollar Volume (GDV) (1) and
Cardholder Growth (2)
Cardholder Growth (2)
(1) Gross Dollar Volume (GDV) is the total amount spent on all cards outstanding within a given period. The bar graph represents the gross
dollar volume for the period segmented by the program contract date
dollar volume for the period segmented by the program contract date
(2) Number of active cards as of year-end 2010 through 2012 and quarter-end for the third quarter of 2013
(3) Compound annual growth rate is calculated for the years 2010 through 2012
$
$6,285,311
$13,311,202
$27,138,802
$5,811,942
$7,178,533
6
24% Increase
(GDV)

Non-Interest Income-Generating
Strategies: Growth and Sustainability
(1) Compound annual growth rate is calculated for the years 2010 through 2012
(2) Not meaningful
(3) Excludes gains on investment securities
76% Increase
$
(2)
7
(3)

Scalable Business Model:
(1) Excludes gains on investment securities and nonrecurring expenses; 2011 includes a one-time
gain of $718,000 related to a legal settlement
gain of $718,000 related to a legal settlement
(2) Compound annual growth rate is calculated for the years 2010 through 2012
8

Compressed Interest Rate Environment:
Net Interest Income Generators
(1)Compound annual growth rate is calculated for the years 2010 through 2012
(2)Other is comprised of net interest income produced by the following areas: Investment Securities, Automobile Fleet Leasing, Government Guaranteed
Lending and Institutional Banking.
Lending and Institutional Banking.
9
$

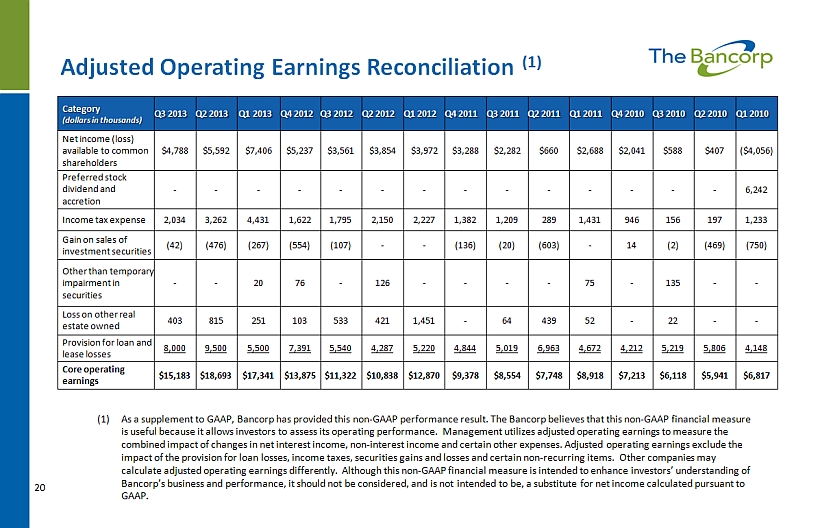
Operating Leverage:
Adjusted Operating Earnings (1)
(1) For reconciliation and other details, please see Appendix
(2) Compound annual growth rate is calculated for the third quarters of 2010 through 2013
$
10

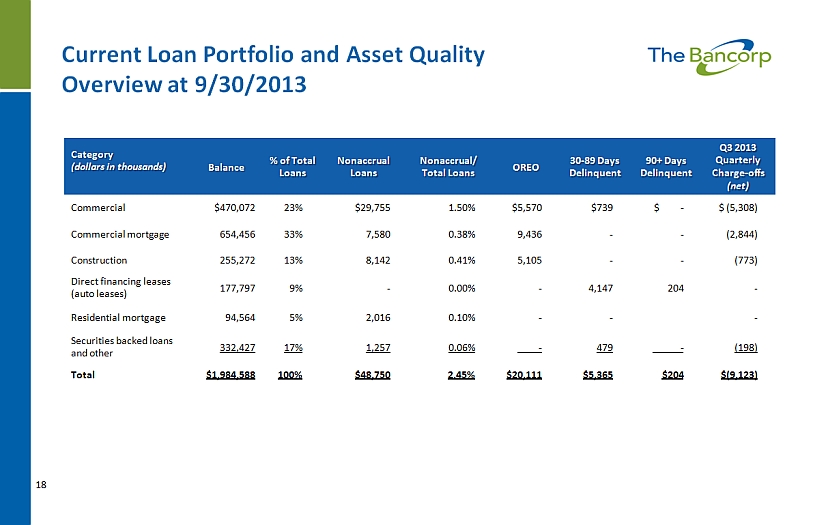
Primary Asset-Generating Strategies:
Business Line Overview
As with funding, The Bancorp employs a multi-channel growth strategy for loan origination, with the primary
driver being its regional commercial banking operations.
driver being its regional commercial banking operations.
• Community Bank
– Offers traditional community banking products and services targeting
the highly fragmented Philadelphia/Wilmington
banking market
the highly fragmented Philadelphia/Wilmington
banking market
• Automobile Fleet Leasing
– Well-collateralized automobile fleet leasing
• Average transaction: 8-15 automobiles, $350,000
• 41% of portfolio leased by local, state, and federal government
agencies
agencies
• Institutional Banking
– 15 affinity groups, managing & administering $1.8 trillion in assets
• SEI Investments, Legg Mason, Genworth Financial Trust Company,
Franklin Templeton
Franklin Templeton
– Generates securities backed and other loans
• Government Guaranteed Lending
– Loans from $150,000 to $5.0 million including loans to franchisees
such as UPS Stores, Massage Envy, FASTSIGNS and Save a Lot, many of
which have a 75% guaranty by the U.S. Small Business Administration
such as UPS Stores, Massage Envy, FASTSIGNS and Save a Lot, many of
which have a 75% guaranty by the U.S. Small Business Administration
– Approved Franchise and Medical Guidance lines of over $400 million
• Securities
– Primarily:
• High credit quality tax exempt municipal obligations
• U.S. Government agency securities primarily 2-4 year average lives
and other highly rated mortgage-backed securities
and other highly rated mortgage-backed securities
• Corporate securities which, like other purchases, are validated and
monitored by independent credit advisory specialists
monitored by independent credit advisory specialists
|
Category
|
Q3 2013 Balance
|
Q3 2012 Balance
|
Q3 2013 Avg. Yield
|
|
|
(in thousands)
|
|
|
|
Community Bank
|
$1,403,113
|
$1,406,661
|
3.90%
|
|
Government
Guaranteed Lending |
120,217
|
69,735
|
4.77%
|
|
Institutional Banking
|
290,327
|
233,868
|
2.73%
|
|
Automobile Fleet
Leasing |
177,798
|
146,728
|
6.65%
|
|
Investment Securities
|
1,180,613
|
657,601
|
2.15%
|
11

Asset Quality Overview
(1) Texas Ratio = (Non-accrual Loans + Restructured Loans + Loans 90 + days past due + OREO)/(Loss Reserves + Tangible Equity).
TBBK computed with consolidated capital. Sources: SNL Financial; FDIC Call Reports
TBBK computed with consolidated capital. Sources: SNL Financial; FDIC Call Reports
12

Primary Deposit-Generating Strategies:
Business Line Overview
Business Line Overview
|
Total Deposits: $3.6 billion
|
|
Average Cost: 0.25%
|
|
(Aggregate US Banks Average Cost: 0.43%) (1)
|
(1) Aggregate US Banks data as of June 2013
|
(in millions)
|
||
|
Community Bank
|
$ 346,954
|
0.24%
|
|
Healthcare
|
387,723
|
0.58%
|
|
Prepaid Cards
|
1,283,919
|
0.02%
|
|
Institutional Banking
|
960,707
|
0.42%
|
|
Payment Acceptance
|
313,799
|
0.68%
|
|
1031 Exchange
|
276,565
|
0.23%
|
13

Deposit-Generating Strategies:
Sticky and Long-Term
The Bancorp has long-term, often exclusive agreements in place with its private label banking partners.
14
(1) Percentages shown reflect data as of the end of the third quarter of 2013
(2) Contracts associated with 99% of deposits in this segment are structured
with an automatic renewal
with an automatic renewal
(2)

The Bancorp, Inc.
Planning for Growth with
Safety and Soundness
• Strategic Goal:
– Create and grow a stable, profitable institution with the optimum reliance on capital, risk
management and technology, and manage it with knowledgeable and experienced management
and senior officers
management and technology, and manage it with knowledgeable and experienced management
and senior officers
• Tactical Approach:
– Deposits - Utilize a branchless banking network to gather scalable deposits through strong
contractual relationships at costs significantly below peers
contractual relationships at costs significantly below peers
– Assets - Focus on asset classes including loans and securities appropriate to our expertise to
achieve returns above risk-adjusted peer net interest margins
achieve returns above risk-adjusted peer net interest margins
– Non-Interest Income - Grow non-interest income disproportionately in relation to non-interest
expense through our deposit and asset approaches
expense through our deposit and asset approaches
– Operating Leverage - Leverage infrastructure investment to grow earnings by creating efficiencies
of scale
of scale
15

Appendix
NASDAQ: TBBK

Capital Ratios and Selected Financial Data
|
|
|
As of or for the three months ended
|
As of or for the three months ended
|
|
|
|
September 30, 2013
|
September 30, 2012
|
|
|
|
(dollars in thousands)
|
(dollars in thousands)
|
|
Selected Capital and Asset Quality Ratios:
|
|
|
|
|
|
Equity/assets
|
8.83%
|
9.28%
|
|
|
Tier 1 capital to average assets
|
8.91%
|
9.20%
|
|
|
Tier 1 capital to total risk-weighted assets
|
14.54%
|
14.51%
|
|
|
Total capital to total risk-weighted assets
|
15.79%
|
15.77%
|
|
|
Allowance for loan and lease losses to total loans
|
1.97%
|
1.78%
|
|
|
Tangible common equity
|
8.69%
|
9.07%
|
|
|
|||
|
Balance Sheet Data:
|
|
|
|
|
|
Total assets
|
$ 4,000,282
|
$ 3,113,125
|
|
|
Total loans, net of unearned costs (fees)
|
1,991,455
|
1,856,992
|
|
|
Allowance for loan and lease losses
|
39,151
|
33,071
|
|
|
Total cash and cash equivalents
|
730,455
|
544,658
|
|
|
Total investments
|
1,180,613
|
657,601
|
|
|
Deposits
|
3,569,217
|
2,781,175
|
|
|
Shareholders’ equity
|
353,333
|
288,985
|
|
|
|||
|
Selected Ratios:
|
|
|
|
|
|
Return on average assets
|
0.48%
|
0.46%
|
|
|
Return on average common equity
|
5.52%
|
4.97%
|
|
|
Net interest margin
|
2.53%
|
2.90%
|
|
|
Book value per share
|
$ 9.39
|
$ 8.73
|
17

Post Provision Income Reconciliation
|
Category
(dollars in millions)
|
2010
|
2011 (1)
|
2012
|
YTD 2013
|
Q3 2012
|
Q3 2013
|
|
Interest Income
|
$82.7
|
$88.4
|
$96.8
|
$78.4
|
$24.4
|
$26.8
|
|
Interest Expense
|
(14.5)
|
(12.0)
|
(11.4)
|
(8.0)
|
(2.8)
|
(2.7)
|
|
Net Interest Income
|
68.2
|
76.4
|
85.4
|
70.4
|
21.6
|
24.1
|
|
Provision for Loan and Lease Losses
|
(19.3)
|
(21.5)
|
(22.4)
|
(23.0)
|
(5.5)
|
(8.0)
|
|
Net Interest Income Post Provision
|
48.9
|
54.9
|
63
|
47.4
|
16.1
|
16.1
|
|
Non-Interest Income (2)
|
19.5
|
29.8
|
49.1
|
60.3
|
11.1
|
19.5
|
|
Post Provision Income
|
$68.4
|
$84.7
|
$112.1
|
$107.7
|
$27.2
|
$35.6
|
(1) 2011 includes a one-time gain of $718,000 related to a legal settlement
(2) Non-interest income excluding gains on sales on investment securities and other than temporary impairment on securities
19

www.thebancorp.com
NASDAQ: TBBK