Attached files
| file | filename |
|---|---|
| 8-K - 8-K - ARCH RESOURCES, INC. | a13-23622_18k.htm |
Exhibit 99.1
|
|
Arch Coal, Inc. Investor Presentation November 2013 |
|
|
Slide 2 Forward-Looking Information This presentation contains “forward-looking statements” – that is, statements related to future, not past, events. In this context, forward-looking statements often address our expected future business and financial performance, and often contain words such as “expects,” “anticipates,” “intends,” “plans,” “believes,” “seeks,” or “will.” Forward-looking statements by their nature address matters that are, to different degrees, uncertain. For us, particular uncertainties arise from changes in the demand for our coal by the domestic electric generation industry; from legislation and regulations relating to the Clean Air Act and other environmental initiatives; from operational, geological, permit, labor and weather-related factors; from fluctuations in the amount of cash we generate from operations; from future integration of acquired businesses; and from numerous other matters of national, regional and global scale, including those of a political, economic, business, competitive or regulatory nature. These uncertainties may cause our actual future results to be materially different than those expressed in our forward-looking statements. We do not undertake to update our forward-looking statements, whether as a result of new information, future events or otherwise, except as may be required by law. For a description of some of the risks and uncertainties that may affect our future results, you should see the risk factors described from time to time in the reports we file with the Securities and Exchange Commission. |
|
|
Arch is the most diversified U.S. coal producer, and the No. 2 reserve holder in the nation Slide 3 Powder River Basin 3,309 million tons of reserves 5+ Billion Ton Reserve Base Appalachia 1,047 430 Met/PCI million tons of reserves Bituminous Thermal 1,025 million tons of reserves Arch serves customers in 25 countries. Our power generation business serves 160 power plants in 37 states as well as coal power plants on three continents, while our international coking coal platform serves steel facilities around the world. |
|
|
Arch’s strong cost containment and process improvement initiatives are yielding results Demonstrating the success of process improvement initiatives Controlling consumable costs (i.e. diesel, explosives) Reducing contractor and overtime labor costs Decreasing parts and supplies expense as well as carrying costs of inventory Right-sizing operations Slide 4 Powder River Basin (cash costs per ton) $11.58 $10.43 $1.15 per ton reduction Appalachia (cash costs per ton) $70.23 $66.87 $3.36 per ton reduction |
|
|
Slide 5 Arch is reducing its capital expenditures in line with evolving coal market conditions Total Capital Expenditures (in millions) 2013 Projected Spending By Category (based on midpoint of 2013 guidance*) Maintenance *As given on 10/29/13, inclusive of land payments 45% reduction since 2011 Arch expects further reductions in capital expenditures in 2014 |
|
|
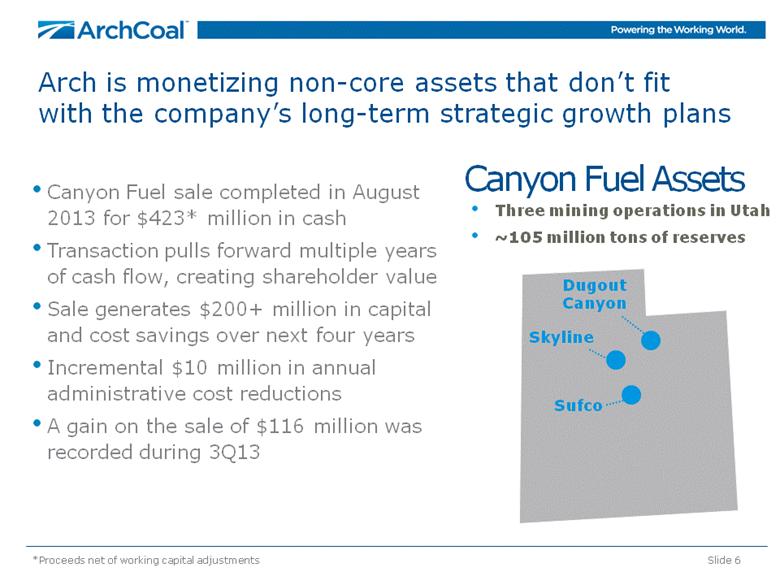
Arch is monetizing non-core assets that don’t fit with the company’s long-term strategic growth plans Canyon Fuel sale completed in August 2013 for $423* million in cash Transaction pulls forward multiple years of cash flow, creating shareholder value Sale generates $200+ million in capital and cost savings over next four years Incremental $10 million in annual administrative cost reductions A gain on the sale of $116 million was recorded during 3Q13 Slide 6 Canyon Fuel Assets Three mining operations in Utah ~105 million tons of reserves Dugout Canyon Skyline Sufco *Proceeds net of working capital adjustments |
|
|
Total Liquidity (in millions) Arch has a strong liquidity position, primarily in cash Slide 7 *2016 bonds are currently callable $ 691 Short-term debt Unsecured bonds Term loan Available borrowings Cash & investments Debt Maturity Profile (at 9/30/13, in millions) Arch’s current strategy favors holding cash versus historically maintaining higher borrowing capacity Roughly $1.4 billion in cash at September 30, 2013 No debt maturities until 2016 Relaxed financial maintenance covenants until late 2015 |
|
|
Arch is well-positioned to benefit as coal markets improve Arch’s diversified operations, competitive cost structure and enhanced liquidity position will allow it to emerge as an even stronger player as the market rebalances Slide 8 Flexible Capital Structure Current Focus Manage capital Control costs Rationalize supply Continue met development Maximize value of asset base As Cycle Turns Reduce leverage Invest in the business via organic and strategic growth Return capital to stakeholders Maximize value of asset base |
|
|
Arch’s asset base includes a leading, low-cost Powder River Basin position with meaningful available capacity Arch has a strong position in the PRB, the nation’s largest coal supply basin Primarily 8800-Btu, low-sulfur product Available capacity to bring back volume as demand returns Expect PRB to expand domestically Pursuing export growth off West Coast Slide 9 Sources: ACI, MSHA Southern Powder River Basin (2012 production, in millions of tons) |
|
|
Arch’s Appalachian portfolio is low in cost — and is geared toward higher-margin met assets Slide 10 Sources: Metallurgical Production as % of Appalachia (Based on YTD 2013 tons sold) Appalachian Cash Costs (YTD 2013 reported costs, $/ton) Peer earnings and SEC filings, MSHA and ACI *Based on 1H13 reported results |
|
|
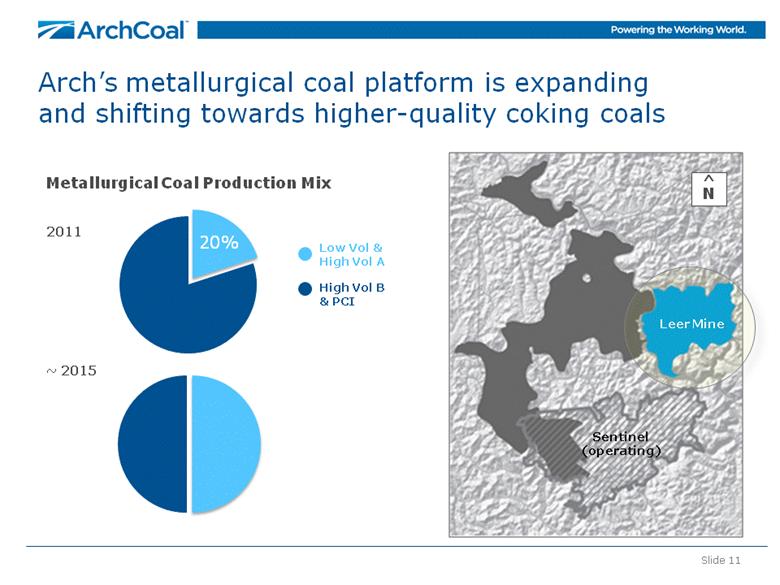
Slide 11 Arch’s metallurgical coal platform is expanding and shifting towards higher-quality coking coals Leer Mine Sentinel (operating) ^ N 2011 ~ 2015 High Vol B & PCI Low Vol & High Vol A Metallurgical Coal Production Mix 20% |
|
|
Arch’s new Bituminous Thermal segment serves diverse domestic and seaborne coal markets West Elk is a low-cost, valuable asset with a broad domestic and international customer base Viper operation is a low-cost and highly competitive mine Fully permitted Lost Prairie reserves represent a future organic growth opportunity in the Illinois Basin Arch also owns a 49% equity stake in Knight Hawk Coal*, a growing producer of low-chlorine coal Slide 12 1,025 million tons of reserves West Elk Viper Knight Hawk* Lost Prairie Reserves Macoupin Reserves *Results not included in segment |
|
|
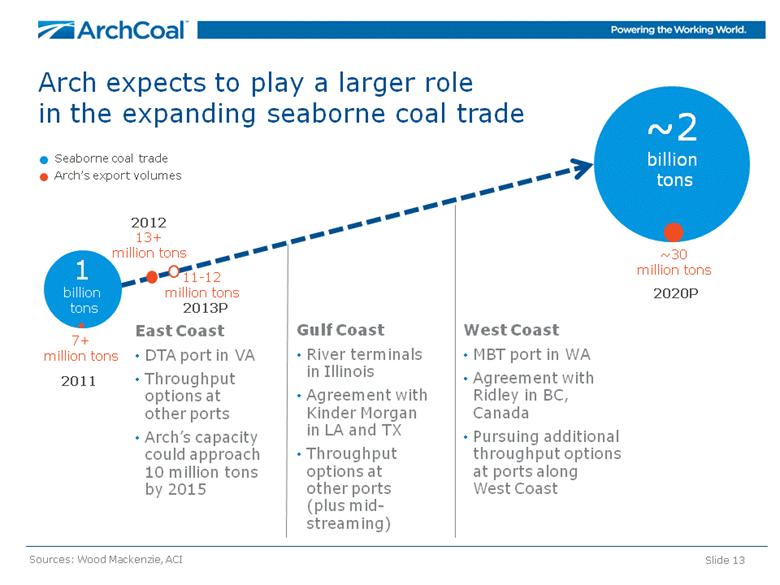
11-12 million tons Slide 13 Arch expects to play a larger role in the expanding seaborne coal trade East Coast DTA port in VA Throughput options at other ports Arch’s capacity could approach 10 million tons by 2015 Sources: Wood Mackenzie, ACI 2020P ~2 billion tons 7+ million tons 1 billion tons 2011 ~30 million tons Seaborne coal trade Arch’s export volumes West Coast MBT port in WA Agreement with Ridley in BC, Canada Pursuing additional throughput options at ports along West Coast Gulf Coast River terminals in Illinois Agreement with Kinder Morgan in LA and TX Throughput options at other ports (plus mid-streaming) 13+ million tons 2012 2013P |
|
|
Coal Market Update |
|
|
While coal market conditions are challenging in the near term Global macroeconomic uncertainty is impacting both thermal and metallurgical coal demand Emerging markets have slowed in the face of economic weakness in the developed world Utilization rates at global steel mills stand at roughly 79% – off peak levels Seaborne thermal and metallurgical coal prices have fallen to unsustainably low levels Slide 15 Sources: World Steel Association, Wood Mackenzie, ACI and other public sources |
|
|
long-term prospects for thermal and metallurgical coal demand remain bright Slide 16 World steel consumption is expected to increase more than 35% by 2020 World population should top 8 billion by 2030 – with substantial urbanization and growth in the middle classes of the emerging world The rapid build-out of the world’s coal-based power plant fleet continues to be strong Rationalization of higher-cost global metallurgical coal supply is underway Capital spending for future metallurgical coal supply projects is being curtailed, which will reduce future supply growth and further support markets over time Sources: World Steel Association, IEA |
|
|
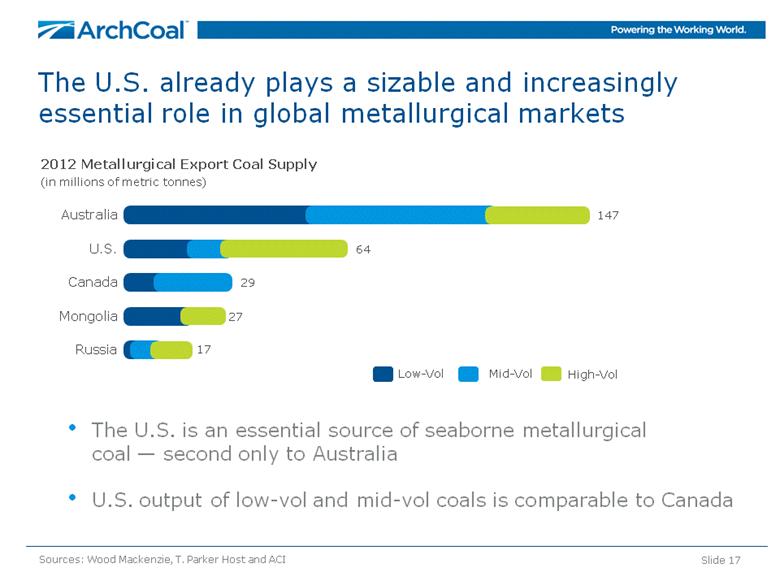
The U.S. already plays a sizable and increasingly essential role in global metallurgical markets Slide 17 Sources: Wood Mackenzie, T. Parker Host and ACI 2012 Metallurgical Export Coal Supply (in millions of metric tonnes) Low-Vol Mid-Vol High-Vol The U.S. is an essential source of seaborne metallurgical coal — second only to Australia U.S. output of low-vol and mid-vol coals is comparable to Canada |
|
|
Slide 18 Nations around the world are building coal-based power plants to fuel electricity needs Africa Europe CIS Countries Middle East Other Asia 39 Latin America 3 China 110 107 India 9 3 14 3 Under construction* 288 GW 850 mm tonnes Planned by 2017* 483 GW 1.4 bn tonnes New Coal-Fueled Generation Coming Online by 2017 Capacity under construction, in GW, from 2013-2017 Online in 2013 133 GW 392 mm tonnes Sources: ACI and Platts International *Includes capacity expected to come online in 2013 |
|
|
Slide 19 The trend of increased coal imports is unmistakable and not confined to India and China Sources: ACI, McCloskey, India Coal Market Watch Data, Bloomberg, JP Morgan / Bangkok Post China net imports (in millions of metric tonnes) India net imports (in millions of metric tonnes) 27 153 (68) 279 Thermal Met Thermal Met Since 2007, South Korean imports have risen 45% to 128 million metric tonnes Vietnam plans to add more than 30 GWs of coal-based capacity this decade – and Taiwan, Indonesia, Malaysia and the Philippines are following a similar path Thailand’s energy agency expects power demand to double by 2030, and views coal as a lower cost and more secure option than LNG Japan’s coal use rose 15% in 2013; two new coal plants are scheduled to come online soon; and coal is increasingly viewed as a strategic substitute for shuttered nuclear plants |
|
|
European coal consumption is rising in the face of escalating natural gas prices With natural gas prices at nearly three times the level prevailing in the U.S., Europe is consuming more coal Expiring natural gas contracts as well as an acrimonious history of natural gas purchases from Russia provide further incentives Declining indigenous production in Europe should translate into increased coal imports, even in the face of intensifying regulatory pressures 5 GW of new coal-fueled capacity coming online on the continent in 2013 Slide 20 Sources: IEA, IHS CERA, McCloskey and ACI *Excludes consumption of brown coal Coal Burn for Power Generation in Europe (in millions of tonnes of coal equivalent)* 2010 2011 2012 |
|
|
Projected Capacity Planned U.S. port expansions could support a doubling of coal exports over the next five years or so NS/Lamberts 29 DTA 18 CNX Marine 14 Pier IX 13 CSX/Curtis Bay 12 Ridley** 4 Westshore** 4 CA 3 Pacific Northwest 30 Mobile 16 Other AL 5 U.S. Exports (in millions of tonnes) Sources: ACI, NMA, Port Terminal Presentations *Includes overland shipments to Canada/Mexico **Capacity available for U.S. sourced volumes Slide 21 Deepwater 10 IMT 15 United 10 Burnside 9 Convent 7 Mid-streaming 22 Great Lakes 6 West Coast 41 Southwest 10 Gulf Coast 63 East Coast 86 Midwest 6 Southeast 21 Actual |
|
|
(in millions of tons) 2013P directional change Power generation use U.S. coal exports Industrial use Domestic metallurgical U.S. demand Domestic supply Imports U.S. supply Year-end stockpiles Slide 22 142 We are seeing improving trends in U.S. coal markets during 2013 Sources: EIA, IHS CERA and ACI In 2012, U.S. coal demand declined 90 million tons. Supply fell nearly 80 million tons, leading to a build in U.S. generator coal stockpiles. Trends are reversing in 2013: Coal consumption has increased by more than 30 million tons through August U.S. exports have remained sizable, and are expected to total 105 million to 110 million tons in 2013 U.S. coal production declines have accelerated since June 2013 |
|
|
U.S. coal stockpiles should further liquidate in 2013; could end the year below the five-year average Slide 23 Sources: EIA, EVA and ACI Estimated Coal Stockpile Levels at U.S. Power Generators (in millions of tons, at December 31) 55 million ton decline from peak levels After a record build in May 2012, coal stockpiles at U.S. generators declined to 185 million tons by December. This positive downward trend has continued into 2013. Coal stockpiles have fallen more than 25 million tons so far in 2013 and could end the year below the five-year average. |
|
|
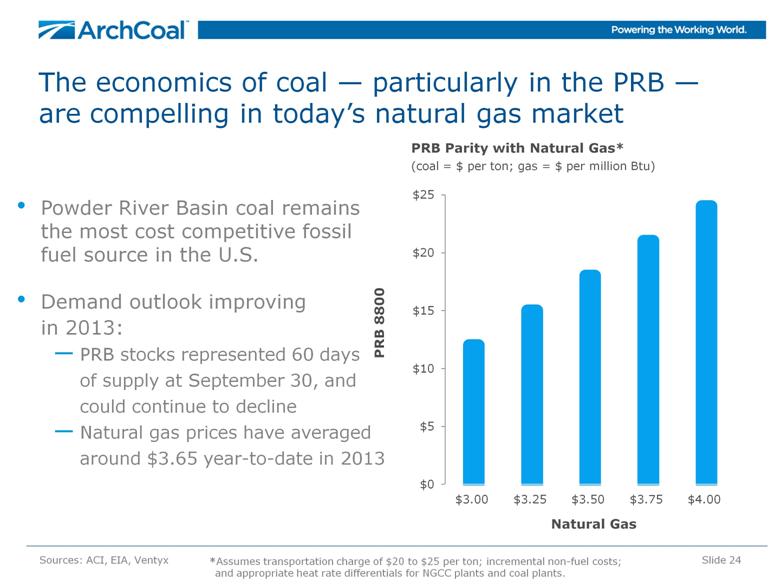
The economics of coal — particularly in the PRB — are compelling in today’s natural gas market Slide 24 Sources: ACI, EIA, Ventyx PRB Parity with Natural Gas* (coal = $ per ton; gas = $ per million Btu) *Assumes transportation charge of $20 to $25 per ton; incremental non-fuel costs; and appropriate heat rate differentials for NGCC plants and coal plants. Powder River Basin coal remains the most cost competitive fossil fuel source in the U.S. Demand outlook improving in 2013: PRB stocks represented 60 days of supply at September 30, and could continue to decline Natural gas prices have averaged around $3.65 year-to-date in 2014 Natural Gas |
|
|
Slide 25 Arch expects 55 GW of coal-based generating capacity to retire by 2018, but the impact on coal consumption is not that large Sources: Wood Mackenzie, SNL and ACI *Excluding Canyon Fuel Coal Consumption for Power Generation (based on 2012 data) Percentage of Each Basin’s Total Supply that was Delivered to At-Risk Plants in 2012 ~ 65 million tons ~10 million tons* Coal Consumed at Surviving Plants Coal Consumed at Plants Expected to Retire Illinois Basin/ Other Coal Supplied by Arch to Plants Expected to Retire PRB and ILB basins are least impacted by coal plant closures |
|
|
The coal plants expected to retire are older, less efficient and are running at very low capacity factors Once those plants retire, that generation will need to migrate elsewhere most likely to the surviving coal plants Coal fleet has run at much higher utilization rates in the past – and larger, surviving plants retrofitted with modern control technologies should be able to operate at much higher capacity factors Slide 26 Sources: Ventyx, ACI Average Coal Plant Utilization (Capacity factors) 73% ~60% The potential offset to coal plant closures is the demonstrated ability to run the surviving coal fleet at higher utilization levels All coal units 262 GW surviving post 2018 55 GW retiring by 2018 ~35% 2007 2012 |
|
|
Slide 27 Ongoing supply rationalization will bring balance to coal markets Appalachian thermal coal is in long-term secular decline. Arch expects thermal output in the region to fall further in 2013. Sources: EIA and ACI 382 64 315 56 234 83 197 76 Appalachian* Output (in millions of tons) 185 million ton decline in thermal output since 1997 *Includes Northern and Central Appalachia |
|
|
Arch is well positioned in an evolving coal market landscape Slide 28 Arch is holding the line on costs, containing capital spending and proactively managing liquidity Arch is executing on its strategic plans to monetize non-core assets to enhance shareholder value Arch is poised to capture upside as global coal markets recover Arch’s asset base is well positioned – with a focus on a strong PRB franchise, a growing metallurgical coal platform and an ancillary bituminous thermal segment serving both the domestic and seaborne coal trade |