Attached files
| file | filename |
|---|---|
| 8-K - FORM 8-K - NEWBRIDGE BANCORP | v358918_8k.htm |
| EX-99.1 - EXHIBIT 99.1 - NEWBRIDGE BANCORP | v358918_ex99-1.htm |
,
NASDAQ: NBBC www.newbridgebank.com ACQUISITION OF CAPSTONE BANK November 1, 2013
FORWARD - LOOKING STATEMENTS 2 This presentation contains forward-looking statements relating to the financial condition, results of operations and business of NewBridge Bancorp and its subsidiary NewBridge Bank . These forward looking statements involve risks and uncertainties and are based on the beliefs and assumptions of the management of NewBridge Bancorp, and the information available to management at the time that this presentation was prepared . Factors that could cause actual results to differ materially from those contemplated by such forward-looking statements include, among others, the following : (i) general economic or business conditions, either nationally or regionally, may be less favorable than expected, resulting in, among other things, a deterioration in credit quality and/or a reduced demand for credit or other services ; (ii) changes in the interest rate environment may reduce net margins and/or the volumes and values of loans made or held as well as the value of other financial assets held ; (iii) competitive pressures among depository and other financial institutions may increase significantly ; (iv) legislative or regulatory changes, including changes in accounting standards, may adversely affect the businesses in which NewBridge Bancorp is engaged ; (v) local, state or federal taxing authorities may take tax positions that are adverse to NewBridge Bancorp ; (vi) adverse changes may occur in the securities markets ; (vii) competitors of NewBridge Bancorp may have greater financial resources and develop products that enable them to compete more successfully than NewBridge Bancorp ; (viii) costs or difficulties related to the integration of CapStone Bank may be greater than expected ; (ix) expected cost savings associated with our acquisition of CapStone Bank may not be fully realized within the expected time frame ; and (x) deposit attrition, customer loss or revenue loss following our acquisition of CapStone Bank may be greater than expected . Additional factors affecting NewBridge Bancorp and NewBridge Bank are discussed in NewBridge Bancorp’s filings with the Securities and Exchange Commission (the “SEC”), Annual Report on Form 10 -K, its Quarterly Reports on Form 10 -Q and its Current Reports on Form 8 -K . Please refer to the Securities and Exchange Commission's website at www . sec . gov to review such documents . NewBridge Bancorp does not undertake a duty to update any forward-looking statements made in this presentation
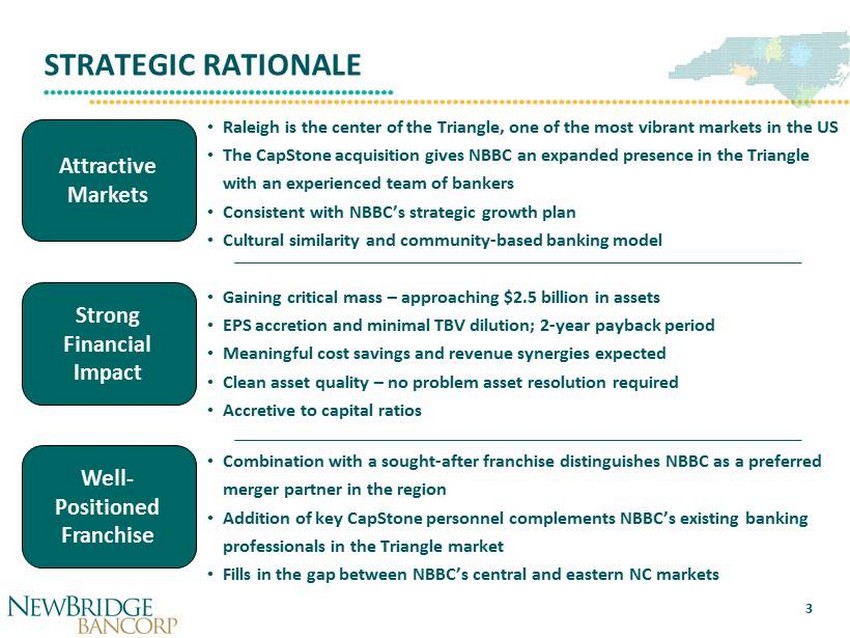
STRATEGIC RATIONALE • Raleigh is the center of the Triangle, one of the most vibrant markets in the US • The CapStone acquisition gives NBBC an expanded presence in the Triangle with an experienced team of bankers • Consistent with NBBC’s strategic growth plan • Cultural similarity and community - based banking model • Gaining critical mass – approaching $2.5 billion in assets • EPS accretion and minimal TBV dilution; 2 - year payback period • Meaningful cost savings and revenue synergies expected • Clean asset quality – no problem asset resolution required • Accretive to capital ratios • Combination with a sought - after franchise distinguishes NBBC as a preferred merger partner in the region • Addition of key CapStone personnel complements NBBC’s existing banking professionals in the Triangle market • Fills in the gap between NBBC’s central and eastern NC markets Attractive Markets Strong Financial Impact Well - Positioned Franchise 3
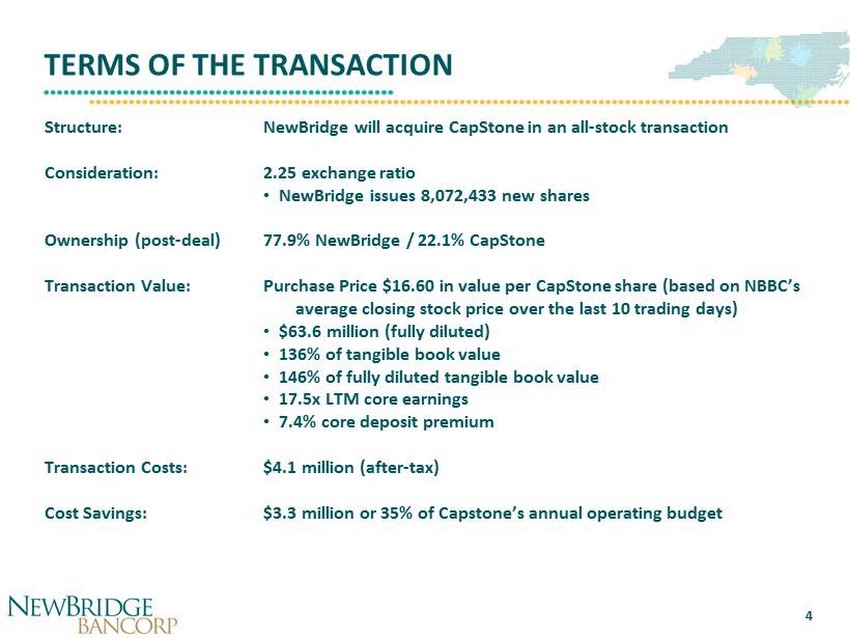
TERMS OF THE TRANSACTION Structure: Consideration: Ownership (post - deal) Transaction Value: Transaction Costs: Cost Savings: NewBridge will acquire CapStone in an all - stock transaction 2.25 exchange ratio • NewBridge issues 8,072,433 new shares 77.9% NewBridge / 22.1% CapStone Purchase Price $16.60 in value per CapStone share (based on NBBC’s average closing stock price over the last 10 trading days) • $63.6 million (fully diluted) • 136% of tangible book value • 146% of fully diluted tangible book value • 17.5x LTM core earnings • 7.4% core deposit premium $4.1 million (after - tax) $3.3 million or 35% of Capstone’s annual operating budget 4
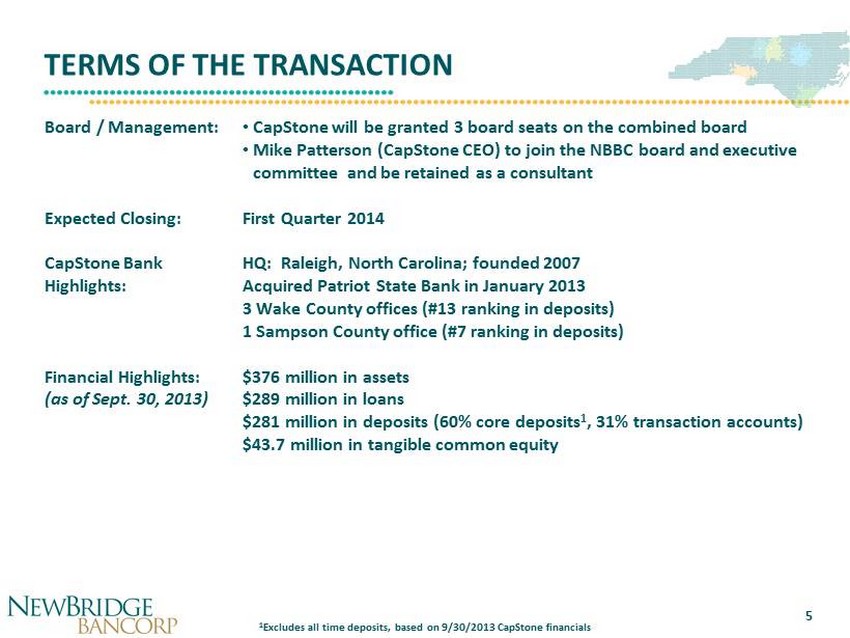
TERMS OF THE TRANSACTION Board / Management: Expected Closing: CapStone Bank Highlights: Financial Highlights: (as of Sept. 30, 2013) • CapStone will be granted 3 board seats on the combined board • Mike Patterson ( CapStone CEO) to join the NBBC board and executive committee and be retained as a consultant First Quarter 2014 HQ: Raleigh, North Carolina; founded 2007 Acquired Patriot State Bank in January 2013 3 Wake County offices (#13 ranking in deposits) 1 Sampson County office (#7 ranking in deposits) $376 million in assets $289 million in loans $281 million in deposits (60% core deposits 1 , 31% transaction accounts) $43.7 million in tangible common equity 1 Excludes all time deposits, based on 9/30/2013 CapStone financials 5
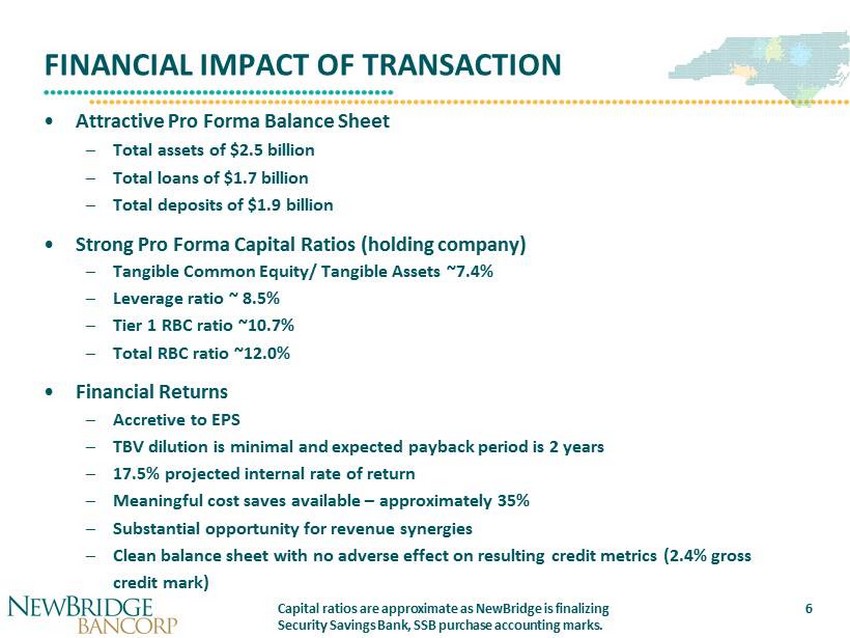
FINANCIAL IMPACT OF TRANSACTION • Attractive Pro Forma Balance Sheet – Total assets of $2.5 billion – Total loans of $1.7 billion – Total deposits of $1.9 billion • Strong Pro Forma Capital Ratios (holding company) – Tangible Common Equity/ Tangible Assets ~7.4% – Leverage ratio ~ 8.5% – Tier 1 RBC ratio ~10.7% – Total RBC ratio ~12.0% • Financial Returns – Accretive to EPS – TBV dilution is minimal and expected payback period is 2 years – 17.5% projected internal rate of return – Meaningful cost saves available – approximately 35% – Substantial opportunity for revenue synergies – Clean balance sheet with no adverse effect on resulting credit metrics (2.4% gross credit mark) 6 Capital ratios are approximate as NewBridge is finalizing Security Savings Bank, SSB purchase accounting marks.
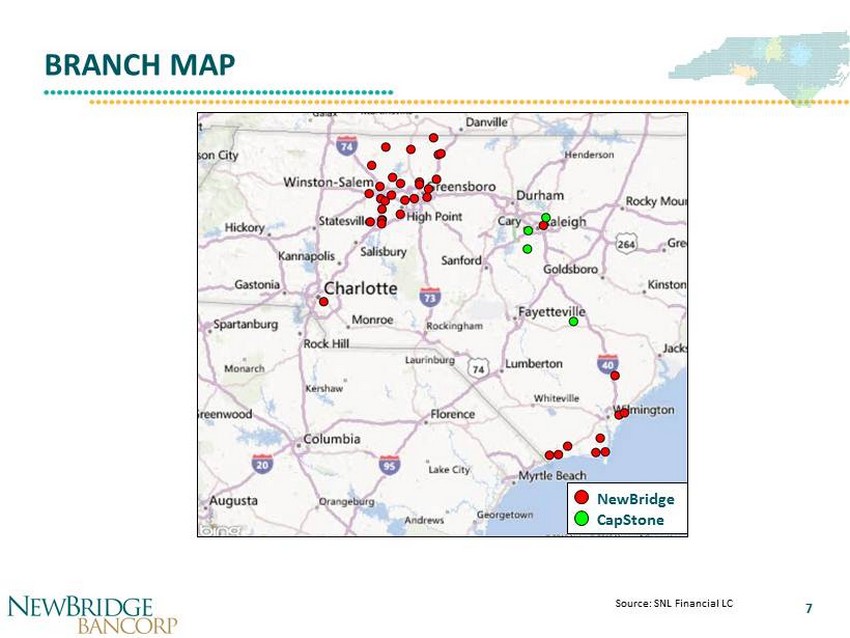
BRANCH MAP Source: SNL Financial LC 7 NewBridge CapStone
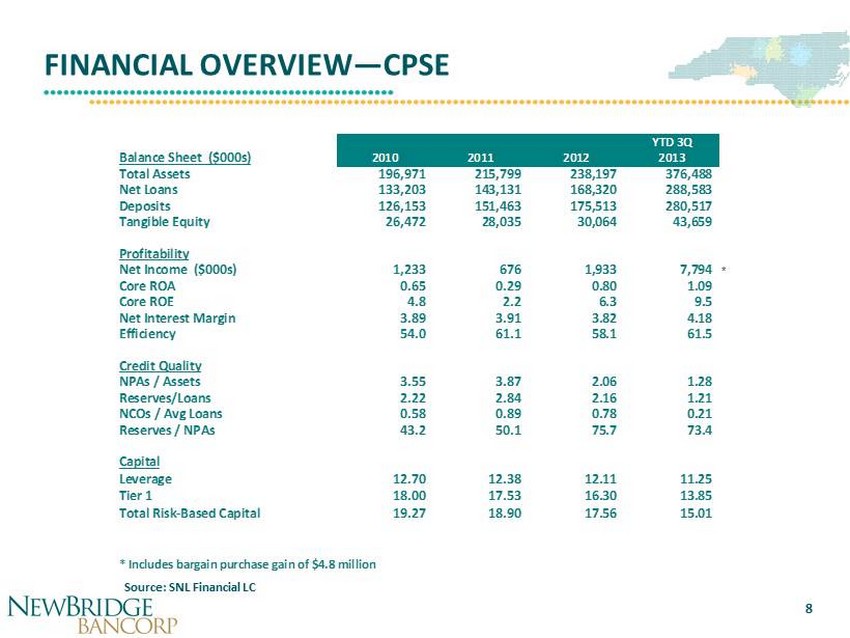
FINANCIAL OVERVIEW — CPSE Source: SNL Financial LC 8 YTD 3Q Balance Sheet ($000s) 2010 2011 2012 2013 Total Assets 196,971 215,799 238,197 376,488 Net Loans 133,203 143,131 168,320 288,583 Deposits 126,153 151,463 175,513 280,517 Tangible Equity 26,472 28,035 30,064 43,659 Profitability Net Income ($000s) 1,233 676 1,933 7,794 * Core ROA 0.65 0.29 0.80 1.09 Core ROE 4.8 2.2 6.3 9.5 Net Interest Margin 3.89 3.91 3.82 4.18 Efficiency 54.0 61.1 58.1 61.5 Credit Quality NPAs / Assets 3.55 3.87 2.06 1.28 Reserves/Loans 2.22 2.84 2.16 1.21 NCOs / Avg Loans 0.58 0.89 0.78 0.21 Reserves / NPAs 43.2 50.1 75.7 73.4 Capital Leverage 12.70 12.38 12.11 11.25 Tier 1 18.00 17.53 16.30 13.85 Total Risk-Based Capital 19.27 18.90 17.56 15.01 * Includes bargain purchase gain of $4.8 million
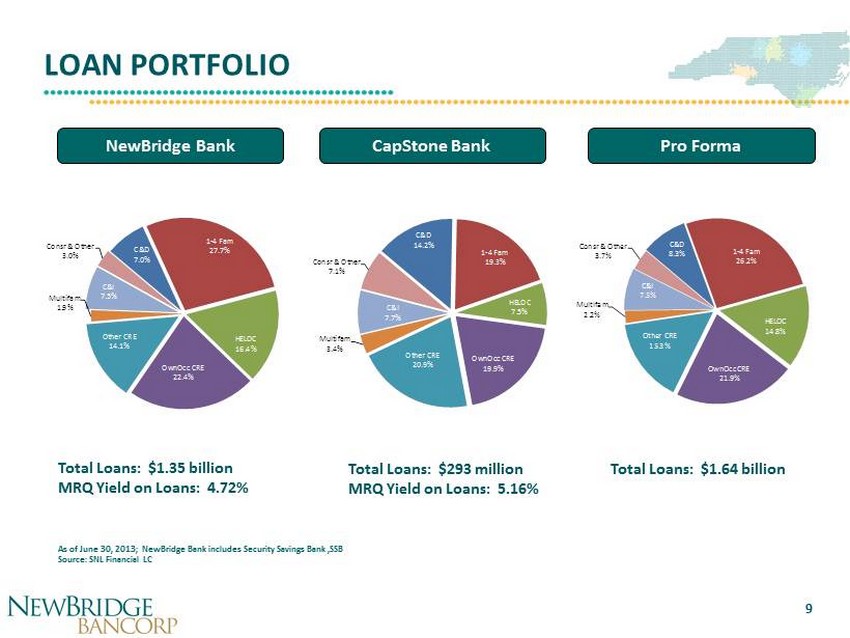
LOAN PORTFOLIO NewBridge Bank CapStone Bank Pro Forma Composition Composition Composition Loan Type ($000) % of Total Loan Type ($000) % of Total Loan Type ($000) % of Total Constr & Dev 95,264 7.0% Constr & Dev 41,580 14.2% Constr & Dev 136,844 8.3% 1-4 Family Residential 375,078 27.7% 1-4 Family Residential 56,652 19.3% 1-4 Family Residential 431,730 26.2% Home Equity 221,240 16.4% Home Equity 22,073 7.5% Home Equity 243,313 14.8% Owner - Occ CRE 302,699 22.4% Owner - Occ CRE 58,199 19.9% Owner - Occ CRE 360,898 21.9% Other CRE 190,280 14.1% Other CRE 61,284 20.9% Other CRE 251,564 15.3% Multifamily 26,371 1.9% Multifamily 9,815 3.4% Multifamily 36,186 2.2% Commercial & Industrial 101,229 7.5% Commercial & Industrial 22,554 7.7% Commercial & Industrial 123,783 7.5% Consr & Other 40,866 3.0% Consr & Other 20,746 7.1% Consr & Other 61,612 3.7% Total Loans 1,353,020 100.0% Total Loans $292,903 100.0% Total Loans $1,645,930 100.0% MRQ Yield on Loans: 4.72% MRQ Yield on Loans: 5.16% MRQ Yield on Loans: 4.80% NewBridge CapStone Bank Pro Forma C&D 7.0% 1 - 4 Fam 27.7% HELOC 16.4% OwnOcc CRE 22.4% Other CRE 14.1% Multifam 1.9% C&I 7.5% Consr & Other 3.0% C&D 14.2% 1 - 4 Fam 19.3% HELOC 7.5% OwnOcc CRE 19.9% Other CRE 20.9% Multifam 3.4% C&I 7.7% Consr & Other 7.1% C&D 8.3% 1 - 4 Fam 26.2% HELOC 14.8% OwnOcc CRE 21.9% Other CRE 15.3% Multifam 2.2% C&I 7.5% Consr & Other 3.7% Composition Composition Composition Loan Type ($000) % of Total Loan Type ($000) % of Total Loan Type ($000) % of Total Constr & Dev 95,264 7.0% Constr & Dev 41,580 14.2% Constr & Dev 136,844 8.3% 1-4 Family Residential 375,078 27.7% 1-4 Family Residential 56,652 19.3% 1-4 Family Residential 431,730 26.2% Home Equity 221,240 16.4% Home Equity 22,073 7.5% Home Equity 243,313 14.8% Owner - Occ CRE 302,699 22.4% Owner - Occ CRE 58,199 19.9% Owner - Occ CRE 360,898 21.9% Other CRE 190,280 14.1% Other CRE 61,284 20.9% Other CRE 251,564 15.3% Multifamily 26,371 1.9% Multifamily 9,815 3.4% Multifamily 36,186 2.2% Commercial & Industrial 101,229 7.5% Commercial & Industrial 22,554 7.7% Commercial & Industrial 123,783 7.5% Consr & Other 40,866 3.0% Consr & Other 20,746 7.1% Consr & Other 61,612 3.7% Total Loans 1,353,020 100.0% Total Loans $292,903 100.0% Total Loans $1,645,930 100.0% MRQ Yield on Loans: 4.72% MRQ Yield on Loans: 5.16% MRQ Yield on Loans: 4.80% NewBridge CapStone Bank Pro Forma C&D 7.0% 1 - 4 Fam 27.7% HELOC 16.4% OwnOcc CRE 22.4% Other CRE 14.1% Multifam 1.9% C&I 7.5% Consr & Other 3.0% C&D 14.2% 1 - 4 Fam 19.3% HELOC 7.5% OwnOcc CRE 19.9% Other CRE 20.9% Multifam 3.4% C&I 7.7% Consr & Other 7.1% C&D 8.3% 1 - 4 Fam 26.2% HELOC 14.8% OwnOcc CRE 21.9% Other CRE 15.3% Multifam 2.2% C&I 7.5% Consr & Other 3.7% Composition Composition Composition Loan Type ($000) % of Total Loan Type ($000) % of Total Loan Type ($000) % of Total Constr & Dev 95,264 7.0% Constr & Dev 41,580 14.2% Constr & Dev 136,844 8.3% 1-4 Family Residential 375,078 27.7% 1-4 Family Residential 56,652 19.3% 1-4 Family Residential 431,730 26.2% Home Equity 221,240 16.4% Home Equity 22,073 7.5% Home Equity 243,313 14.8% Owner - Occ CRE 302,699 22.4% Owner - Occ CRE 58,199 19.9% Owner - Occ CRE 360,898 21.9% Other CRE 190,280 14.1% Other CRE 61,284 20.9% Other CRE 251,564 15.3% Multifamily 26,371 1.9% Multifamily 9,815 3.4% Multifamily 36,186 2.2% Commercial & Industrial 101,229 7.5% Commercial & Industrial 22,554 7.7% Commercial & Industrial 123,783 7.5% Consr & Other 40,866 3.0% Consr & Other 20,746 7.1% Consr & Other 61,612 3.7% Total Loans 1,353,020 100.0% Total Loans $292,903 100.0% Total Loans $1,645,930 100.0% MRQ Yield on Loans: 4.72% MRQ Yield on Loans: 5.16% MRQ Yield on Loans: 4.80% NewBridge CapStone Bank Pro Forma C&D 7.0% 1 - 4 Fam 27.7% HELOC 16.4% OwnOcc CRE 22.4% Other CRE 14.1% Multifam 1.9% C&I 7.5% Consr & Other 3.0% C&D 14.2% 1 - 4 Fam 19.3% HELOC 7.5% OwnOcc CRE 19.9% Other CRE 20.9% Multifam 3.4% C&I 7.7% Consr & Other 7.1% C&D 8.3% 1 - 4 Fam 26.2% HELOC 14.8% OwnOcc CRE 21.9% Other CRE 15.3% Multifam 2.2% C&I 7.5% Consr & Other 3.7% Total Loans: $1.35 billion MRQ Yield on Loans: 4.72% Total Loans: $293 million MRQ Yield on Loans: 5.16% Total Loans: $1.64 billion 9 As of June 30, 2013; NewBridge Bank includes Security Savings Bank ,SSB Source: SNL Financial LC
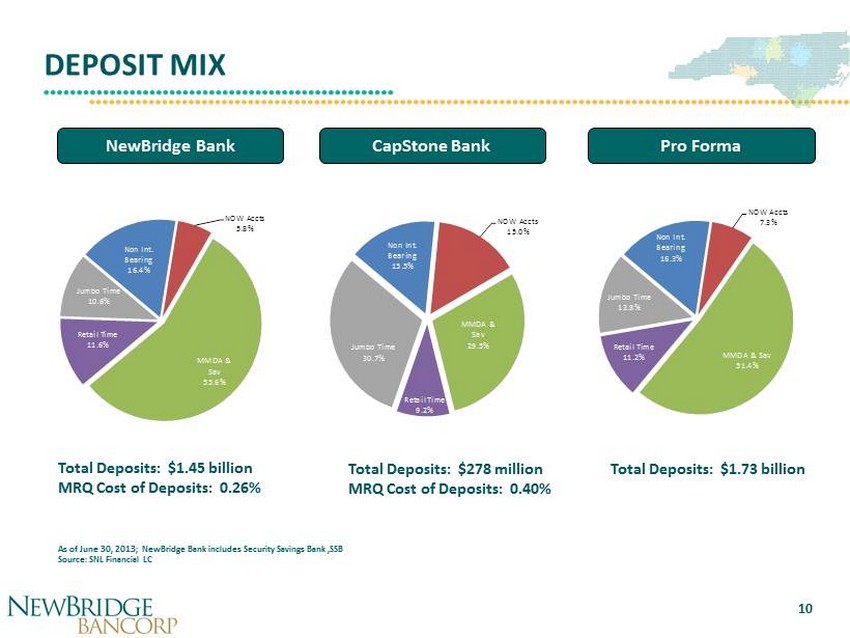
DEPOSIT MIX NewBridge Bank CapStone Bank Pro Forma Total Deposits: $1.45 billion MRQ Cost of Deposits: 0.26% Total Deposits: $278 million MRQ Cost of Deposits: 0.40% Total Deposits: $1.73 billion Composition Composition Composition Deposit Type ($000) % of Total Deposit Type ($000) % of Total Deposit Type ($000) % of Total Non Interest Bearing 238,278 16.4% Non Interest Bearing 43,077 15.5% Non Interest Bearing 281,355 16.3% NOW & Other Trans 83,542 5.8% NOW & Other Trans 41,781 15.0% NOW & Other Trans 125,323 7.3% MMDA & Sav 806,004 55.6% MMDA & Sav 82,181 29.5% MMDA & Sav 888,185 51.4% Retail Time Deposits 167,869 11.6% Retail Time Deposits 25,723 9.2% Retail Time Deposits 193,592 11.2% Jumbo Time Deposits 152,890 10.6% Jumbo Time Deposits 85,590 30.7% Jumbo Time Deposits 238,480 13.8% Total Deposits $1,448,583 100.0% Total Deposits $278,352 100.0% Total Deposits $1,726,935 100.0% MRQ Cost of Deposits: 0.26% MRQ Cost of Deposits: 0.40% MRQ Cost of Deposits: 0.28% NewBridge CapStone Bank Pro Forma Non Int. Bearing 16.4% NOW Accts 5.8% MMDA & Sav 55.6% Retail Time 11.6% Jumbo Time 10.6% Non Int. Bearing 15.5% NOW Accts 15.0% MMDA & Sav 29.5% Retail Time 9.2% Jumbo Time 30.7% Non Int. Bearing 16.3% NOW Accts 7.3% MMDA & Sav 51.4% Retail Time 11.2% Jumbo Time 13.8% Composition Composition Composition Deposit Type ($000) % of Total Deposit Type ($000) % of Total Deposit Type ($000) % of Total Non Interest Bearing 238,278 16.4% Non Interest Bearing 43,077 15.5% Non Interest Bearing 281,355 16.3% NOW & Other Trans 83,542 5.8% NOW & Other Trans 41,781 15.0% NOW & Other Trans 125,323 7.3% MMDA & Sav 806,004 55.6% MMDA & Sav 82,181 29.5% MMDA & Sav 888,185 51.4% Retail Time Deposits 167,869 11.6% Retail Time Deposits 25,723 9.2% Retail Time Deposits 193,592 11.2% Jumbo Time Deposits 152,890 10.6% Jumbo Time Deposits 85,590 30.7% Jumbo Time Deposits 238,480 13.8% Total Deposits $1,448,583 100.0% Total Deposits $278,352 100.0% Total Deposits $1,726,935 100.0% MRQ Cost of Deposits: 0.26% MRQ Cost of Deposits: 0.40% MRQ Cost of Deposits: 0.28% NewBridge CapStone Bank Pro Forma Non Int. Bearing 16.4% NOW Accts 5.8% MMDA & Sav 55.6% Retail Time 11.6% Jumbo Time 10.6% Non Int. Bearing 15.5% NOW Accts 15.0% MMDA & Sav 29.5% Retail Time 9.2% Jumbo Time 30.7% Non Int. Bearing 16.3% NOW Accts 7.3% MMDA & Sav 51.4% Retail Time 11.2% Jumbo Time 13.8% Composition Composition Composition Deposit Type ($000) % of Total Deposit Type ($000) % of Total Deposit Type ($000) % of Total Non Interest Bearing 238,278 16.4% Non Interest Bearing 43,077 15.5% Non Interest Bearing 281,355 16.3% NOW & Other Trans 83,542 5.8% NOW & Other Trans 41,781 15.0% NOW & Other Trans 125,323 7.3% MMDA & Sav 806,004 55.6% MMDA & Sav 82,181 29.5% MMDA & Sav 888,185 51.4% Retail Time Deposits 167,869 11.6% Retail Time Deposits 25,723 9.2% Retail Time Deposits 193,592 11.2% Jumbo Time Deposits 152,890 10.6% Jumbo Time Deposits 85,590 30.7% Jumbo Time Deposits 238,480 13.8% Total Deposits $1,448,583 100.0% Total Deposits $278,352 100.0% Total Deposits $1,726,935 100.0% MRQ Cost of Deposits: 0.26% MRQ Cost of Deposits: 0.40% MRQ Cost of Deposits: 0.28% NewBridge CapStone Bank Pro Forma Non Int. Bearing 16.4% NOW Accts 5.8% MMDA & Sav 55.6% Retail Time 11.6% Jumbo Time 10.6% Non Int. Bearing 15.5% NOW Accts 15.0% MMDA & Sav 29.5% Retail Time 9.2% Jumbo Time 30.7% Non Int. Bearing 16.3% NOW Accts 7.3% MMDA & Sav 51.4% Retail Time 11.2% Jumbo Time 13.8% 10 As of June 30, 2013; NewBridge Bank includes Security Savings Bank ,SSB Source: SNL Financial LC
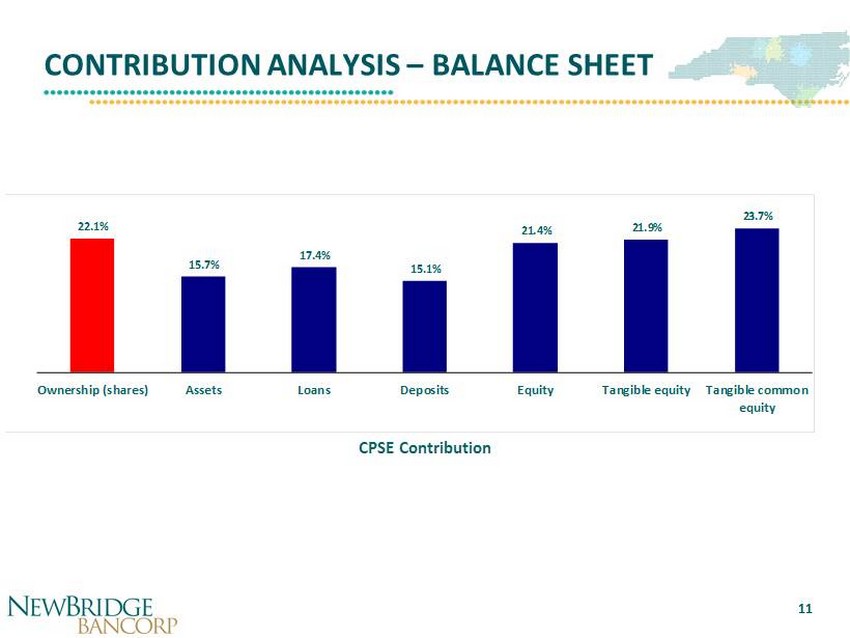
CONTRIBUTION ANALYSIS – BALANCE SHEET 11 CPSE Contribution 22.1 % 15.7 % 17.4 % 15.1 % 21.4 % 21.9 % 23.7 % Ownership (shares) Assets Loans Deposits Equity Tangible equity Tangible common equity
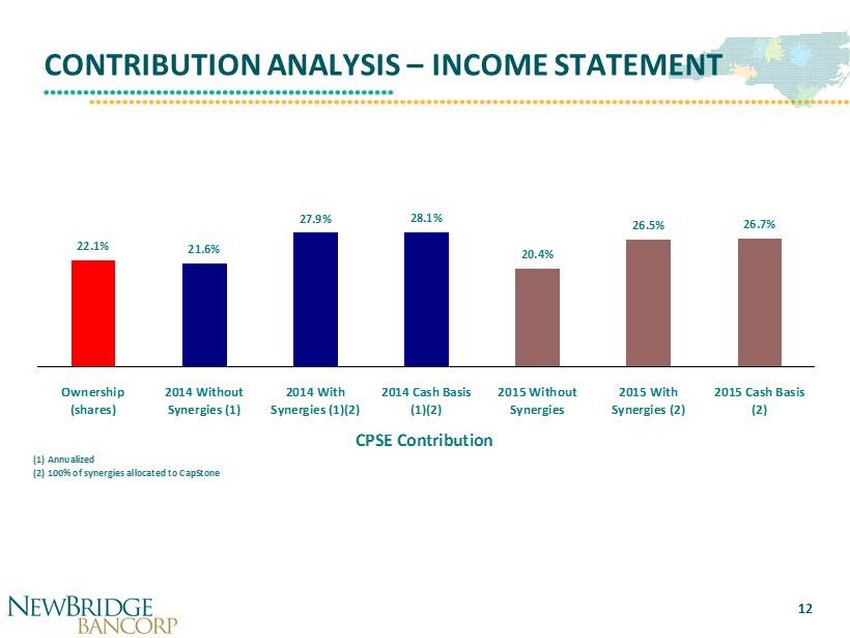
CONTRIBUTION ANALYSIS – INCOME STATEMENT 12 CPSE Contribution (1) Annualized (2) 100% of synergies allocated to CapStone 22.1% 21.6% 27.9% 28.1% 20.4% 26.5% 26.7% Ownership (shares) 2014 Without Synergies (1) 2014 With Synergies (1)(2) 2014 Cash Basis (1)(2) 2015 Without Synergies 2015 With Synergies (2) 2015 Cash Basis (2)
TRANSACTION SUMMARY • Significantly expanded presence in Raleigh, the center of the vibrant Triangle market ‒ Creates a more attractive franchise for NBBC ‒ Fills in gap between NBBC’s central and eastern NC markets ‒ No asset clean - up involved • Seasoned Triangle management team • Ability to increase loan volume with combination of Triangle team and NBBC balance sheet • Increased market capitalization and stock liquidity • EPS accretion of 5% • Cost saving opportunities of $3.3 million (35%) • Modest tangible book value dilution and short payback 13
ADDITIONAL INFORMATION Additional Information About the Merger and Where to Find It In connection with the proposed merger, NewBridge will file with the SEC a registration statement on Form S - 4 to register the sh ares of NewBridge common stock to be issued to the shareholders of CapStone . The registration statement will include a joint proxy statement/prospectus which will be sent to the shareholders of NewBridge and CapStone seeking their approval of the merger and related matters. In addition, NewBridge and CapStone may file other relevant documents concerning the proposed merger with the SEC. INVESTORS AND SHAREHOLDERS OF BOTH COMPANIES ARE URGED TO READ THE REGISTRATION STATEMENT ON FORM S - 4 AND THE JOINT PROXY STATEMENT/PROSPECTUS INCLUDED WITHIN THE REGISTRATION STATEMENT AND ANY OTHER RELEVANT DOCUMENTS TO BE FILED WITH THE SEC IN CONNECTION WITH THE PROPOSED MERGER BECAUSE THEY WILL CONTAIN IMPORTANT INFORMATION ABOUT NEWBRIDGE, CAPSTONE AND THE PROPOSED TRANSACTION. Investors and shareholders may obtain free copies of these documents through the website maintained by the SEC at www.sec.gov . Free copies of the joint proxy statement/prospectus also may be obtained by directing a request by telephone or mail to NewBr idg e Bancorp, 1501 Highwoods Boulevard, Suite 400, Greensboro, N.C. 27410, Attention: Investor Relations (telephone: 336 - 369 - 0900), or CapStone Bank, 4505 Falls of Neuse Road, Suite 150, Raleigh, N.C. 27609, Attention: Investor Relations (telephone: 919 - 256 - 6803), or by accessing NewBridge’s website at www.newbridgebank.com under "Investor Relations" or CapStone's website at www.capstonebank.com under "Investor Relations." The information on NewBridge’s and CapStone's websites is not, and shall not be deemed to be, a part of this release or incorporated into other filings either company makes with the SEC. NewBridge and CapStone and their respective directors and executive officers may be deemed to be participants in the solicitation of proxies from the shareholders of NewBridge and/or CapStone in connection with the merger. Information about the directors and executive officers of NewBridge is set forth in the proxy statement for NewBridge’s 2013 annual meeting of shareholders filed with the SEC on March 25, 2013. Information about the directors and executive officers of CapStone is set forth in the proxy statement for CapStone's 2013 annual meeting of shareholders. Additional information regarding the interests of these participants and other persons who may be deemed participants in the merger may be obtained by reading the joint proxy statement/prospectus regardin g the merger when it becomes available. 14
INVESTOR CONTACTS 15 • Ramsey K. Hamadi, Chief Financial Officer ramsey.hamadi@newbridgebank.com 336.369.0975 • David P. Barksdale, Chief Strategy Officer david.barksdale@newbridgebank.com 336.369.0939 • Pressley A. Ridgill, Chief Executive Officer pressley.ridgill@newbridgebank.com 336.369.0903