Attached files
| file | filename |
|---|---|
| 8-K - 8-K - PINNACLE WEST CAPITAL CORP | a13-23122_18k.htm |
| EX-99.2 - EX-99.2 - PINNACLE WEST CAPITAL CORP | a13-23122_1ex99d2.htm |
| EX-99.1 - EX-99.1 - PINNACLE WEST CAPITAL CORP | a13-23122_1ex99d1.htm |
Exhibit 99.3
|
|
3RD QUARTER 2013 RESULTS October 31, 2013 |

|
|
FORWARD LOOKING STATEMENTS AND NON-GAAP FINANCIAL MEASURES This presentation contains forward-looking statements based on current expectations, including statements regarding our earnings guidance and financial outlook and goals. These forward-looking statements are often identified by words such as “estimate,” “predict,” “may,” “believe,” “plan,” “expect,” “require,” “intend,” “assume” and similar words. Because actual results may differ materially from expectations, we caution you not to place undue reliance on these statements. A number of factors could cause future results to differ materially from historical results, or from outcomes currently expected or sought by Pinnacle West or APS. These factors include, but are not limited to: our ability to manage capital expenditures and operations and maintenance costs while maintaining reliability and customer service levels; variations in demand for electricity, including those due to weather, the general economy, customer and sales growth (or decline), and the effects of energy conservation measures and distributed generation; power plant and transmission system performance and outages; volatile fuel and purchased power costs; fuel and water supply availability; our ability to achieve timely and adequate rate recovery of our costs, including returns on debt and equity capital; regulatory and judicial decisions, developments and proceedings; new legislation or regulation, including those relating to environmental requirements, nuclear plant operations and potential deregulation of retail electric markets; our ability to meet renewable energy and energy efficiency mandates and recover related costs; risks inherent in the operation of nuclear facilities, including spent fuel disposal uncertainty; competition in retail and wholesale power markets; the duration and severity of the economic decline in Arizona and current real estate market conditions; the cost of debt and equity capital and the ability to access capital markets when required; changes to our credit ratings; the investment performance of the assets of our nuclear decommissioning trust, pension, and other postretirement benefit plans and the resulting impact on future funding requirements; the liquidity of wholesale power markets and the use of derivative contracts in our business; potential shortfalls in insurance coverage; new accounting requirements or new interpretations of existing requirements; generation, transmission and distribution facility and system conditions and operating costs; the ability to meet the anticipated future need for additional baseload generation and associated transmission facilities in our region; the willingness or ability of our counterparties, power plant participants and power plant land owners to meet contractual or other obligations or extend the rights for continued power plant operations; technological developments affecting the electric industry; and restrictions on dividends or other provisions in our credit agreements and Arizona Corporation Commission orders. These and other factors are discussed in Risk Factors described in Part I, Item 1A of the Pinnacle West/APS Annual Report on Form 10-K for the fiscal year ended December 31, 2012, which you should review carefully before placing any reliance on our financial statements, disclosures or earnings outlook. Neither Pinnacle West nor APS assumes any obligation to update these statements, even if our internal estimates change, except as required by law. In this presentation, references to net income and earnings per share (EPS) refer to amounts attributable to common shareholders. We present “gross margin” per diluted share of common stock. Gross margin refers to operating revenues less fuel and purchased power expenses. Gross margin is a “non-GAAP financial measure,” as defined in accordance with SEC rules. The appendix contains a reconciliation of this non-GAAP financial measure to the referenced revenue and expense line items on our Consolidated Statements of Income, which are the most directly comparable financial measures calculated and presented in accordance with generally accepted accounting principles in the United States of America (GAAP). We view gross margin as an important performance measure of the core profitability of our operations. We refer to “on-going earnings” in this presentation, which is also a non-GAAP financial measure. We believe on-going earnings provide investors with a useful indicator of our results that is comparable among periods because it excludes the effects of unusual items that may occur on an irregular basis. Reconciliations of on-going earnings to our net income attributable to common shareholders are included in this presentation. Investors should note that these non-GAAP financial measures may involve judgments by management, including whether an item is classified as an unusual item. These measures are key components of our internal financial reporting and are used by our management in analyzing the operations of our business. We believe that investors benefit from having access to the same financial measures that management uses. |
|
|
Four Corners Transaction Operational Performance Regulatory Update CEO AGENDA |
|
|
3rd Quarter Results Arizona Economic Outlook Earnings Guidance and Financial Outlook CFO AGENDA |

|
|
CONSOLIDATED EPS COMPARISON 2013 VS. 2012 3rd Quarter GAAP Net Income $2.04 $2.21 YTD GAAP Net Income $3.44 $3.25 3rd Quarter On-Going Earnings YTD On-Going Earnings |
|
|
ON-GOING EPS VARIANCES 3RD QUARTER 2013 VS. 3RD QUARTER 2012 Lower Gross Margin* $(0.06) Higher O&M* $(0.04) Higher Infrastructure $(0.07) Net Decrease $(0.17) = * Excludes costs, and offsetting operating revenues, associated with renewable energy (excluding AZ Sun), energy efficiency and similar regulatory programs. See non-GAAP gross margin reconciliation in appendix. |
|
|
GROSS MARGIN EPS DRIVERS 3RD QUARTER 2013 VS. 3RD QUARTER 2012 Weather Effects $0.02 Other Items, Net $0.02 Lower Retail kWh Sales $(0.09) Retail Transmission Revenue $(0.01) = Net Decrease $(0.06) |
|
|
ARIZONA ECONOMIC INDICATORS Nonresidential Building Vacancy – Metro Phoenix New Home Sales & Single Family Permits Home Prices – Metro Phoenix Job Growth (Total Nonfarm) - Arizona Value Relative to Jan ‘05 YTD YTD Vacancy Rate Office Retail YoY Change YTD |
|
|
ARIZONA ECONOMIC INDICATORS Annual Growth 85% of retail sales growth driven by customer growth, excluding impacts of customer conservation, energy efficiency and distributed renewable generation initiatives Retail customer growth to average 2% annually 2013-2015 Weather-normalized retail sales growth less than 1% after customer initiatives mentioned above Projected |
|
|
ON-GOING EPS GUIDANCE AS OF OCTOBER 31, 2013 See key factor and assumptions in appendix. Affirming 2013 Guidance and Introducing 2014 Guidance |
|
|
APPENDIX |

|
|
Customers with rooftop solar systems do not pay for all of the electric services they use (i.e. rooftop customers still need support from the grid 24 hours a day) These unpaid costs are then paid, through higher rates, by other customers that cannot have or do not want rooftop solar The issue will get bigger over time as applications and installs continue to increase NET METERING Rooftop solar customers still use the grid 24 hours a day TYPICAL GRID INTERACTION FOR ROOFTOP SOLAR |
|
|
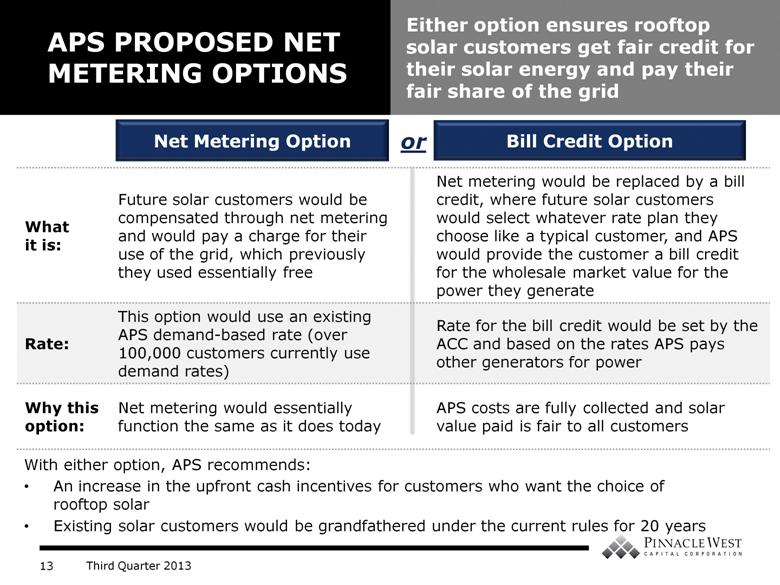
With either option, APS recommends: An increase in the upfront cash incentives for customers who want the choice of rooftop solar Existing solar customers would be grandfathered under the current rules for 20 years APS PROPOSED NET METERING OPTIONS Either option ensures rooftop solar customers get fair credit for their solar energy and pay their fair share of the grid or What it is: Future solar customers would be compensated through net metering and would pay a charge for their use of the grid, which previously they used essentially free Net metering would be replaced by a bill credit, where future solar customers would select whatever rate plan they choose like a typical customer, and APS would provide the customer a bill credit for the wholesale market value for the power they generate Rate: This option would use an existing APS demand-based rate (over 100,000 customers currently use demand rates) Rate for the bill credit would be set by the ACC and based on the rates APS pays other generators for power Why this option: Net metering would essentially function the same as it does today APS costs are fully collected and solar value paid is fair to all customers Net Metering Option Bill Credit Option |
|
|
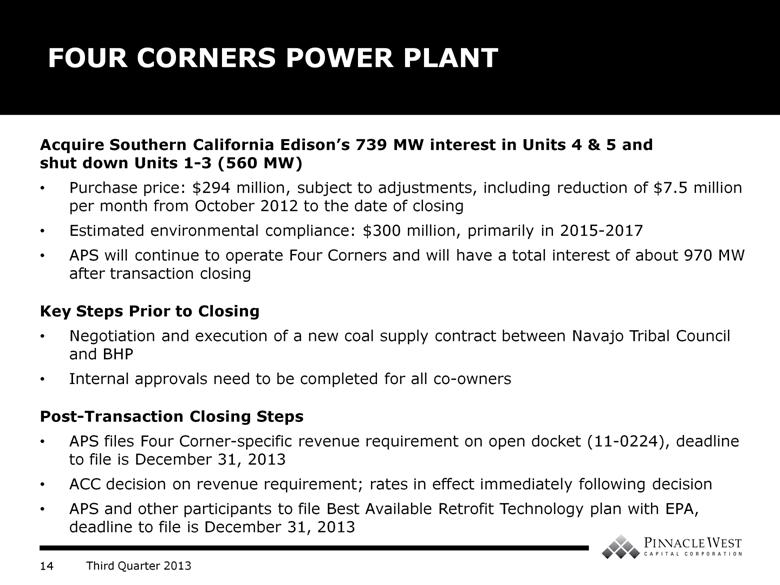
Acquire Southern California Edison’s 739 MW interest in Units 4 & 5 and shut down Units 1-3 (560 MW) Purchase price: $294 million, subject to adjustments, including reduction of $7.5 million per month from October 2012 to the date of closing Estimated environmental compliance: $300 million, primarily in 2015-2017 APS will continue to operate Four Corners and will have a total interest of about 970 MW after transaction closing Key Steps Prior to Closing Negotiation and execution of a new coal supply contract between Navajo Tribal Council and BHP Internal approvals need to be completed for all co-owners Post-Transaction Closing Steps APS files Four Corner-specific revenue requirement on open docket (11-0224), deadline to file is December 31, 2013 ACC decision on revenue requirement; rates in effect immediately following decision APS and other participants to file Best Available Retrofit Technology plan with EPA, deadline to file is December 31, 2013 Our proposal represents a balanced solution to new environmental regulations. FOUR CORNERS POWER PLANT |
|
|
REGULATORY CALENDAR LIST OF SELECTED DOCKETS Docket # 2012 Retail Rate Settlement (including Four Corners rate recovery) E-01345A-11-0224 Energy Efficiency and Integrated Resource Planning* E-00000XX-13-0214 2014 Renewable Energy Standard Implementation Plan E-01345A-13-0140 Net Metering E-01345A-13-0248 * Generic docket |
|
|
2013 ON-GOING EPS GUIDANCE Key Factors & Assumptions as of October 31, 2013 2013 Electricity gross margin* (operating revenues, net of fuel and purchased power expenses) $2.22 - $2.24 billion Retail customer growth about 1.5% Weather-normalized retail electricity sales volume about flat to prior year taking into account effects of customer conservation, energy efficiency and distributed renewable generation initiatives Actual weather through September; normal weather patterns remainder of year Operating expenses* (operations and maintenance, depreciation and amortization, and taxes other than income taxes) $1.37 - $1.40 billion Interest expense, net of allowance for borrowed and equity funds used during construction $160 - $170 million Net income attributable to non-controlling interests ~$35 million Effective tax rate 34% Average diluted common shares outstanding ~111.5 million * Excludes O&M of $129 million, and offsetting revenues, associated with renewable energy and energy efficiency programs. |
|
|
2014 ON-GOING EPS GUIDANCE Key Factors & Assumptions as of October 31, 2013 2014 Electricity gross margin* (operating revenues, net of fuel and purchased power expenses) $2.22 – $2.27 billion Retail customer growth about 2.0% Weather-normalized retail electricity sales volume about +0.5% to prior year taking into account effects of customer conservation, energy efficiency and distributed renewable generation initiatives Normal weather patterns Operating and maintenance* $790 – $810 million Other operating expenses (depreciation and amortization, Four Corners deferrals, and taxes other than income taxes) $595 - $615 million Interest expense, net of allowance for borrowed and equity funds used during construction $170 - $180 million Net income attributable to non-controlling interests ~$35 million Effective tax rate 34% Average diluted common shares outstanding ~111.5 million * Excludes O&M of $119 million, and offsetting revenues, associated with renewable energy and energy efficiency programs. |
|
|
2013 – 2015 FINANCIAL OUTLOOK Key Factors & Assumptions as of October 31, 2013 Assumption Impact Retail customer growth Expected to average 2% annually (2013-2015) Modestly improving Arizona and U.S. economic conditions Weather-normalized retail electricity sales volume growth Less than 1% after customer conservation and energy efficiency and distributed renewable generation initiatives Weather Actual weather through September 2013; normal weather patterns thereafter Assumption Impact AZ Sun Program Additions to flow through RES until next base rate case First 50 MW of AZ Sun is recovered through base rates Lost Fixed Cost Recovery (LFCR) Offsets 30-40% of revenues lost due to ACC-mandated energy efficiency and distributed renewable generation initiatives Environmental Improvement Surcharge (EIS) Assumed to recover up to $5 million annually of carrying costs for government-mandated environmental capital expenditures Power Supply Adjustor (PSA) 100% pass-through as of July 1, 2012 Transmission Cost Adjustor (TCA) TCA is filed each May and automatically goes into rates effective June 1 Beginning July 1, 2012 following conclusion of the regulatory settlement, transmission revenue is accrued each month as it is earned. Four Corners Acquisition Pending transaction closing Potential Property Tax Deferrals (2012 retail rate settlement) – Assume 60% of property tax increases relate to tax rates, therefore, will be eligible for deferrals (Deferral rates: 50% in 2013; 75% in 2014 and thereafter) Gross Margin – Customer Growth and Weather Gross Margin – Related to 2012 Retail Rate Settlement |
|
|
GROSS MARGIN EFFECTS OF WEATHER VARIANCES VS. NORMAL $8 Million $10 Million $19 Million Pretax Millions All periods recalculated to confirm to current 10-year rolling average. |
|
|
QUARTERLY MARK-TO-MARKET ON HEDGE CONTRACTS* 2011 2012 2013 Pretax Millions * Related to APS 10% share under Power Supply Adjustor (PSA), net of related deferrals, effective through June 30, 2012. |
|
|
RENEWABLE ENERGY AND DEMAND SIDE MANAGEMENT EXPENSES* $150 Million $124 Million $106 Million * O&M expenses related to Renewable Energy Standard, Demand Side Management and similar regulatory programs are offset by comparable revenue amounts. |
|
|
NON-GAAP EPS RECONCILIATION YTD 2013 VS. YTD 2012 EPS 2013 2012 Change EPS as reported 3.44 $ 3.25 $ 0.19 $ Adjustments: Loss from discontinued operations - 0.01 (0.01) On-going EPS 3.44 $ 3.26 $ 0.18 $ Nine Months Ended September 30, |
|
|
NON-GAAP MEASURE RECONCILIATION GROSS MARGIN $ millions pretax, except per share amounts 2013 2012 Operating revenues* 1,152 $ 1,109 $ Fuel and purchased power expenses* (351) (303) Gross margin 801 806 (0.03) $ Less Renewable energy (excluding AZ Sun), energy efficiency and similar regulatory programs (41) (35) (0.03) Gross margin - adjusted 760 $ 771 $ (0.06) $ * Line items from Consolidated Statements of Income Three Months Ended September 30, EPS Change |