Attached files
| file | filename |
|---|---|
| 8-K - 8-K - CoreSite Realty Corp | a13-23092_18k.htm |
| EX-99.1 - EX-99.1 - CoreSite Realty Corp | a13-23092_1ex99d1.htm |
Exhibit 99.2

Earnings Release and
Supplemental Information
Quarter Ended September 30, 2013
|
Table of Contents |
|

|
Overview |
|
|
|
Earnings Release |
|
3 |
|
Company Profile |
|
8 |
|
Summary of Financial Data |
|
10 |
|
|
|
|
|
Financial Statements |
|
|
|
Consolidated Balance Sheets |
|
11 |
|
Consolidated Statements of Operations |
|
12 |
|
Reconciliations of Net Income to FFO, AFFO and EBITDA |
|
13 |
|
|
|
|
|
Operating Portfolio |
|
|
|
Operating Properties |
|
14 |
|
Leasing Statistics |
|
15 |
|
Geographic Diversification and 10 Largest Customers |
|
17 |
|
|
|
|
|
Development Summary and Capital Expenditures |
|
18 |
|
|
|
|
|
Capital Structure |
|
|
|
Market Capitalization and Debt Summary |
|
19 |
|
Interest Summary and Debt Covenants |
|
20 |
|
|
|
|
|
2013 Guidance |
|
21 |
|
|
|
|
|
Appendix |
|
22 |

© Copyright 2013 CoreSite. All Rights Reserved. | Quarter Ended September 30, 2013
|
CoreSite Reports
|
|

DENVER, CO – October 31, 2013
CoreSite Realty Corporation (NYSE: COR), a leading provider of network-dense, cloud-enabled data center solutions, today announced financial results for the third quarter ended September 30, 2013.
Quarterly Highlights
· Reported third-quarter funds from operations (“FFO”) of $0.47 per diluted share and unit, representing a 17.5% increase year-over-year
· Reported third-quarter operating revenue of $60.6 million, representing a 12.8% increase year-over-year
· Executed new and expansion data center leases representing $4.0 million of annualized GAAP rent at a rate of $170 of annualized GAAP rent per square foot
· Realized rent growth on signed renewals of 6.6% on a cash basis and 10.7% on a GAAP basis and rental churn of 2.7%
· Commenced 37,243 net rentable square feet of new and expansion leases with annualized GAAP rent of $180 per square foot
Tom Ray, CoreSite’s Chief Executive Officer, commented, “Our third-quarter results reflect continued execution and focus upon our business plan. We executed 106 new and expansion leases in the quarter including agreements with 21 new customers, 67% of which were in our network and cloud verticals, and we executed a record 44 leases signed with customers deploying in more than one location.” Mr. Ray continued, “Our development activities are progressing and we look forward to delivering our build-to suit at SV5 as well as our first computer room at NY2 toward the end of the fourth quarter. Furthermore, we expect our additional development project at LA2 to deliver in the first quarter of 2014 and our VA2 project in Northern Virginia to deliver at the end of the second quarter in 2014. We remain focused upon and optimistic regarding executing upon our strategy of differentiating CoreSite as a leading provider of performance-sensitive colocation products and services, enhanced by a premium customer experience.”
|
|
|
|
|
|
|
|
|
|
|
|
|
|
|
|
| |
|
|
|
|
|
|
|
| |
|
|
|
|
|
|
|
| |
|
Overview |
Financial |
Operating |
Development
|
Capital |
2013 |
Appendix |

© Copyright 2013 CoreSite. All Rights Reserved. | Quarter Ended September 30, 2013
|
Quarter Ended September 30, 2013
|
|
Financial Results
CoreSite reported FFO attributable to shares and units of $21.9 million for the three months ended September 30, 2013, a 17.3% increase year-over-year and an increase of 3.6% quarter-over-quarter. On a per diluted share and unit basis, FFO increased 17.5% to $0.47 for the three months ended September 30, 2013, as compared to $0.40 per diluted share and unit for the three months ended September 30, 2012. Total operating revenue for the three months ended September 30, 2013, was $60.6 million, a 12.8% increase year over year. Revenue growth in the third quarter was diluted by 1.1% due to our customer at SV3 decreasing their metered power draw as they continue to transition certain applications out of that facility. CoreSite reported net income attributable to common shares of $2.9 million, or $0.14 per diluted share.
Sales Activity
CoreSite executed 106 new and expansion data center leases representing $4.0 million of annualized GAAP rent during the third quarter, comprised of 23,294 NRSF at a weighted average GAAP rate of $170 per NRSF.
CoreSite’s renewal leases signed in the third quarter totaled $4.6 million in annualized GAAP rent, comprised of 29,567 NRSF at a weighted average GAAP rate of $155 per NRSF, reflecting a 6.6% increase in rent on a cash basis and a 10.7% increase on a GAAP basis. The third-quarter rental churn rate was 2.7%.
CoreSite’s third-quarter data center lease commencements totaled 37,243 NRSF at a weighted average GAAP rental rate of $180 per NRSF, which represents $6.7 million of annualized GAAP rent.
Development Activity
CoreSite had 249,961 NRSF of data center space under construction at four key locations as of September 30, 2013. The projects under construction include new data centers at SV5 (San Francisco Bay Area), VA2 (Northern Virginia), NY2 (New York market) and additional inventory at LA2 (Los Angeles). As of September 30, 2013, CoreSite had incurred $111.5 million of the estimated $199.6 million required to complete these projects.
|
|
|
|
|
|
|
|
|
|
|
|
|
|
|
|
| |
|
|
|
|
|
|
|
| |
|
|
|
|
|
|
|
| |
|
Overview |
Financial |
Operating |
Development
|
Capital |
2013 |
Appendix |
© Copyright 2013 CoreSite. All Rights Reserved. | Quarter Ended September 30, 2013
|
Quarter Ended September 30, 2013
|
|

Balance Sheet and Liquidity
As of September 30, 2013, CoreSite had $166.6 million of total long-term debt equal to 1.5x annualized adjusted EBITDA and $281.6 million of long-term debt and preferred stock equal to 2.6x annualized adjusted EBITDA.
At quarter end, CoreSite had $289.3 million of total liquidity, consisting primarily of available capacity under its credit facility.
Dividend
On August 30, 2013, CoreSite announced a dividend of $0.27 per share of common stock and common stock equivalents for the third quarter of 2013. The dividend was paid on October 15, 2013, to shareholders of record on September 30, 2013.
CoreSite also announced on August 30, 2013, a dividend of $0.4531 per share of Series A preferred stock for the period July 15, 2013, to October 14, 2013. The preferred dividend was paid on October 15, 2013, to shareholders of record on September 30, 2013.
2013 Guidance
CoreSite is tightening its FFO per share and OP unit guidance and now expects FFO per share in the range of $1.80 to $1.84, compared to the previous range of $1.76 to $1.84.
This outlook is predicated on current economic conditions, internal assumptions about CoreSite’s customer base, and the supply and demand dynamics of the markets in which CoreSite operates. The guidance does not include the impact of any future financing, investment or disposition activities.
Upcoming Conferences and Events
CoreSite will participate in NAREIT’s REITWorld conference from November 13 through November 14 at the San Francisco Marriott Marquis in San Francisco, CA.
|
|
|
|
|
|
|
|
|
|
|
|
|
|
|
|
| |
|
|
|
|
|
|
|
| |
|
|
|
|
|
|
|
| |
|
Overview |
Financial |
Operating |
Development
|
Capital |
2013 |
Appendix |
© Copyright 2013 CoreSite. All Rights Reserved. | Quarter Ended September 30, 2013
|
Quarter Ended September 30, 2013
|
|
Conference Call Details
CoreSite will host a conference call on October 31, 2013, at 12:00 p.m., Eastern time (10:00 a.m., Mountain time), to discuss its financial results, current business trends and market conditions.
The call can be accessed live over the phone by dialing 877-407-3982 for domestic callers or 201 -493-6780 for international callers. A replay will be available shortly after the call and can be accessed by dialing 877-870-5176 for domestic callers or 858-384-5517 for international callers. The passcode for the replay is 10000326. The replay will be available until November 7, 2013.
Interested parties may also listen to a simultaneous webcast of the conference call by logging on to CoreSite’s website at www.CoreSite.com and clicking on the “Investors” tab. The on-line replay will be available for a limited time beginning immediately following the call.
About CoreSite
CoreSite Realty Corporation (NYSE: COR) propels customer growth and long-term competitive advantage by connecting Internet, private networking, mobility, and cloud communities within and across its fourteen high-performance data center campuses and through the CoreSite Mesh. More than 750 of the world’s leading carriers and mobile operators, content and cloud providers, media and entertainment companies, and global enterprises choose CoreSite to run their performance-sensitive applications and to connect and do business with each other. With direct access to more than 275 carriers and ISPs, North America inter-site connectivity and the nation’s first Open Cloud Exchange that provides access to the “most lit” buildings and cloud “on-ramps,” CoreSite provides easy, efficient and valuable gateways to global business opportunities. For more information, visit.
CoreSite Investor Relations Contact
Greer Aviv | CoreSite Investor Relations Director
+1 303.405.1012 | +1 303.222.7276
Greer.Aviv@CoreSite.com
|
|
|
|
|
|
|
|
|
|
|
|
|
|
|
|
| |
|
|
|
|
|
|
|
| |
|
|
|
|
|
|
|
| |
|
Overview |
Financial |
Operating |
Development
|
Capital |
2013 |
Appendix |

© Copyright 2013 CoreSite. All Rights Reserved. | Quarter Ended September 30, 2013
|
Quarter Ended September 30, 2013
|
|

Forward Looking Statements
This earnings release and accompanying supplemental information may contain forward-looking statements within the meaning of the federal securities laws. Forward-looking statements relate to expectations, beliefs, projections, future plans and strategies, anticipated events or trends and similar expressions concerning matters that are not historical facts. In some cases, you can identify forward-looking statements by the use of forward-looking terminology such as “believes,” “expects,” “may,” “will,” “should,” “seeks,” “approximately,” “intends,” “plans,” “pro forma,” “estimates” or “anticipates” or the negative of these words and phrases or similar words or phrases that are predictions of or indicate future events or trends and that do not relate solely to historical matters. Forward-looking statements involve known and unknown risks, uncertainties, assumptions and contingencies, many of which are beyond CoreSite’s control, that may cause actual results to differ significantly from those expressed in any forward-looking statement. These risks include, without limitation: the geographic concentration of the company’s data centers in certain markets and any adverse developments in local economic conditions or the demand for data center space in these markets; fluctuations in interest rates and increased operating costs; difficulties in identifying properties to acquire and completing acquisitions; significant industry competition; the company’s failure to obtain necessary outside financing; the company’s failure to qualify or maintain its status as a REIT; financial market fluctuations; changes in real estate and zoning laws and increases in real property tax rates; and other factors affecting the real estate industry generally. All forward-looking statements reflect the company’s good faith beliefs, assumptions and expectations, but they are not guarantees of future performance. Furthermore, the company disclaims any obligation to publicly update or revise any forward-looking statement to reflect changes in underlying assumptions or factors, of new information, data or methods, future events or other changes. For a further discussion of these and other factors that could cause the company’s future results to differ materially from any forward-looking statements, see the section entitled “Risk Factors” in the company’s most recent annual report on Form 10-K, and other risks described in documents subsequently filed by the company from time to time with the Securities and Exchange Commission.
|
|
|
|
|
|
|
|
|
|
|
|
|
|
|
|
| |
|
|
|
|
|
|
|
| |
|
|
|
|
|
|
|
| |
|
Overview |
Financial |
Operating |
Development
|
Capital |
2013 |
Appendix |

© Copyright 2013 CoreSite. All Rights Reserved. | Quarter Ended September 30, 2013
|
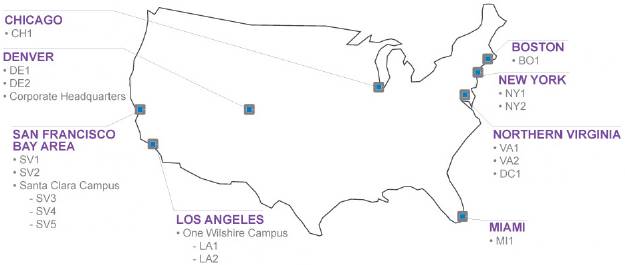
Company Profile
|
|

The company serves over 750 customers across more than 2.5 million square feet, including NRSF held for development, and provides access to over 275 network service providers.

|
|
|
|
|
|
|
|
|
|
|
|
|
|
|
|
| |
|
|
|
|
|
|
|
| |
|
|
|
|
|
|
|
| |
|
Overview |
Financial |
Operating |
Development
|
Capital |
2013 |
Appendix |

© Copyright 2013 CoreSite. All Rights Reserved. | Quarter Ended September 30, 2013
|
Company Profile
|
|
NYSE-traded with a strong balance sheet
· NYSE: COR (2010); REIT status
· Predecessor entities founded in 2000
· Equity market cap: $1.6 billion at September 30, 2013
· Growth capacity: 1.5x debt to annualized adjusted EBITDA and 2.6x debt and preferred stock to annualized adjusted EBITDA at September 30, 2013
Dense network connectivity and ecosystems
· Over 275 network service providers
· Over 750 customers and 15,000 cross-connects
· Key ecosystems of customers and partners consisting of 34% networks & mobility, 25% cloud & IT service providers, 20% enterprise, 14% digital content & multimedia, and 7% systems integrators and managed services providers
· Partner-enabled value-added services supporting cloud computing
Scalable, broad platform in Tier-1 markets
· 14 operating data centers, 3 new data centers under construction
· 8 top North American markets located in network, financial, cloud and commerce hubs
· 2.5+ million gross square feet
· Ability to nearly double data center footprint on land and buildings currently owned
· 300+ employees
Product, services & operational excellence
· Cabinet, standard or custom cage, computer rooms
· Cross-connects, Any2 Internet Exchange, Cloud Exchange – Ethernet
· Breakered and metered power
· Six 9s uptime since 2010
|
|
|
|
|
|
|
|
|
|
|
|
|
|
|
|
| |
|
|
|
|
|
|
|
| |
|
|
|
|
|
|
|
| |
|
Overview |
Financial |
Operating |
Development
|
Capital |
2013 |
Appendix |

© Copyright 2013 CoreSite. All Rights Reserved. | Quarter Ended September 30, 2013
|
Summary of Financial Data
|
|

(in thousands, except share, per share and NRSF data)
|
|
|
Three Months Ended |
|
Nine Months Ended |
| |||||||||||
|
|
|
|
|
|
| |||||||||||
|
Summary of Results |
|
September 30, |
|
June 30, |
|
September 30, |
|
September 30, |
|
September 30, |
| |||||
|
Operating revenues |
|
$ |
60,635 |
|
$ |
57,667 |
|
$ |
53,762 |
|
$ |
173,393 |
|
$ |
151,682 |
|
|
Net income |
|
8,509 |
|
7,879 |
|
2,947 |
|
22,583 |
|
6,138 |
| |||||
|
Net income attributable to common shares |
|
2,901 |
|
2,618 |
|
1,320 |
|
7,368 |
|
2,749 |
| |||||
|
|
|
|
|
|
|
|
|
|
|
|
| |||||
|
Funds from operations (FFO) to shares and units |
|
21,868 |
|
21,103 |
|
18,636 |
|
62,224 |
|
52,271 |
| |||||
|
Adjusted funds from operations (AFFO) |
|
20,562 |
|
20,405 |
|
17,155 |
|
58,675 |
|
46,468 |
| |||||
|
EBITDA |
|
25,683 |
|
25,127 |
|
21,642 |
|
73,564 |
|
59,098 |
| |||||
|
Adjusted EBITDA |
|
27,467 |
|
27,209 |
|
23,491 |
|
79,430 |
|
65,207 |
| |||||
|
|
|
|
|
|
|
|
|
|
|
|
| |||||
|
Per share - diluted: |
|
|
|
|
|
|
|
|
|
|
| |||||
|
Net income attributable to common shares |
|
$ |
0.14 |
|
$ |
0.12 |
|
$ |
0.06 |
|
$ |
0.34 |
|
$ |
0.13 |
|
|
FFO per common share and OP unit |
|
$ |
0.47 |
|
$ |
0.45 |
|
$ |
0.40 |
|
$ |
1.33 |
|
$ |
1.13 |
|
|
|
|
|
|
|
|
|
|
|
|
|
| |||||
|
|
|
As of |
| |||||||||||||
|
|
|
|
| |||||||||||||
|
|
|
September 30, |
|
June 30, |
|
March 31, |
|
December 31, |
|
September 30, |
| |||||
|
|
|
|
|
|
|
|
|
|
|
|
| |||||
|
Dividend Activity |
|
|
|
|
|
|
|
|
|
|
| |||||
|
Dividends declared per common share and OP unit |
|
$ |
0.27 |
|
$ |
0.27 |
|
$ |
0.27 |
|
$ |
0.27 |
|
$ |
0.18 |
|
|
AFFO payout ratio |
|
61% |
|
62% |
|
71% |
|
78% |
|
49% |
| |||||
|
|
|
|
|
|
|
|
|
|
|
|
| |||||
|
Operating Portfolio Statistics |
|
|
|
|
|
|
|
|
|
|
| |||||
|
Operating data center properties |
|
14 |
|
14 |
|
14 |
|
14 |
|
14 |
| |||||
|
Operating data center NRSF |
|
1,225,596 |
|
1,225,596 |
|
1,208,365 |
|
1,208,365 |
|
1,196,571 |
| |||||
|
Data center NRSF occupied |
|
987,416 |
|
986,646 |
|
963,442 |
|
930,245 |
|
922,018 |
| |||||
|
Data center % occupied |
|
80.6% |
|
80.5% |
|
79.7% |
|
77.0% |
|
77.1% |
| |||||
|
|
|
|
|
|
|
|
|
|
|
|
| |||||
|
Market Capitalization, Debt & Preferred Stock |
|
|
|
|
|
|
|
|
|
|
| |||||
|
Total enterprise value |
|
$ |
1,869,100 |
|
$ |
1,734,594 |
|
$ |
1,861,410 |
|
$ |
1,462,710 |
|
$ |
1,406,509 |
|
|
Total debt outstanding |
|
166,625 |
|
132,000 |
|
111,375 |
|
59,750 |
|
154,365 |
| |||||
|
Total debt and preferred stock outstanding |
|
281,625 |
|
247,000 |
|
226,375 |
|
174,750 |
|
154,365 |
| |||||
|
|
|
|
|
|
|
|
|
|
|
|
| |||||
|
Debt to: |
|
|
|
|
|
|
|
|
|
|
| |||||
|
Annualized Adjusted EBITDA |
|
1.5x |
|
1.2x |
|
1.1x |
|
0.6x |
|
1.6x |
| |||||
|
Undepreciated book value of total assets |
|
15.0% |
|
12.7% |
|
11.1% |
|
6.3% |
|
16.8% |
| |||||
|
Debt & Preferred Stock to: |
|
|
|
|
|
|
|
|
|
|
| |||||
|
Annualized Adjusted EBITDA |
|
2.6x |
|
2.3x |
|
2.3x |
|
1.8x |
|
1.6x |
| |||||
|
Undepreciated book value of total assets |
|
25.4% |
|
23.8% |
|
22.5% |
|
18.4% |
|
16.8% |
| |||||
|
|
|
|
|
|
|
|
|
|
|
|
|
|
|
|
| |
|
|
|
|
|
|
|
| |
|
|
|
|
|
|
|
| |
|
Overview |
Financial |
Operating |
Development
|
Capital |
2013 |
Appendix |
© Copyright 2013 CoreSite. All Rights Reserved. | Quarter Ended September 30, 2013
|
Consolidated Balance Sheets
|
|

(in thousands)
|
|
|
September 30, |
|
December 31, |
| |||
|
Assets: |
|
|
|
|
| |||
|
Investments in real estate: |
|
|
|
|
| |||
|
Land |
|
$ |
76,227 |
|
$ |
85,868 |
| |
|
Building and building improvements |
|
668,580 |
|
596,405 |
| |||
|
|
Leasehold improvements |
|
92,996 |
|
85,907 |
| ||
|
|
|
837,803 |
|
768,180 |
| |||
|
|
Less: Accumulated depreciation and amortization |
|
(142,133) |
|
(105,433 |
) | ||
|
Net investment in operating properties |
|
695,670 |
|
662,747 |
| |||
|
Construction in progress |
|
157,200 |
|
61,328 |
| |||
|
|
Net investments in real estate |
|
852,870 |
|
724,075 |
| ||
|
Cash and cash equivalents |
|
702 |
|
8,130 |
| |||
|
Accounts and other receivables, net |
|
11,095 |
|
9,901 |
| |||
|
Lease intangibles, net |
|
12,460 |
|
19,453 |
| |||
|
Goodwill |
|
41,191 |
|
41,191 |
| |||
|
Other assets |
|
47,583 |
|
42,582 |
| |||
|
|
|
|
|
|
|
| ||
|
|
Total assets |
|
$ |
965,901 |
|
$ |
845,332 |
|
|
|
|
|
|
|
| |||
|
Liabilities and equity: |
|
|
|
|
| |||
|
Liabilities |
|
|
|
|
| |||
|
Revolving credit facility |
|
$ |
108,000 |
|
$ |
- |
| |
|
Mortgage loans payable |
|
58,625 |
|
59,750 |
| |||
|
Accounts payable and accrued expenses |
|
75,248 |
|
50,624 |
| |||
|
Deferred rent payable |
|
9,579 |
|
4,329 |
| |||
|
Acquired below-market lease contracts, net |
|
7,050 |
|
8,539 |
| |||
|
Prepaid rent and other liabilities |
|
11,697 |
|
11,317 |
| |||
|
|
Total liabilities |
|
270,199 |
|
134,559 |
| ||
|
|
|
|
|
|
| |||
|
Stockholders’ equity |
|
|
|
|
| |||
|
Series A cumulative preferred stock |
|
115,000 |
|
115,000 |
| |||
|
Common stock, par value $0.01 |
|
208 |
|
207 |
| |||
|
Additional paid-in capital |
|
265,483 |
|
259,009 |
| |||
|
|
Distributions in excess of net income |
|
(45,953) |
|
(35,987 |
) | ||
|
Total stockholders’ equity |
|
334,738 |
|
338,229 |
| |||
|
Noncontrolling interests |
|
360,964 |
|
372,544 |
| |||
|
|
Total equity |
|
695,702 |
|
710,773 |
| ||
|
|
|
|
|
|
| |||
|
|
Total liabilities and equity |
|
$ |
965,901 |
|
$ |
845,332 |
|
|
|
|
|
|
|
|
|
|
|
|
|
|
|
|
|
| |
|
|
|
|
|
|
|
| |
|
|
|
|
|
|
|
| |
|
Overview |
Financial |
Operating |
Development
|
Capital |
2013 |
Appendix |
© Copyright 2013 CoreSite. All Rights Reserved. | Quarter Ended September 30, 2013
|
Consolidated
|
|

(in thousands, except share and per share data)
|
|
|
Three Months Ended |
|
Nine Months Ended |
| ||||||||||||
|
|
|
September 30, |
|
June 30, |
|
September 30, |
|
September 30, |
|
September 30, |
| ||||||
|
|
|
2013 |
|
2013 |
|
2012 |
|
2013 |
|
2012 |
| ||||||
|
Operating revenues: |
|
|
|
|
|
|
|
|
|
|
| ||||||
|
|
Rental revenue |
|
$ |
35,283 |
|
$ |
34,205 |
|
$ |
31,603 |
|
$ |
102,590 |
|
$ |
91,837 |
|
|
|
Power revenue |
|
15,979 |
|
14,486 |
|
14,230 |
|
43,994 |
|
39,543 |
| |||||
|
|
Interconnection revenue |
|
7,441 |
|
7,053 |
|
6,177 |
|
21,066 |
|
15,268 |
| |||||
|
|
Tenant reimbursement and other |
|
1,932 |
|
1,923 |
|
1,752 |
|
5,743 |
|
5,034 |
| |||||
|
|
Total operating revenues |
|
60,635 |
|
57,667 |
|
53,762 |
|
173,393 |
|
151,682 |
| |||||
|
|
|
|
|
|
|
|
|
|
|
|
| ||||||
|
Operating expenses: |
|
|
|
|
|
|
|
|
|
|
| ||||||
|
|
Property operating and maintenance |
|
17,368 |
|
15,118 |
|
16,360 |
|
47,013 |
|
46,029 |
| |||||
|
|
Real estate taxes and insurance |
|
2,226 |
|
2,304 |
|
2,158 |
|
6,750 |
|
6,304 |
| |||||
|
|
Depreciation and amortization |
|
16,424 |
|
16,261 |
|
16,583 |
|
48,634 |
|
47,991 |
| |||||
|
|
Sales and marketing |
|
3,206 |
|
3,936 |
|
2,231 |
|
10,931 |
|
6,941 |
| |||||
|
|
General and administrative |
|
7,045 |
|
6,177 |
|
6,389 |
|
20,225 |
|
18,777 |
| |||||
|
|
Rent |
|
5,082 |
|
4,756 |
|
4,689 |
|
14,631 |
|
13,957 |
| |||||
|
|
Transaction costs |
|
25 |
|
249 |
|
293 |
|
279 |
|
576 |
| |||||
|
|
Total operating expenses |
|
51,376 |
|
48,801 |
|
48,703 |
|
148,463 |
|
140,575 |
| |||||
|
|
|
|
|
|
|
|
|
|
|
|
| ||||||
|
|
Operating income |
|
9,259 |
|
8,866 |
|
5,059 |
|
24,930 |
|
11,107 |
| |||||
|
|
Interest income |
|
14 |
|
2 |
|
5 |
|
18 |
|
12 |
| |||||
|
|
Interest expense |
|
(708) |
|
(783) |
|
(1,595) |
|
(1,930) |
|
(3,922) |
| |||||
|
|
|
|
|
|
|
|
|
|
|
|
|
| |||||
|
|
Income before income taxes |
|
8,565 |
|
8,085 |
|
3,469 |
|
23,018 |
|
7,197 |
| |||||
|
|
Income tax expense |
|
(56) |
|
(206) |
|
(522) |
|
(435) |
|
(1,059) |
| |||||
|
|
|
|
|
|
|
|
|
|
|
|
|
| |||||
|
|
Net income |
|
8,509 |
|
7,879 |
|
2,947 |
|
22,583 |
|
6,138 |
| |||||
|
|
|
|
|
|
|
|
|
|
|
|
|
| |||||
|
|
Net income attributable to noncontrolling interests |
|
3,524 |
|
3,176 |
|
1,627 |
|
8,962 |
|
3,389 |
| |||||
|
|
Net income attributable to CoreSite Realty Corporation |
|
4,985 |
|
4,703 |
|
1,320 |
|
13,621 |
|
2,749 |
| |||||
|
|
Preferred dividends |
|
(2,084) |
|
(2,085) |
|
- |
|
(6,253) |
|
- |
| |||||
|
|
Net income attributable to common shares |
|
$ |
2,901 |
|
$ |
2,618 |
|
$ |
1,320 |
|
$ |
7,368 |
|
$ |
2,749 |
|
|
|
|
|
|
|
|
|
|
|
|
|
|
| |||||
|
|
Net income per share attributable to common shares: |
|
|
|
|
|
|
|
|
|
|
| |||||
|
|
Basic |
|
$ |
0.14 |
|
$ |
0.13 |
|
$ |
0.06 |
|
$ |
0.35 |
|
$ |
0.13 |
|
|
|
Diluted |
|
$ |
0.14 |
|
$ |
0.12 |
|
$ |
0.06 |
|
$ |
0.34 |
|
$ |
0.13 |
|
|
|
|
|
|
|
|
|
|
|
|
|
|
| |||||
|
|
Weighted average common shares outstanding: |
|
|
|
|
|
|
|
|
|
|
| |||||
|
|
Basic |
|
20,871,504 |
|
20,829,375 |
|
20,554,893 |
|
20,793,596 |
|
20,514,713 |
| |||||
|
|
Diluted |
|
21,479,971 |
|
21,445,875 |
|
21,027,635 |
|
21,465,710 |
|
20,890,894 |
| |||||
|
|
|
|
|
|
|
|
|
|
|
|
|
|
|
|
| |
|
|
|
|
|
|
|
| |
|
|
|
|
|
|
|
| |
|
Overview |
Financial |
Operating |
Development
|
Capital |
2013 |
Appendix |
© Copyright 2013 CoreSite. All Rights Reserved. | Quarter Ended September 30, 2013
|
Reconciliations of Net Income
|
|

(in thousands, except share and per share data)
|
Reconciliation of Net Income available to FFO
|
|
|
|
Three Months Ended |
|
Nine Months Ended |
| ||||||||||||
|
|
|
|
|
|
|
|
|
|
|
|
| ||||||
|
|
|
September 30, |
|
June 30, |
|
September 30, |
|
September 30, |
|
September 30, |
| ||||||
|
Net income |
|
$ |
8,509 |
|
$ |
7,879 |
|
$ |
2,947 |
|
$ |
22,583 |
|
$ |
6,138 |
| |
|
|
|
|
|
|
|
|
|
|
|
|
|
|
|
|
|
| |
|
Real estate depreciation and amortization |
|
|
15,443 |
|
15,309 |
|
15,689 |
|
45,894 |
|
46,133 |
| |||||
|
|
|
|
|
|
|
|
|
|
|
|
|
|
|
|
|
| |
|
FFO |
|
$ |
23,952 |
|
$ |
23,188 |
|
$ |
18,636 |
|
$ |
68,477 |
|
$ |
52,271 |
| |
|
|
|
|
|
|
|
|
|
|
|
|
|
|
|
|
|
| |
|
Preferred stock dividends |
|
(2,084) |
|
(2,085) |
|
- |
|
(6,253) |
|
- |
| ||||||
|
|
|
|
|
|
|
|
|
|
|
|
| ||||||
|
FFO available to common shareholders and OP unit holders |
|
$ |
21,868 |
|
$ |
21,103 |
|
$ |
18,636 |
|
$ |
62,224 |
|
$ |
52,271 |
| |
|
|
|
|
|
|
|
|
|
|
|
|
| ||||||
|
Weighted average common shares outstanding - diluted |
|
21,479,971 |
|
21,445,875 |
|
21,027,635 |
|
21,465,710 |
|
20,890,894 |
| ||||||
|
Weighted average OP units outstanding - diluted |
|
25,353,942 |
|
25,353,709 |
|
25,346,805 |
|
25,353,787 |
|
25,345,998 |
| ||||||
|
Total weighted average shares and units outstanding - diluted |
|
46,833,913 |
|
46,799,584 |
|
46,374,440 |
|
46,819,497 |
|
46,236,892 |
| ||||||
|
|
|
|
|
|
|
|
|
|
|
|
| ||||||
|
FFO per common share and OP unit - diluted |
|
$ |
0.47 |
|
$ |
0.45 |
|
$ |
0.40 |
|
$ |
1.33 |
|
$ |
1.13 |
| |
|
Reconciliation of FFO to AFFO
|
|
|
|
Three Months Ended |
|
Nine Months Ended |
| |||||||||||
|
|
|
September 30, |
|
June 30, |
|
September 30, |
|
September 30, |
|
September 30, |
| |||||
|
|
|
2013 |
|
2013 |
|
2012 |
|
2013 |
|
2012 |
| |||||
|
FFO available to common shareholders and unit holders |
|
$ |
21,868 |
|
$ |
21,103 |
|
$ |
18,636 |
|
$ |
62,224 |
|
$ |
52,271 |
|
|
|
|
|
|
|
|
|
|
|
|
|
| |||||
|
Adjustments: |
|
|
|
|
|
|
|
|
|
|
| |||||
|
Amortization of deferred financing costs |
|
445 |
|
427 |
|
435 |
|
1,293 |
|
1,307 |
| |||||
|
Non-cash compensation |
|
1,759 |
|
1,683 |
|
1,556 |
|
5,337 |
|
4,082 |
| |||||
|
Non-real estate depreciation |
|
981 |
|
952 |
|
894 |
|
2,740 |
|
1,858 |
| |||||
|
Straight-line rent adjustment |
|
(539) |
|
(339) |
|
(734) |
|
(970) |
|
(2,877 |
) | |||||
|
Amortization of above and below market leases |
|
(241) |
|
(199) |
|
(444) |
|
(672) |
|
(1,241 |
) | |||||
|
Recurring capital expenditures |
|
(1,174) |
|
(935) |
|
(822) |
|
(3,808) |
|
(2,010 |
) | |||||
|
Tenant improvements |
|
(1,578) |
|
(1,027) |
|
(1,362) |
|
(4,218) |
|
(3,378 |
) | |||||
|
Capitalized leasing commissions |
|
(959) |
|
(1,260) |
|
(1,004) |
|
(3,251) |
|
(3,544 |
) | |||||
|
AFFO available to common shareholders and OP unit holders |
|
$ |
20,562 |
|
$ |
20,405 |
|
$ |
17,155 |
|
$ |
58,675 |
|
$ |
46,468 |
|
|
Reconciliation of Net Income to EBITDA and Adjusted EBITDA
|
|
|
|
Three Months Ended |
|
Nine Months Ended |
| |||||||||||
|
|
|
September 30, |
|
June 30, |
|
September 30, |
|
September 30, |
|
September 30, |
| |||||
|
|
|
2013 |
|
2013 |
|
2012 |
|
2013 |
|
2012 |
| |||||
|
Net income |
|
$ |
8,509 |
|
$ |
7,879 |
|
$ |
2,947 |
|
$ |
22,583 |
|
$ |
6,138 |
|
|
|
|
|
|
|
|
|
|
|
|
|
| |||||
|
Adjustments: |
|
|
|
|
|
|
|
|
|
|
| |||||
|
Interest expense, net of interest income |
|
694 |
|
781 |
|
1,590 |
|
1,912 |
|
3,910 |
| |||||
|
Income taxes |
|
56 |
|
206 |
|
522 |
|
435 |
|
1,059 |
| |||||
|
Depreciation and amortization |
|
16,424 |
|
16,261 |
|
16,583 |
|
48,634 |
|
47,991 |
| |||||
|
EBITDA |
|
$ |
25,683 |
|
$ |
25,127 |
|
$ |
21,642 |
|
$ |
73,564 |
|
$ |
59,098 |
|
|
|
|
|
|
|
|
|
|
|
|
|
| |||||
|
Non-cash compensation |
|
1,759 |
|
1,683 |
|
1,556 |
|
5,337 |
|
4,083 |
| |||||
|
Transaction costs / litigation |
|
25 |
|
399 |
|
293 |
|
529 |
|
2,026 |
| |||||
|
Adjusted EBITDA |
|
$ |
27,467 |
|
$ |
27,209 |
|
$ |
23,491 |
|
$ |
79,430 |
|
$ |
65,207 |
|
|
|
|
|
|
|
|
|
|
|
|
|
|
|
|
|
| |
|
|
|
|
|
|
|
| |
|
|
|
|
|
|
|
| |
|
Overview |
Financial |
Operating |
Development
|
Capital |
2013 |
Appendix |

© Copyright 2013 CoreSite. All Rights Reserved. | Quarter Ended September 30, 2013
|
Operating Properties
|
|

(in thousands, except NRSF data)
|
|
|
|
|
|
|
|
|
|
|
|
|
Pre- |
|
|
|
|
| |||||
|
|
|
|
|
|
|
Office and Light- |
|
|
|
|
|
Stabilized |
|
Development |
|
|
| |||||
|
|
|
Annualized |
|
Data Center(2 ) |
|
Industrial(3 ) |
|
Total |
|
NRSF(7 ) |
|
NRSF(8 ) |
|
Total |
| |||||||
|
|
|
Rent |
|
|
|
Percent |
|
|
|
Percent |
|
|
|
Percent |
|
|
|
|
|
Portfolio |
| |
|
Market/Facilities |
|
($000) (4) |
|
Total |
|
Occupied(5 ) |
|
Total |
|
Occupied(5) |
|
Total(6) |
|
Occupied(5 ) |
|
Total |
|
Total |
|
NRSF(1 ) |
| |
|
Los Angeles One Wilshire Campus |
|
|
|
|
|
|
|
|
|
|
|
|
|
|
|
|
|
|
|
|
| |
|
LA1* |
|
$ |
23,856 |
|
150,278 |
|
75.2 |
% |
7,500 |
|
41.0 |
% |
157,778 |
|
73.6 |
% |
- |
|
- |
|
157,778 |
|
|
LA2 |
|
14,403 |
|
159,617 |
|
87.0 |
|
6,055 |
|
72.7 |
|
165,672 |
|
86.4 |
|
31,585 |
|
236,902 |
|
434,159 |
| |
|
Los Angeles Total |
|
38,259 |
|
309,895 |
|
81.3 |
|
13,555 |
|
55.2 |
|
323,450 |
|
80.2 |
|
31,585 |
|
236,902 |
|
591,937 |
| |
|
|
|
|
|
|
|
|
|
|
|
|
|
|
|
|
|
|
|
|
|
|
| |
|
San Francisco Bay |
|
|
|
|
|
|
|
|
|
|
|
|
|
|
|
|
|
|
|
|
| |
|
SV1 |
|
11,366 |
|
84,045 |
|
87.3 |
|
206,255 |
|
80.2 |
|
290,300 |
|
82.3 |
|
- |
|
- |
|
290,300 |
| |
|
SV2 |
|
6,186 |
|
76,676 |
|
65.5 |
|
- |
|
- |
|
76,676 |
|
65.5 |
|
- |
|
- |
|
76,676 |
| |
|
Santa Clara Campus |
|
19,305 |
|
119,067 |
|
82.8 |
|
71,196 |
|
91.7 |
|
190,263 |
|
86.1 |
|
31,497 |
|
274,490 |
|
496,250 |
| |
|
San Francisco Bay Total |
|
36,857 |
|
279,788 |
|
79.5 |
|
277,451 |
|
83.2 |
|
557,239 |
|
81.3 |
|
31,497 |
|
274,490 |
|
863,226 |
| |
|
|
|
|
|
|
|
|
|
|
|
|
|
|
|
|
|
|
|
|
|
|
| |
|
Northern Virginia |
|
|
|
|
|
|
|
|
|
|
|
|
|
|
|
|
|
|
|
|
| |
|
VA1 |
|
22,169 |
|
201,719 |
|
76.5 |
|
61,050 |
|
79.7 |
|
262,769 |
|
77.2 |
|
- |
|
- |
|
262,769 |
| |
|
VA2 |
|
- |
|
- |
|
- |
|
- |
|
- |
|
- |
|
- |
|
- |
|
198,000 |
|
198,000 |
| |
|
DC1* |
|
2,603 |
|
22,137 |
|
84.6 |
|
- |
|
- |
|
22,137 |
|
84.6 |
|
- |
|
- |
|
22,137 |
| |
|
Northern Virginia Total |
|
24,772 |
|
223,856 |
|
77.3 |
|
61,050 |
|
79.7 |
|
284,906 |
|
77.8 |
|
- |
|
198,000 |
|
482,906 |
| |
|
|
|
|
|
|
|
|
|
|
|
|
|
|
|
|
|
|
|
|
|
|
| |
|
Boston |
|
11,927 |
|
166,026 |
|
93.3 |
|
19,495 |
|
54.2 |
|
185,521 |
|
89.2 |
|
- |
|
87,650 |
|
273,171 |
| |
|
BO1 |
|
|
|
|
|
|
|
|
|
|
|
|
|
|
|
|
|
|
|
|
| |
|
Chicago |
|
11,212 |
|
158,167 |
|
84.0 |
|
4,946 |
|
62.3 |
|
163,113 |
|
83.4 |
|
20,240 |
|
- |
|
183,353 |
| |
|
CH1 |
|
|
|
|
|
|
|
|
|
|
|
|
|
|
|
|
|
|
|
|
| |
|
New York |
|
|
|
|
|
|
|
|
|
|
|
|
|
|
|
|
|
|
|
|
| |
|
NY1* |
|
4,746 |
|
48,404 |
|
67.1 |
|
209 |
|
100.0 |
|
48,613 |
|
67.3 |
|
- |
|
- |
|
48,613 |
| |
|
NY2 |
|
- |
|
- |
|
- |
|
- |
|
- |
|
- |
|
- |
|
- |
|
283,000 |
|
283,000 |
| |
|
New York Total |
|
4,746 |
|
48,404 |
|
67.1 |
|
209 |
|
100.0 |
|
48,613 |
|
67.3 |
|
- |
|
283,000 |
|
331,613 |
| |
|
|
|
|
|
|
|
|
|
|
|
|
|
|
|
|
|
|
|
|
|
|
| |
|
Miami |
|
1,676 |
|
30,176 |
|
44.2 |
|
1,934 |
|
57.9 |
|
32,110 |
|
45.0 |
|
- |
|
13,154 |
|
45,264 |
| |
|
MI1 |
|
|
|
|
|
|
|
|
|
|
|
|
|
|
|
|
|
|
|
|
| |
|
Denver |
|
|
|
|
|
|
|
|
|
|
|
|
|
|
|
|
|
|
|
|
| |
|
DE1* |
|
646 |
|
4,144 |
|
80.9 |
|
- |
|
- |
|
4,144 |
|
80.9 |
|
- |
|
- |
|
4,144 |
| |
|
DE2* |
|
143 |
|
5,140 |
|
66.3 |
|
- |
|
- |
|
5,140 |
|
66.3 |
|
- |
|
- |
|
5,140 |
| |
|
Denver Total |
|
789 |
|
9,284 |
|
72.8 |
|
- |
|
- |
|
9,284 |
|
72.8 |
|
- |
|
- |
|
9,284 |
| |
|
Total Facilities |
|
$ |
130,238 |
|
1,225,596 |
|
80.6 |
% |
378,640 |
|
79.7 |
% |
1,604,236 |
|
80.4 |
% |
83,322 |
|
1,093,196 |
|
2,780,754 |
|
|
* Indicates properties in which we hold a leasehold interest. | ||
|
(1) |
|
Represents the square feet at each building under lease as specified in existing customer lease agreements plus management’s estimate of space available for lease to customers based on engineers’ drawings and other factors, including required data center support space (such as mechanical, telecommunications and utility rooms) and building common areas. Total NRSF at a given facility includes the total stabilized operating NRSF, pre-stabilized NRSF and development NRSF, but excludes our office space at a facility and our corporate headquarters. |
|
|
|
|
|
(2) |
|
Represents the NRSF at each operating facility that is currently occupied or readily available for lease as data center space. Both occupied and available data center NRSF includes a factor to account for a customer’s proportionate share of the required data center support space (such as the mechanical, telecommunications and utility rooms) and building common areas, which may be updated on a periodic basis to reflect the most current build-out of our properties. |
|
|
|
|
|
(3) |
|
Represents the NRSF at each operating facility that is currently occupied or readily available for lease as space other than data center space, which is typically space offered for office or light-industrial uses. |
|
|
|
|
|
(4) |
|
Represents the monthly contractual rent under existing commenced customer leases as of September 30, 2013, multiplied by 12. This amount reflects total annualized base rent before any one-time or non-recurring rent abatements and excludes power revenue, interconnection revenue and operating expense reimbursement. On a gross basis, our annualized rent was approximately $135.7 million as of September 30, 2013, which reflects the addition of $5.5 million in operating expense reimbursements to contractual net rent under modified gross and triple-net leases. |
|
|
|
|
|
(5) |
|
Includes customer leases that have commenced and are occupied as of September 30, 2013. The percent occupied is determined based on leased square feet as a proportion of total operating NRSF. The percent occupied for data center space, office and light industrial space, and space in total would have been 82.2%, 79.7%, and 81.6%, respectively, if all leases signed in current and prior periods had commenced. |
|
|
|
|
|
(6) |
|
Represents the NRSF at an operating facility currently occupied or readily available for lease. This excludes existing vacant space held for development and pre-stabilized NRSF. |
|
|
|
|
|
(7) |
|
Represents pre-stabilized NRSF of projects/facilities which recently have been developed and are in the initial lease-up phase. Effective January 1, 2013, new pre-stabilized projects/facilities are excluded from stabilized operating NRSF. Pre-stabilized projects/facilities become stabilized operating properties at the earlier of achievement of 85% occupancy or 24 months after development completion. |
|
|
|
|
|
(8) |
|
Represents vacant space and entitled land in our portfolio that requires significant capital investment in order to develop into data center facilities as of September 30, 2013. Includes NRSF under construction for which substantial activities are ongoing to prepare the property for its intended use following development. |
|
|
|
|
|
|
|
|
|
|
|
|
|
|
|
|
| |
|
|
|
|
|
|
|
| |
|
|
|
|
|
|
|
| |
|
Overview |
Financial |
Operating |
Development
|
Capital |
2013 |
Appendix |
© Copyright 2013 CoreSite. All Rights Reserved. | Quarter Ended September 30, 2013
|
Leasing Statistics
|
|

|
Data Center Leasing Activity
|
|
|
|
|
|
|
|
|
|
GAAP |
|
GAAP |
|
|
|
| |||||
|
|
|
Leasing |
|
Number |
|
Total |
|
Annualized |
|
Annualized |
|
Rental |
Cash |
GAAP | |||||
|
|
|
Activity |
|
of |
|
Leased |
|
Rent per |
|
Rent |
|
Churn |
Rent |
Rent | |||||
|
|
|
Period |
|
Leases(1) |
|
NRSF(2) |
|
NRSF |
|
(000s) |
|
Rate(3) |
(4) |
(4) | |||||
|
|
|
|
|
|
|
|
|
|
|
|
|
|
|
|
|
|
| ||
|
New/expansion leases commenced |
|
YTD 2013 |
|
320 |
|
119,291 |
|
$ |
162 |
|
$ |
19,276 |
|
|
|
|
|
|
|
|
|
Q3 2013 |
|
110 |
|
37,243 |
|
180 |
|
6,688 |
|
|
|
|
|
|
| |||
|
|
|
Q2 2013 |
|
121 |
|
42,672 |
|
147 |
|
6,267 |
|
|
|
|
|
|
| ||
|
|
|
Q1 2013 |
|
89 |
|
39,376 |
|
161 |
|
6,320 |
|
|
|
|
|
|
| ||
|
|
|
Q4 2012 |
|
100 |
|
21,372 |
|
137 |
|
2,924 |
|
|
|
|
|
|
| ||
|
|
|
Q3 2012 |
|
92 |
|
39,991 |
|
146 |
|
5,851 |
|
|
|
|
|
|
| ||
|
|
|
|
|
|
|
|
|
|
|
|
|
|
|
|
|
|
| ||
|
New/expansion leases signed |
|
YTD 2013 |
|
331 |
|
96,903 |
|
$ |
153 |
|
$ |
14,831 |
|
|
|
|
|
|
|
|
|
Q3 2013 |
|
106 |
|
23,294 |
|
170 |
|
3,965 |
|
|
|
|
|
|
| |||
|
|
|
Q2 2013 |
|
115 |
|
30,810 |
|
188 |
|
5,782 |
|
|
|
|
|
|
| ||
|
|
|
Q1 2013 |
|
110 |
|
42,799 |
|
119 |
|
5,084 |
|
|
|
|
|
|
| ||
|
|
|
Q4 2012 |
|
100 |
|
156,704 |
|
74 |
(5) |
11,583 |
|
|
|
|
|
|
| ||
|
|
|
Q3 2012 |
|
77 |
|
11,387 |
|
177 |
|
2,012 |
|
|
|
|
|
|
| ||
|
|
|
|
|
|
|
|
|
|
|
|
|
|
|
|
|
|
| ||
|
Renewal leases signed |
|
YTD 2013 |
|
292 |
|
121,867 |
|
$ |
138 |
|
$ |
16,867 |
|
5.9 |
% |
3.6 |
% |
12.9 |
% |
|
|
|
Q3 2013 |
|
100 |
|
29,567 |
|
155 |
|
4,575 |
|
2.7 |
% |
6.6 |
% |
10.7 |
% | ||
|
|
|
Q2 2013 |
|
112 |
|
44,702 |
|
166 |
|
7,404 |
|
2.0 |
% |
2.9 |
% (6) |
9.0 |
% (6) | ||
|
|
|
Q1 2013 |
|
80 |
|
47,598 |
|
103 |
|
4,887 |
|
1.1 |
% |
2.0 |
% |
21.6 |
% | ||
|
|
|
Q4 2012 |
|
50 |
|
52,225 |
|
140 |
|
7,323 |
|
2.1 |
% |
11.7 |
% |
15.6 |
% | ||
|
|
|
Q3 2012 |
|
69 |
|
18,332 |
|
164 |
|
3,012 |
|
1.1 |
% |
4.0 |
% |
9.1 |
% | ||
|
(1) |
|
Number of leases represents each agreement with a customer; a lease agreement could include multiple spaces and a customer could have multiple leases. |
|
|
|
|
|
(2) |
|
Total leased NRSF is determined based on contractually leased square feet for leases that have commenced on or before September 30, 2013. We calculate occupancy based on factors in addition to contractually leased square feet, including required data center support space (such as the mechanical, telecommunications and utility rooms) and building common areas. |
|
|
|
|
|
(3) |
|
Rental churn is calculated based on the annualized rental revenue of expired leases terminated in the period, compared with total annualized rental revenue at the beginning of the period. |
|
|
|
|
|
(4) |
|
Rent growth represents the increase in rental rates on renewed leases commencing during the period, as compared with the previous rental rates for the same space. |
|
|
|
|
|
(5) |
|
The GAAP Annualized Rent per Leased NRSF for new/expansion leases signed in Q4 2012 includes a 101,250 NRSF build-to-suit lease. Excluding this lease, the GAAP Annualized Rent per Leased NRSF for new/expansion leases signed in Q4 2012 would have been $151. |
|
|
|
|
|
(6) |
|
These amounts have been modified from the previously reported results of 5.4% in cash rent growth and 11.7% in GAAP rent growth due to a correction in reporting a Q2 2013 renewal at VA1. |
|
|
|
|
|
|
|
|
|
|
|
|
|
|
|
|
| |
|
|
|
|
|
|
|
| |
|
|
|
|
|
|
|
| |
|
Overview |
Financial |
Operating |
Development
|
Capital |
2013 |
Appendix |
© Copyright 2013 CoreSite. All Rights Reserved. | Quarter Ended September 30, 2013
|
Leasing Statistics
|
|

|
Lease Expirations (total operating properties, excluding pre-stabilized)
|
|
|
|
|
|
Total |
|
|
|
|
|
|
|
|
|
|
|
Annualize |
| ||||
|
|
|
Number |
|
Operating |
|
Percentage |
|
|
|
Percentage |
|
Annualize |
|
Annualized |
|
Rent Per |
| ||||
|
|
|
of |
|
NRSF of |
|
of Total |
|
Annualized |
|
of |
|
Rent Per |
|
Rent at |
|
Leased |
| ||||
|
|
|
Leases |
|
Expiring |
|
Operating |
|
Rent |
|
Annualized |
|
Leased |
|
Expiration |
|
NRSF at |
| ||||
|
Year of Lease Expiration |
|
Expiring(1) |
|
Leases |
|
NRSF |
|
($000)(2) |
|
Rent |
|
NRSF(3) |
|
($000)(4) |
|
Expiration |
| ||||
|
Available as of September 30, 2013(6) |
|
- |
|
314,994 |
|
19.6 |
% |
$ |
- |
|
- |
% |
$ |
- |
|
$ |
- |
|
$ |
- |
|
|
2013 |
|
272 |
|
109,907 |
|
6.8 |
|
12,267 |
|
9.5 |
|
111.61 |
|
12,539 |
|
114.09 |
| ||||
|
2014(7) |
|
410 |
|
307,288 |
|
19.2 |
|
30,666 |
|
23.5 |
|
99.80 |
|
31,049 |
|
101.04 |
| ||||
|
2015 |
|
254 |
|
141,287 |
|
8.8 |
|
24,152 |
|
18.5 |
|
170.94 |
|
25,916 |
|
183.43 |
| ||||
|
2016 |
|
224 |
|
221,247 |
|
13.8 |
|
20,490 |
|
15.7 |
|
92.61 |
|
22,656 |
|
102.40 |
| ||||
|
2017 |
|
110 |
|
158,292 |
|
9.9 |
|
19,870 |
|
15.3 |
|
125.53 |
|
25,523 |
|
161.24 |
| ||||
|
2018 |
|
56 |
|
144,271 |
|
9.0 |
|
13,407 |
|
10.3 |
|
92.93 |
|
17,557 |
|
121.69 |
| ||||
|
2019 |
|
4 |
|
80,942 |
|
5.0 |
|
1,696 |
|
1.3 |
|
20.95 |
|
1,822 |
|
22.51 |
| ||||
|
2020 |
|
3 |
|
30,093 |
|
1.9 |
|
968 |
|
0.7 |
|
32.17 |
|
1,176 |
|
39.08 |
| ||||
|
2021 |
|
8 |
|
15,534 |
|
1.0 |
|
1,672 |
|
1.3 |
|
107.63 |
|
2,407 |
|
154.95 |
| ||||
|
2022 |
|
10 |
|
33,356 |
|
2.1 |
|
3,112 |
|
2.4 |
|
93.30 |
|
4,865 |
|
145.85 |
| ||||
|
2023-Thereafter |
|
7 |
|
47,025 |
|
2.9 |
|
1,938 |
|
1.5 |
|
41.21 |
|
3,691 |
|
78.49 |
| ||||
|
Portfolio Total / Weighted Average |
|
1,358 |
|
1,604,236 |
|
100.0 |
% |
$ |
130,238 |
|
100.0 |
% |
$ |
101.02 |
|
$ |
149,201 |
|
$ |
115.73 |
|
|
(1) |
Includes leases that upon expiration will automatically be renewed, primarily on a month-to-month basis. Number of leases represents each agreement with a customer; a lease agreement could include multiple spaces and a customer could have multiple leases. |
|
(2) |
Represents the monthly contractual rent under existing commenced customer leases as of September 30, 2013, multiplied by 12. This amount reflects total annualized base rent before any one-time or non-recurring rent abatements and it excludes power revenue, interconnection revenue and operating expense reimbursement. |
|
(3) |
Annualized rent as defined above, divided by the square footage of leases expiring in the given year. |
|
(4) |
Represents the final monthly contractual rent under existing customer leases as of September 30, 2013, multiplied by 12. This amount reflects total annualized base rent before any one-time or non-recurring rent abatements and it excludes operating expense reimbursement, power revenue and interconnection revenue. |
|
(5) |
Annualized rent at expiration as defined above, divided by the square footage of leases expiring in the given year. This metric reflects the rent growth inherent in the existing base of lease agreements. |
|
(6) |
Excludes NRSF held for development or under construction. |
|
(7) |
Includes an office lease, which is an interim lease in place that expires on May 31, 2014. Upon the expiration of the interim lease and the substantial completion of tenant improvements by us, a new lease that has already been executed by both parties will commence. The new lease includes 119,729 NRSF with a ten-year term and a termination option at the end of year eight. |
|
Lease Distribution (total operating properties, excluding pre-stabilized)
|
|
|
|
|
|
|
|
Total |
|
Percentage |
|
|
|
Percentage |
| |
|
|
|
Number |
|
Percentage |
|
Operating |
|
of Total |
|
Annualized |
|
of |
| |
|
|
|
of |
|
of All |
|
NRSF of |
|
Operating |
|
Rent |
|
Annualized |
| |
|
Square Feet Under Lease(1) |
|
Leases(2) |
|
Leases |
|
Leases(3) |
|
NRSF |
|
($000)(4) |
|
Rent |
| |
|
Available colocation(5) |
|
- |
|
- |
% |
238,179 |
|
14.8 |
% |
$ |
- |
|
- |
% |
|
Available office and light-industrial |
|
- |
|
- |
|
76,815 |
|
4.8 |
|
- |
|
- |
| |
|
Colocation NRSF: |
|
|
|
|
|
|
|
|
|
|
|
|
| |
|
5,000 or less |
|
1,301 |
|
95.8 |
|
476,534 |
|
29.7 |
|
72,321 |
|
55.6 |
| |
|
5,001 - 10,000 |
|
20 |
|
1.5 |
|
143,896 |
|
9.0 |
|
14,207 |
|
10.9 |
| |
|
10,001 - 25,000 |
|
11 |
|
0.9 |
|
182,955 |
|
11.4 |
|
25,888 |
|
19.9 |
| |
|
Greater than 25,000 |
|
2 |
|
0.1 |
|
61,614 |
|
3.8 |
|
7,086 |
|
5.4 |
| |
|
Powered Shell |
|
6 |
|
0.4 |
|
166,738 |
|
10.4 |
|
4,693 |
|
3.6 |
| |
|
Office and light-industrial(6) |
|
18 |
|
1.3 |
|
257,505 |
|
16.1 |
|
6,043 |
|
4.6 |
| |
|
Portfolio Total |
|
1,358 |
|
100.0 |
|
1,604,236 |
|
100.0 |
% |
$ |
130,238 |
|
100.0 |
|
|
(1) |
Represents all leases in our portfolio, including data center and office and light-industrial leases. |
|
|
|
|
(2) |
Includes leases that upon expiration will automatically be renewed, primarily on a month-to-month basis. Number of leases represents each agreement with a customer; a lease agreement could include multiple spaces and a customer could have multiple leases. |
|
|
|
|
(3) |
Represents the square feet at a building under lease as specified in the lease agreements plus management’s estimate of space available for lease to third parties based on engineers’ drawings and other factors, including required data center support space (such as mechanical, telecommunications and utility rooms) and building common areas. |
|
|
|
|
(4) |
Represents the monthly contractual rent under existing commenced customer leases as of September 30, 2013, multiplied by 12. This amount reflects total annualized base rent before any one-time or non-recurring rent abatements and it excludes power revenue, interconnection revenue and operating expense reimbursement. |
|
|
|
|
(5) |
Excludes NRSF held for development or under construction. |
|
|
|
|
(6) |
Excludes office and light-industrial space of 44,320 NRSF that is a component of colocation leases. The 44,320 NRSF of office and light-industrial space is leased to data center tenants as incremental space to their data center lease space. |
|
|
|
|
|
|
|
|
|
|
|
|
|
|
|
|
| |
|
|
|
|
|
|
|
| |
|
|
|
|
|
|
|
| |
|
Overview |
Financial |
Operating |
Development
|
Capital |
2013 |
Appendix |

© Copyright 2013 CoreSite. All Rights Reserved. | Quarter Ended September 30, 2013
|
Geographic Diversification
|
|

(in thousands, except NRSF data)
|
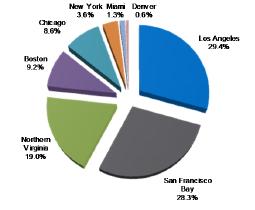
Geographic Diversification
|
|
|
|
Metropolitan Market |
|
Percentage of Total |
|
|
|
Los Angeles |
|
29.4 |
% | |
|
|
San Francisco Bay |
|
28.3 |
| |
|
|
Northern Virginia |
|
19.0 |
| |
|
|
Boston |
|
9.2 |
| |
|
|
Chicago |
|
8.6 |
| |
|
|
New York |
|
3.6 |
| |
|
|
Miami |
|
1.3 |
| |
|
|
Denver |
|
0.6 |
| |
|
|
Total |
|
100 |
% | |
|
|
|
|
|
| |
|
|
|
|
|
| |
|
|
|
|
|
| |
|
|
|
|
|
|
|
10 Largest Customers
|
|
|
|
|
|
|
|
|
|
|
|
|
|
|
|
|
Weighted |
| |
|
|
|
|
|
|
|
|
|
|
Percentage |
|
|
|
Percentage |
|
Average |
| |
|
|
|
|
|
|
Number |
|
Total |
|
of Total |
|
Annualized |
|
of |
|
Remaining |
| |
|
|
|
|
|
|
of |
|
Occupied |
|
Operating |
|
Rent |
|
Annualized |
|
in |
| |
|
|
Customer Industry |
|
CoreSite Vertical |
|
Locations |
|
NRSF(1) |
|
NRSF(2) |
|
($000)(3) |
|
Rent(4) |
|
Months(5) |
| |
|
1 |
Technology |
|
Digital Content |
|
3 |
|
52,374 |
|
3.3 |
% |
$ |
10,082 |
|
7.7 |
% |
46 |
|
|
2 |
Technology |
|
Systems Integration & Managed Service Provider |
|
3 |
|
53,014 |
|
3.3 |
|
6,562 |
|
5.0 |
|
56 |
| |
|
3 |
Technology |
|
Digital Content |
|
9 |
|
52,270 |
|
3.3 |
|
5,605 |
|
4.3 |
|
14 |
| |
|
4 |
Government*(6) |
|
Enterprise |
|
1 |
|
141,774 |
|
8.8 |
|
4,077 |
|
3.1 |
|
22 |
| |
|
5 |
Technology |
|
Cloud |
|
4 |
|
25,013 |
|
1.6 |
|
3,888 |
|
3.0 |
|
53 |
| |
|
6 |
Technology |
|
Cloud |
|
1 |
|
26,842 |
|
1.7 |
|
3,870 |
|
3.0 |
|
65 |
| |
|
7 |
Financial |
|
Enterprise |
|
2 |
|
11,855 |
|
0.7 |
|
2,965 |
|
2.3 |
|
26 |
| |
|
8 |
Technology |
|
Systems Integration & Managed Service Provider |
|
1 |
|
6,034 |
|
0.4 |
|
2,569 |
|
2.0 |
|
25 |
| |
|
9 |
Government* |
|
Enterprise |
|
2 |
|
16,764 |
|
1.0 |
|
2,279 |
|
1.7 |
|
21 |
| |
|
10 |
Telecommunications |
|
Network |
|
3 |
|
18,562 |
|
1.2 |
|
2,049 |
|
1.6 |
|
95 |
| |
|
|
Total/Weighted Average |
|
|
|
|
|
404,502 |
|
25.3 |
% |
$ |
43,946 |
|
33.7 |
% |
42 |
|
|
* Denotes customer using space for general office purposes. | |
|
(1) |
Total occupied NRSF is determined based on contractually leased square feet for leases that have commenced on or before September 30, 2013. We calculate occupancy based on factors in addition to contractually leased square feet, including required data center support space (such as the mechanical, telecommunications and utility rooms) and building common areas. |
|
|
|
|
(2) |
Represents the customer’s total occupied square feet divided by the total operating NRSF in the portfolio which, as of September 30, 2013, consisted of 1,604,236 NRSF. |
|
|
|
|
(3) |
Represents the monthly contractual rent under existing commenced customer leases as of September 30, 2013, multiplied by 12. This amount reflects total annualized base rent before any one-time or non-recurring rent abatements and it excludes power revenue, interconnection revenue and operating expense reimbursement. |
|
|
|
|
(4) |
Represents the customer’s total annualized rent divided by the total annualized rent in the portfolio as of September 30, 2013, which was approximately $130.2 million. |
|
|
|
|
(5) |
Weighted average based on percentage of total annualized rent expiring calculated as of September 30, 2013. |
|
|
|
|
(6) |
The data presented represents an interim lease in place that expires in May 2014. Upon expiration of the interim lease and the substantial completion of building improvements by us, a new lease that has already been executed by both parties will commence. That lease includes 119,729 NRSF with a ten-year term and a termination option at the end of year eight. |
|
|
|
|
|
|
|
|
|
|
|
|
|
|
|
|
| |
|
|
|
|
|
|
|
| |
|
|
|
|
|
|
|
| |
|
Overview |
Financial |
Operating |
Development
|
Capital |
2013 |
Appendix |
© Copyright 2013 CoreSite. All Rights Reserved. | Quarter Ended September 30, 2013
|
Development Summary
|
|

(in thousands, except NRSF data)
|
Completed Pre-Stabilized Data Center Projects as of September 30, 2013
|
|
Projects/Facilities(1) |
|
Metropolitan Area |
|
Completion |
|
NRSF (1) |
|
Cost |
|
Percent |
| |
|
SV4 |
|
San Francisco Bay |
|
Mar 2013 |
|
16,640 |
|
|
13,261 |
|
35.2 |
% |
|
LA2 |
|
Los Angeles |
|
Mar 2013 |
|
2,294 |
|
320 |
|
33.3 |
% | |
|
LA2 |
|
Los Angeles |
|
Mar 2013 |
|
8,122 |
|
652 |
|
43.6 |
% | |
|
LA2 |
|
Los Angeles |
|
Mar 2013 |
|
21,169 |
|
7,746 |
|
59.1 |
% | |
|
SV4 |
|
San Francisco Bay |
|
Apr 2013 |
|
14,857 |
|
12,911 |
|
0.0 |
% | |
|
CH1 |
|
Chicago |
|
Apr 2013 |
|
20,240 |
|
5,098 |
|
0.0 |
% | |
|
|
|
|
|
|
|
|
|
|
|
|
| |
|
|
|
|
|
|
|
|
|
|
|
|
| |
|
Total completed pre-stabilized |
|
|
|
|
|
83,322 |
|
$ |
39,988 |
|
27.2 |
% |
|
(1) |
These pre-stabilized projects/facilities are excluded from the stabilized operating NRSF information in the Operating Properties table. Pre-stabilized projects/facilities have been recently developed and are either less than 85% occupied or have been in service for less than 24 months. During Q2 2013, we completed development of 23,663 NRSF at BO1 which was 100% stabilized at completion and is included in our stabilized operating NRSF in the Operating Properties table. |
|
|
|
|
(2) |
Includes customer leases that have been signed as of September 30, 2013. The percent leased is determined based on leased square feet as proportion of total pre-stabilized NRSF. |
|
Data Center Projects Under Construction as of September 30, 2013
|
|
|
|
|
|
|
|
|
|
Costs |
| ||||
|
Projects/Facilities |
|
Metropolitan Area |
|
Estimated |
|
NRSF(1) |
|
Incurred to- |
|
Estimated |
| ||
|
|
|
|
|
|
|
|
|
|
|
|
| ||
|
NY2 |
|
New York |
|
Q4 2013 / Q1 2014 |
|
65,000 |
|
72,783 |
|
100,800 |
| ||
|
SV5(3) |
|
San Francisco Bay |
|
Q4 2013 |
|
101,250 |
|
17,292 |
|
19,000 |
| ||
|
LA2 |
|
Los Angeles |
|
Q1 2014 |
|
33,711 |
|
4,705 |
|
10,000 |
| ||
|
VA2 |
|
Northern Virginia |
|
Q2 2014 |
|
50,000 |
|
16,688 |
|
69,800 |
| ||
|
|
|
|
|
|
|
|
|
|
|
|
| ||
|
|
|
|
|
|
|
|
|
|
|
|
| ||
|
Total under construction |
|
|
|
|
|
249,961 |
|
$ |
111,468 |
|
$ |
199,600 |
|
|
(1) |
NRSF reflects management's estimate based on engineering drawings and required support space and is subject to change based on final demising of the space. |
|
|
|
|
(2) |
Reflects management’s estimate of cost of completion based upon the actual cost at quarter-end, plus management’s estimate of the cost to complete construction. |
|
|
|
|
(3) |
Represents 101,250 of pre-sold dedicated built-to-suit space that is 100% leased as of September 30, 2013, and has an expected lease commencement date in Q4 2013. |
|
Capital Expenditures – Quarter Ended
|
|
|
|
September 30, |
|
June 30, |
|
March 31, |
|
December 31, |
|
September 30, |
| ||||||
|
Data center expansion |
(1) |
$ |
67,688 |
|
$ |
33,544 |
|
$ |
47,691 |
|
$ |
28,083 |
|
$ |
17,922 |
| |
|
Non-recurring investments |
(2) |
3,831 |
|
4,526 |
|
7,832 |
|
3,625 |
|
3,897 |
| ||||||
|
Tenant improvements |
|
1,578 |
|
1,027 |
|
1,613 |
|
278 |
|
1,362 |
| ||||||
|
Recurring capital expenditures |
(3) |
1,174 |
|
935 |
|
1,699 |
|
2,064 |
|
822 |
| ||||||
|
Total capital expenditures |
|
$ |
74,271 |
|
$ |
40,032 |
|
$ |
58,835 |
|
$ |
34,050 |
|
$ |
24,003 |
| |
|
|
|
|
|
|
|
|
|
|
|
|
| ||||||
|
Repairs and maintenance expense |
(4) |
$ |
1,954 |
|
$ |
1,918 |
|
$ |
2,016 |
|
$ |
2,079 |
|
$ |
2,115 |
| |
|
(1) |
Data center expansion capital expenditures include new data center construction, development projects adding capacity to existing data centers and other revenue generating investments. |
|
|
|
|
(2) |
Non-recurring investments include upgrades to existing data center or office space and company-wide improvements that are ancillary to revenue generation such as internal system development and system-wide security upgrades. |
|
|
|
|
(3) |
Recurring capital expenditures include required equipment upgrades within our operating portfolio, which have a future economic benefit. |
|
|
|
|
(4) |
Repairs and maintenance expense is classified within property operating and maintenance expense in the statement of operations. These expenditures represent recurring maintenance contracts and repairs to operating equipment necessary to maintain current operations. |
|
|
|
|
|
|
|
|
|
|
|
|
|
|
|
|
| |
|
|
|
|
|
|
|
| |
|
|
|
|
|
|
|
| |
|
Overview |
Financial |
Operating |
Development
|
Capital |
2013 |
Appendix |
© Copyright 2013 CoreSite. All Rights Reserved. | Quarter Ended September 30, 2013
|
Market Capitalization
|
|

(in thousands, except per share data)
|
Market Capitalization
|
|
|
|
Shares or |
|
Market Price as of |
|
Market Value |
| |
|
Common shares |
|
21,412 |
|
$33.94 |
|
$ |
726,723 |
|
|
Operating partnership units |
|
25,361 |
|
$33.94 |
|
860,752 |
| |
|
Liquidation value of preferred stock |
|
4,600 |
|
$25.00 |
|
115,000 |
| |
|
Total equity |
|
|
|
|
|
1,702,475 |
| |
|
Total debt |
|
|
|
|
|
166,625 |
| |
|
Total enterprise value |
|
|
|
|
|
$ |
1,869,100 |
|
|
|
|
|
|
|
|
|
| |
|
Total debt to annualized adjusted EBITDA |
|
|
|
|
|
1.5x |
| |
|
Total debt and preferred stock to annualized adjusted EBITDA |
|
|
|
2.6x |
| |||
|
Debt Summary (1)
|
Outstanding as of:
|
|
Instrument |
|
Interest |
|
Maturity |
|
Maturity |
|
September 30, |
|
June 30, |
|
March 31, |
|
December 31, |
|
September 30, |
| |||||
|
SV1 - mortgage loan |
|
3.69 |
% |
10/9/2014 |
|
N/A |
|
$ |
58,625 |
|
$ |
59,000 |
|
$ |
59,375 |
|
$ |
59,750 |
|
$ |
60,000 |
|
|
Senior credit facility(3) |
|
2.18 |
% |
1/3/2017 |
|
1/3/2018 |
|
108,000 |
|
73,000 |
|
52,000 |
|
- |
|
62,750 |
| |||||
|
VA1 - mortgage loan |
|
|
|
|
|
|
|
- |
|
- |
|
- |
|
- |
|
31,615 |
| |||||
|
Total Consolidated Debt |
|
|
|
|
|
|
|
$ |
166,625 |
|
$ |
132,000 |
|
$ |
111,375 |
|
$ |
59,750 |
|
$ |
154,365 |
|
|
|
|
|
|
|
|
|
|
|
|
|
|
|
|
|
|
|
| |||||
|
Weighted average interest rate |
|
2.71 |
% |
|
|
|
|
|
|
|
|
|
|
|
|
|
| |||||
|
Floating rate vs. fixed rate debt |
|
|
|
|
|
|
|
100% / 0% |
|
100% / 0% |
|
100% / 0% |
|
100% / 0% |
|
59% / 41% |
| |||||
|
(1) |
See the most recent filed Form 10-K and 10-Q for information on specific debt instruments. |
|
|
|
|
(2) |
Each debt instrument’s interest rate is based on LIBOR at September 30, 2013, plus applicable spread. |
|
|
|
|
(3) |
Effective June 28, 2013, the Company partially exercised the accordion feature to increase the aggregate commitments by $50.0 million to $405.0 million. All other terms of the Second Amended and Restated Credit Agreement remain unchanged. |
|
Debt Maturities
|
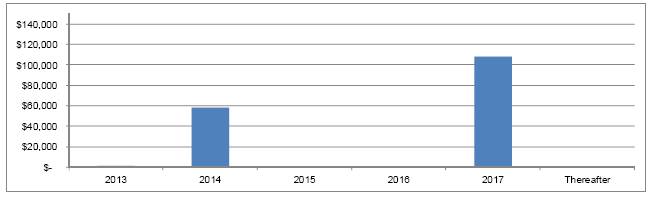
|
|
|
|
|
|
|
|
|
|
|
|
|
|
|
|
| |
|
|
|
|
|
|
|
| |
|
|
|
|
|
|
|
| |
|
Overview |
Financial |
Operating |
Development
|
Capital |
2013 |
Appendix |

© Copyright 2013 CoreSite. All Rights Reserved. | Quarter Ended September 30, 2013
|
Interest Summary and Debt
|
|

(in thousands)
|
Interest Expense Components
|
|
|
|
Three Months Ended |
|
|
Nine Months Ended |
| |||||||||||
|
|
|
|
|
|
|
|
|
|
|
|
|
| |||||
|
|
|
September 30, |
|
June 30, |
|
September 30, |
|
|
September 30, |
|
September 30, |
| |||||
|
Interest expense and fees |
|
$ |
1,402 |
|
$ |
1,296 |
|
$ |
1,433 |
|
|
$ |
3,659 |
|
$ |
4,088 |
|
|
Amortization of deferred financing costs |
|
445 |
|
427 |
|
435 |
|
|
1,293 |
|
1,307 |
| |||||
|
Capitalized interest |
|
(1,139 |
) |
(940 |
) |
(273 |
) |
|
(3,022 |
) |
(1,473 |
) | |||||
|
Total interest expense |
|
$ |
708 |
|
$ |
783 |
|
$ |
1,595 |
|
|
$ |
1,930 |
|
$ |
3,922 |
|
|
Debt Covenants
|
|
|
|
Revolving Credit Facility |
| ||||||||||
|
|
|
Required Compliance |
|
September 30, |
|
June 30, |
|
March 31, |
|
December 31, |
|
September 30, |
|
|
|
|
|
|
|
|
|
|
|
|
|
|
|
|
|
Fixed charge coverage ratio |
|
Greater than 1.75x |
|
7.5x |
|
7.7x |
|
7.6x |
|
12.1x |
|
18.3x |
|
|
Total indebtedness to gross asset value |
|
Less than 60% |
|
11.5% |
|
10.0% |
|
9.6% |
|
7.6% |
|
12.7% |
|
|
Secured debt to gross asset value |
|
Less than 40% |
|
3.8% |
|
4.0% |
|
4.2% |
|
5.2% |
|
NA |
|
|
Unhedged variable rate debt to gross asset value |
|
Less than 30% |
|
10.8% |
|
9.0% |
|
7.9% |
|
5.2% |
|
4.9% |
|
|
|
|
|
|
|
|
|
|
|
|
|
|
|
|
|
Facility availability |
|
|
|
$405,000 |
|
$405,000 |
|
$355,000 |
|
$355,000 |
|
$202,500 |
|
|
Borrowings outstanding |
|
|
|
(108,000) |
|
(73,000) |
|
(52,000) |
|
- |
|
(62,750) |
|
|
Outstanding letters of credit |
|
|
|
(8,390) |
|
(7,540) |
|
(8,540) |
|
(8,540) |
|
(8,620) |
|
|
Current availability |
|
|
|
$288,610 |
|
$324,460 |
|
$294,460 |
|
$346,460 |
|
$131,130 |
|
|
|
|
|
|
|
|
|
|
|
|
|
|
|
|
|
| |
|
|
|
|
|
|
|
| |
|
|
|
|
|
|
|
| |
|
Overview |
Financial |
Operating |
Development
|
Capital |
2013 |
Appendix |
© Copyright 2013 CoreSite. All Rights Reserved. | Quarter Ended September 30, 2013
|
2013 Guidance
|
|

(in thousands, except per share amounts)
The annual guidance provided below represents forward-looking projections, which are based on current economic conditions, internal assumptions about our existing customer base and the supply and demand dynamics of the markets in which we operate. Further, the guidance does not include the impact of any future financing, investment or disposition activities. Please refer to the press release for additional information on forward-looking statements.
Projected per share and OP unit information:
|
|
|
|
Low |
|
High |
| ||
|
Net income attributable to common shares |
|
$ |
0.44 |
|
$ |
0.48 |
| |
|
Real Estate depreciation and amortization |
|
1.36 |
| |||||
|
FFO |
|
$ |
1.80 |
|
$ |
1.84 |
| |
|
|
|
|
|
|
| |||
|
Projected operating results: |
|
|
|
|
| |||
|
Total operating revenues |
|
$ |
234,000 |
|
$ |
237,000 |
| |
|
General and administrative expenses |
|
$ |
28,000 |
|
$ |
30,000 |
| |
|
Adjusted EBITDA |
|
$ |
106,000 |
|
$ |
109,000 |
| |
|
|
|
|
|
|
| |||
|
Significant guidance drivers: |
|
|
|
|
| |||
|
Rental churn rate per quarter |
|
1% |
|
2% |
| |||
|
Cash rent growth on data center renewals |
|
3% |
|
5% |
| |||
|
Development capital expenditures (1) |
|
$ |
230,000 |
|
$ |
240,000 |
| |
|
Recurring capital expenditures |
|
$ |
5,000 |
|
$ |
7,000 |
| |
(1) The guidance related to development capital expenditures includes data center expansion, non-recurring investments and tenant improvements.
|
|
|
|
|
|
|
|
|
|
|
|
|
|
|
|
| |
|
|
|
|
|
|
|
| |
|
|
|
|
|
|
|
| |
|
Overview |
Financial |
Operating |
Development
|
Capital |
2013 |
Appendix |
© Copyright 2013 CoreSite. All Rights Reserved. | Quarter Ended September 30, 2013
|
Appendix
|
|
This document includes certain non-GAAP financial measures that management believes are helpful in understanding our business, as further described below. Our definition and calculation of non-GAAP financial measures may differ from those of other REITs and therefore may not be comparable. The non-GAAP measures should not be considered an alternative to net income as an indicator of our performance and should be considered only a supplement to net income, cash flows from operating, investing or financing activities as a measure of profitability and/or liquidity, computed in accordance with GAAP.
Definitions
Funds From Operations “FFO” is a supplemental measure of our performance which should be considered along with, but not as an alternative to, net income and cash provided by operating activities as a measure of operating performance and liquidity. We calculate FFO in accordance with the standards established by the National Association of Real Estate Investment Trusts (“NAREIT”). FFO represents net income (loss) (computed in accordance with GAAP), excluding gains (or losses) from sales of property and impairment write-downs of depreciable real estate, plus real estate related depreciation and amortization (excluding amortization of deferred financing costs) and after adjustments for unconsolidated partnerships and joint ventures.
Our management uses FFO as a supplemental performance measure because, in excluding real estate related depreciation and amortization and gains and losses from property dispositions, it provides a performance measure that, when compared year over year, captures trends in occupancy rates, rental rates and operating costs.
We offer this measure because we recognize that FFO will be used by investors as a basis to compare our operating performance with that of other REITs. However, because FFO excludes depreciation and amortization and captures neither the changes in the value of our properties that result from use or market conditions, nor the level of capital expenditures and capitalized leasing commissions necessary to maintain the operating performance of our properties, all of which have real economic effect and could materially impact our financial condition and results from operations, the utility of FFO as a measure of our performance is limited. FFO is a non-GAAP measure and should not be considered a measure of liquidity, an alternative to net income, cash provided by operating activities or any other performance measure determined in accordance with GAAP, nor is it indicative of funds available to fund our cash needs, including our ability to pay dividends or make distributions. In addition, our calculations of FFO are not necessarily comparable to FFO as calculated by other REITs that do not use the same definition or implementation guidelines or interpret the standards differently from us. Investors in our securities should not rely on these measures as a substitute for any GAAP measure, including net income.
|
|
|
|
|
|
|
|
|
|
|
|
|
|
|
|
| |
|
|
|
|
|
|
|
| |
|
|
|
|
|
|
|
| |
|
Overview |
Financial |
Operating |
Development
|
Capital |
2013 |
Appendix |
© Copyright 2013 CoreSite. All Rights Reserved. | Quarter Ended September 30, 2013
|
Appendix
|
|

Adjusted Funds From Operations “AFFO” is a non-GAAP measure that is used as a supplemental operating measure specifically for comparing year over year ability to fund dividend distribution from operating activities. AFFO is used by us as a basis to address our ability to fund our dividend payments. We calculate adjusted funds from operations by adding to or subtracting from FFO:
1. Plus: Amortization of deferred financing costs
2. Plus: Non-cash compensation
3. Plus: Non-real estate depreciation
4. Plus: Below market debt amortization
5. Less: Straight line rents adjustments
6. Less: Above and below market leases
7. Less: Maintenance capital investment
8. Less: Tenant improvement capital investment
9. Less: Capitalized leasing commissions
AFFO is not intended to represent cash flow from operations for the period, and is only intended to provide an additional measure of performance by adjusting the effect of certain items noted above included in FFO. AFFO is a widely reported measure by other REITs, however, other REITs may use different methodologies for calculating AFFO and, accordingly, our AFFO may not be comparable to other REITs.
Earnings before Interest, Taxes, Depreciation and Amortization (EBITDA) and Adjusted EBITDA - EBITDA is defined as earnings before interest, taxes, depreciation and amortization. We calculate adjusted EBITDA by adding our non-cash compensation expense, transaction costs and litigation expense to EBITDA as well as adjusting for the impact of gains or losses on early extinguishment of debt. Management uses EBITDA and adjusted EBITDA as indicators of our ability to incur and service debt. In addition, we consider EBITDA and adjusted EBITDA to be appropriate supplemental measures of our performance because they eliminate depreciation and interest, which permits investors to view income from operations without the impact of non-cash depreciation or the cost of debt. However, because EBITDA and adjusted EBITDA are calculated before recurring cash charges including interest expense and taxes, and are not adjusted for capital expenditures or other recurring cash requirements of our business, their utilization as a cash flow measurement is limited.
|
|
|
|
|
|
|
|
|
|
|
|
|
|
|
|
| |
|
|
|
|
|
|
|
| |
|
|
|
|
|
|
|
| |
|
Overview |
Financial |
Operating |
Development
|
Capital |
2013 |
Appendix |

© Copyright 2013 CoreSite. All Rights Reserved. | Quarter Ended September 30, 2013
|
|
Thank You |
|
|
|
|
|
1050 17th Street Suite 800 Denver, CO 80265 USA
+1 866.777.CORE
coresite.com Info@CoreSite.com |