Attached files
| file | filename |
|---|---|
| 8-K - FORM 8-K - UMB FINANCIAL CORP | d620771d8k.htm |
 Third Quarter 2013
UMB Financial
Exhibit 99.1 |
 Cautionary Notice about
Forward-Looking Statements
2
This presentation contains, and our other communications may contain, forward-looking statements
within the meaning of the Private Securities Litigation Reform Act of 1995. These statements
can be identified by the fact that they do not relate strictly to historical or current facts.
All forward-looking statements
are
subject
to
assumptions,
risks,
and
uncertainties,
which
may
change
over
time
and
many
of
which
are
beyond
our
control.
You
should
not
rely
on
any
forward-looking
statement
as
a
prediction or guarantee about the future. Our actual future objectives, strategies, plans, prospects,
performance, condition, or results may differ materially from those set forth in any
forward-looking statement. Some of the factors that may cause actual results or other
future events, circumstances, or aspirations
to
differ
from
those
in
forward-looking
statements
are
described
in
our
Annual
Report
on
Form
10-K
for
the
year
ended
December
31,
2012,
our
subsequent
Quarterly
Reports
on
Form
10-Q
or Current Reports on Form 8-K, or other applicable documents that are filed or furnished with the
Securities and Exchange Commission (SEC). Any forward-looking statement made by us or on
our behalf speaks only as of the date that it was made. We do not undertake to update any
forward- looking statement to reflect the impact of events, circumstances, or results that
arise after the date that the
statement
was
made.
You,
however,
should
consult
further
disclosures
(including
disclosures
of
a forward-looking nature) that we may make in any subsequent Quarterly Report on Form 10-Q,
Current Report on Form 8-K, or other applicable document that is filed or furnished with
the SEC. |
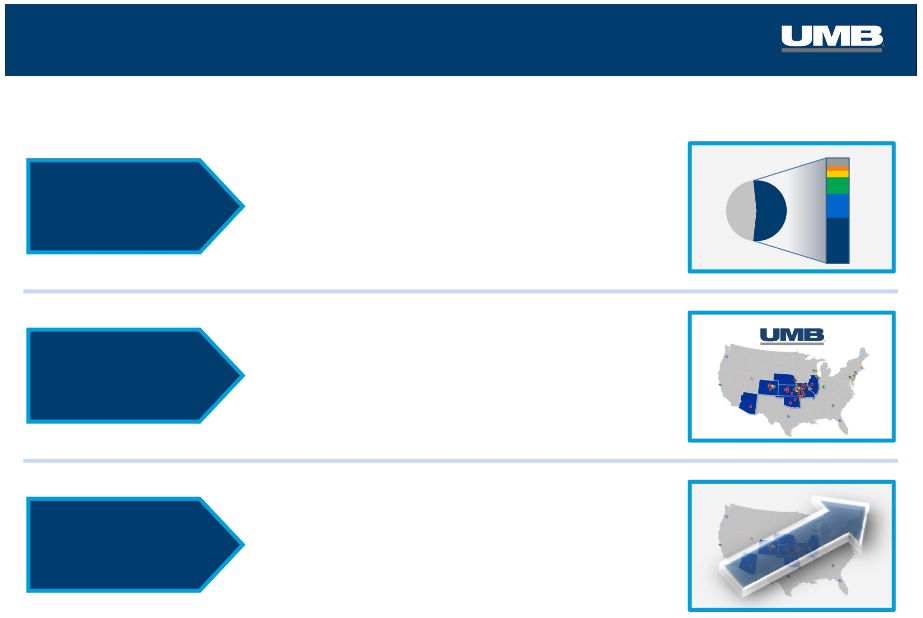
 A
Different Kind of Bank The company
The business model
The performance |
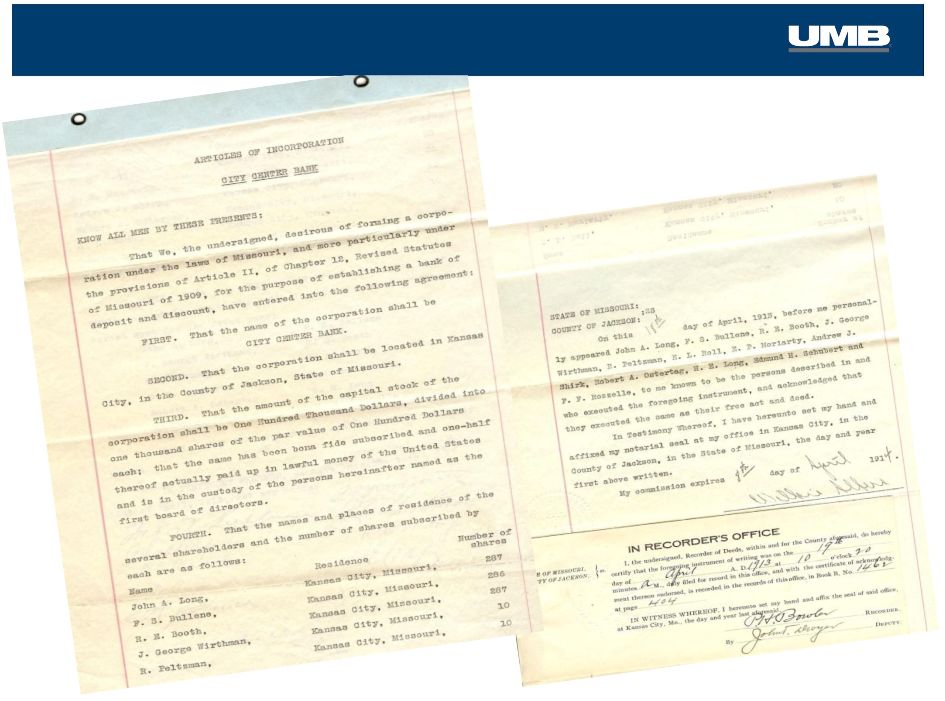 UMB
is
Born
as
City
Center
Bank
-
1913
4 |
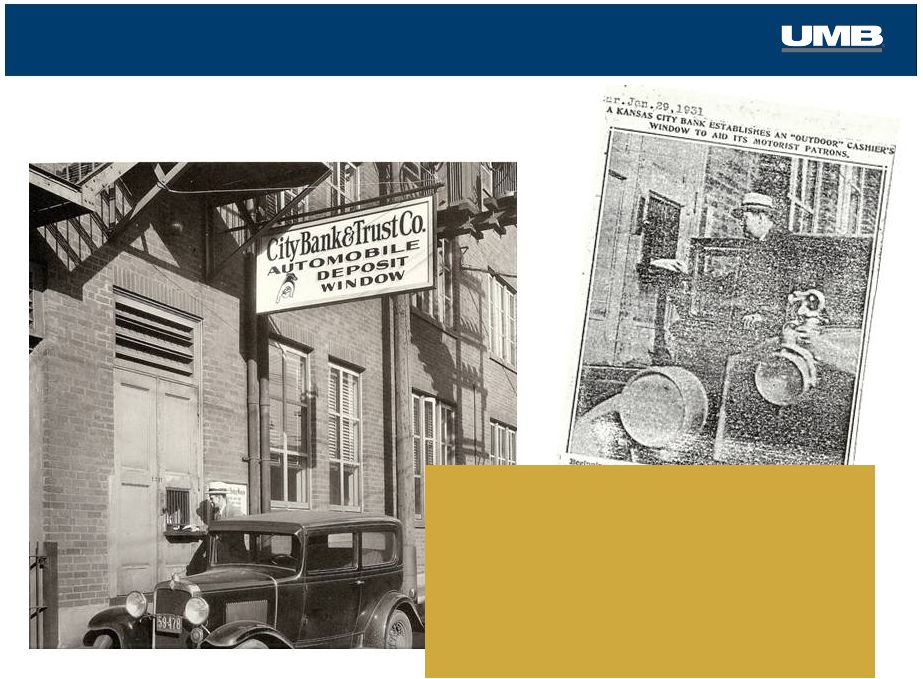 A Leader in Serving our
Customers
“Beginning today, motorists can do business with the
City Bank, Eighteenth Street & Grand Avenue, from the
alley between Grand & McGee streets. They can drive
to the new “cage”
and make deposits without leaving
the car.”
The City Bank is the first bank in Kansas City
to utilize such a plan to overcome traffic conditions
inconvenient for patrons.”
The Kansas City Star
January 29, 1931
1931
–
KC’s
First
“Drive
Through
Bank”
5 |
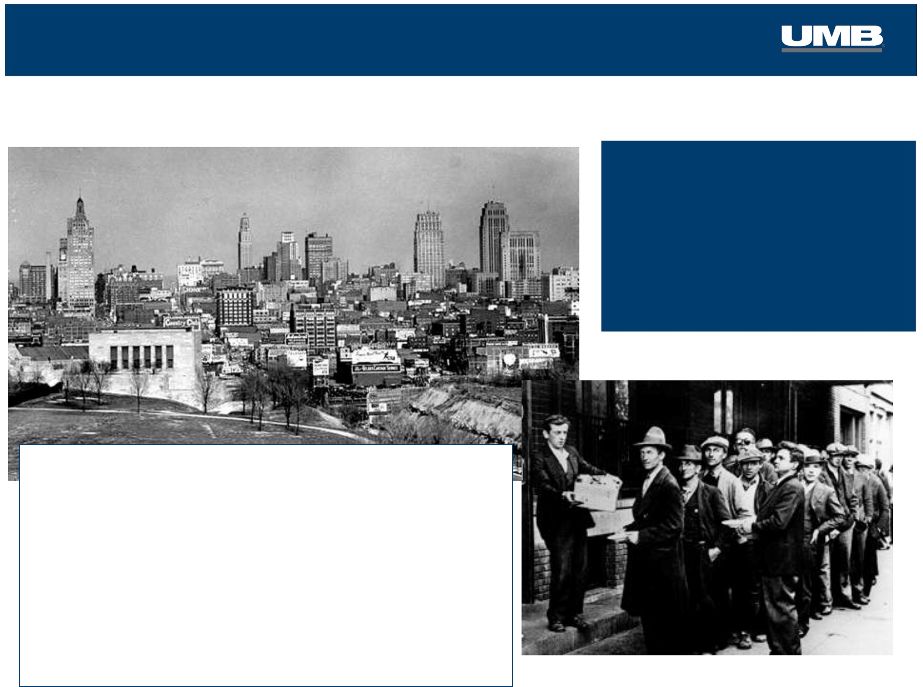 Self-Reliance and
Stability “If we were to liquidate this bank today, we
could pay our depositors one hundred cents
on the dollar and collect our entire Surplus
and Capital Account of $700,000 and a
large part of the Undivided Profits Account.”
-
R. Crosby Kemper, Sr. in a letter to the
Missouri Banking Commissioner, Oct. 1933
No need for
government
assistance –
then
or now.
1934 –
Emerging from the Great Depression
6 |
 “Our company has remained
true to its values and the
results are evident in our
shareholder returns.”
Mariner Kemper
Chairman & Chief Executive Officer |
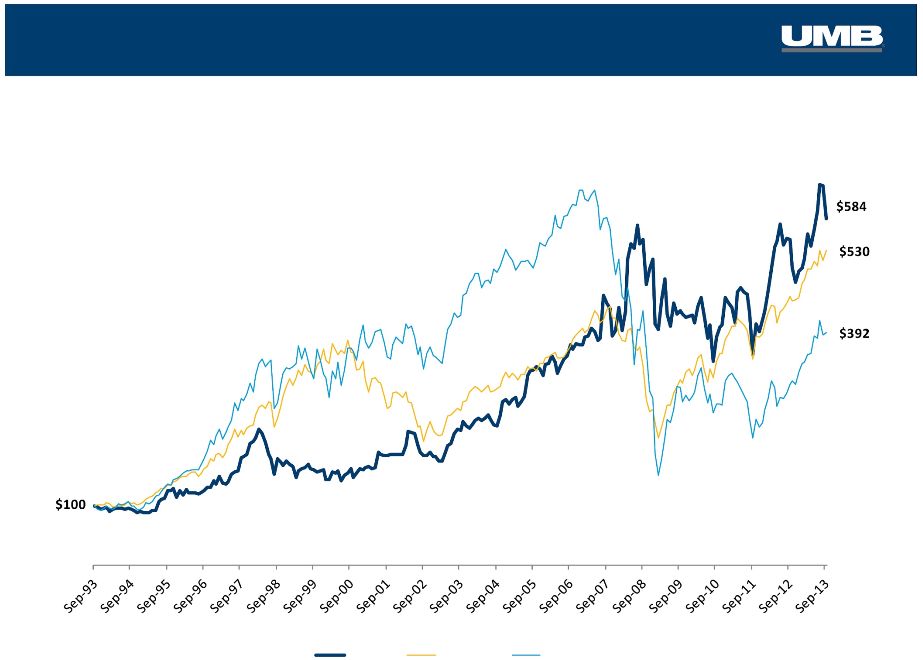 Total Returns Reflect
Long-Term Performance Total Shareholder Return
September 1993 –
September 2013
8
Source: SNL Financial
UMBF
S&P 500
SNL U.S. Bank |
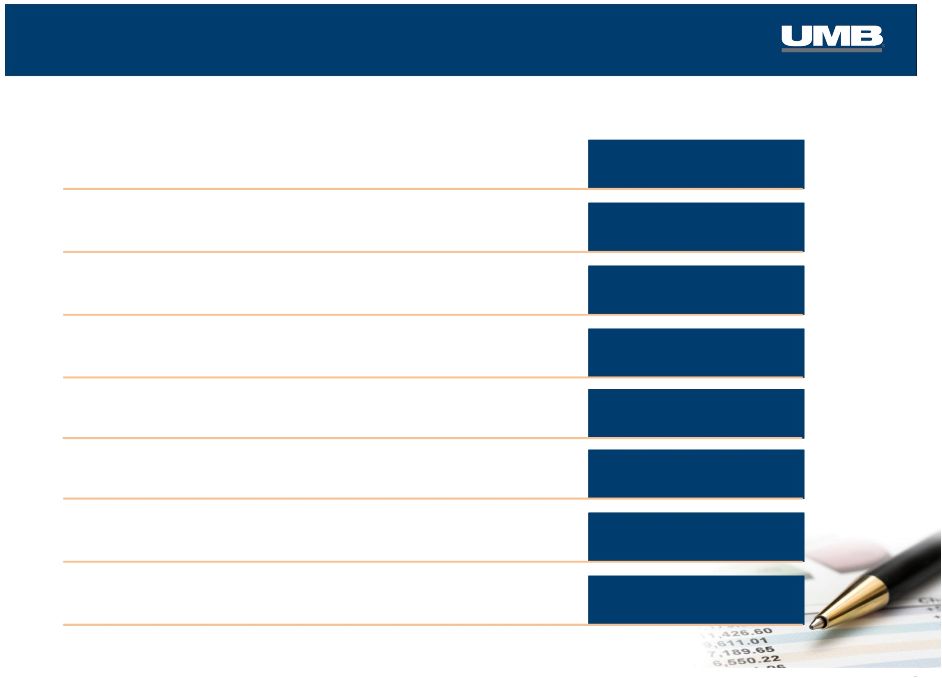 UMB
At A Glance Assets under management
Banking presence
Branches/ATMs
Acquisitions last 10 years
Market cap
Dividend payout ratio*
$38.7B
8 states
115/320+
23
>$2.4B
30.3%
Total assets
$16.2B
Revenue from fee businesses
58.7%
*Average over past 4 quarters
As of September 30, 2013
9 |
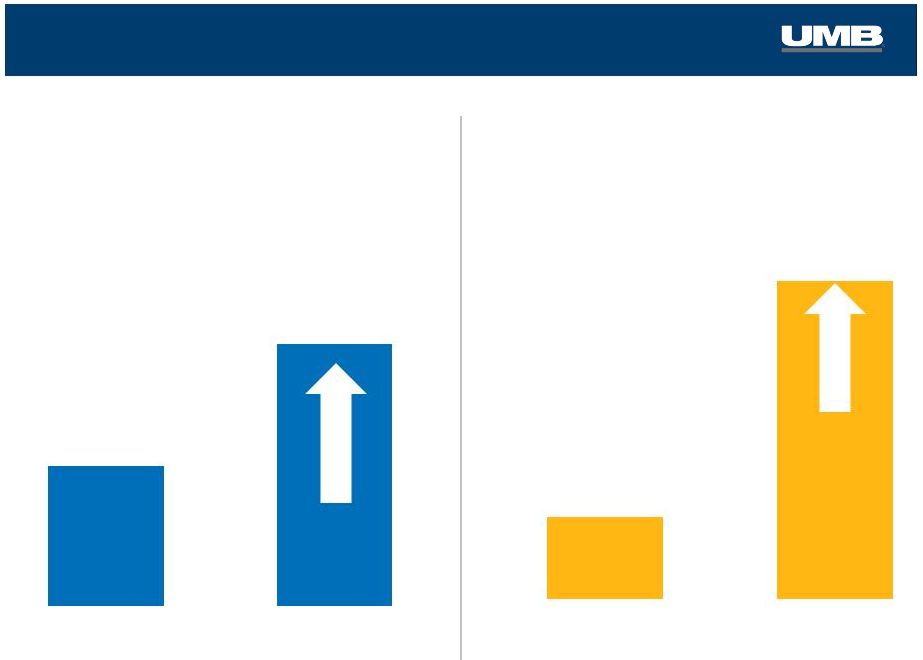
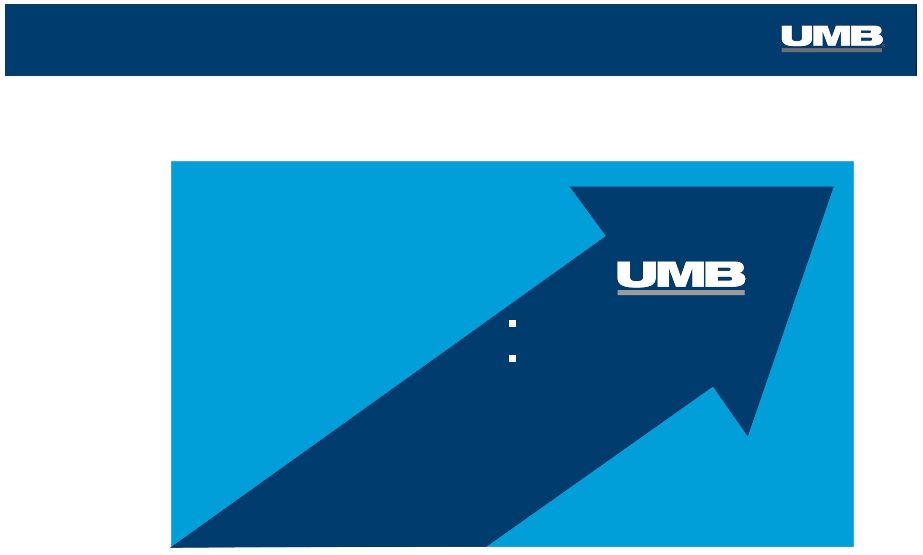 We
Have Repositioned UMB… National
Regional
Low
High
Geographic
focus
Diversity of revenue streams
More than a typical bank
10
More stable earnings
Faster growth |
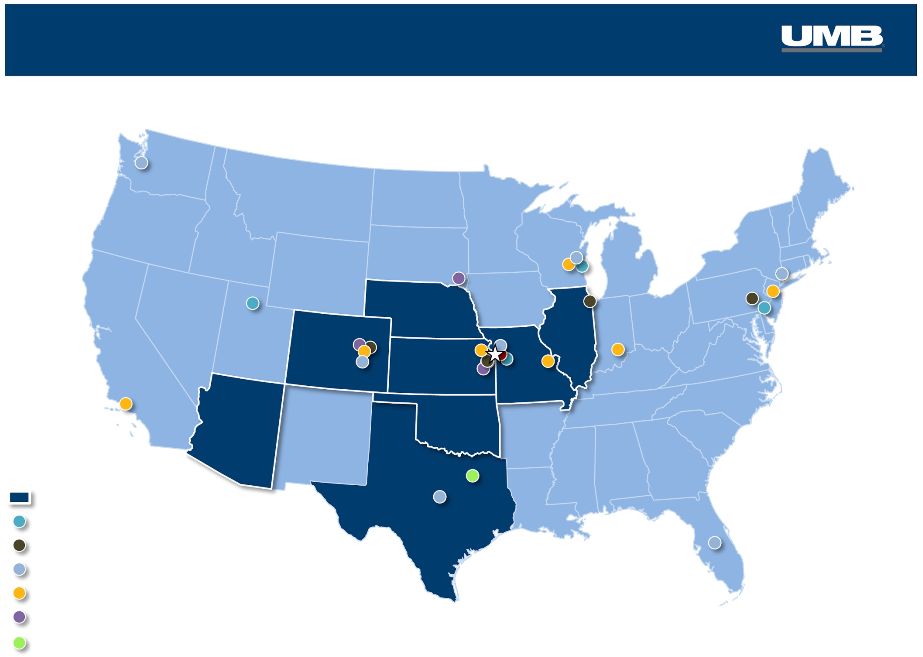 11
Fund Services
Prairie Capital
Corporate Trust
UMB Bank presence
Loan Production Office
…Resulting in a Growing National Presence
Healthcare Services – National Sales
Scout Investments – National Sales
|
 Today: UMB is More
than a Regional Bank DIVERSIFIED FINANCIAL SERVICES
Healthcare
Services
Corporate
Trust
UMB Fund
Services
Scout
Investments
•JD Clark
Prairie
Capital
•Reams
…We are a diversified financial services company
Diversified
financial
Products / services
Banking
National
Regional
Geographic
focus
UMB
Insurance
12
Trust
Trust
Services
Services
TRADITIONAL BANKING
TRADITIONAL BANKING
Card
Card
Services
Services
Treasury
Treasury
Management
Management |
 A
Financial Services Company The company
The business model
The performance |
 +
+
+
High Quality Credit
Diverse Revenue Streams
Low-cost Funding
Strong Balance Sheet
Our Time-Tested Business Model |
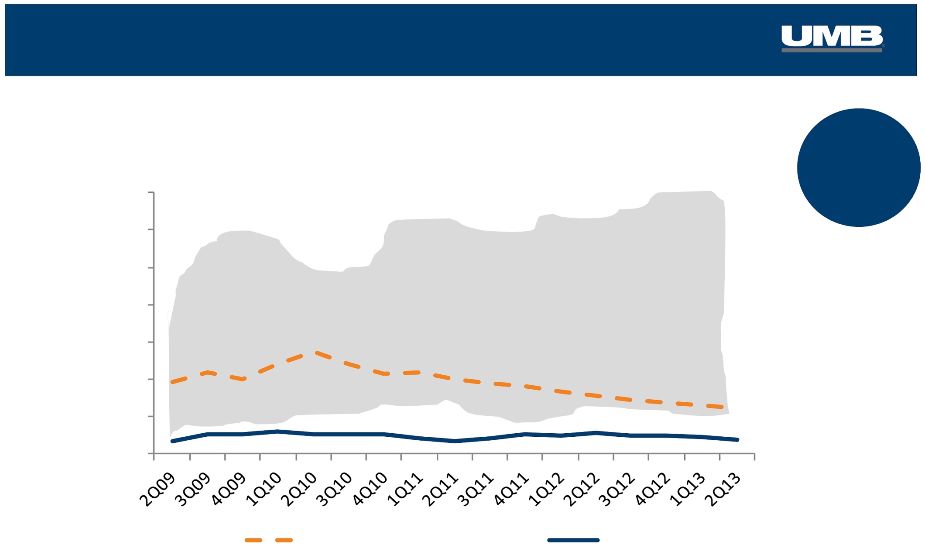 Our
Credit Quality Outpaces the Industry Peer Average as of 2Q13; Source: SNL
Financial 3Q 2013
0.48%
Shaded area is high/low range of the peer group
Non-Performing Loans
% of average loans
15
Traditional Peer Median
UMBF
1.24%
0.40%
7.0
6.0
5.0
4.0
3.0
2.0
1.0
0.0
NPLs = |
 More Fee Revenue than
Our Peers % of Total Revenue from Fees
3Q13
•
More stable earnings
•
Greater growth opportunities
Industry Median as of 2Q13; Source: SNL Financial
16
19.1%
58.7%
3X
vs. Industry
Industry
Median |
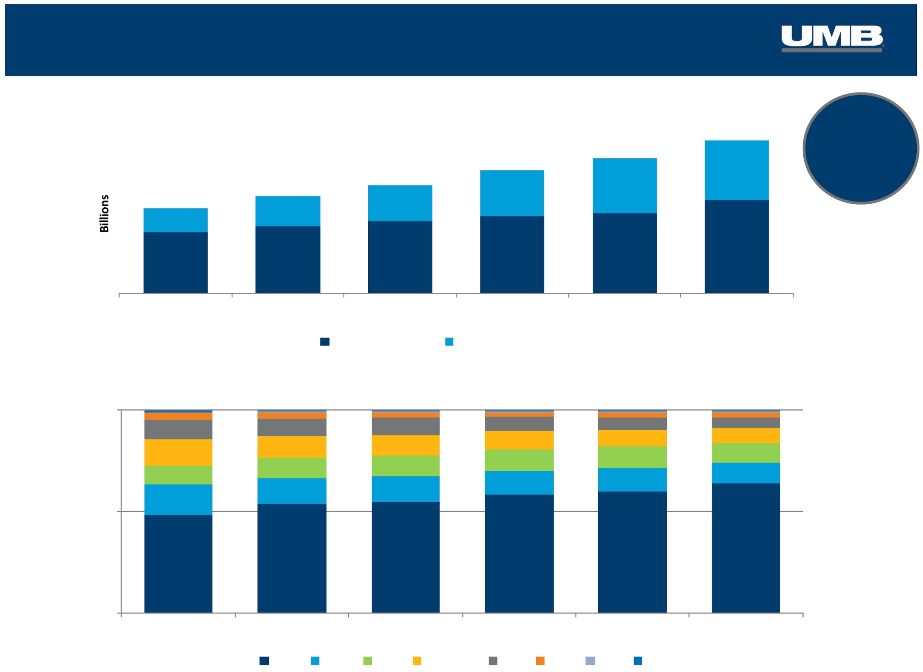
 Successful Record Growing Fee Businesses
Noninterest
Income
($000’s)
*Includes Scout Investments and UMB Bank wealth management
Asset Management
Businesses
(Total Company Assets Under Management*)
17
$64.7
$121.6
3Q05
3Q13
$8.2B
$38.7B
2005
3Q13 |
 Low-Cost Funding
Sources 18
>2X
vs. Industry
Non-Interest Bearing
Deposits
as
%
of
Total
Deposits
*Industry Median as of 2Q13; Source: SNL Financial
At September 30
43.2%
vs.
Industry Median* of
19.7%
non-interest bearing
deposits
2Q'13
2009
2010
2011
2012
2008
2007
2006
2005
2004
0.0%
5.0%
10.0%
15.0%
20.0%
25.0%
30.0%
35.0%
40.0%
45.0%
UMBF
Industry Median |
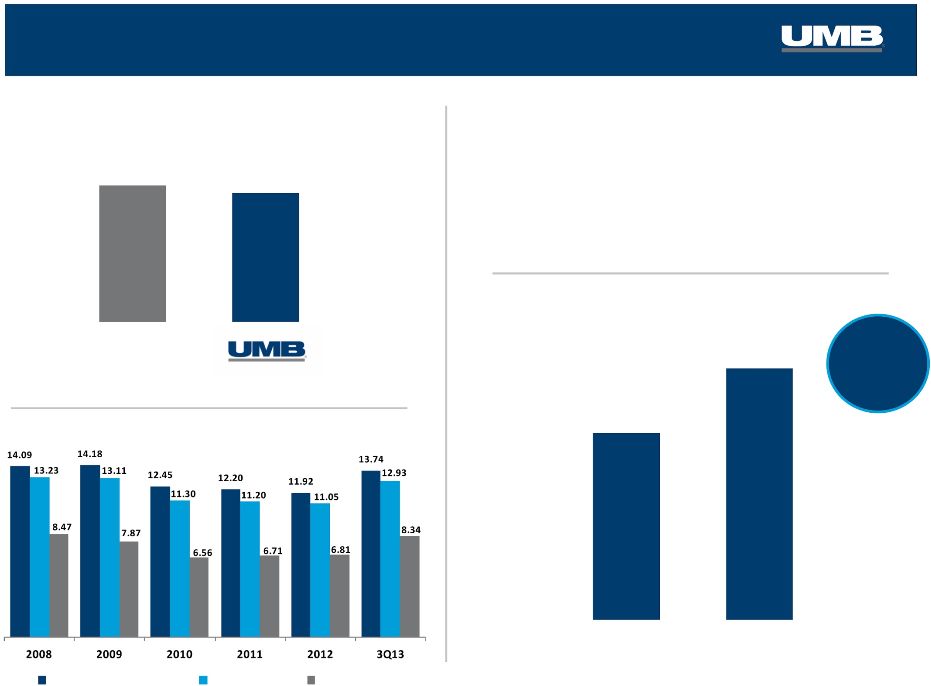 Balance
Sheet
–
Strong
Capital
Position
Tier 1 Capital Ratio vs. Industry
3Q 2013
Without Federal bailout funds
Industry Median as of 2Q13; Source: SNL Financial
19
Average Equity
Successful Equity Offering Supports Our Growth
September 2013
•
Strong interest from existing and new investors
•
Issued 3.9 million shares plus 15% overallotment
•
Gross proceeds of $242.2 million
Capital Ratio Trends
5 yr
CAGR
6.1%
$1,260.3
$936.1
3Q '08
3Q '13
13.69%
12.93%
Industry
Median
Total Risk-Based Capital
Tier 1 Capital
Tier 1 Leverage |
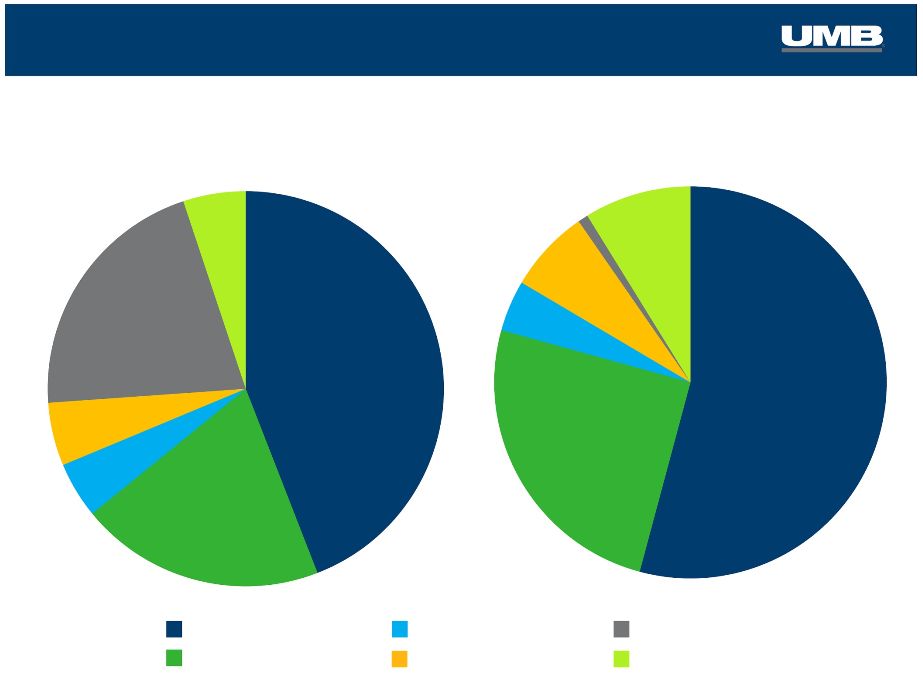 Commercial Real Estate
Commercial & Industrial
Consumer Real Estate
Credit Card
Home Equity
Consumer
Changing Loan Mix
Quality Loan Composition
3Q 2013
Year-End 2006
20
6.8%
0.8%
8.8%
4.2%
25.2%
54.2%
20.0%
44.1%
4.6%
5.2%
21.0%
5.1% |
 A
Financial Services Company The company
The business model
The performance |
 22
Consistent Performance –
Despite Headwinds
7.3%
11.6%
6.1%
9.4%
Revenue growth
Average Asset Growth
Average Equity Growth
EPS growth
5 year CAGR
(3Q’08--3Q’13)
29.4%
Total Assets Under Management
(diluted) |
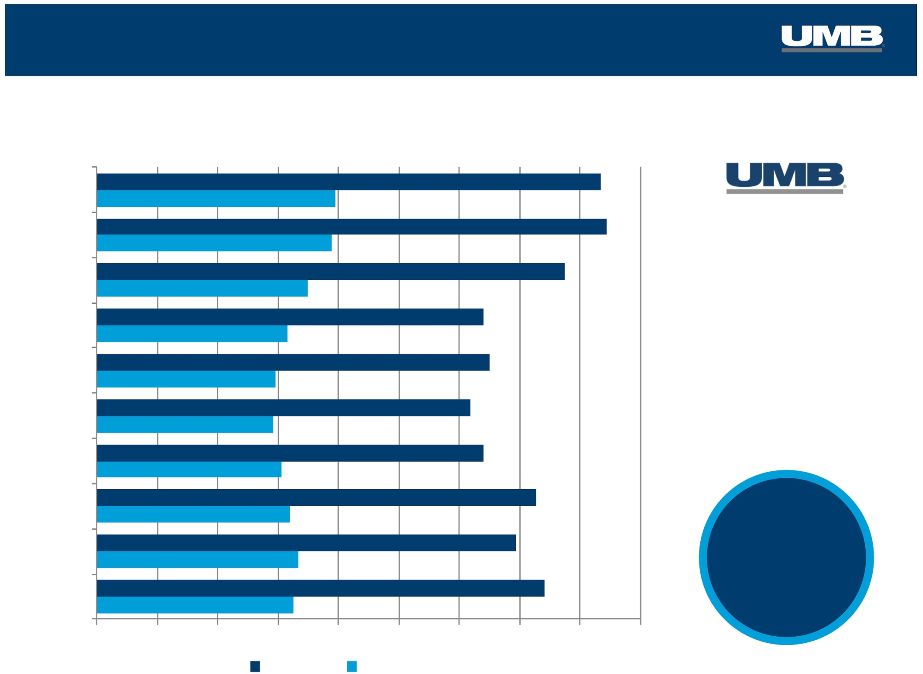
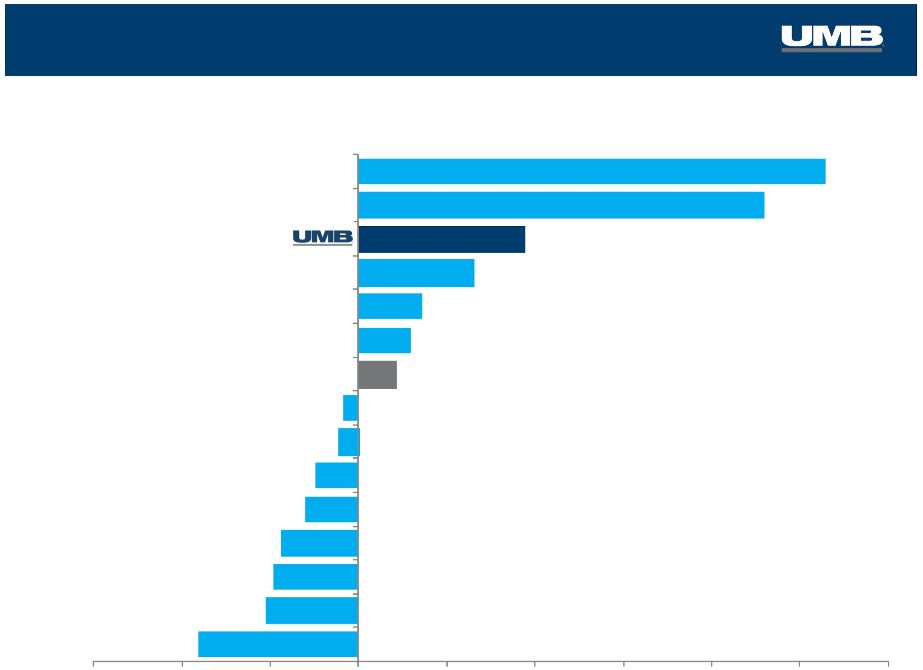 5-Year
Diluted
Earnings
Per
Share
3Q’08
–
3Q’13
CAGR
UMBF vs. Traditional Peers
*Bank industry defined as all publicly traded banks per SNL Financial;
EPS Growth vs. the Industry & Peers
CBSH
COBZ
HBHC
ONB
BXS
FMBI
CFR
CYN
BOKF
BOH
TCB
TRMK
FMER
*All publicly traded banks with 3Q’13 reported EPS per SNL Financial
23
Bank Industry Median *
26.5%
23.0%
9.4%
6.48%
3.6%
3.0%
2.1%
-0.85%
-1.1%
-2.4%
-3.0%
-4.4%
-4.8%
-5.2%
-9.1% |
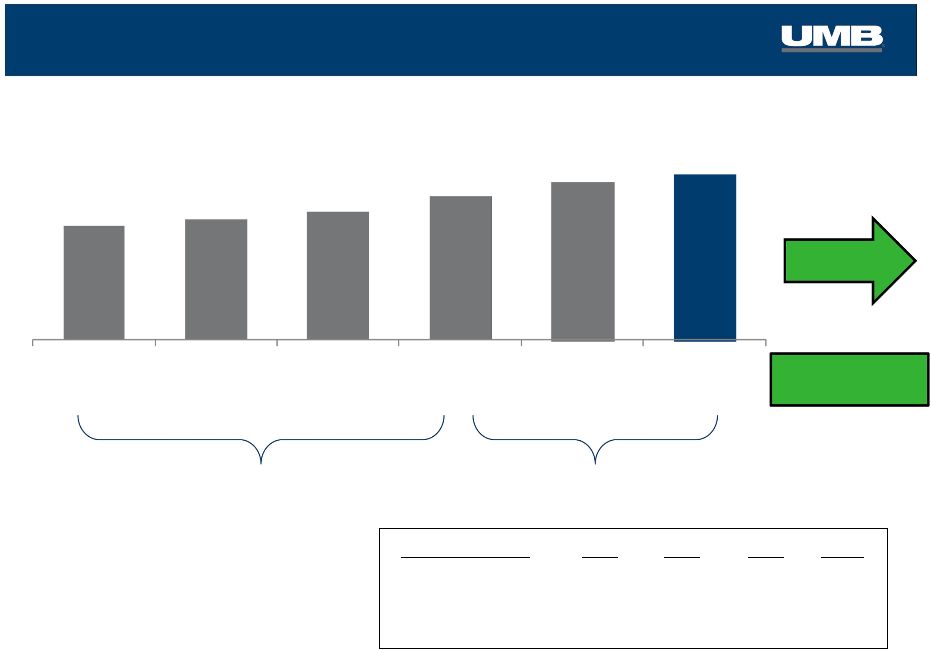 24
Slowing Annual Expense Growth
Total Noninterest Expense
+5.6%
+7.1%
+11.3%
+9.8%
+4.9%
Year-over-
Year
Increase
Completed 20 strategic
acquisitions from 2007 -
2010
Focus on improved profit margins
in fee businesses
2013…
Increased focus on
expense control
pre-tax profit margin
Inst Investment Mgmt:
Asset Servicing:
Payment Solutions:
Bank:
2011
23.8%
9.7%
30.3%
18.8%
2012
29.5%
11.9%
28.2%
20.5%
2010
18.0%
9.9%
25.8%
19.0%
3Q’13
37.6%
18.0%
12.5%
22.3%
2007
2008
2009
2010
2011
2012
$407.2
$430.2
$460.6
$512.6
$562.7
$590.5
(millions) |
 3
Quarter 2013 Highlights
rd |
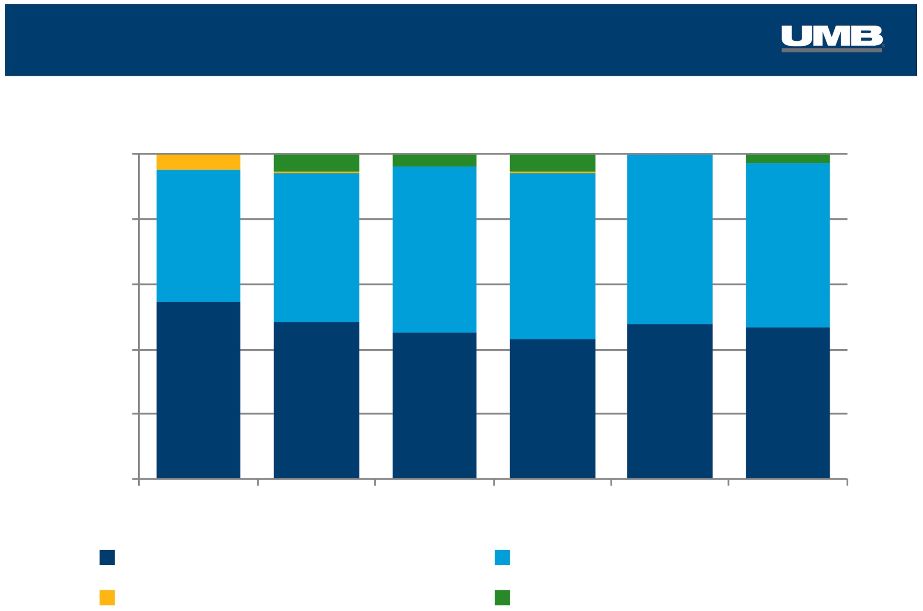 Changing Earning Asset Mix
26
100.0%
80.0%
60.0%
40.0%
20.0%
0.0%
54.6%
46.1%
48.2%
50.9%
45.3%
51.2%
43.1%
58.7%
47.6%
50.6%
46.5%
3Q'08
3Q'09
3Q'10
3Q'11
3Q'12
3Q'13
Net loans
Fed funds & resell agreements
Total securities
Interest Bearing Due From Banks
40.5% |
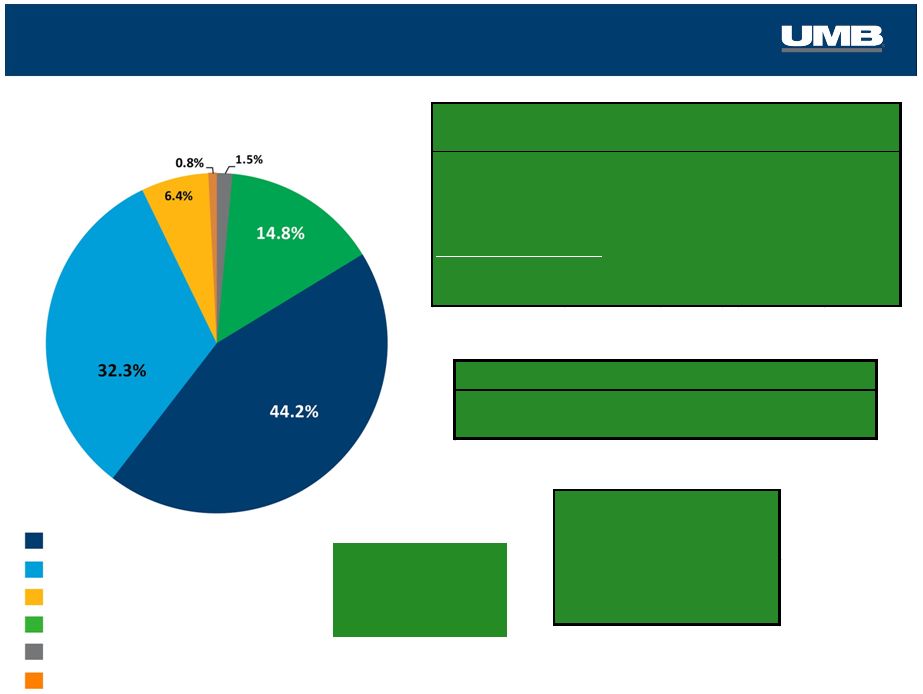 Average Balance:
$7.0 billion
Average Yield:
1.99%
Investment Mix
As of September 30, 2013
Mortgage-Backed Securities
Municipals
CDs & Corporates
Agencies
Treasuries
Trading Securities
Investment Portfolio Statistics
27
Duration/Life
(in months)
at 09/30/13
at 06/30/13
Avg. Life Total
49.39
48.67
Duration Total
46.31
46.80
Securities Gains
($ millions)
3Q12
259
$
4Q12
210
$
1Q13
5,893
$
2Q13
1,519
$
3Q13
1,140
$
Roll off
Purchased
($ millions)
Yield
($ millions)
Yield
1Q13
$413
1.98%
$769
1.31%
2Q13
$340
2.13%
$815
1.41%
3Q13
$265
1.85%
$77
1.02%
Scheduled Cash Flow
4Q13
$305
2.02%
Next 12 months
$1,127
1.88% |
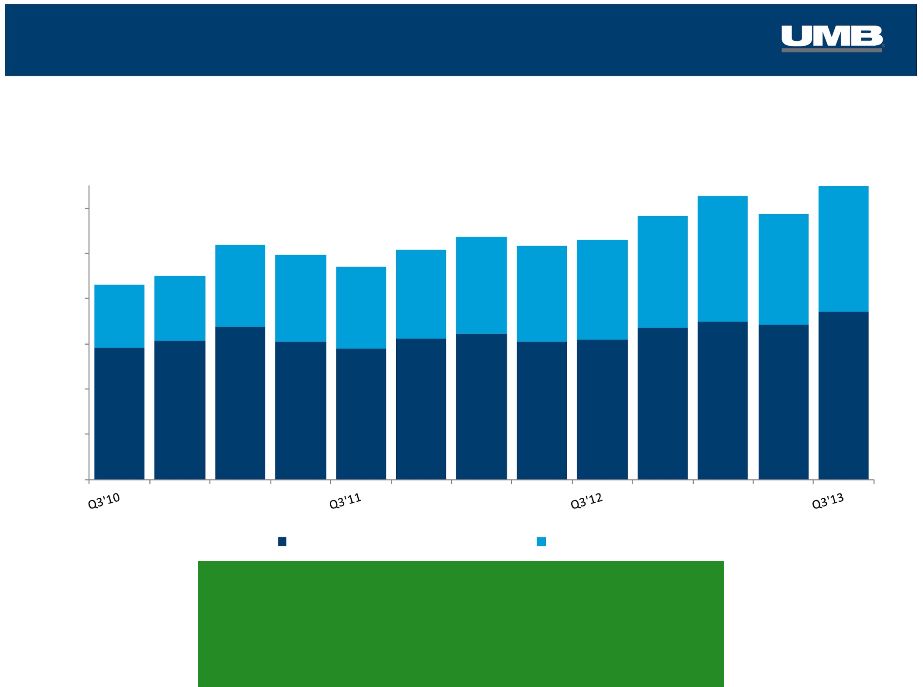 Liabilities
Deposit Growth & % of Free Funds
($ billions)
3Q’13
Cost of Funds 0.16%
Including DDA 0.10%
28
$12.0
$10.0
$8.0
$6.0
$4.0
$2.0
$0.0
$8.6
$9.4
$10.6
$13.0
32.3%
38.5%
41.6%
43.2%
Interest Bearing
Non-Interest Bearing |
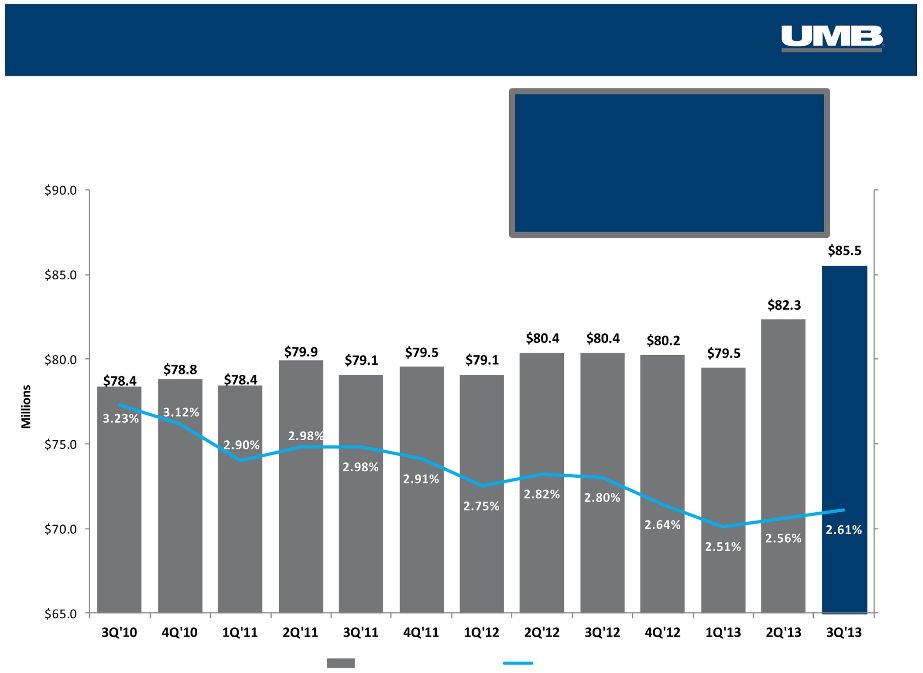 Net Interest
Income 29
+6.4%
3Q 13 vs. 3Q 12
•
Earning asset growth
•
Improved deposit pricing
’
’
Net Interest Income
NIM% |
 Noninterest Income Highlights
5 Year
CAGR
3Q’08–
3Q’13
16.8%
Trust & Securities Processing Revenue
Trust & Securities Processing Composition:
Bankcard Fees
Deposit Service Charges
Insurance Fees & Commissions
Trading & Investment Banking
Trust & Securities Processing
Gains on Sale of Securities
Brokerage Fees
Other
$68.5 million in 3Q13
Primary components:
•$20.3M
–
Asset
Servicing
the Bank segment
30
3.1%
2.4%
0.9%
0.7%
17.3%
6.8%
12.5%
56.3%
$31.5
$32.6
$39.8
$51.9
$56.3
$68.5
•$32.9M - Institutional Investment Management
•$15.2M – Personal & Institutional Asset Mgmt in |
 Noninterest Expense
•
Increase primarily driven by higher salary and benefits expense of $4.9 million,
increased equipment expense of $1.9 million and increased processing fees
of $1.5 million related to fees paid to third-party distributors of the
Scout Funds. Salary
CAGR
7.9%
NI
Income
CAGR
9.0%
NI
Expense
CAGR
6.8%
Managed FTE Costs; Growing Noninterest Income
31
* Noninterest Income/Noninterest Expense
Noninterest
expense
increased
4.9%
to
$153.1
million
vs.
3Q’12
Salary/Benefit Expense
Total Noninterest Expense
Noninterest income
Coverage Ratio* |
 Business Segment Updates |
 Institutional Investment Management
* Industry data source: Strategic Insight
3 Quarter 2013 Highlights
33
$22.6
$23.5
$25.7
$26.3
$29.3
3Q'12
4Q'12
1Q'13
2Q'13
3Q'13
Total Scout Assets Under Management
($ billions)
AUM increased 29.6% year-
over-year to $29.3 billion
Record net inflows of $1.9
billion for Q3’13; year-to-date
flows of $4.4 billion
Q3’13 industry stats: Equity
funds realized $113.2B in net
inflows; Taxable bond funds
realized $14.7B in net outflows
rd
Institutional Investment Management Operating Results
(unaudited, $000s)
3 mos Ended
June 30,
Year-Over-Year
Linked-Quarter
2013
2012
2013
Net Interest income
(11)
(1)
(10)
1000.0%
10.0%
Noninterest income
33,836
24,789
29,160
36.5%
16.0%
Noninterest expense
21,097
17,316
18,932
21.8%
11.4%
NI before taxes
12,728
7,472
10,218
70.3%
24.6%
Income tax expense
3,501
2,098
2,691
66.9%
30.1%
Net income
9,227
5,374
7,527
71.7%
22.6%
pre-tax profit margin
37.6%
30.1%
35.1%
September 30,
% Change
3 mos Ended |
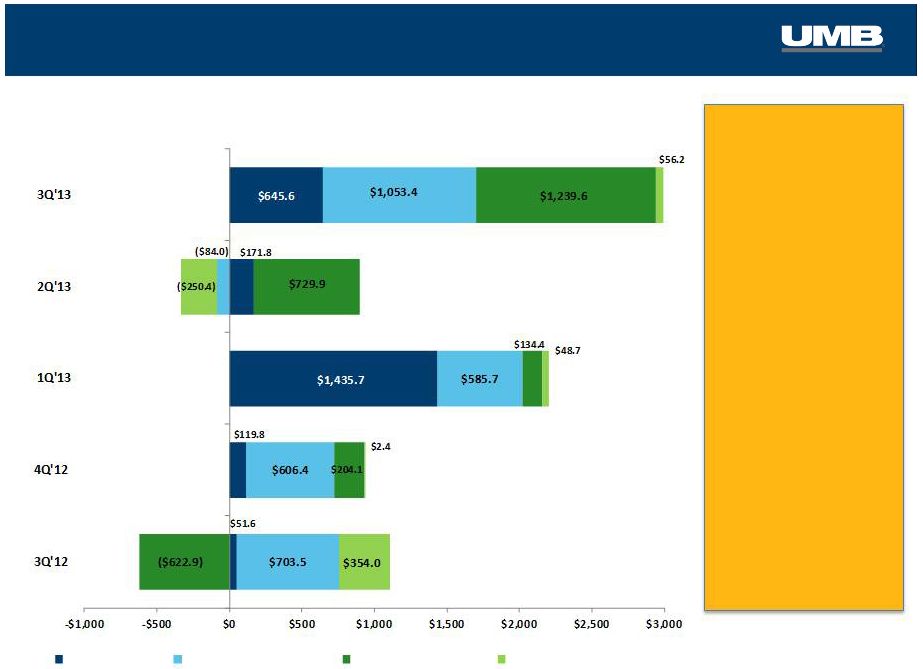 AUM Drivers
($millions)
Institutional Investment Management
34
$2,994.8
$29,308.9
Total Change
($millions)
Total AUM
($millions)
$2,204.5
$932.7
$486.2
$25,746.8
$23,542.3
$22,609.6
$567.3
$26,314.1
Equity Flows
Equity Market Impact
Fixed Income Flows
Fixed Income Market Impact |
 Total AUM
$19.7B
$23.5B
$25.7B
$26.3B
Institutional Investment Management
35
$29.3B
2011
2012
1Q13
2Q13
3Q13
Equity Mutual Funds
Equity Institutional & Other
Fixed Income Institutional & Other
Fixed Income Mutual Funds
$8.2
$10.4
$11.0
$11.1
$12.1
$10.3
$11.4
$11.4
$11.6
$12.3
$0.6
$0.9
$2.3
$2.3
$3.0
$0.6
$0.8
$1.0
$1.3
$1.9 |
 AUM
by
Strategy
–
As
of
3Q’13
Fixed Income Strategies
Equity Strategies
International
Mid Cap
International ADR
Emerging Markets
Global
Small Cap
Other:
36
Core Plus
Low Duration
Long Duration
Core
Intermediate
Unconstrained
Global Aggregate
Real Return
Equity
Fixed Income |
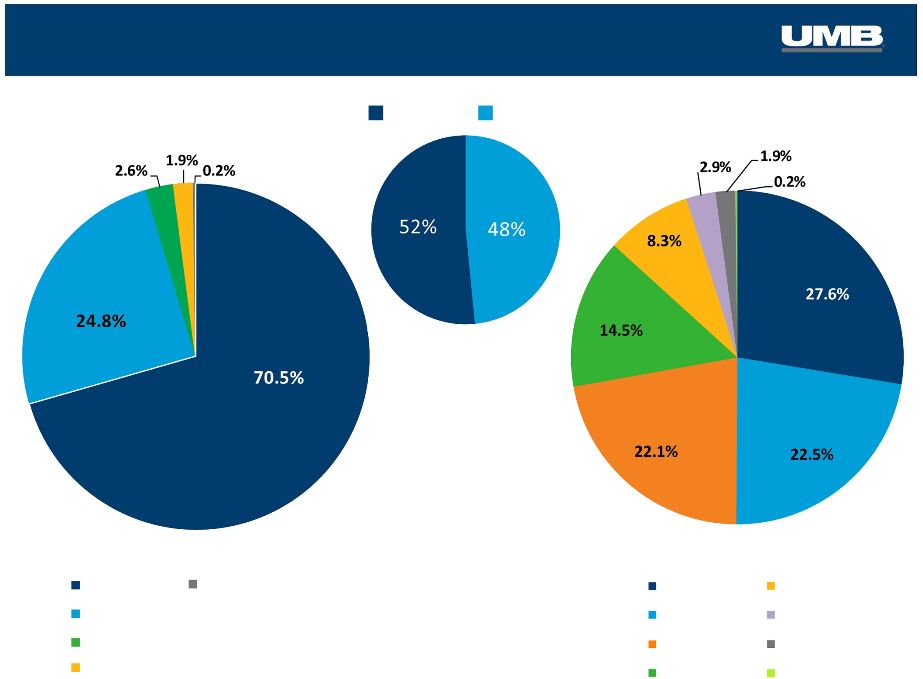
 Fixed Income Rotation
Fixed Income AUM
Strategy Mix
3Q’13
3Q’12
37
Core Plus
Low Duration
Long Duration
Unconstrained
Core
Intermediate
Global Aggregate
Real Return
27.6%
22.5%
22.1%
14.5%
8.3%
13.7%
16.3%
25.1%
40.9%
2.3%
1.5%
0.2%
2.9%
1.9%
0.2% |
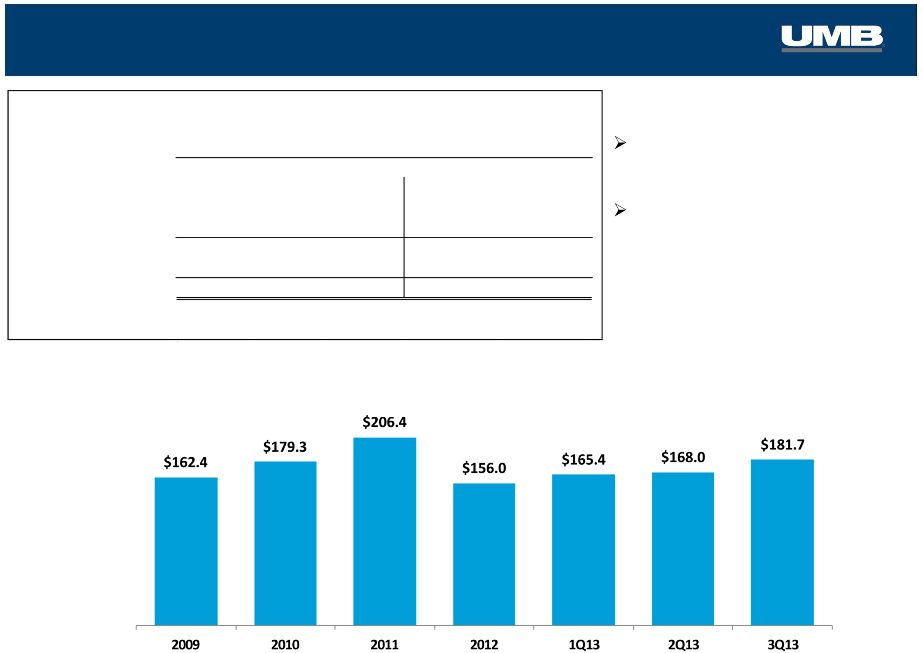 Asset Servicing
3
Quarter 2013 Highlights
38
Assets Under Administration
($billions)
Asset Servicing Operating Results (
unaudited, $000s)
3 mos Ended
June 30,
Year-Over-Year
Linked-Quarter
2013
2012
2013
Net interest income
550
472
587
16.5%
-6.3%
Noninterest income
20,429
18,300
19,275
11.6%
6.0%
Noninterest expense
17,201
17,142
17,054
0.3%
0.9%
NI before taxes
3,778
1,630
2,808
131.8%
34.5%
Income tax expense
1,468
608
967
141.4%
51.8%
Net income
2,310
1,022
1,841
126.0%
25.5%
pre-tax profit margin
18.0%
8.7%
14.1%
% Change
September 30,
3 mos Ended
Total
AUA
increased
by
21%
to
$181.7 billion year-over-year
In the past 12 months, fund
accounting and administration
AUA grew by 40%; 26 new funds
added
rd |
 Asset Servicing
Fund Accounting & Administration
Alternative Asset Servicing
Custody
Transfer Agency
Business Metrics
39
Assets Under Administration
# of Funds Serviced
Assets Under Administration
# of Funds Serviced
Assets Under Administration
# of Custody Accounts
# of Shareholders
# of Funds Serviced |
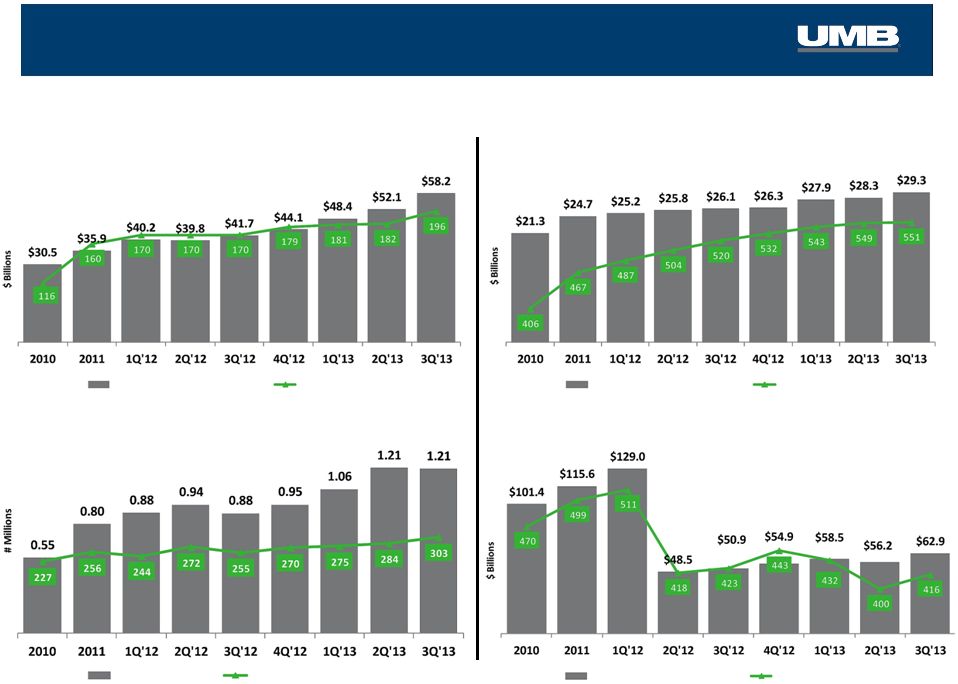
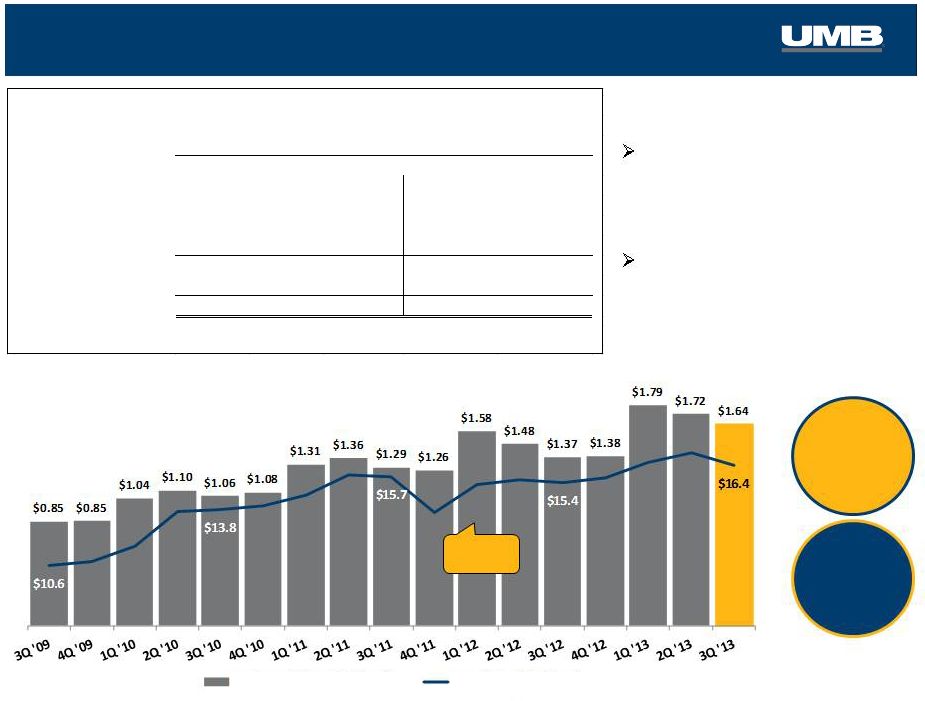 Payment Solutions
Total Card Purchase Volume
& Interchange Revenue
CAGR
Commercial credit card
purchase volume +9.8% year-
over-year to $321 million;
provided 46% of interchange
Interchange revenue +6.6%
year-over-year to $16.4 million
3
Quarter 2013 Highlights
40
Durbin
effective
Purchase
Volume
3Q ‘09–’13
17.9%
Inter-
change
3Q ‘09–’13
11.7%
rd
Purchase Volume ($ billions)
Interchange ($ millions)
Payment Solutions Operating Results (
3 mos Ended
June 30,
Year-Over-Year
Linked-Quarter
2013
2012
2013
Net interest income
11,587
10,843
11,192
6.9%
3.5%
Provision for loan losses
4,667
1,570
3,318
197.3%
40.7%
Noninterest income
18,409
16,081
18,649
14.5%
-1.3%
Noninterest expense
21,566
17,764
21,986
21.4%
-1.9%
NI before taxes
3,763
7,590
4,537
-50.4%
-17.1%
Income tax expense
1,311
2,024
1,350
-35.2%
-2.9%
Net income
2,452
5,566
3,187
-55.9%
-23.1%
pre-tax profit margin
12.5%
28.2%
15.2%
% Change
September 30,
3 mos Ended
unaudited, $000s) |
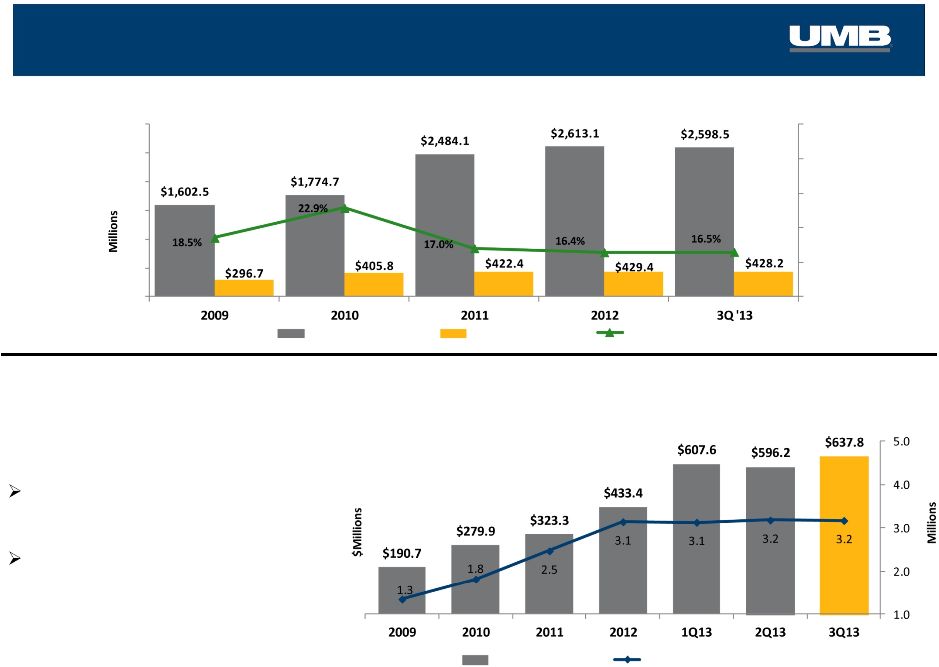 Payment Solutions
Health Savings Accounts & Balances
* Deposits and investment assets
Healthcare card purchase volume
+52% to $680.2 million vs. 3Q’12
Customer deposits and assets +50%
to $637.8 million vs. 3Q’12
3
Quarter
2013
Highlights
Healthcare Services
Card Utilization
41
Commitments
Outstandings
Utilization
HSA Balances*
# of HSA & FSA accounts
rd |
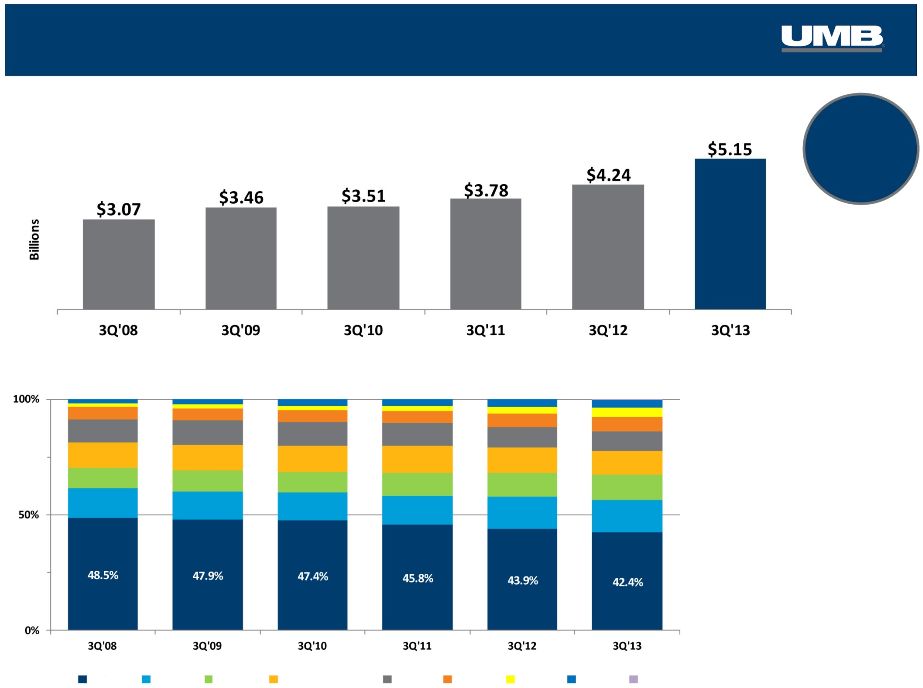
 Bank
Assets Under Management
($
billions)
HELOC Lending
(average balances)
Total
net
loans
grew
for
the
14
consecutive quarter, increasing
20.9% year-over-year to
$6.4 billion Private Banking exceeded $305 million
in average loan balances, an increase
of
38.4%
over
Q3
2012
Average Small Business Banking loans
increased
25%
year-over-year
to
$167.2
million
42
3 mos Ended
June 30,
Year-Over-Year
Linked-Quarter
2013
2012
2013
Net interest income
73,419
69,051
70,558
6.3%
4.1%
Provision for loan losses
1,833
2,930
1,682
-37.4%
9.0%
Noninterest income
48,951
47,151
46,501
3.8%
5.3%
Noninterest expense
93,199
93,683
92,339
-0.5%
0.9%
NI before taxes
27,338
19,589
23,038
39.6%
18.7%
Income tax expense
6,895
5,426
5,664
27.1%
21.7%
Net income
20,443
14,163
17,374
44.3%
17.7%
pre-tax profit margin
22.3%
16.9%
19.7%
3 mos Ended
% Change
September 30,
Commitments
Balances
Utilization
Private Wealth & Institutional Asset Mgmt
Prairie Capital Management
3
Quarter 2013 Highlights
rd
th
Bank Operating Results (
unaudited, $000s) |
 Bank
High Growth Regions
3Q’13 vs. 3Q’12
•
Arizona
+65%
•
Nebraska
+32%
Commercial Loans By Region
•
St. Louis
+32%
•
Oklahoma +25%
•
Colorado +21%
Commercial Loan Growth
(C&I and CRE Loans)
5 yr
CAGR
3Q ‘08–’13
10.9%
43
KC
CO
STL
Greater MO
KS
OK
AZ
NE
TX |
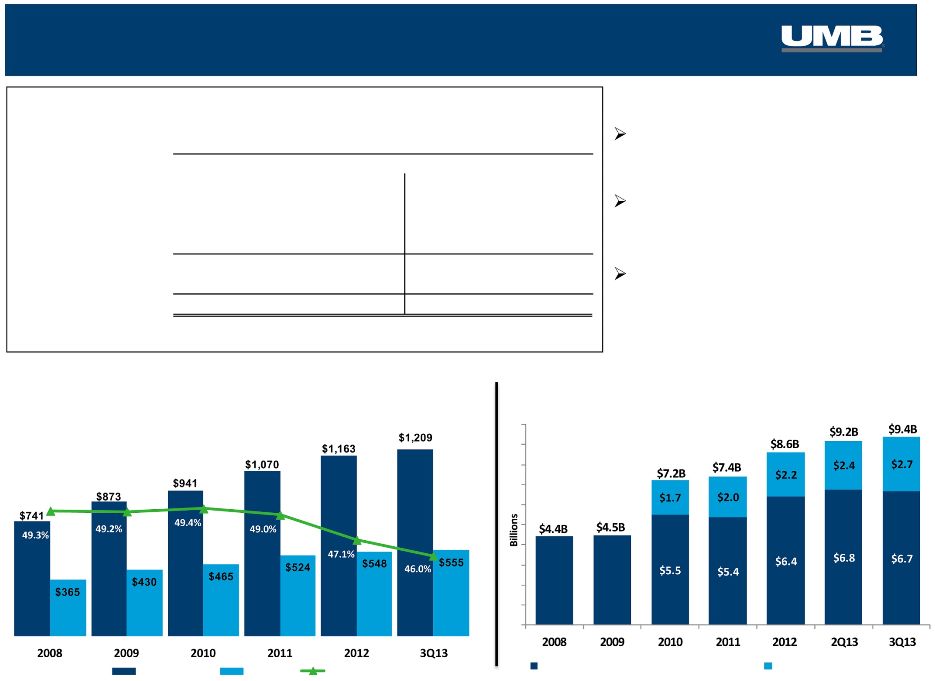
 Bank
Average Deposits
5 yr
CAGR
3Q ‘08–’13
12.6%
Deposits By Region
44
KC
STL
CO
Gtr MO
KS
OK
AZ
NE
Interest Bearing
Non-Interest Bearing
3Q'08
3Q'09
3Q'10
3Q'11
3Q'12
3Q'13
3Q'08
3Q'09
3Q'10
3Q'11
3Q'12
3Q'13
48.1%
53.8%
55.0%
58.3%
60.0%
64.1%
28.6%
30.8%
32.7%
37.1%
40.4%
39.6%
$6.5
$7.5
$8.3
$9.5
$10.4
$11.8
100%
50%
0% |
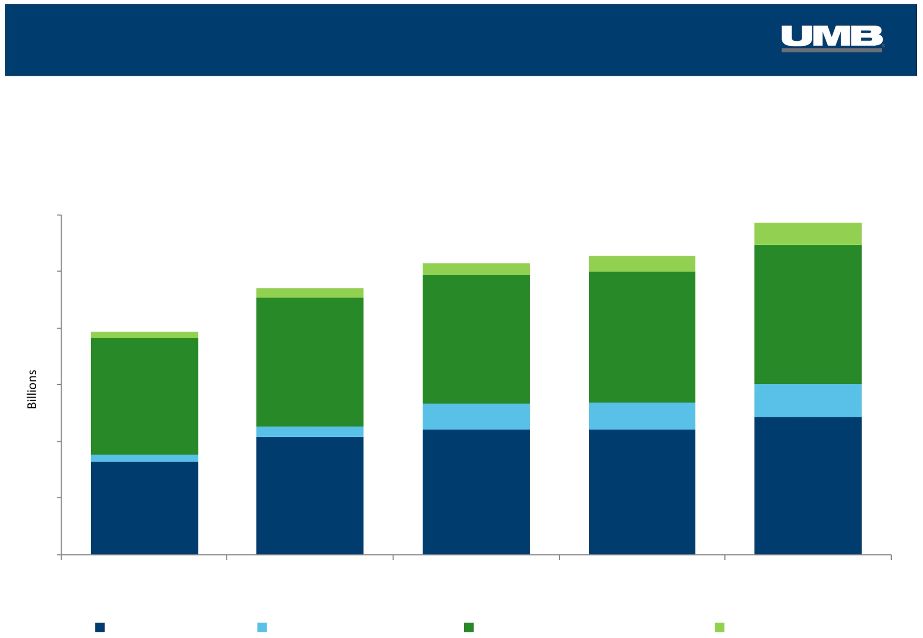
 Deposit
Composition 45
Deposit Composition by Line of Business
At September 30, 2013
Actual
Pro-forma,
After deposit migration
Commercial
Consumer
Asset Servicing
Private Wealth Management
Healthcare
Inst. Banking & Investor Services
Small Business
Inst. Asset Management
0.3%
4.4%
4.9%
6.6%
12.0%
17.1%
26.0%
28.6%
0.3%
4.8%
5.4%
7.3%
13.2%
9.0%
28.6%
31.4% |
 Strengths We are Leveraging
Diversified
revenue
Growing fee
businesses
Infrastructure
Success building a diversified
financial services company
Building scale through
strategic acquisitions
Existing technology, operations,
products, distribution
46 |
 Building a company
for the next 100 years.
UMB Financial
Third Quarter 2013 |