Attached files
| file | filename |
|---|---|
| 8-K - FORM 8-K - LyondellBasell Industries N.V. | d619014d8k.htm |
| EX-99.1 - EX-99.1 - LyondellBasell Industries N.V. | d619014dex991.htm |
 Third-Quarter 2013 Earnings
October 29, 2013
Exhibit 99.2
Jim Gallogly, Chief Executive Officer Karyn Ovelmen, Chief
Financial Officer
Sergey Vasnetsov, SVP - Strategic Planning and Transactions Doug Pike, VP -
Investor Relations |
 lyondellbasell.com
Cautionary Statement
2
The statements in this presentation relating to matters that are not historical facts are
forward-looking statements. These forward-looking statements are based upon
assumptions of management which are believed to be reasonable at the time made and are subject
to significant risks and uncertainties. Actual results could differ materially based on factors including, but not
limited to, the business cyclicality of the chemical, polymers and refining industries; the
availability, cost and price volatility of raw materials and utilities, particularly the cost
of oil, natural gas, and associated natural gas liquids; competitive product and pricing
pressures; labor conditions; our ability to attract and retain key personnel; operating interruptions
(including leaks, explosions, fires, weather-related incidents, mechanical failure,
unscheduled downtime, supplier disruptions, labor shortages, strikes, work stoppages or
other labor difficulties, transportation interruptions, spills and releases and other environmental risks); the
supply/demand balances for our and our joint ventures’ products, and the related effects of
industry production capacities and operating rates; our ability to achieve expected cost
savings and other synergies; legal and environmental proceedings; tax rulings, consequences or
proceedings; technological developments, and our ability to develop new products and process technologies;
potential governmental regulatory actions; political unrest and terrorist acts; risks and
uncertainties posed by international operations, including foreign currency fluctuations;
and our ability to comply with debt covenants and service our debt. Additional factors
that could cause results to differ materially from those described in the forward-looking statements can be found in the
“Risk Factors” section of our Form 10-K for the year ended December 31, 2012, which can
be found at www.lyondellbasell.com on the Investor Relations page and on the Securities and
Exchange Commission’s website at www.sec.gov.
The illustrative results or returns of growth projects are not in any way intended to be, nor should
they be taken as, indicators or guarantees of performance. The assumptions on which they are
based are not projections and do not necessarily represent the Company’s expectations and
future performance. You should not rely on illustrated results or returns or these assumptions as
being indicative of our future results or returns. This presentation contains time
sensitive information that is accurate only as of the date hereof. Information contained in this
presentation is unaudited and is subject to change. We undertake no obligation to update the
information presented herein except as required by law.
|
 lyondellbasell.com
Information Related to Financial Measures
3
We have included EBITDA in this presentation, which is a non-GAAP measure, as we believe that
EBITDA is a measure commonly used by investors. However, EBITDA, as presented herein, may not
be comparable to a similarly titled measure reported by other companies due to differences in
the way the measure is calculated. We calculate EBITDA as income from continuing
operations plus interest expense (net), provision for (benefit from) income taxes, and
depreciation & amortization. EBITDA should not be considered an alternative to profit or
operating profit for any period as an indicator of our performance, or as an alternative to
operating cash flows as a measure of our liquidity. See Table 9 of our accompanying earnings
release for reconciliations of EBITDA to net income. While we also believe that free
cash flow (FCF) and book capital are measures commonly used by investors, free cash flow and
book capital, as presented herein, may not be comparable to similarly titled measures reported
by other companies due to differences in the way the measures are calculated. For purposes of this
presentation, free cash flow means net cash provided by operating activities minus capital
expenditures and book capital means total debt plus stockholders’ equity plus minority
interests. |
    lyondellbasell.com
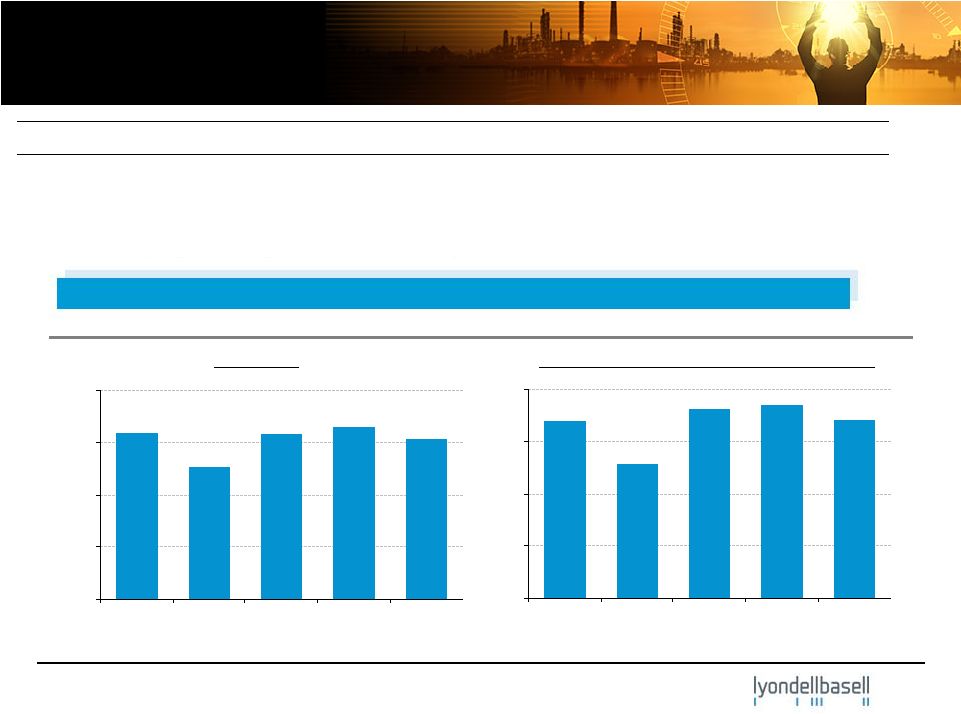
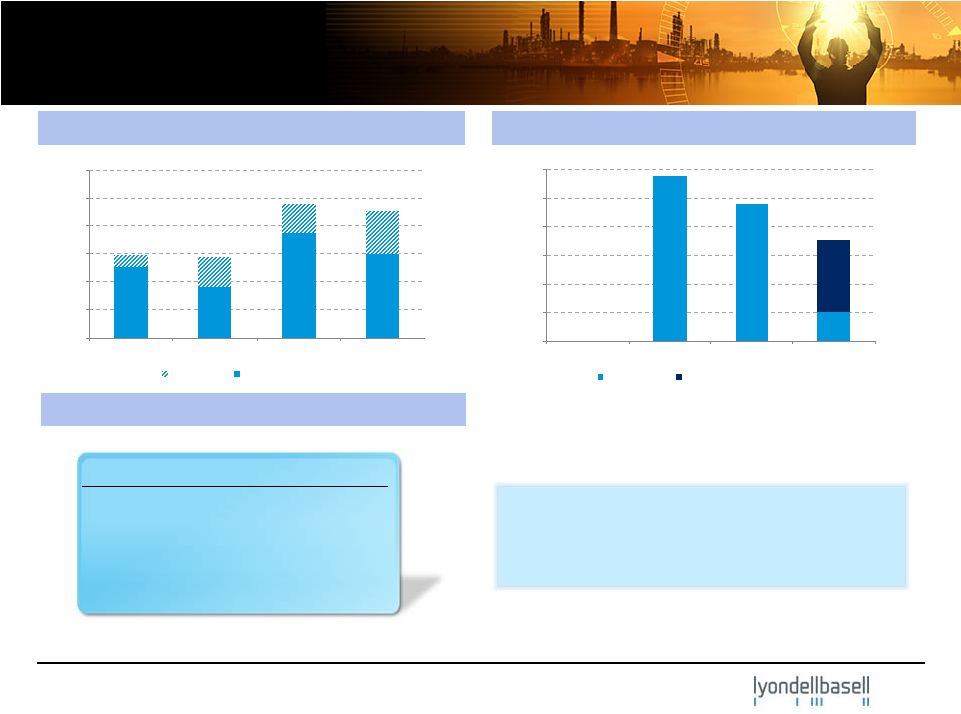
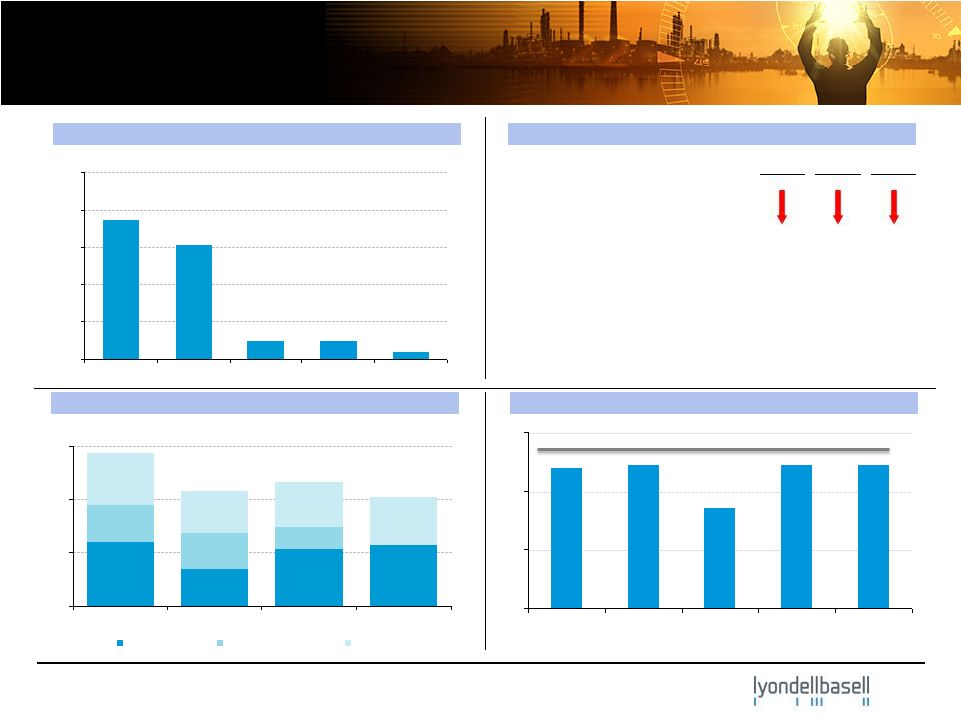
Highlights
EBITDA
(1)
($ in millions)
4
(1) EBITDA and income from continuing operations include a pre-tax lower of
cost or market inventory valuation adjustment of $71 million in the third quarter 2012 which reversed
a charge in the second quarter of 2012, due to a recovery in market
prices. 500
1,000
1,500
$2,000
3Q'12
4Q'12
1Q'13
2Q'13
3Q'13
250
500
750
$1,000
3Q'12
4Q'12
1Q'13
2Q'13
3Q'13
($ in millions, except per share data)
3Q'13
2Q'13
3Q'12
EBITDA
(1)
$1,531
$1,652
$1,589
Income from Continuing Operations
(1)
$854
$923
$851
Diluted Earnings ($ / share) from Continuing Operations
$1.51
$1.60
$1.47
Income
from
Continuing
Operations
(1)
LTM EBITDA - $6,033 million LTM EPS - $5.80 per
share |
 lyondellbasell.com
LyondellBasell Safety Performance
Injuries per 200,000 Hours Worked
(1)
1) Includes employees and contractors.
5
0.0
0.1
0.2
0.3
0.4
0.5
2009
2010
2011
2012
2013 Q3 YTD |
 lyondellbasell.com
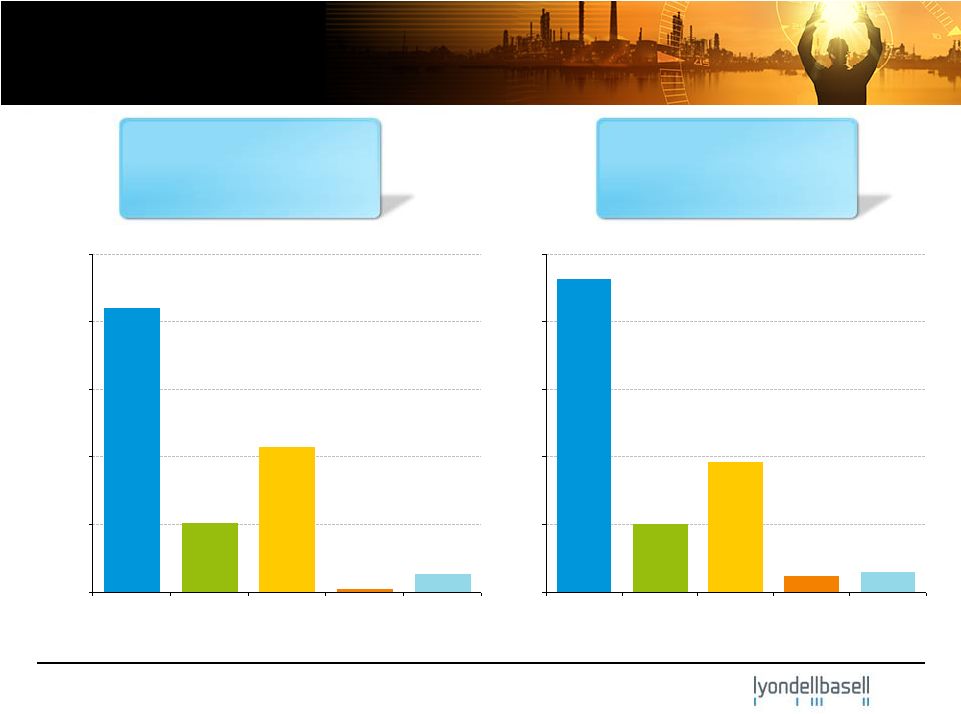
September 2013 LTM EBITDA
Third Quarter 2013 and Last-Twelve-Months
(LTM) Segment EBITDA
Third Quarter 2013 EBITDA
($ in millions)
($ in millions)
6
200
400
600
800
$1000
Olefins &
Polyolefins -
Americas
Olefins &
Polyolefins -
EAI
Intermediates
& Derivatives
Refining
Technology
750
1,500
2,250
3,000
$3,750
Olefins &
Polyolefins -
Americas
Olefins &
Polyolefins -
EAI
Intermediates
& Derivatives
Refining
Technology
Q3’13 EBITDA
$1,531 million
Q3’13 Operating Income
$1,207 million
LTM September 2013 EBITDA
$6,033 million
LTM Operating Income
$4,797 million |
 lyondellbasell.com
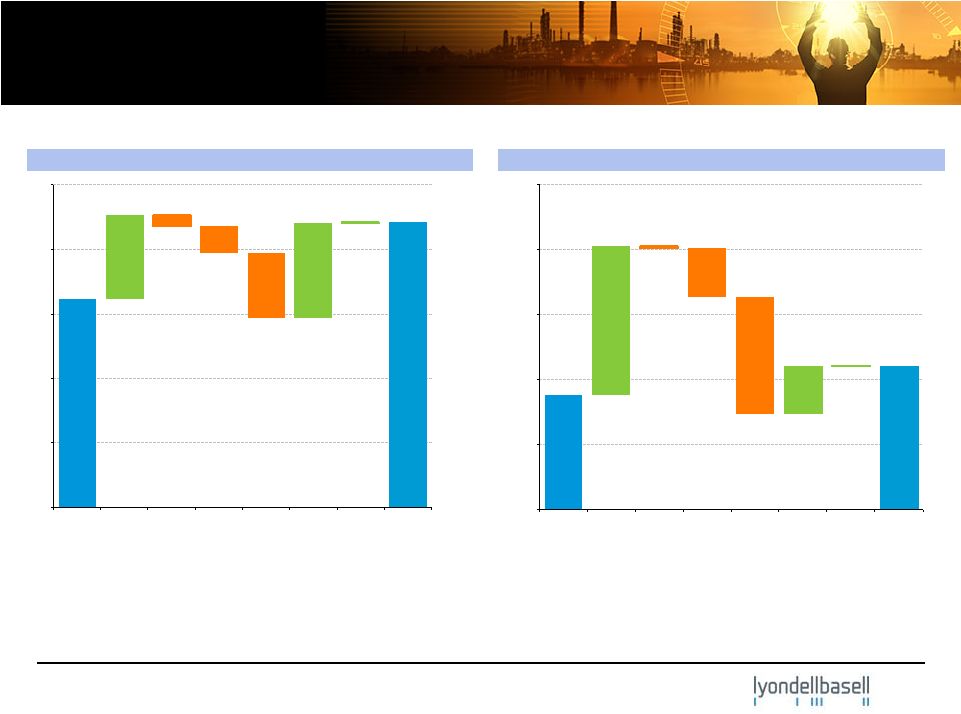
$3,527
$4,414
0
2,000
4,000
6,000
8,000
$10,000
Q3'12
Beginning
Cash
Balance
CF from
Operations
excl.
Working
Capital
Working
Capital
Changes
Capex
Dividends &
Share
Repurchases
Net Debt
Borrowings
Other
Q2'13 Ending
Cash
Balance
$3,233
$4,414
0
1,000
2,000
3,000
4,000
$5,000
Q2'13
Beginning
Cash
Balance
CF from
Operations
excl.
Working
Capital
Working
Capital
Changes
Capex
Dividends &
Share
Repurchases
Net Debt
Borrowings
Other
Q2'13 Ending
Cash
Balance
Cash Flow
1) Beginning and ending cash balances include cash and cash equivalents; 2)
Includes accounts receivable, inventories, and accounts payable; 3) Includes capital and maintenance
turnaround spending.
(3)
(2)
(1)
($ in millions)
(2)
(1)
Third Quarter 2013
LTM September 2013
(3)
(1)
7
(1) |
 lyondellbasell.com
500
1,000
1,500
2,000
2,500
$3,000
May - Dec 2010
2011
FY2012
2013 Q3 YTD
Dividends
Share Repurchases
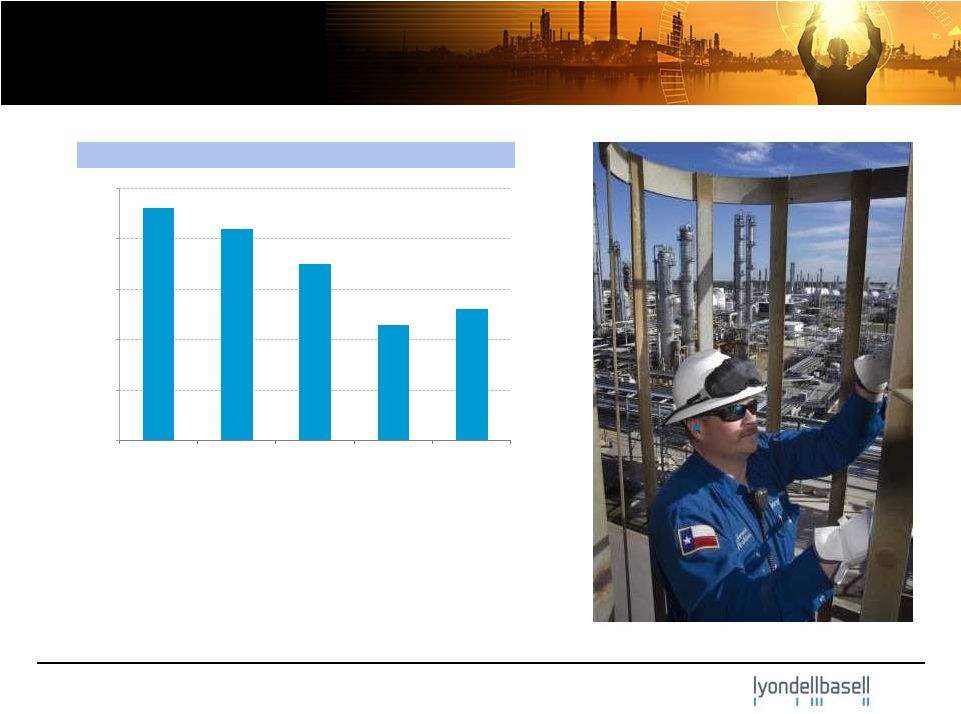
8
Sustained Cash Generation:
Share Repurchases & Dividends
Corpus Christi NGL Fractionator
Cash From Operations
Dividends & Share Repurchases
Key Statistics
($ in millions)
1,000
2,000
3,000
4,000
5,000
$6,000
May - Dec 2010
2011
2012
LTM Sept 2013
Capex
Free Cash Flow
($ in millions)
~ $1.3 billion invested in share
repurchases since May 22, 2013
shareholders’
meeting
Snapshot at September 30, 2013
LTM FCF: $3.0 billion
LTM Capex: $1.5 billion
Cash: $4.4 billion
Total Debt/LTM EBITDA: 1.0x
Total Debt/Book Capital: 33% |
 lyondellbasell.com
(20)
0
20
40
60
Ethane Margin
Naphtha Margin
HDPE Margin
Ethylene/HDPE Chain
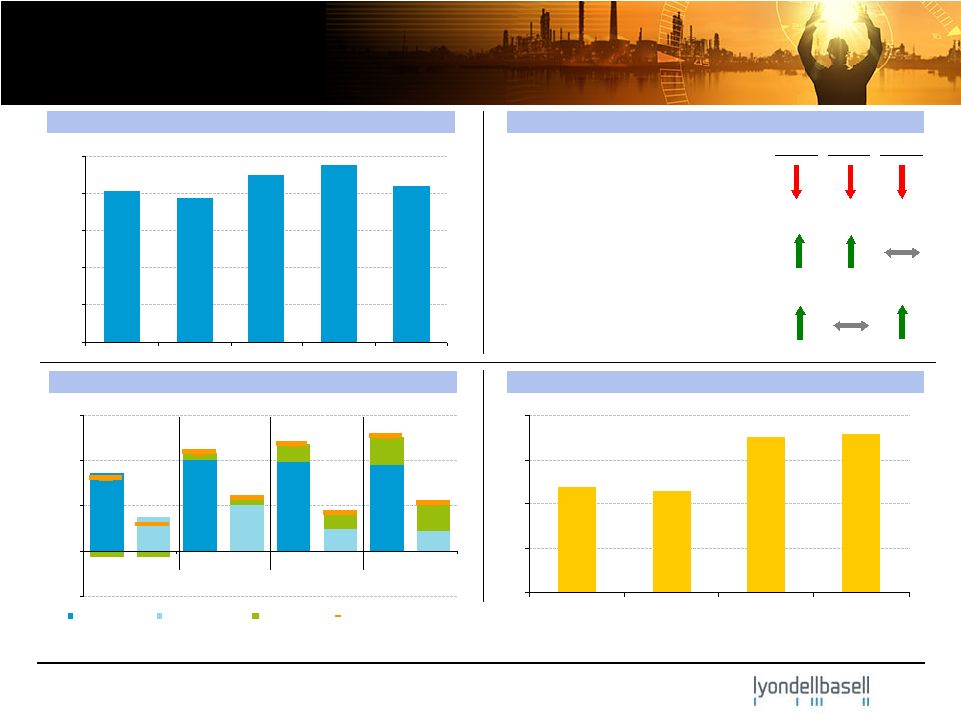
Olefins & Polyolefins -
Americas
Highlights and Business Drivers -
3Q’13
U.S. Olefins
•
Clinton olefin and polyolefins turnaround
•
Limited spot sales; Metathesis unit up
•
Contract price down ~ 1¢/lb
Polyethylene
•
Price up ~ 2¢/lb
•
Volumes flat
Polypropylene (includes Catalloy)
•
Spread flat
•
Volumes up ~ 5%
Ethylene Chain Margins
(2)
EBITDA
(1)
Performance vs. 2Q’13
Polypropylene Margins
(2)
EBITDA
Margin
Volume
($ in millions)
(cents / lb)
(cents / lb)
3Q’12
2Q’13
3Q’13
Oct ’13
9
1)
200
400
600
800
$1000
3Q'12
4Q'12
1Q'13
2Q'13
3Q'13
0
1
2
3
4
3Q'12
2Q'13
3Q'13
Oct'13
EBITDA includes a lower of cost or market inventory valuation adjustment of $71 million in the
third quarter 2012 which reversed a charge in the second quarter 2012, due to a recovery
in market prices; 2) Source: quarterly average industry data from third party consultant . |
 lyondellbasell.com
(10)
5
20
35
50
3Q'12
2Q'13
3Q'13
Oct'13
HDPE Margin
Naphtha Margin
Ethylene/HDPE Chain
Olefins & Polyolefins -
Europe, Asia, International
Highlights and Business Drivers -
3Q’13
EU Olefins
•
Margin compression –
higher naphtha
and lower co-products prices
•
Operating rate ~ 90%
Polyethylene
•
Spread up ~ 2¢/lb
•
Volumes down ~ 8%
Polypropylene (includes Catalloy)
•
Spread slightly up
•
Volumes down ~ 11%
JV equity income
European Ethylene Chain Margins
(1)
EBITDA
Performance vs. 2Q’13
European Polypropylene Margins
(1)
EBITDA
Margin
Volume
($ in millions)
(cents / lb)
(cents / lb)
10
1) Source: quarterly average data from third party consultant.
100
200
300
$400
3Q'12
4Q'12
1Q'13
2Q'13
3Q'13
(6)
(4)
(2)
0
2
3Q'12
2Q'13
3Q'13
Oct'13 |
 lyondellbasell.com
0
15
30
45
3Q12
2Q13
3Q13
4Q13 E
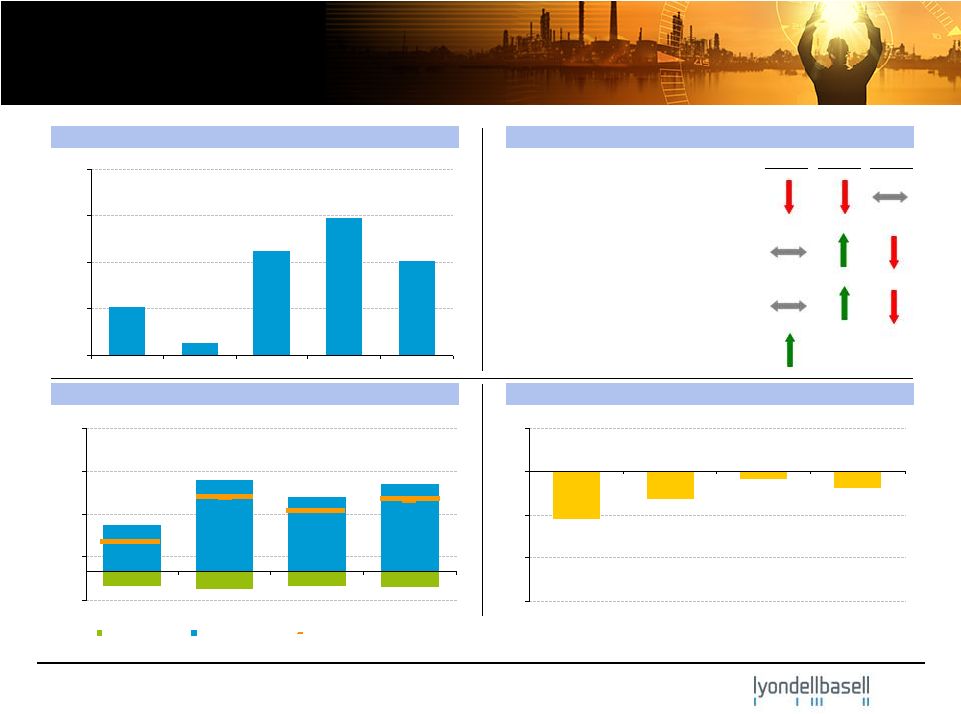
Intermediates & Derivatives
Highlights and Business Drivers -
3Q’13
EBITDA
Propylene Oxide and Derivatives
•
Absence of Q2 turnaround impacts
Intermediates
•
Increased volumes post Q2
turnarounds
•
Improved styrene margins
Oxyfuels
EBITDA
Margin
Volume
Performance vs. 2Q’13
($ in millions)
11
EU MTBE Raw Material Margins (per Platts)
(1)
(cents / gallon)
P-Glycol Raw Material Margins (per Chemdata)
(1)
(cents / lb)
1) Data represents quarterly average.
100
200
300
400
$500
3Q'12
4Q'12
1Q'13
2Q'13
3Q'13
0
60
120
180
3Q'12
2Q'13
3Q'13
Oct'13
•
U.S. butane to gasoline spread
expansion |
 lyondellbasell.com
0
10
20
30
3Q'12
2Q'13
3Q'13
Oct'13
Lt-Hvy
Lt-Gasoline
Lt-ULSD
0
100
200
300
3Q'12
4Q'12
1Q'13
2Q'13
3Q'13
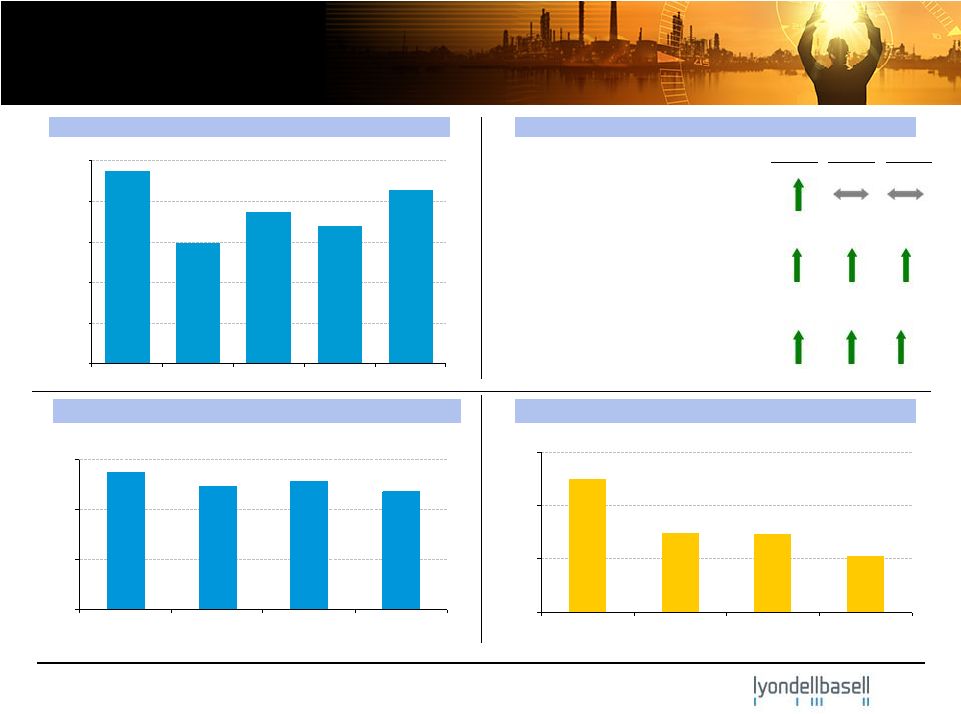
Refining Highlights and Business Drivers -
3Q’13
Houston Refinery
•
Crude throughput: 250 MBPD
•
Maya 2-1-1: $23.22 bbl
•
RINs cost down $12 million
•
Realized margins declined due to
•
Maintenance
•
Crude price volatility
Refining Spreads (per Platts)
(1)
EBITDA
Performance vs. 2Q’13
EBITDA
Margin
Volume
($ in millions)
($ / bbl)
1) Light Louisiana Sweet (LLS) is the referenced light crude. Data represents
quarterly average. 12
Refining Throughput
(MBPD)
40
80
120
160
$200
3Q'12
4Q'12
1Q'13
2Q'13
3Q'13
Capacity = 268 MBPD |
    lyondellbasell.com
Projects Completed and Active
13
(1)
Complete
In Construction
Permit Pending
Project
Cost
($Million)
Start-up
Potential Pre-Tax Earnings
($ Million/year)
Increase Ethane Capability
~$25
2012
$120 - $140
Midwest Debottlenecks
~$25
2012
$30 - $40
EU Butadiene Expansion
~$100
Mid 2013
$40 - $50
Methanol Restart
~$170
Late 2013
$250 - $260
PE Debottleneck
~$20
Early 2014
$10 - $20
La Porte Expansion
~$420
Mid 2014
$300 - $350
Channelview Expansion
~$200
Early 2015
$90 - $110
Corpus Christi Expansion
~$530
Late 2015
$300 - $350
Total
~ $1,490
~ $1,140 - $1,320
Costs are based on company estimates and values are based on LTM September 2013 industry benchmark
margins. |
 lyondellbasell.com
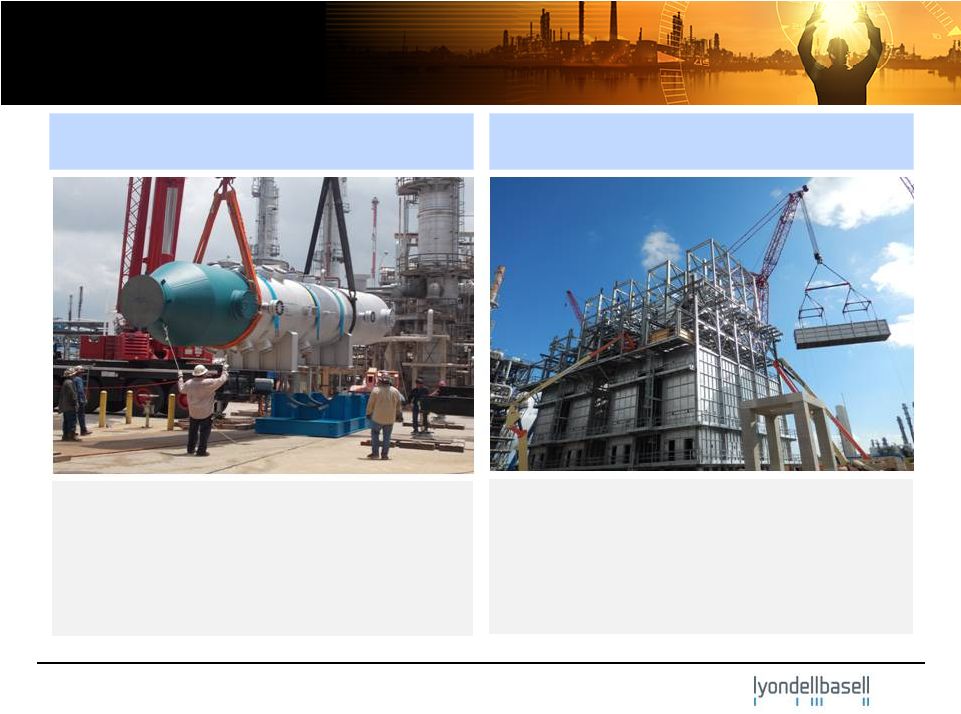
Upcoming Projects Update
Methanol Re-start
La Porte Expansion
14
•
Location: Channelview, TX
•
Scope: 780 KT Methanol
•
Start-up: Q4’2013
•
Cost: ~ $170 million
•
Potential Growth Value
(1)
: ~$250 -
260
million/yr
•
Location: LaPorte, TX
•
Scope: 800 million lbs Ethylene
•
Start-up: Q2’2014
•
Cost: ~ $420 million
•
Potential Growth Value
(1)
: ~$300 -
350
million/yr
1) Costs are based on company estimates and values are based on LTM September 2013
industry benchmark margins. |
 lyondellbasell.com
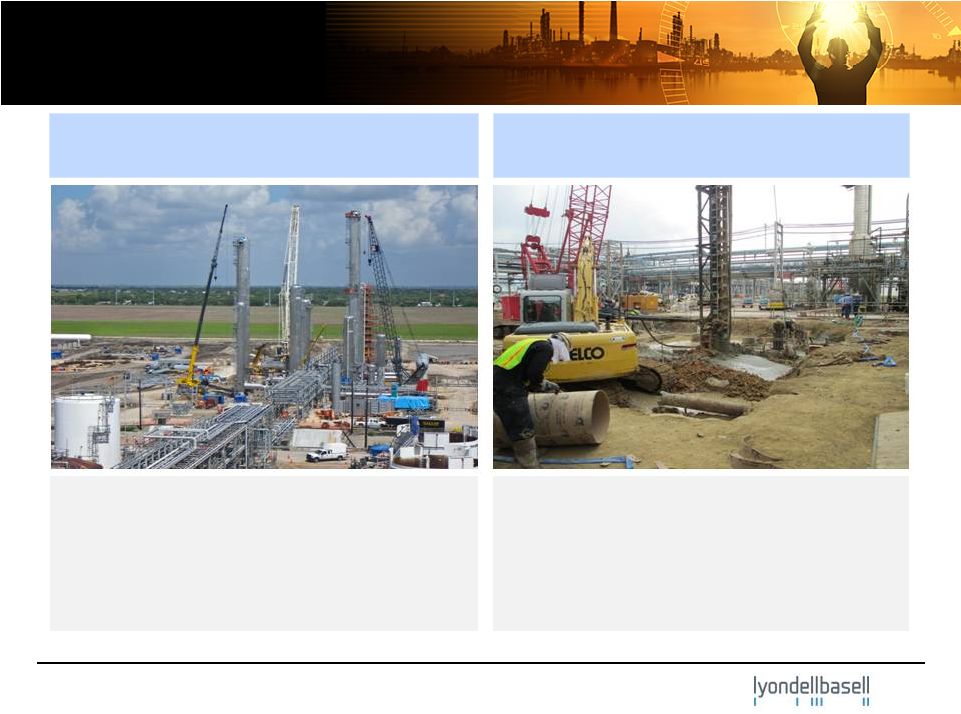
Upcoming Projects Update
Corpus Christi TexStar NGL
Fractionator
(1)
Channelview Expansion
15
•
Location: Corpus Christi, TX
•
Start-up: Q4’2013
•
Benefit: Increased supply flexibility of
NGLs to the site
•
Location: Channelview, TX
•
Scope: 250 million lbs Ethylene
•
Start-up: Early 2015
•
Cost: ~ $200 million
•
Potential Growth Value
(2)
: ~$90 -
110
million/yr
1) The Corpus Christi NGL fractionator units are owned by TexStar Midstream
Services LP; Lyondellbasell will operate the fractionator units and will purchase NGLs from the units
under a long-term agreement. 2) Costs are based on company estimates and
values are based on LTM September 2013 industry benchmark margins. |
 lyondellbasell.com
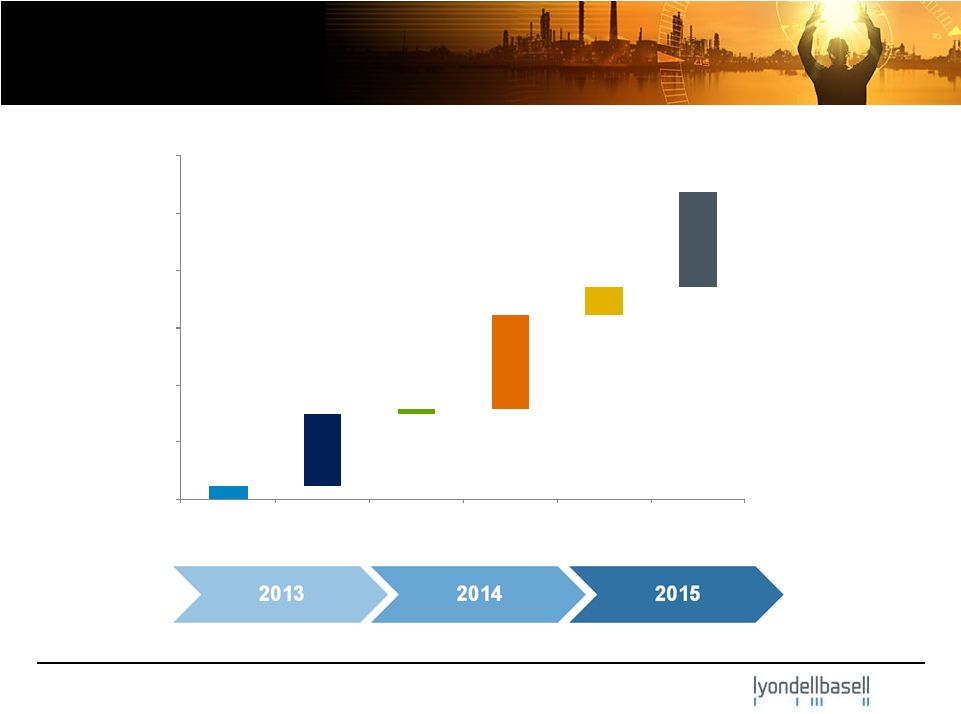
Projects Annual Potential Values &
Completion Timeline
16
200
400
600
800
1,000
$1,200
BD
Expansion
Methanol
Restart
PE
Debottleneck
La Porte
Expansion
Channelview
Expansion
Corpus
Christi
Expansion
Q2
Q4
Q1
Q1
Q2
Q4
Annual Potential Value
(1)
($ Million/ yr)
1) Annual potential values are based on LTM September 2013 industry benchmark
margins. |
 lyondellbasell.com
–
Overall, trends continue with typical
seasonal slow-down in select
products
–
O&P –
Americas continues to benefit
from U.S. NGL advantage
–
Intermediates and Derivatives
remains steady with the exception of
seasonally lower oxyfuel margins
–
Methanol project completion in
Q4’2013
Third-Quarter Summary and Outlook
–
Continued strength in O&P –
Americas results
•
Impact from scheduled Clinton olefin
and polyolefins turnaround
–
Europe olefin margins reduction
from naphtha volatility and lower
co-product values; stable
performance in differentiated
products
–
Steady Intermediates and
Derivatives segment results
–
Refining segment pressured by
weak refining market conditions,
maintenance impacts and crude
price volatility
Third-Quarter Summary
Near-Term Outlook
17 |