Attached files
| file | filename |
|---|---|
| 8-K - 8-K - VEREIT, Inc. | v358394_8-k.htm |
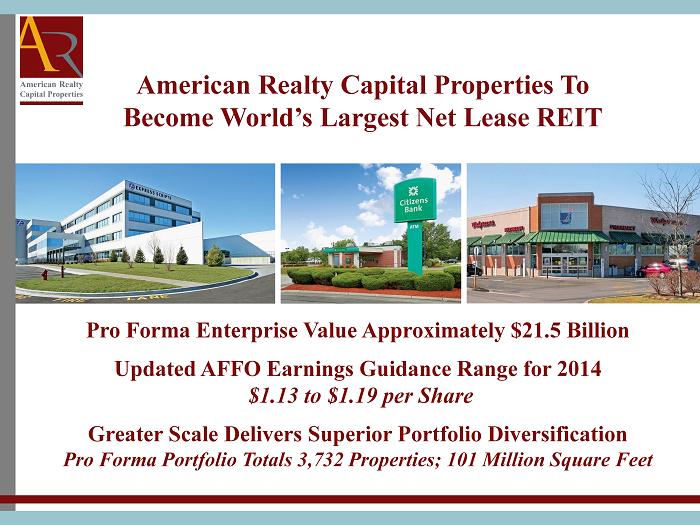
February 2013 Pro Forma Enterprise Value Approximately $21.5 Billion Updated AFFO Earnings Guidance Range for 2014 $1.13 to $1.19 per Share Greater Scale Delivers Superior Portfolio Diversification Pro Forma Portfolio Totals 3,732 Properties; 101 Million Square Feet American Realty Capital Properties To Become World’s Largest Net Lease REIT
2 Information set forth herein (including information included or incorporated by reference herein) contains “forward - looking statements” (as defined in Section 21 E of the Securities Exchange Act of 1934 , as amended), which reflect American Realty Capital Properties, Inc . ’s (“ARCP”), CapLease, Inc . ’s (“LSE”), American Realty Capital Trust IV, Inc . ’s (“ARCT IV”) and Cole Real Estate Investments, Inc . ’ (“Cole”) expectations regarding future events . The forward - looking statements involve a number of risks, uncertainties and other factors that could cause actual results to differ materially from those contained in the forward - looking statements . Such forward - looking statements include, but are not limited to, whether and when the transactions contemplated by any of the merger agreements will be consummated, the combined company’s plans, market and other expectations, objectives, intentions, as well as any expectations or projections with respect to the combined company, including regarding future dividends and market valuations, and estimates of growth, including funds from operations and adjusted funds from operations and other statements that are not historical facts . The following additional factors, among others, could cause actual results to differ from those set forth in the forward - looking statements : ( 1 ) the occurrence of any event, change or other circumstances that could give rise to the termination of any of the merger agreements ; ( 2 ) the inability to complete the LSE merger or failure to satisfy other conditions to completion of the LSE merger ; ( 3 ) the inability to complete the ARCT IV merger due to the failure to obtain ARCT IV stockholder approval of the ARCT IV merger or the failure to satisfy other conditions to completion of the ARCT IV merger, including that a governmental entity may prohibit, delay or refuse to grant approval for the consummation of the ARCT IV merger ; ( 4 ) the inability to obtain regulatory approvals for the Cole merger transaction and the approval by ARCP’s stockholders of the issuance of ARCP common stock in connection with the Cole merger and the approval by Cole’s stockholders of the Cole merger ; ( 5 ) risks related to disruption of management’s attention from the ongoing business operations due to the proposed mergers ; ( 6 ) the effect of the announcement of the proposed mergers on ARCP’s, LSE’s , ARCT IV’s or Cole’s relationships with their respective customers, tenants, lenders, operating results and businesses generally ; ( 7 ) the outcome of any legal proceedings relating to any of the mergers or the merger agreements ; and ( 8 ) risks to consummation of the mergers, including the risk that the mergers will not be consummated within the expected time period or at all . Additional factors that may affect future results are contained in ARCP’s, LSE’s , ARCT IV’s and Cole’s filings with the U . S . Securities and Exchange Commissions (“SEC”), which are available at the SEC’s website at www . sec . gov . ARCP, LSE, ARCT IV and Cole disclaim any obligation to update and revise statements contained in these materials based on new information or otherwise . Forward - Looking Statements
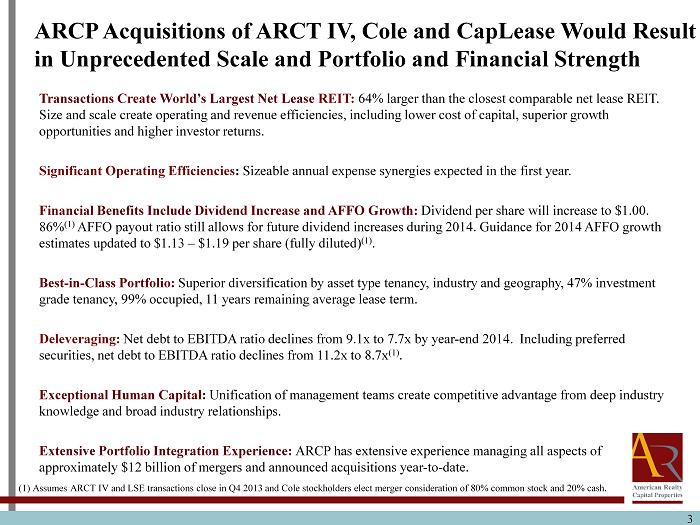
3 ARCP Acquisitions of ARCT IV, Cole and CapLease Would Result in Unprecedented Scale and Portfolio and Financial Strength Transactions Create World’s Largest Net Lease REIT: 64% larger than the closest comparable net lease REIT. Size and scale create operating and revenue efficiencies, including lower cost of capital, superior growth opportunities and higher investor returns. Significant Operating Efficiencies : Sizeable annual expense synergies expected in the first year. Financial Benefits Include Dividend Increase and AFFO Growth: Dividend per share will increase to $1.00. 86% (1) AFFO payout ratio still allows for future dividend increases during 2014. Guidance for 2014 AFFO growth estimates updated to $1.13 – $1.19 per share (fully diluted) (1) . Best - in - Class Portfolio: Superior diversification by asset type tenancy, industry and geography, 47% investment grade tenancy, 99% occupied, 11 years remaining average lease term. Deleveraging: Net d ebt to EBITDA ratio declines from 9.1x to 7.7x by year - end 2014. Including preferred securities, net debt to EBITDA ratio declines from 11.2x to 8.7x (1) . Exceptional Human Capital: Unification of management teams create competitive advantage from deep industry knowledge and broad industry relationships. Extensive Portfolio Integration Experience: ARCP has extensive experience managing all aspects of approximately $12 billion of mergers and announced acquisitions year - to - date. (1) Assumes ARCT IV and LSE transactions close in Q4 2013 and Cole stockholders elect merger consideration of 80% common stock and 20% cash.
ARCP – ARCT IV Transaction Summary 4
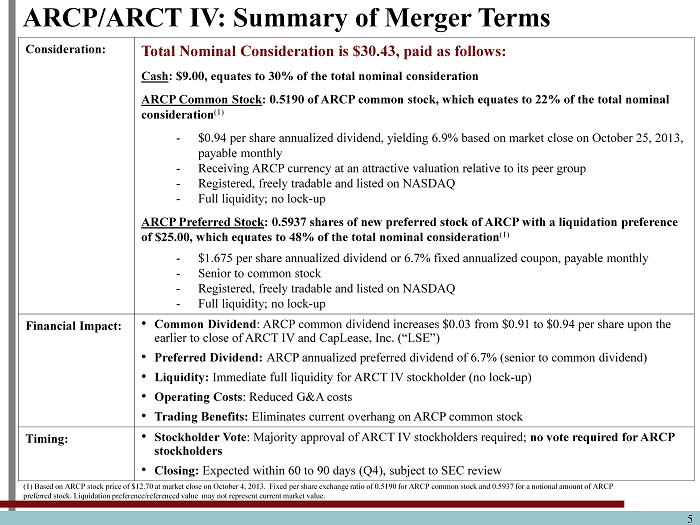
5 ARCP/ARCT IV: Summary of Merger Terms Consideration: Total Nominal Consideration is $30.43, paid as follows: Cash : $9.00, equates to 30% of the total nominal consideration ARCP Common Stock : 0.5190 of ARCP common stock, which equates to 22% of the total nominal consideration (1) - $0.94 per share annualized dividend, yielding 6.9% based on market close on October 25, 2013, payable monthly - Receiving ARCP currency at an attractive valuation relative to its peer group - Registered, freely tradable and listed on NASDAQ - Full liquidity; no lock - up ARCP Preferred Stock : 0.5937 shares of new preferred stock of ARCP with a liquidation preference of $25.00, which equates to 48% of the total nominal consideration (1) - $1.675 per share annualized dividend or 6.7% fixed annualized coupon, payable monthly - Senior to common stock - Registered, freely tradable and listed on NASDAQ - Full liquidity; no lock - up Financial Impact: • Common Dividend : ARCP common dividend increases $0.03 from $0.91 to $0.94 per shar e upon the earlier to close of ARCT IV and CapLease, Inc. (“LSE”) • Preferred Dividend: ARCP annualized preferred dividend of 6.7% (senior to common dividend) • Liquidity: Immediate full liquidity for ARCT IV stockholder (no lock - up) • Operating Costs : Reduced G&A costs • Trading Benefits: Eliminates current overhang on ARCP common stock Timing: • Stockholder Vote : Majority approval of ARCT IV stockholders required; no vote required for ARCP stockholders • Closing: Expected within 60 to 90 days (Q4), subject to SEC review (1) Based on ARCP stock price of $12.70 at market close on October 4, 2013. Fixed per share exchange ratio of 0.5190 for ARC P c ommon stock and 0.5937 for a notional amount of ARCP preferred stock . Liquidation preference/referenced value may not represent current market value .
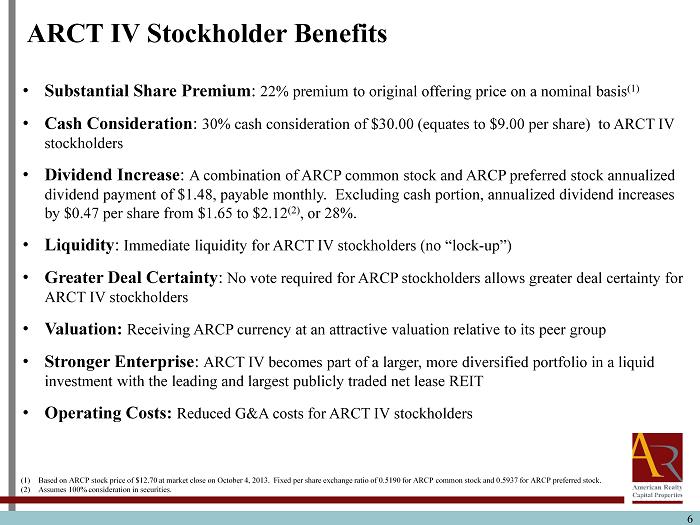
6 ARCT IV Stockholder Benefits • Substantial Share Premium : 22% premium to original offering price on a nominal basis (1) • Cash Consideration : 30% cash consideration of $30.00 (equates to $9.00 per share) to ARCT IV stockholders • Dividend Increase : A combination of ARCP common stock and ARCP preferred stock annualized dividend payment of $1.48, payable monthly. Excluding cash portion, annualized dividend increases by $0.47 per share from $1.65 to $2.12 (2 ) , or 28%. • Liquidity : Immediate liquidity for ARCT IV stockholders (no “lock - up”) • Greater Deal Certainty : No vote required for ARCP stockholders allows greater deal certainty for ARCT IV stockholders • Valuation: Receiving ARCP currency at an attractive valuation relative to its peer group • Stronger Enterprise : ARCT IV becomes part of a larger, more diversified portfolio in a liquid investment with the leading and largest publicly traded net lease REIT • Operating Costs: Reduced G&A costs for ARCT IV stockholders (1) Based on ARCP stock price of $12.70 at market close on October 4, 2013. Fixed per share exchange ratio of 0.5190 for ARCP co mmo n stock and 0.5937 for ARCP preferred stock. (2) Assumes 100% consideration in securities.
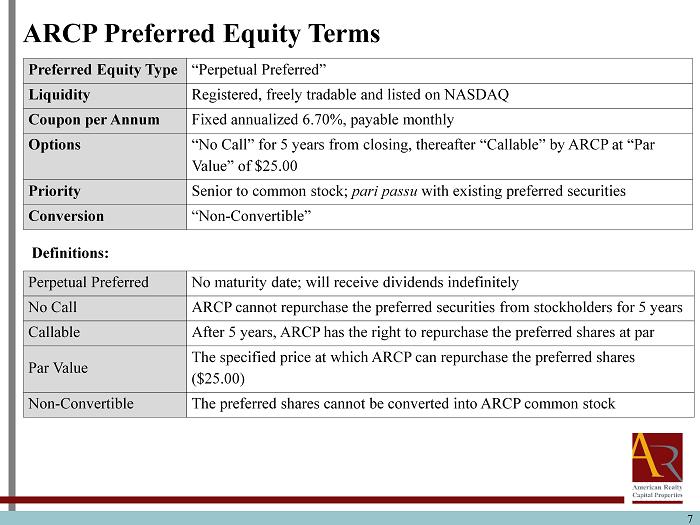
7 ARCP Preferred Equity Terms Preferred Equity Type “Perpetual Preferred” Liquidity Registered, freely tradable and listed on NASDAQ Coupon per Annum Fixed annualized 6.70%, payable monthly Options “No Call” for 5 years from closing, thereafter “Callable” by ARCP at “Par Value” of $25.00 Priority Senior to common stock; pari passu with existing preferred securities Conversion “Non - Convertible” Perpetual Preferred No maturity date; will receive dividends indefinitely No Call ARCP cannot repurchase the preferred securities from stockholders for 5 years Callable After 5 years, ARCP has the right to repurchase the preferred shares at par Par Value The specified price at which ARCP can repurchase the preferred shares ($25.00) Non - Convertible The preferred shares cannot be converted into ARCP common stock Definitions:
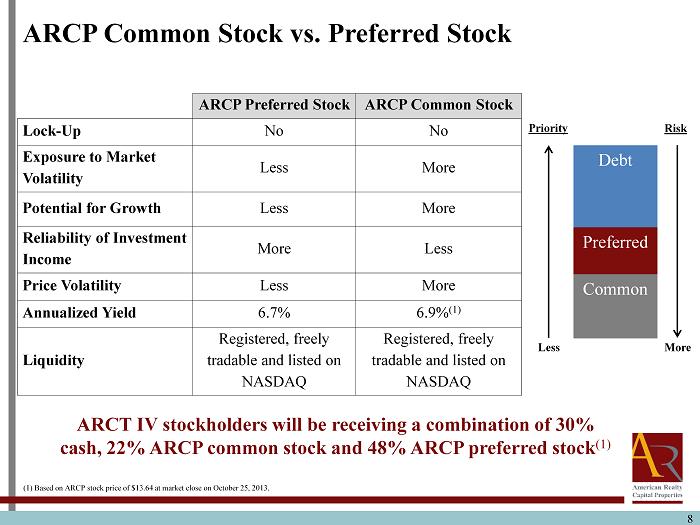
8 ARCP Common Stock vs. Preferred Stock ARCP Preferred Stock ARCP Common Stock Lock - Up No No Exposure to Market Volatility Less More Potential for Growth Less More Reliability of Investment Income More Less Price Volatility Less More Annualized Yield 6.7% 6.9% (1) Liquidity Registered, freely tradable and listed on NASDAQ Registered, freely tradable and listed on NASDAQ ARCT IV stockholders will be receiving a combination of 30% cash, 22% ARCP common stock and 48% ARCP preferred stock (1) Debt Preferred Common Priority Risk Less More (1) Based on ARCP stock price of $13.64 at market close on October 25, 2013.
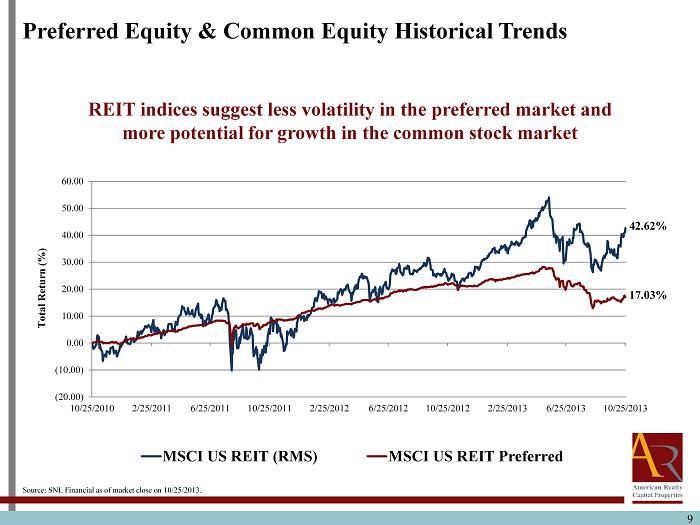
9 2 INTERNAL USE ONLY – NOT FOR FURTHER DISTRIBUTION REIT indices suggest less volatility in the preferred market and more potential for growth in the common stock market Preferred Equity & Common Equity Historical Trends 9 42.62% 17.03% (20.00) (10.00) 0.00 10.00 20.00 30.00 40.00 50.00 60.00 10/25/2010 2/25/2011 6/25/2011 10/25/2011 2/25/2012 6/25/2012 10/25/2012 2/25/2013 6/25/2013 10/25/2013 Total Return (%) MSCI US REIT (RMS) MSCI US REIT Preferred Source: SNL Financial as of market close on 10/25/2013.
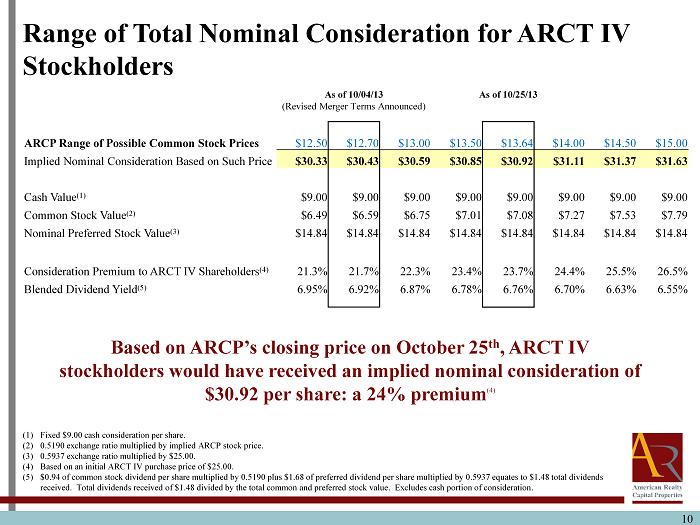
Range of Total Nominal Consideration for ARCT IV Stockholders (1) Fixed $9.00 cash consideration per share. (2) 0.5190 exchange ratio multiplied by implied ARCP stock price. (3) 0.5937 exchange ratio multiplied by $25.00. (4) Based on an initial ARCT IV purchase price of $25.00. (5) $0.94 of common stock dividend per share multiplied by 0.5190 plus $1.68 of preferred dividend per share multiplied by 0.5937 eq uates to $1.48 total dividends received. Total dividends received of $1.48 divided by the total common and preferred stock value. Excludes cash portion of co nsideration. As of 10/04/13 (Revised Merger Terms Announced) As of 10/25/13 ARCP Range of Possible Common Stock Prices $12.50 $12.70 $13.00 $13.50 $13.64 $14.00 $14.50 $15.00 Implied Nominal Consideration Based on Such Price $30.33 $30.43 $30.59 $30.85 $30.92 $31.11 $31.37 $31.63 Cash Value (1) $9.00 $9.00 $9.00 $9.00 $9.00 $9.00 $9.00 $9.00 Common Stock Value (2) $6.49 $6.59 $6.75 $7.01 $7.08 $7.27 $7.53 $7.79 Nominal Preferred Stock Value (3) $14.84 $14.84 $14.84 $14.84 $14.84 $14.84 $14.84 $14.84 Consideration Premium to ARCT IV Shareholders (4) 21.3% 21.7% 22.3% 23.4% 23.7% 24.4% 25.5% 26.5% Blended Dividend Yield (5) 6.95% 6.92% 6.87% 6.78% 6.76% 6.70% 6.63% 6.55% Based on ARCP’s closing price on October 25 th , ARCT IV stockholders would have received an implied nominal consideration of $30.92 per share: a 24% premium (4) 10
ARCP – COLE Transaction Summary 11
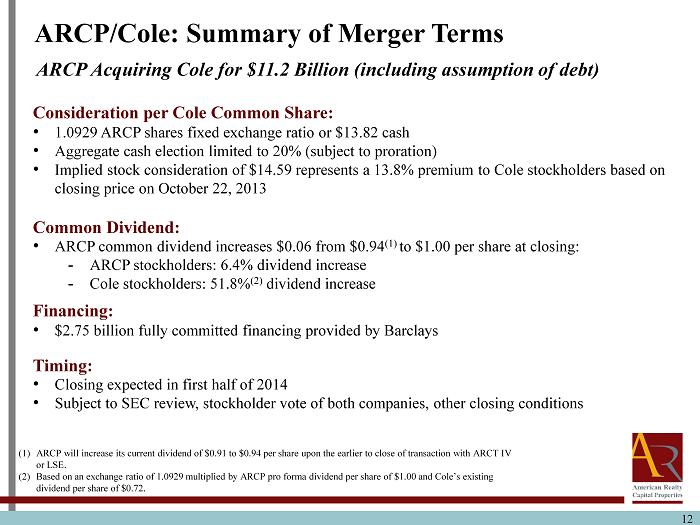
12 ARCP/Cole: Summary of Merger Terms Consideration per Cole Common Share: • 1.0929 ARCP shares fixed exchange ratio or $13.82 cash • Aggregate cash election limited to 20% (subject to proration) • Implied stock consideration of $14.59 represents a 13.8% premium to Cole stockholders based on closing price on October 22, 2013 Common Dividend: • ARCP common dividend increases $0.06 from $0.94 (1) to $1.00 per share at closing: - ARCP stockholders: 6.4% dividend increase - Cole stockholders: 51.8% (2) dividend increase Financing: • $2.75 billion fully committed financing provided by Barclays Timing: • Closing expected in first half of 2014 • Subject to SEC review, stockholder vote of both companies, other closing conditions (1) ARCP will increase its current dividend of $0.91 to $0.94 per share upon the earlier to close of transaction with ARCT IV or LSE. (2) Based on an exchange ratio of 1.0929 multiplied by ARCP pro forma dividend per share of $1.00 and Cole’s existing dividend per share of $0.72. ARCP Acquiring Cole for $11.2 Billion (including assumption of debt)
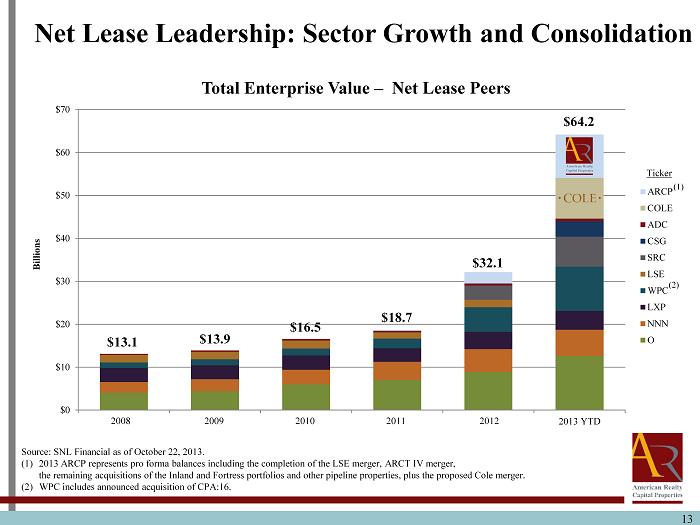
$0 $10 $20 $30 $40 $50 $60 $70 2008 FY 2009 FY 2010 FY 2011 FY 2012 FY 2013 YTD Billions Total Enterprise Value – Net Lease Peers ARCP COLE ADC CSG SRC LSE WPC LXP NNN O 13 Net Lease Leadership: Sector Growth and Consolidation Source: SNL Financial as of October 22, 2013. (1) 2013 ARCP r epresents pro forma balances including the completion of the LSE merger, ARCT IV merger, the remaining acquisitions of the Inland and Fortress portfolios and other pipeline properties, plus the proposed Cole merger. (2) WPC includes announced acquisition of CPA:16 . $13.1 $13.9 $16.5 $18.7 $32.1 $64.2 (1) Ticker (2) 2008 2009 2010 2011 2012
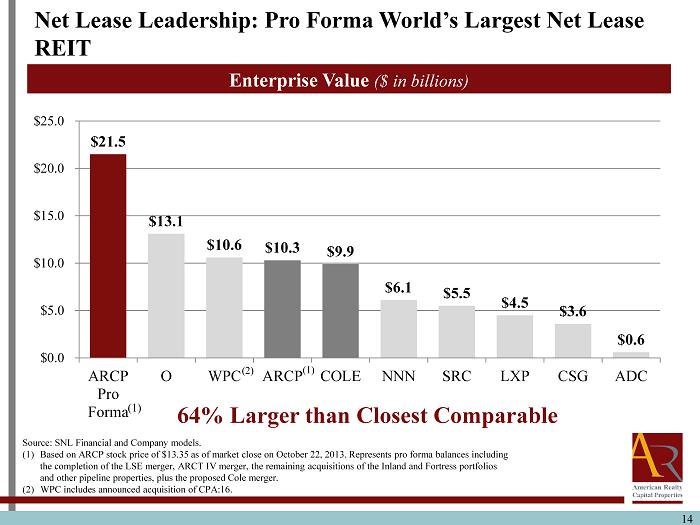
14 Net Lease Leadership: Pro Forma World’s Largest Net Lease REIT Enterprise Value ($ in billions) $21.5 $13.1 $10.6 $10.3 $9.9 $6.1 $5.5 $4.5 $3.6 $0.6 $0.0 $5.0 $10.0 $15.0 $20.0 $25.0 ARCP Pro Forma O WPC ARCP COLE NNN SRC LXP CSG ADC 64% Larger than Closest Comparable (1) Source: SNL Financial and C ompany models. (1) Based on ARCP stock price of $ 13.35 as of market close on October 22, 2013. Represents pro forma balances including the completion of the LSE merger , ARCT IV merger, the remaining acquisitions of the Inland and Fortress portfolios and other pipeline properties, plus the proposed Cole merger. (2) WPC includes announced acquisition of CPA:16. (2) (1)
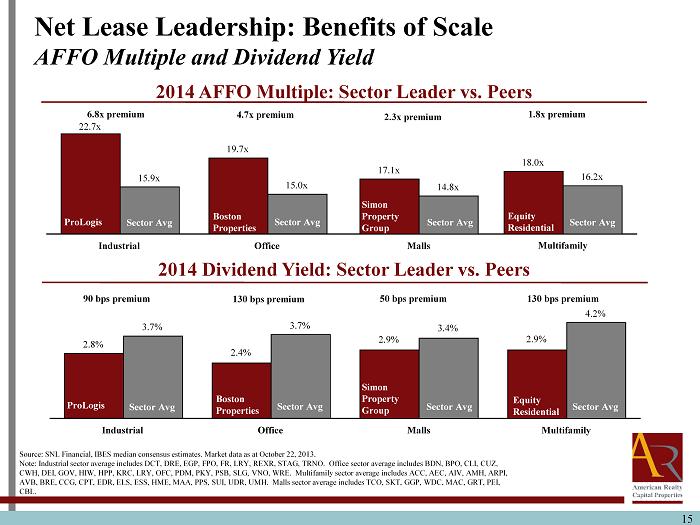
15 2014 AFFO Multiple: Sector Leader vs. Peers 2014 Dividend Yield: Sector Leader vs. Peers Source: SNL Financial, IBES median consensus estimates. Market data as at October 22, 2013. Note: Industrial sector average includes DCT, DRE, EGP, FPO, FR, LRY, REXR, STAG, TRNO. Office sector average includes BDN, BPO , CLI, CUZ, CWH, DEI, GOV, HIW, HPP, KRC, LRY, OFC, PDM, PKY, PSB, SLG, VNO, WRE. Multifamily sector average includes ACC, AEC, AIV, AMH, ARPI, AVB, BRE, CCG, CPT, EDR, ELS, ESS, HME, MAA, PPS, SUI, UDR, UMH. Malls sector average includes TCO, SKT, GGP, WDC, MAC, GRT, PEI, CBL. Net Lease Leadership: Benefits of Scale AFFO Multiple and Dividend Yield 22.7x 19.7x 15.9x 15.0x Industrial Office ProLogis Sector Avg Sector Avg Boston Properties 6.8x premium 4.7x premium 18.0x 16.2x Multifamily Sector Avg Equity Residential 1.8x premium 2.8% 2.4% 3.7% 3.7% Industrial Office Sector Avg Sector Avg 90 bps premium 130 bps premium 2.9% 4.2% Multifamily Sector Avg 130 bps premium 17.1x 14.8x Malls Sector Avg Simon Property Group 2.3x premium 2.9% 3.4% Malls Sector Avg 50 bps premium ProLogis Boston Properties Simon Property Group Equity Residential
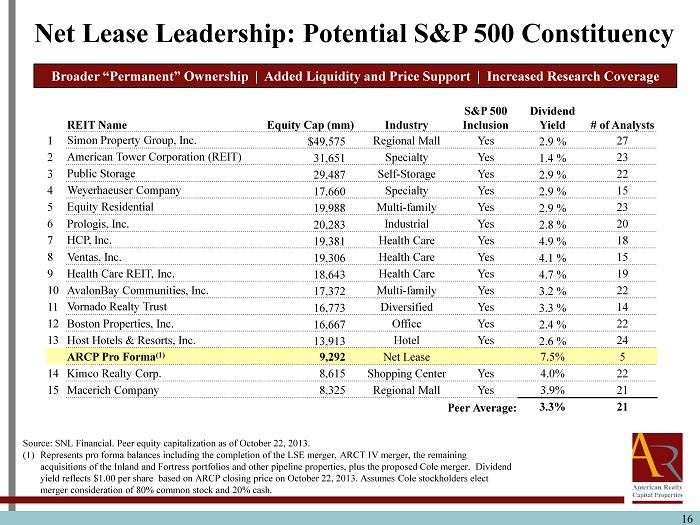
16 REIT Name Equity Cap (mm) Industry S&P 500 Inclusion Dividend Yield # of Analysts 1 Simon Property Group, Inc. $49,575 Regional Mall Yes 2.9 % 27 2 American Tower Corporation (REIT) 31,651 Specialty Yes 1.4 % 23 3 Public Storage 29,487 Self - Storage Yes 2.9 % 22 4 Weyerhaeuser Company 17,660 Specialty Yes 2.9 % 15 5 Equity Residential 19,988 Multi - family Yes 2.9 % 23 6 Prologis , Inc. 20,283 Industrial Yes 2.8 % 20 7 HCP, Inc. 19,381 Health Care Yes 4.9 % 18 8 Ventas , Inc. 19,306 Health Care Yes 4.1 % 15 9 Health Care REIT, Inc. 18,643 Health Care Yes 4.7 % 19 10 AvalonBay Communities, Inc. 17,372 Multi - family Yes 3.2 % 22 11 Vornado Realty Trust 16,773 Diversified Yes 3.3 % 14 12 Boston Properties, Inc. 16,667 Office Yes 2.4 % 22 13 Host Hotels & Resorts, Inc. 13,913 Hotel Yes 2.6 % 24 ARCP Pro Forma (1) 9,292 Net Lease 7.5% 5 14 Kimco Realty Corp. 8,615 Shopping Center Yes 4.0% 22 15 Macerich Company 8,325 Regional Mall Yes 3.9% 21 Peer Average: 3.3% 21 Broader “Permanent” Ownership | Added Liquidity and Price Support | Increased Research Coverage Net Lease Leadership: Potential S&P 500 Constituency Source: SNL Financial. Peer equity capitalization as of October 22, 2013. (1) Represents pro forma balances including the completion of the LSE merger, ARCT IV merger, the remaining acquisitions of the Inland and Fortress portfolios and other pipeline properties, plus the proposed Cole merger. Dividend yield reflects $1.00 per share based on ARCP closing price on October 22, 2013. Assumes Cole stockholders elect merger consideration of 80% common stock and 20% cash .
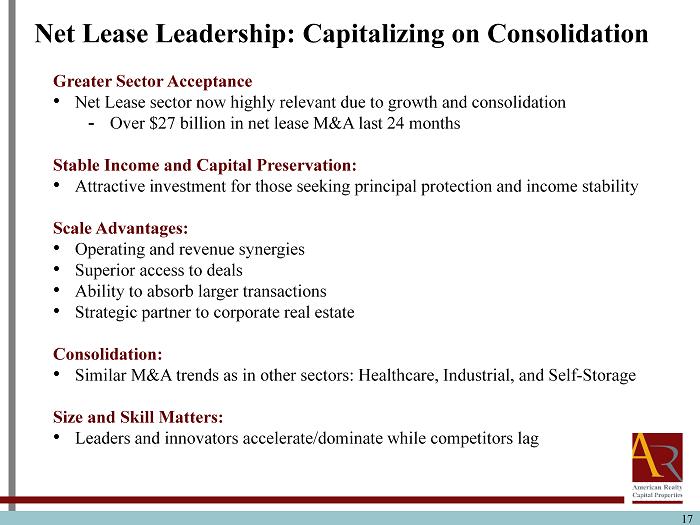
17 Net Lease Leadership: Capitalizing on Consolidation Greater Sector Acceptance • Net Lease sector now highly relevant due to growth and consolidation - Over $27 billion in net lease M&A last 24 months Stable Income and Capital Preservation: • Attractive investment for those seeking principal protection and income stability Scale Advantages: • Operating and revenue synergies • Superior access to deals • Ability to absorb larger transactions • Strategic partner to corporate real estate Consolidation: • Similar M&A trends as in other sectors: Healthcare, Industrial, and Self - Storage Size and Skill Matters: • Leaders and innovators accelerate/dominate while competitors lag
Stockholder Benefits Best - in - Class Portfolio 18
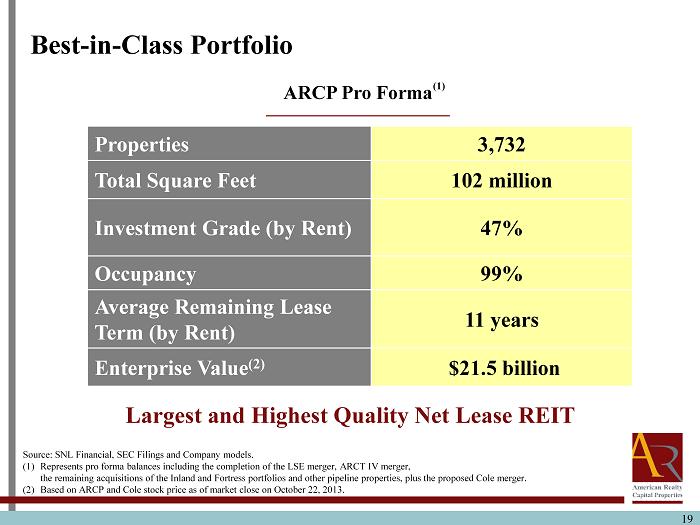
Properties 3,732 Total Square Feet 102 million Investment Grade (by Rent) 47% Occupancy 99% Average Remaining Lease Term (by Rent) 11 years Enterprise Value (2) $21.5 billion 19 Source: SNL Financial, SEC Filings and Company models . (1) Represents pro forma balances including the completion of the LSE merger, ARCT IV merger, the remaining acquisitions of the Inland and Fortress portfolios and other pipeline properties, plus the proposed Cole merger. (2) Based on ARCP and Cole stock price as of market close on October 22, 2013 . Best - in - Class Portfolio Largest and Highest Quality Net Lease REIT (1) ARCP Pro Forma
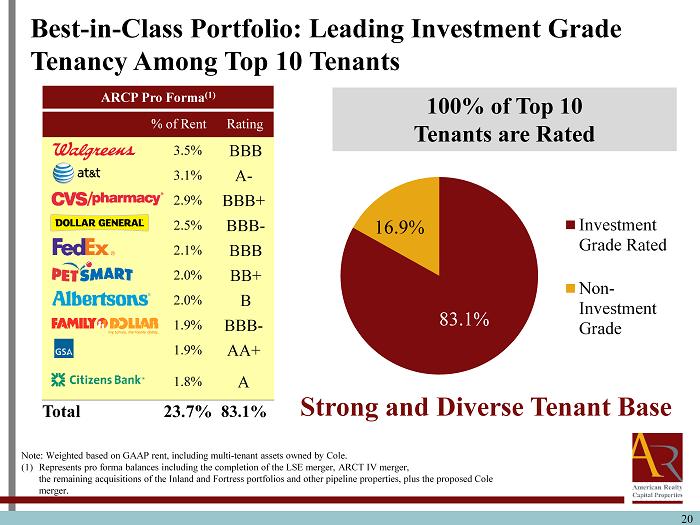
100% of Top 10 Tenants are Rated 20 ARCP Pro Forma (1) % of Rent Rating 3.5% BBB 3.1% A - 2.9% BBB+ 2.5% BBB - 2.1% BBB 2.0% BB+ 2.0% B 1.9% BBB - 1.9% AA+ 1.8% A Total 23.7% 83.1% Best - in - Class Portfolio: Leading Investment Grade Tenancy Among Top 10 Tenants Strong and Diverse Tenant Base Note: Weighted based on GAAP rent, including multi - tenant assets owned by Cole. (1) Represents pro forma balances including the completion of the LSE merger, ARCT IV merger, the remaining acquisitions of the Inland and Fortress portfolios and other pipeline properties, plus the proposed Cole merger. 83.1% 16.9% Investment Grade Rated Non- Investment Grade
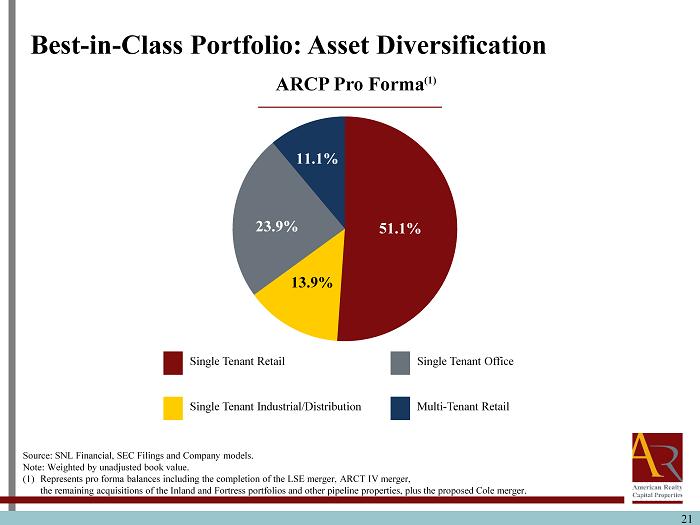
21 Single Tenant Retail Single Tenant Industrial/Distribution Single Tenant Office Multi - Tenant Retail 26.2% 23.9% 11.1% 51.1% ARCP Pro Forma Source : SNL Financial, SEC Filings and Company models . Note: Weighted by unadjusted book value. (1) Represents pro forma balances including the completion of the LSE merger, ARCT IV merger, the remaining acquisitions of the Inland and Fortress portfolios and other pipeline properties, plus the proposed Cole merger. Best - in - Class Portfolio: Asset Diversification 46.3% 21.0% 25.0% 51.1% 23.9% 1 1.1% 13.9% (1)
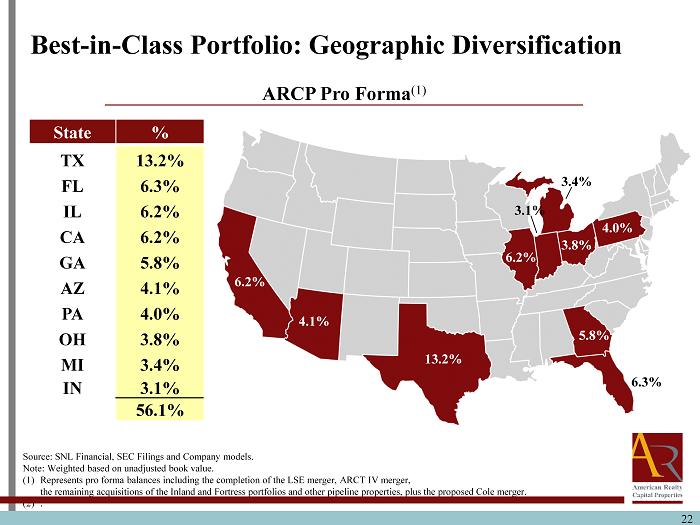
22 Best - in - Class Portfolio: Geographic D iversification Source : SNL Financial, SEC Filings and Company models . Note: Weighted based on unadjusted book value. (1) Represents pro forma balances including the completion of the LSE merger, ARCT IV merger, the remaining acquisitions of the Inland and Fortress portfolios and other pipeline properties, plus the proposed Cole merger. (2) . ARCP Pro Forma (1) 6.3% 13.2% 6.2% 5.8% 4.0% 6.2% 4.1% 3.8% 3.4% 3.1% State % TX 13.2% FL 6.3% IL 6.2% CA 6.2% GA 5.8% AZ 4.1% PA 4.0% OH 3.8% MI 3.4% IN 3.1% 56.1%
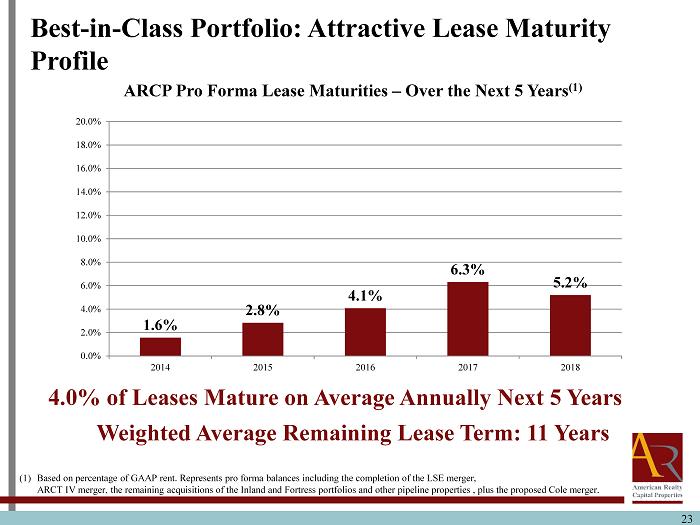
23 23 (1) Based on percentage of GAAP rent. Represents pro forma balances including the completion of the LSE merger, ARCT IV merger, the remaining acquisitions of the Inland and Fortress portfolios and other pipeline properties , plus the proposed Cole merger. 4.0% of Leases Mature on Average Annually Next 5 Years Best - in - Class Portfolio: Attractive Lease Maturity Profile Weighted Average Remaining Lease Term: 11 Years ARCP Pro Forma Lease Maturities – Over the Next 5 Years (1) 1.6% 2.8% 4.1% 6.3% 5.2% 0.0% 2.0% 4.0% 6.0% 8.0% 10.0% 12.0% 14.0% 16.0% 18.0% 20.0% 2014 2015 2016 2017 2018

Stockholder Benefits Financial Considerations 24
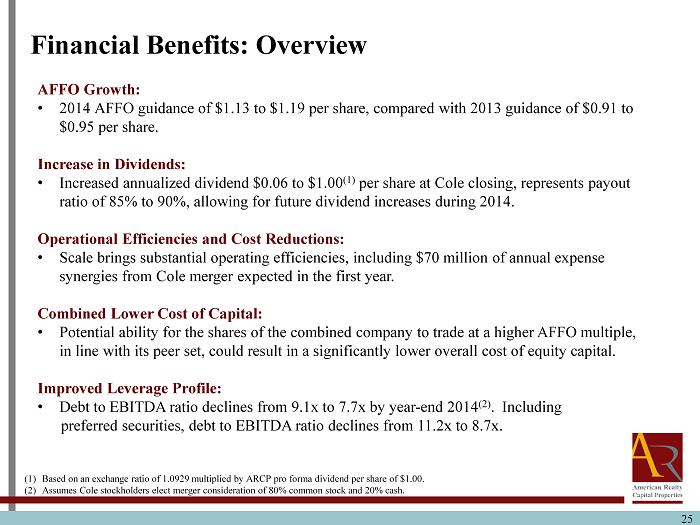
25 AFFO Growth: • 2014 AFFO guidance of $1.13 to $1.19 per share, compared with 2013 guidance of $0.91 to $0.95 per share. Increase in Dividends: • Increased annualized dividend $0.06 to $1.00 (1) per share at Cole closing, represents payout ratio of 85% to 90%, allowing for future dividend increases during 2014. Operational Efficiencies and Cost Reductions: • Scale brings substantial operating efficiencies, including $70 million of annual expense synergies from Cole merger expected in the first year. Combined Lower Cost of Capital: • Potential ability for the shares of the combined company to trade at a higher AFFO multiple, in line with its peer set, could result in a significantly lower overall cost of equity capital. Improved Leverage Profile: • Debt to EBITDA ratio declines from 9.1x to 7.7x by year - end 2014 (2) . Including preferred securities, debt to EBITDA ratio declines from 11.2x to 8.7x. Financial Benefits: Overview (1) Based on an exchange ratio of 1.0929 multiplied by ARCP pro forma dividend per share of $ 1.00. (2) Assumes Cole stockholders elect merger consideration of 80% common stock and 20% cash .
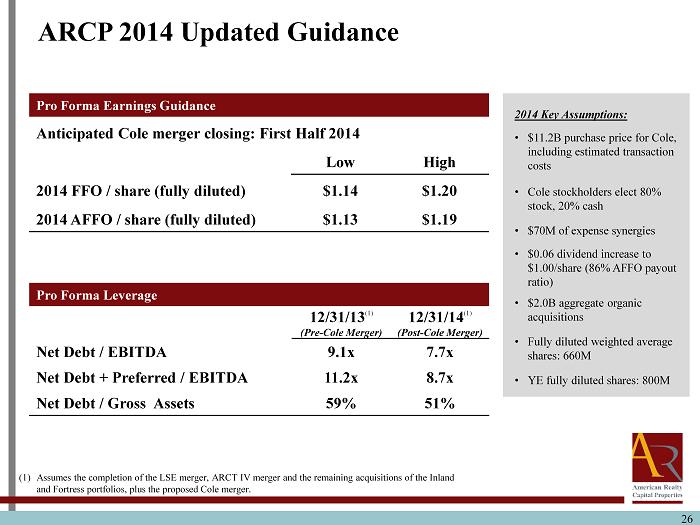
26 Pro Forma Earnings Guidance Anticipated Cole merger closing: First Half 2014 Low High 2014 FFO / share (fully diluted) $1.14 $1.20 2014 AFFO / share (fully diluted) $1.13 $1.19 ARCP 2014 Updated Guidance Pro Forma Leverage 12/31/13 (1) (Pre - Cole Merger) 12/31/14 (1) (Post - Cole Merger) Net Debt / EBITDA 9.1x 7.7x Net Debt + Preferred / EBITDA 11.2x 8.7x Net Debt / Gross Assets 59% 51% (1) Assumes the completion of the LSE merger , ARCT IV merger and the remaining acquisitions of the Inland and Fortress portfolios, plus the proposed Cole merger. 2014 Key Assumptions: • $11.2B purchase price for Cole, including estimated transaction costs • Cole stockholders elect 80% stock, 20% cash • $70M of expense synergies • $0.06 dividend increase to $1.00/share (86% AFFO payout ratio) • $2.0B aggregate organic acquisitions • Fully diluted weighted average shares: 660M • YE fully diluted shares: 800M
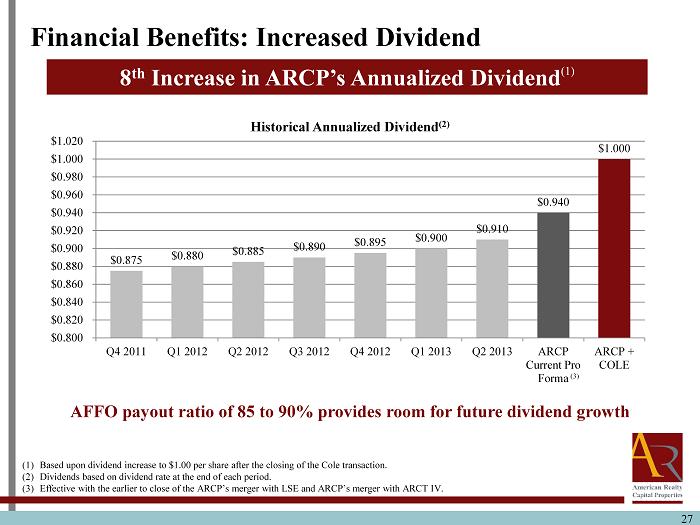
AFFO payout ratio of 85 to 90% provides room for future dividend growth $0.875 $0.880 $0.885 $0.890 $0.895 $0.900 $0.910 $0.940 $1.000 $0.800 $0.820 $0.840 $0.860 $0.880 $0.900 $0.920 $0.940 $0.960 $0.980 $1.000 $1.020 Q4 2011 Q1 2012 Q2 2012 Q3 2012 Q4 2012 Q1 2013 Q2 2013 ARCP Current Pro Forma ARCP + COLE Historical Annualized Dividend (2) (1) Based upon dividend increase to $1.00 per share after the closing of the Cole transaction. (2) Dividends based on dividend rate at the end of each period. (3) Effective with the earlier to close of the ARCP’s merger with LSE and ARCP’s merger with ARCT IV. Financial Benefits: Increased Dividend (3) 8 th Increase in ARCP’s Annualized Dividend (1) 27
Integration Significant Experience 28
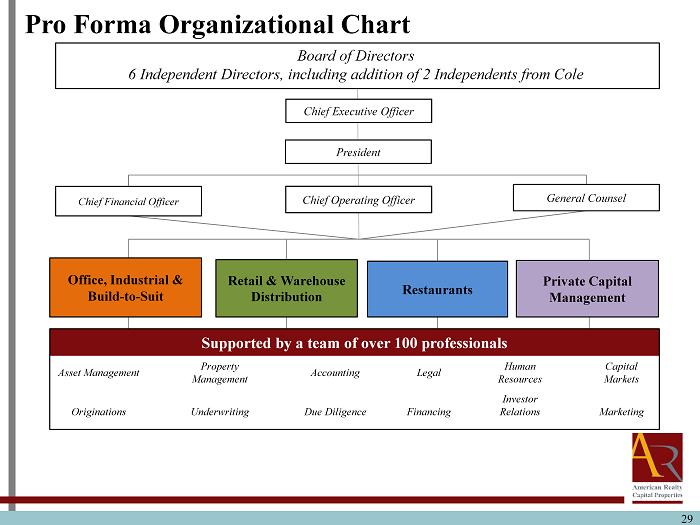
29 Office, Industrial & Build - to - Suit Retail & Warehouse Distribution Restaurants Private Capital Management General Counsel Chief Operating Officer Chief Financial Officer President Pro Forma Organizational Chart Supported by a team of over 100 professionals Asset Management Property Management Accounting Legal Human Resources Capital Markets Originations Underwriting Due Diligence Financing Investor Relations Marketing Board of Directors 6 Independent Directors, including addition of 2 Independents from Cole Chief Executive Officer
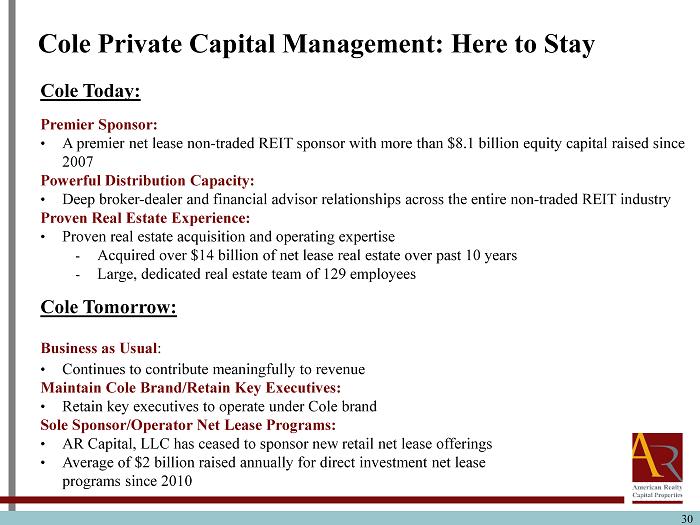
30 Cole Private Capital Management: Here to Stay Cole Today: Premier Sponsor: • A premier net lease non - traded REIT sponsor with more than $8.1 billion equity capital raised since 2007 Powerful Distribution Capacity: • Deep broker - dealer and financial advisor relationships across the entire non - traded REIT industry Proven Real Estate Experience: • Proven real estate acquisition and operating expertise - Acquired over $14 billion of net lease real estate over past 10 years - Large, dedicated real estate team of 129 employees Cole Tomorrow: Business as Usual : • Continues to contribute meaningfully to revenue Maintain Cole Brand/Retain Key Executives: • Retain key executives to operate under Cole brand Sole Sponsor/Operator Net Lease Programs: • AR Capital, LLC has ceased to sponsor new retail net lease offerings • Average of $2 billion raised annually for direct investment net lease programs since 2010
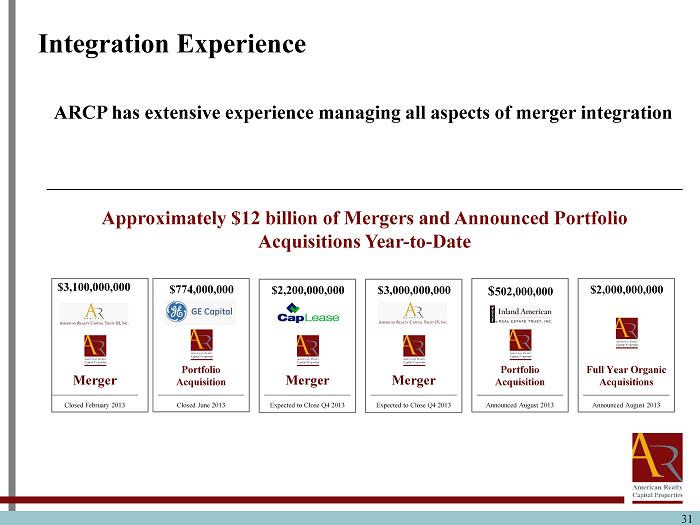
31 Integration Experience ARCP has extensive experience managing all aspects of merger integration Approximately $12 billion of Mergers and Announced Portfolio Acquisitions Year - to - Date Announced August 2013 $ 502,000,000 Portfolio Acquisition $774,000,000 Closed June 2013 Portfolio Acquisition $2,200,000,000 Expected to Close Q4 2013 Merger Closed February 2013 $3,100,000,000 Merger Expected to Close Q4 2013 $ 3,000,000,000 Merger Announced August 2013 $2,000,000,000 Full Year Organic Acquisitions
32 American Realty Capital Properties to Become Self - Managed • ARCP announced that its board of directors determined that it is in the best interests of ARCP and its stockholders to become self - managed following the closings of the CapLease and ARCT IV mergers. • ARCP believes that the proposed acquisitions once completed, will give it a size and scale where costs related to a self - administered structure will be lower than those attributable to an externally advised arrangement . • ARCP will have a dedicated team of senior professionals entirely accountable to ARCP and whose compensation is expected to be linked in large part to the performance of ARCP.

33 Experienced Senior Management • Experience in building and managing publicly traded and non - traded companies • Expertise in constructing and managing net lease real estate portfolios • Skill in navigating capital markets Best - in - Class Portfolio • High quality properties: Main & Main locations, strong credit quality tenant roster and brand identity • Stable income with outsized growth potential • Diversified by tenant, industry, geography and property type Value Proposition Durable Dividends Principal Protection Outsized Growth Potential Strong, Flexible Balance Sheet • Enhanced Scale and Competitiveness • Cost of Capital Advantage • Operational Efficiencies and Cost Reductions • Financial capacity • Financial flexibility ARCP Offers a Compelling Value Proposition
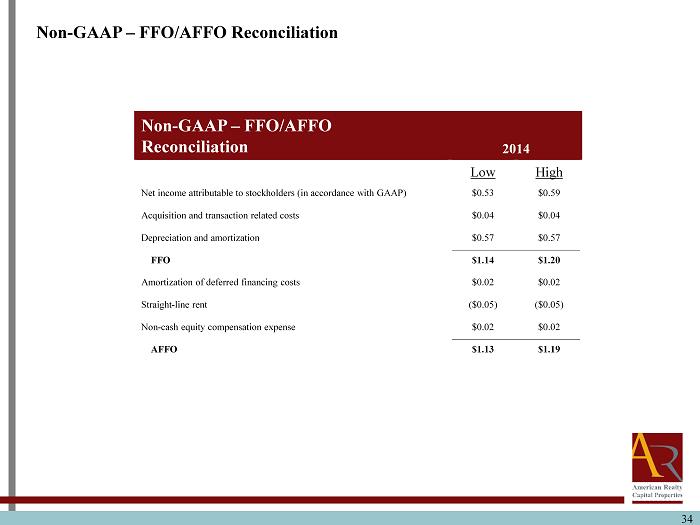
34 Non - GAAP – FFO/AFFO Reconciliation 2014 Low High Net income attributable to stockholders (in accordance with GAAP) $0.53 $0.59 Acquisition and transaction related costs $0.04 $0.04 Depreciation and amortization $0.57 $0.57 FFO $1.14 $1.20 Amortization of deferred financing costs $0.02 $0.02 Straight - line rent ($0.05) ($0.05) Non - cash equity compensation expense $0.02 $0.02 AFFO $1.13 $1.19 Non - GAAP – FFO/AFFO Reconciliation
35 Funds from Operations and Adjusted Funds from Operations ARCP considers funds from operations (“FFO”) and AFFO, which is FFO as adjusted to exclude acquisition - related fees and expenses, amortization of above - market lease assets and liabilities, amortization of deferred financing costs, straight - line rent, non - cash mark - to - market adjustments, amortization of restricted stock, non - cash compensation and gains and losses useful indicators of the performance of a REIT . Because FFO calculations exclude such factors as depreciation and amortization of real estate assets and gains or losses from sales of operating real estate assets (which can vary among owners of identical assets in similar conditions based on historical cost accounting and useful - life estimates), they facilitate comparisons of operating performance between periods and between other REITs in our peer group . Accounting for real estate assets in accordance with generally accepted accounting principles (“GAAP”) implicitly assumes that the value of real estate assets diminishes predictably over time . Since real estate values have historically risen or fallen with market conditions, many industry investors and analysts have considered the presentation of operating results for real estate companies that use historical cost accounting to be insufficient by themselves . FFO and AFFO are not in accordance with, or a substitute for, measures prepared in accordance with GAAP, and may be different from non - GAAP measures used by other companies . In addition, FFO and AFFO are not based on any comprehensive set of accounting rules or principles . Non - GAAP measures, such as FFO and AFFO, have limitations in that they do not reflect all of the amounts associated with ARCP's results of operations that would be reflected in measures determined in accordance with GAAP . These measures should only be used to evaluate ARCP's performance in conjunction with corresponding GAAP measures . Additionally, ARCP believes that AFFO, by excluding acquisition - related fees and expenses, amortization of above - market lease assets and liabilities, amortization of deferred financing costs, straight - line rent, non - cash mark - to - market adjustments, amortization of restricted stock, non - cash compensation and gains and losses, provides information consistent with management's analysis of the operating performance of the properties . By providing AFFO, ARCP believes it is presenting useful information that assists investors and analysts to better assess the sustainability of our operating performance . Further, ARCP believes AFFO is useful in comparing the sustainability of our operating performance with the sustainability of the operating performance of other real estate companies, including exchange - traded and non - traded REITs . As a result, ARCP believes that the use of FFO and AFFO, together with the required GAAP presentations, provide a more complete understanding of our performance relative to our peers and a more informed and appropriate basis on which to make decisions involving operating, financing, and investing activities .
36 This communication does not constitute an offer to sell or the solicitation of an offer to buy any securities or a solicitation of any vote or approval . In connection with the proposed Cole merger, ARCP and Cole expect to prepare and file with the SEC a registration statement on Form S - 4 containing a joint proxy statement/prospectus and other documents with respect to ARCP’s proposed acquisition of Cole . The joint proxy/prospectus will contain important information about the proposed transaction and related matters . INVESTORS ARE URGED TO READ THE JOINT PROXY STATEMENT/PROSPECTUS (INCLUDING ALL AMENDMENTS AND SUPPLEMENTS THERETO) AND OTHER RELEVANT DOCUMENTS FILED BY ARCP OR COLE WITH THE SEC CAREFULLY IF AND WHEN THEY BECOME AVAILABLE BECAUSE THEY WILL CONTAIN IMPORTANT INFORMATION ABOUT ARCP, COLE AND THE PROPOSED COLE MERGER . Investors and stockholders of ARCP and Cole may obtain free copies of the registration statement, the joint proxy statement/prospectus and other relevant documents filed by ARCP and Cole with the SEC (if and when they become available) through the website maintained by the SEC at www . sec . gov . Copies of the documents filed by ARCP with the SEC are also available free of charge on ARCP’s website at www . arcpreit . com and copies of the documents filed by Cole with the SEC are available free of charge on Cole’s website at www . ColeREIT . com . ARCP , Cole, AR Capital, LLC and their respective directors and executive officers may be deemed to be participants in the solicitation of proxies from ARCP’s and Cole’s stockholders in respect of the proposed Cole merger . Information regarding ARCP’s directors and executive officers can be found in ARCP’s definitive proxy statement filed with the SEC on April 30 , 2013 . Information regarding Cole’s directors and executive officers can be found in Cole’s definitive proxy statement filed with the SEC on April 11 , 2013 . Additional information regarding the interests of such potential participants will be included in the joint proxy statement/prospectus and other relevant documents filed with the SEC in connection with the proposed Cole merger if and when they become available . These documents are available free of charge on the SEC’s website and from ARCP or Cole, as applicable, using the sources indicated above . Additional Information about the Cole Merger and Where to Find It
37 This communication does not constitute an offer to sell or the solicitation of an offer to buy any securities or a solicitation of any vote or approval . In connection with the proposed ARCT IV merger, ARCP and ARCT IV expect to prepare and file with the SEC an amendment to their proxy statement/prospectus and ARCP expects to prepare and file with the SEC an amendment to its registration statement on Form S - 4 and other documents with respect to ARCP’s proposed acquisition of ARCT IV . INVESTORS ARE URGED TO READ THE PROXY STATEMENT/PROSPECTUS AND REGISTRATION STATEMENT (INCLUDING ALL AMENDMENTS AND SUPPLEMENTS THERETO) AND OTHER RELEVANT DOCUMENTS FILED WITH THE SEC IF AND WHEN THEY BECOME AVAILABLE BECAUSE THEY WILL CONTAIN IMPORTANT INFORMATION ABOUT THE PROPOSED ARCT IV MERGER . Investors may obtain free copies of the registration statement, the proxy statement/prospectus and other relevant documents filed by ARCP and ARCT IV with the SEC (if and when they become available) through the website maintained by the SEC at www . sec . gov . Copies of the documents filed by ARCP with the SEC are also available free of charge on ARCP’s website at www . arcpreit . com and copies of the documents filed by ARCT IV with the SEC are available free of charge on ARCT IV’s website at www . arct - 4 . com . ARCP , ARCT IV, AR Capital, LLC and their respective directors and executive officers may be deemed to be participants in the solicitation of proxies from ARCT IV’s stockholders in respect of the proposed ARCT IV merger . Information regarding ARCP’s directors and executive officers can be found in ARCP’s definitive proxy statement filed with the SEC on April 30 , 2013 . Information regarding ARCT IV’s directors and executive officers can be found in ARCT IV’s definitive proxy statement filed with the SEC on April 30 , 2013 . Additional information regarding the interests of such potential participants will be included in the proxy statement/prospectus, the registration statement and other relevant documents filed with the SEC in connection with the proposed ARCT IV merger if and when they become available . These documents are available free of charge on the SEC’s website and from ARCP or ARCT IV, as applicable, using the sources indicated above . Additional Information about the ARCT IV Merger and Where to Find It