Attached files
| file | filename |
|---|---|
| 8-K - 8-K - POPULAR, INC. | d617576d8k.htm |
 October 2013
Exhibit 99.1 |
 1
Franchise Overview
Franchise
Executive
Team
Founded in 1893, Popular is the leading financial services institution in Puerto
Rico with strong market share (38% of Puerto Rico deposits, net of
brokered) 288 branches serving customers in Puerto Rico, U.S. Virgin Islands,
New York, New Jersey, California, Florida, and Illinois
Primarily regulated by the Federal Reserve Bank of New York
Financial Data as of September 30, 2013
Market Data as of October 24, 2013:
Chief
Executive
Officer:
Richard
Carrión
Chief
Financial
Officer:
Carlos
Vázquez
EVP,
Corporate
Risk
Management:
Lidio
Soriano
EVP,
Chief
Legal
Officer:
Ignacio
Alvarez
EVP,
Commercial
Credit:
Eli
Sepúlveda
EVP,
Commercial
Credit
Administration
Group:
Ileana
González
EVP,
Consumer
Credit:
Gilberto
Monzón
SVP,
Corporate
Treasury:
Richard
Barrios
Each
member
of
the
management
team
has
over
20+
years
of
banking
experience
$36.1bn in assets (36th largest bank holding company in the U.S.)
–
~76%
in
Puerto
Rico
and
U.S.
Virgin
Islands,
~24%
in
the
continental
U.S.
$24.6bn in total loans
$26.4bn in total deposits
NASDAQ ticker symbol: BPOP
Market capitalization: $2.6bn |
 2
Popular Has Emerged from the Credit Crisis as a Stronger Institution
Competitive position in Puerto Rico facilitates peer-leading core earnings
generation capacity Superior and stable NIM of 4.49%
versus peers
at 3.26%
Strong PPNR
/ Risk-Weighted Assets of 2.63%, significantly outperforming peers
at 1.61%
Source:
SNL
Financial
for
peer
data
1
Reflects
non-FTE
basis
2
Peers
include
Comerica
(CMA),
Huntington
(HBAN),
Zions
(ZION),
First
Niagara
(FNFG),
Synovus
(SNV),
First
Horizon
(FHN),
City
National
(CYN),
Associated
(ASBC),
and
First
Citizens
(FCNCA)
3
Pre-provision
net
revenue
is
defined
as
net
interest
income
plus
noninterest
income
less
non-credit
related
expenses
4
Includes
sales
of
equity
participations
in
EVERTEC
resulting
in
gains
of
$531mm
(Q3
2010),
$157mm
(Q2
2013),
and
$168mm
(Q3
2013)
Superior
Revenue
Generation
Fortified
Capital
Derisked
Balance
Sheet
Robust Risk
Management and
Capital Planning
Strong
Liquidity
Contained
Exposure to Puerto
Rico Economy
Popular believes it is well-positioned to repay TARP
Improved capital adequacy with Tier 1 common capital (pro forma for TARP
repayment) more than doubling from 4.6% in Q3 2008 to 12.4% in Q3
2013 Raised ~$3.0bn
4
of common equity since 2009, putting Popular in a comparable position with other
U.S. banks Significant investments provide additional sources of capital
(e.g. EVERTEC and Centro Financiero BHD) Diversified balance sheet across
asset classes and geographies Materially improved credit quality to
pre-crisis levels with NPAs / assets as of Q3 2013 of 2.6% compared to a
peak level of 7.2% in Q1 2010
Completed four bulk sales of NPLs since 2011, substantial reduction in NPL
inflows, and aggressive internal resolutions of problem loans
Considerable enhancements to risk management, credit administration, and reserve
and underwriting policies, as well as capital planning and stress testing
processes Capital adequacy process is aligned with 2013 CCAR principles
Maintains 2+ years of cash flow coverage at the holding company
Noninterest bearing deposits / total deposits increased from 16%
in 2008 to 22% as of Q3 2013
Direct loan exposure to Puerto Rico government is tied to specific revenue sources
and direct tax revenues 1
2
3
2 |
 3
Agenda
Corporate Overview
Financial Performance and Developments
Macroeconomic Update
Consolidated and Regional Financials
Conclusion
Appendix |
 4
BPOP subsidiaries and equity investments
($mm)
Banco Popular
de Puerto Rico
Banco Popular
North America
EVERTEC²
Centro Financiero
BHD³
Ownership stake
–
100.0%
100.0%
21.3%
20.0%
Total assets
$36,052
$26,680
$8,782
$947
$3,460
Total liabilities
$31,658
$23,874
$7,118
$781
$3,006
o/w deposits
26,395
20,436
6,042
–
1,587
o/w long-term debt (incl. TARP)
1,545
548
217
675
237
Total equity
$4,394
$2,806
$1,664
$167
$454
Net income (LTM)
$274
$197
$78
$109
$114
Popular
(consolidated)¹
Corporate Structure and Equity Ownership Stakes
Source: SNL Financial
Note:
Financial
data
for
the
quarter
ended
September
30,
2013
(unless
otherwise
noted);
Figures
for
subsidiaries
and
equity
holdings
represent
consolidated
company
financials
and
do
not
reflect
Popular’s
ownership
percentage
1
Popular
(consolidated)
LTM
net
income
based
on
non-GAAP
adjusted
earnings
as
reported
quarterly
in
Company’s
investor
presentations
2
EVERTEC
LTM
net
income
excludes
non-recurring
pre-tax
expenses
of
$142.4mm;
Market
value
of
Popular’s
stake
in
EVTC
~$400mm
as
of
October
24,
2013
3
Consolidated
financial
data
as
of
December
31,
2012;
All
figures
shown
in
USD
Banco Popular
North America
Puerto Rico
operations
U.S.
banking
operations
Assets = $36.1bn
Popular Securities, Inc.
Popular Insurance, Inc.
Popular North America,
Inc.
Popular Auto, Inc.
Banco Popular de
Puerto Rico
21.3% equity stake
Transaction processing, business
processes outsourcing
20.0% equity stake
$3.5bn-asset bank in the
Dominican Republic
Assets = $26.7bn
Assets = $8.8bn
Key Financial Information for Selected Popular Subsidiaries and Equity
Holdings |
 5
Corporate History
Dec
2008
(%)
2008
2009
2010
2011
2012
2013
Q3
Q4
Q1
Q2
Q3
Q4
Q1
Q2
Q3
Q4
Q1
Q2
Q3
Q4
Q1
Q2
Q3
Q4
Q1
Q2
Q3¹
Tier 1
common
4.6
3.2
3.1
2.4
6.9
6.4
6.1
9.2
11.4
11.0
11.6
11.5
12.0
12.1
12.5
12.3
12.7
13.2
12.4
13.0
12.4
780
bps
NPAs /
Assets
2.7
3.3
4.0
5.7
6.3
6.9
7.2
6.2
6.6
6.4
6.0
5.9
5.9
6.3
6.2
5.9
5.8
5.5
3.8
2.7
2.6
(10)
bps
Received $935mm in TARP in exchange for senior
preferred stock
Converted $934mm in trust
preferred securities and
perpetual preferred, issuing
357.5mm common shares
Exchanged $935mm of
TARP preferred for
new trust preferred
securities
Impact:
Generated
$1.4bn
in
Tier
1
common
capital
Dec
2010
Aug
2009
May
2010
Sept
2010
Apr
2013
Sept
2013
Issued $1.2bn of common stock
Impact:
Tier
1
common
rose
from
6.1%
to
9.2%
q-o-q
Sold majority stake in
EVERTEC
Impact:
After-tax
gain
of
$531mm,
retained
49%
stake
Sold additional equity participation
in EVERTEC IPO
Impact:
After-tax
gain
of
$157mm,
retained
32%
stake
Sold additional equity participation
in EVERTEC follow-on
Impact:
After-tax
gain
of
$186mm,
retained
21%
stake
Impact:
Solidified
capital
ratios
and
built
buffer
capital
Implemented restructuring plan, including exiting non-core
national businesses and direct internet-based lender
business (E-LOAN) and reducing branches and headcount
Impact:
Improved
operational
focus
and
protected
against
potential
downside
in
riskier
lines
of
business
Sold $396mm in US non-conventional
mortgages for 40% UPB
Impact:
Reduced
mortgage
NPLs
by
$395mm
Sold $128mm in PR commercial and
construction loans for 45% UPB
Impact:
Reduced
NPLs
by
$120mm,
retained
24.9%
in
JV
Sold $435mm in PR residential
mortgage NPLs for 48% UPB
Impact:
Reduced
NPL
ratio
to
2.9%
as
of
June
2013
Sold $509mm in PR
assets for 34% UPB
Impact:
Reduced
NPAs
by
$501mm
Feb
2011
Sept
2011
Mar
2013
Jun
2013
Total common equity
raised = ~$3.0 billion
Total reduction in NPLs
from peak= ~$1.7 billion
Popular Has Derisked its Loan Portfolio While Raising Substantial New Capital
1
Tier 1 common excludes TARP |
 6
Diversified Asset Mix and Funding Sources
Total assets: $36bn
Total liabilities: $32bn
Total equity: $4bn
Proactive Balance Sheet Management
Liquid
balance
sheet
with
20%
cash
and
securities
Reduced
exposure
to
high
loss
content
portfolios
Stable
funding
base
with
93%
loans
/
deposits
and
69%
core
deposits
(cost
of
total
deposits
of
0.48%)
Commercially
focused
loans
make
up
41%
of
gross
loans
Note: Financial data for the quarter ended September 30, 2013
1
Excludes time deposits
Assets as of September 30, 2013
Liabilities and Equity as of September 30, 2013
1 |
  7
Market Leadership in Puerto Rico
Popular’s Market Share Trend
Puerto Rico Market Share by Category
Popular's
Popular's
Popular / top
market
market
competitor
Category
rank
share
Institution
Share
market share
Total deposits (net of brokered)
1
38%
Santander
12%
3.2x
Total loans
1
36%
FirstBank
16%
2.3x
Commercial and construction loans
1
37%
FirstBank
20%
1.9x
Credits cards
1
51%
FirstBank
15%
3.4x
Mortgage loan production
1
30%
Doral
17%
1.8x
Personal loans
1
31%
Santander
5%
6.2x
Auto loans and leases
3
16%
Reliable
26%
0.6x
Assets under management
3
13%
UBS
46%
0.3x
Top competitor
Source: Puerto Rico Office of the Commissioner of Financial Institutions & 10K
reports; Mortgage origination data is not publicly available; Figures presented for BPPR and competitors were provided internally; Personal Loans: As a
group, Credit Unions represent the largest competitor with 52% market share (115
Credit Unions were in business as of December 31, 2012 guaranteed by COSSEC) |
 8
Agenda
Corporate Overview
Financial Performance and Developments
Macroeconomic Update
Consolidated and Regional Financials
Conclusion
Appendix |
 9
Peer-Leading, Consistent Core Revenue Generation
Pre-Provision Net Revenue³
/ Risk-Weighted Assets
Source: SNL Financial for peer data
Note: GAAP / Non-GAAP reconciliation in the Appendix
1
Peers include Comerica (CMA), Huntington (HBAN), Zions (ZION), First Niagara (FNFG),
Synovus (SNV), First Horizon (FHN), City National (CYN), Associated (ASBC), and First Citizens (FCNCA)
2
2013Q3 reflects as-reported NIM for peers in GAAP reporting
3
Pre-provision net revenue is defined as net interest income plus noninterest
income less non-credit related expenses Net Interest Margin
(Non-FTE) |
 10
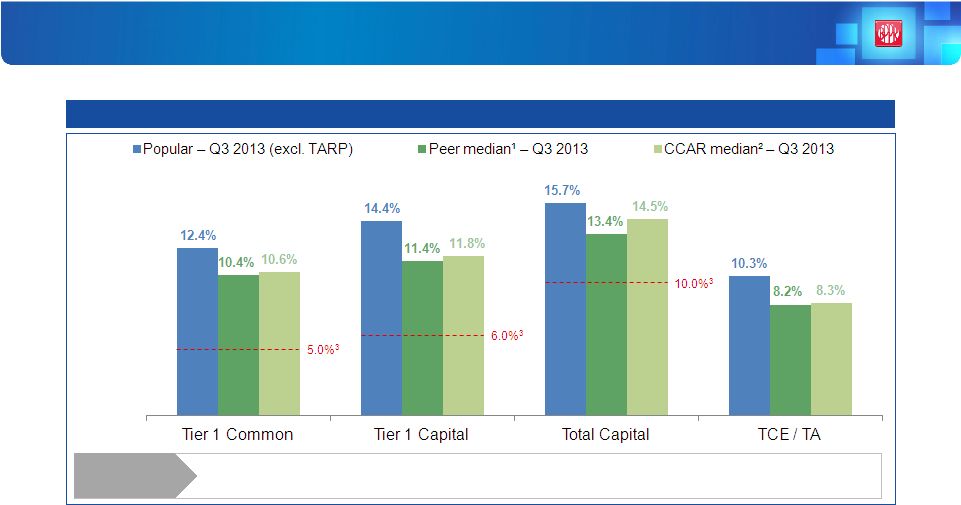
Pro Forma Capital Ratios In-Line with Peers and CCAR Banks
Key Capital Adequacy Metrics
Source:
SNL
Financial
for
peer
data
1
Peers
include
Comerica
(CMA),
Huntington
(HBAN),
Zions
(ZION),
First
Niagara
(FNFG),
Synovus
(SNV),
First
Horizon
(FHN),
City
National
(CYN),
Associated
(ASBC),
and
First
Citizens
(FCNCA)
2
CCAR
banks
include
JPMorgan
Chase
(JPM),
Bank
of
America
(BAC),
Citigroup
(C),
Wells
Fargo
(WFC),
U.S.
Bancorp
(USB),
PNC
(PNC),
Capital
One
(COF),
BB&T
(BBT),
SunTrust
(STI),
Fifth
Third
(FITB),
Regions
(RF),
and
KeyCorp
(KEY)
3
Minimum
regulatory
requirements
for
well-capitalized
institutions
and
CCAR
minimum
under
stress
4
Excess
capital
defined
as
excess
capital
over
minimum
regulatory
requirements
for
well-capitalized
Basel
I
threshold
$1.7bn
$1.9bn
$1.3bn
–
Excess
capital
4 |
 11
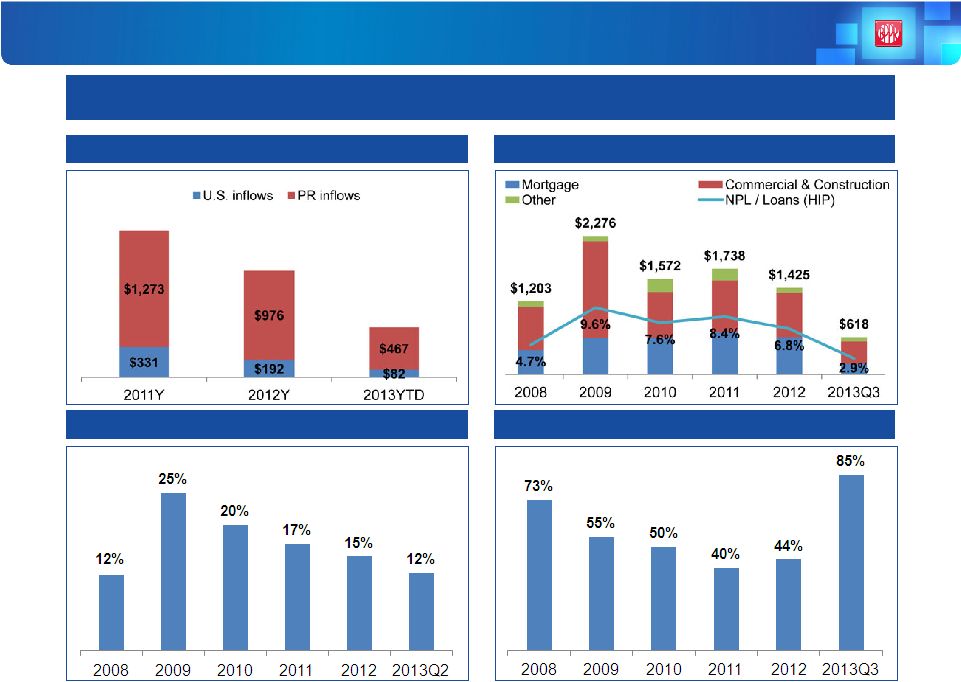
Significantly Improved Asset Quality
NPL Inflows (excl. Consumer Loans) ($mm)
NPLs / Total Loans
Weighted Classified Assets Ratio
Reserves / NPLs
Substantial Reduction in NPL Inflows Coupled with Bulk Asset Sales
Have Reduced Problem Assets and Boosted Reserve Coverage
1
Excludes covered loans
1 |
 12
Loan Portfolio Composition
BPPR has derisked its
commercial loan portfolio by
reducing its exposure in
asset classes with
historically high loss content
Collateralized exposure now
represents a larger portion of
consumer loan portfolio
Unsecured loans credit
quality has improved as
overall FICO scores have
increased
($mm)
Q4 2007
Q3 2013
Q4 2007
Q3 2013
Q4 2007
Q3 2013
Variance
Commercial
$7,774
$6,255
$4,514
$3,591
$12,288
$9,845
($2,442)
Consumer
3,552
3,274
1,698
626
5,250
3,900
(1,350)
Mortgage
2,933
5,344
3,139
1,269
6,072
6,613
541
Construction
1,231
252
236
41
1,467
293
(1,174)
Leases
814
539
-
-
814
539
(275)
Legacy
-
-
2,130
236
2,130
236
(1,894)
Total
$16,304
$15,664
$11,717
$5,763
$28,021
$21,426
($6,595)
Puerto Rico
US
Total
NCOs
($mm)
(%)
($mm)
(%)
($mm)
(%)
Distribution¹
CRE SME²
$2,939
32%
$1,789
28%
($1,150)
(39%)
23%
C&I SME²
2,287
25%
931
14%
(1,356)
(59%)
28%
C&I Corp
1,592
18%
1,860
29%
268
17%
6%
Construction
1,231
14%
252
4%
(979)
(80%)
38%
CRE Corp
892
10%
1,590
24%
698
78%
4%
Multifamily
64
1%
85
1%
21
33%
1%
Total
$9,005
$6,507
($2,498)
(28%)
100%
($mm)
Q4 2007
Q3 2013
Variance
Loan Composition (Held in Portfolio)
Puerto Rico Commercial and Construction Portfolio Distribution
Overview
De-Risked
Loan
Portfolio
with
Reduced
Exposure
to
Historically
High
Loss
Content
1
NCOs distribution represents the percentage allocation of NCOs
from Q1 2008 through Q3 2013 per each loan category
2
Small and Medium Enterprises
Note: Legacy portfolio is comprised of certain commercial, construction and lease
financings lending products exited by the US Construction loan portfolio
is down by 80% since Q4
2007
SME
balances down by
48% from Q4 2007
2 |
 13
Strong Liquidity with Stable Funding Sources
Loans / Deposits
Noninterest Bearing Deposits / Total Deposits
Cash and Securities / Assets
Time Deposits / Total Deposits
Maintains 2+ years of cash flow coverage at the holding company
|
 14
Additional Detail on Holding Company Liquidity
Approximately
$400mm
in
holding
company
cash
as
of
September
30,
2013
12-month
required
debt
service
is
$121mm
(including
TARP)
Maintains
2+
years
of
cash
flow
coverage
at
the
holding
company
Next
maturity
not
until
February
2027
In
addition,
holding
company
owns
stake
in
EVERTEC
with
market
value
of
approximately
$400mm
Holding
company
subject
to
all
applicable
U.S.
banking
regulation
and
liquidity
requirements
Overview |
 15
Strong Risk Management Culture
Responsible for overseeing and approving the Corporation’s risk management
program Popular has implemented an Enterprise Risk Management (ERM) function
within the Risk Management Group Credit Strategy
Committee
(“CRESCO”)
Asset Liability
Management
Committee (ALCO)
Operational Risk
Management
Committee (ORCO)
Reviews
credit
activities
to
ensure
a
proactive
and
coordinated
management
of
credit
origination,
exposures,
and
procedures,
including
the
adequacy
of
the
allowance
for
loan
losses,
monitoring
asset
quality,
and
approving
credit
policies
Analysis
of
the
allowance
adequacy
is
presented
to
the
RMC
of
the
BOD
Manages the risk assumed by Popular and its subsidiaries in order to maintain
policy compliance,
control
volatility
of
consolidated
net
interest
income,
and
the
consolidated
economic
value
of
equity
sensitivity.
Oversees
the
management
of
capital
and
approves
capital management strategies
Reviews
and
approves
the
Capital
Plan
for
consideration
by
the
RMC
of
the
BOD
Provides
guidance
on
overall
operational
risk
management,
including
design
and
implementation
of
the
levels
of
acceptable
exposures,
ensuring
these
are
consistent
with
Popular’s
stated
goals
Analysis
of
operational
risk
is
presented
to
the
RMC
of
the
BOD
Board of Director’s Risk Management Committee (RMC)
Management Committees
Compliance
Committees
Guide the implementation of compliance programs, policies and procedures
throughout the Corporation in matters related to fair lending,
anti-money laundering, and bank secrecy act, among
others.
In
addition,
these
monitor
compliance
with
federal
laws
Compliance-related
matters
are
presented
to
the
BOD,
RMC,
and
Audit
Committee |
 16
Agenda
Corporate Overview
Financial Performance and Developments
Macroeconomic Update
Consolidated and Regional Financials
Conclusion
Appendix |
 17
Puerto Rico’s Indebtedness Has Been a Recent Area of Focus
Background on Puerto Rico’s Public Debt
Mitigating Actions Taken by the Government
Gross Public Debt of Puerto Rico ($bn)
Puerto Rico has ~$70bn total debt outstanding
Represents ~$14,000 debt per capita and 71% of
total GDP
24% of the public debt is insured
9% of Puerto Rico’s debt matures in or before 2015
Puerto Rico’s 2013 budget deficit was $1.3bn, or ~ 13%
of the budget
Puerto Rico is not eligible to file under Chapter 9 due to
its legal status
Fiscal 2014 budget was approved, reducing deficit by
36% from $1.3bn to $820mm, resulting in no change in
the Commonwealth credit ratings; reforms included:
Tax reform:
–
Increased marginal corporate tax rate from 30% to
39%
–
Act 154 excise tax was increased and fixed at 4%;
also extended for five years
–
Non-tax sources of revenue, such as utility fees
were increased
Pension overhaul:
–
Converted the pension system from a defined
benefit to a defined contribution plan, effective
June 30
–
Reforms have made the pension cash sufficient,
requiring no additional government outlays
beyond its $140mm contribution
–
Raised retirement age for some state workers,
increased the worker pension contribution
requirement, and changed monthly benefits for
some workers
Privatization of Public Facilities:
–
Completed privatization of Luis Muñoz Marín
International Airport and Highway 22
In October 2013, Moody’s affirmed Puerto Rico’s
general obligation rating at Baa3 (outlook negative),
citing the government’s significant fiscal measures
Source: Government Development Bank of Puerto Rico; Puerto Rico Planning Board
Statistical Index 2012; Equity research reports
|
 18
Loans
to
the
Government
of
Puerto
Rico
and
Public
Corporations
are
either
collateralized
loans
or
obligations
that
have
a
specific
source
of
income
or
revenues
identified
for
their
repayment
Loans
to
various
municipalities
backed
by
unlimited
taxing
power
or
real
and
personal
property
taxes
collected
within
such
municipalities
Includes
$272
million
residential
mortgage
loans
to
individual
borrowers
with
a
government
guarantee
$52
million
in
FNMA,
GNMA
or
residential
loan
CMOs
$35
million
of
industrial
development
notes
payable
primarily
by
non
government tenants
Our current exposure to the PR government and its instrumentalities is $1.4
billion, of which $1.2 billion is outstanding Of the amount outstanding,
$951 million consists of loans and $204 million is securities Direct
Exposure $388 million
outstanding
Indirect Exposure
$359 million
outstanding
Municipalities
$408 million
outstanding
Popular’s Exposure to the Puerto Rican Government
Popular’s Exposure |
 19
Agenda
Corporate Overview
Financial Performance and Developments
Macroeconomic Update
Consolidated and Regional Financials
Conclusion
Appendix |
 20
Financial Overview of Popular, Inc.
Year ending
Quarter ending
12/31/06
12/31/07
12/31/08
12/31/09
12/31/10
12/31/11
12/31/12
9/30/13
Balance sheet
Total assets
$47,404
$44,411
$38,883
$34,736
$38,815
$37,348
$36,508
$36,052
Gross loans
32,737
29,911
26,269
23,804
26,459
25,314
25,094
24,628
Total deposits
24,438
28,334
27,550
25,925
26,762
27,942
27,001
26,395
Total equity
3,620
3,582
3,268
2,539
3,801
3,919
4,110
4,394
Profitability
Net income
$357.7
($64.5)
($1,243.9)
($573.9)
$137.4
$151.3
$245.3
$229.1
ROAA
0.74%
(0.14%)
(3.04%)
(1.57%)
0.36%
0.40%
0.68%
2.51%
ROAE
9.7%
(2.1%)
(44.5%)
(33.0%)
4.4%
4.0%
6.4%
21.6%
Net interest margin¹
3.18%
3.59%
3.52%
3.23%
3.79%
4.34%
4.35%
4.49%
Capital ratios
TCE / TA
5.7%
6.2%
2.9%
5.4%
8.0%
8.6%
9.4%
10.3%
Tier 1 common
7.7%
7.1%
3.2%
6.4%
11.0%
12.1%
13.2%
14.2%
Tier 1 capital
10.6%
10.1%
10.8%
9.8%
14.5%
16.0%
17.4%
18.5%
Asset quality
NPAs / loans & OREO
2.44%
2.84%
4.90%
10.04%
9.33%
9.24%
7.85%
3.79%
NCOs / avg loans²
0.65%
1.01%
2.29%
4.17%
5.15%
2.61%
1.97%
1.08%
Reserves / NPLs³
73%
71%
73%
55%
50%
40%
44%
85%
Per share data
Shares out. (mm)
27.9
28.0
28.2
64.0
102.3
102.6
103.2
103.3
Avg. dil. shares (mm)
27.9
27.9
28.1
40.8
88.5
102.3
102.7
103.0
Tangible book value
$95.47
$96.23
$39.92
$28.78
$29.77
$30.77
$32.55
$35.32
Financial Highlights
1
Net interest margin does not reflect fully taxable equivalent basis
2
Excludes net write-downs related to loans transferred to loans
held-for-sale; Excludes covered loans 3
Excludes covered loans |
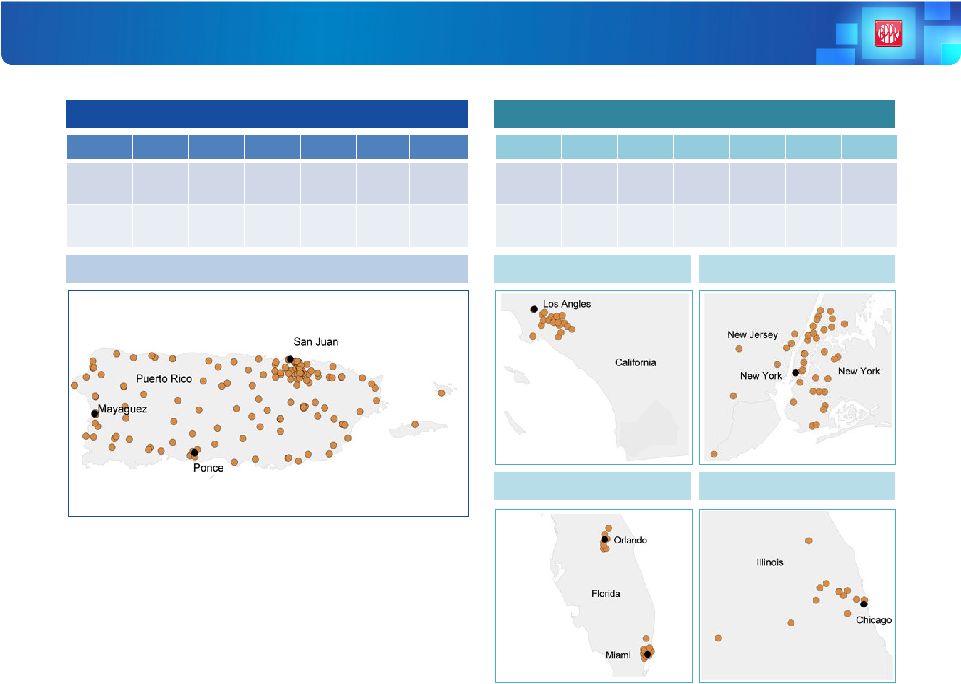 21
Regional Information
Banco Popular de Puerto Rico
Banco Popular North America
($mm)
2008
2009
2010
2011
2012
2013¹
Assets
$25,522
$23,271
$28,977
$27,941
$27,204
$26,680
Net
income
$200
$125
$17
$180
$237
$84
($mm)
2008
2009
2010
2011
2012
2013¹
Assets
$12,426
$10,847
$8,974
$8,581
$8,652
$8,782
Net
income
($552)
($738)
($352)
$18
$33
$64
1
Reflects YTD financials for the nine months ended September 30,
2013
Puerto Rico
California
New York Metro
Florida
Chicago Metro |
 22
Financial Overview of Banco Popular de Puerto Rico
Year ending
Quarter ending
12/31/06
12/31/07
12/31/08
12/31/09
12/31/10
12/31/11
12/31/12
9/30/13
Balance sheet
Total assets
$25,020
$26,742
$25,522
$23,271
$28,977
$27,941
$27,204
$26,680
Gross loans
15,433
16,551
16,013
15,118
19,502
19,507
19,309
18,860
Total deposits
14,736
18,761
18,427
17,796
20,270
21,881
21,021
20,436
Total equity
1,691
1,818
1,900
1,913
2,523
2,627
2,810
2,806
Profitability
Net income
$322.5
$296.6
$200.0
$124.6
$16.6
$180.5
$236.7
$53.6
ROAA
1.27%
1.17%
0.78%
0.52%
0.06%
0.63%
0.88%
0.80%
ROAE
18.0%
15.7%
10.8%
6.7%
0.7%
7.3%
9.0%
7.7%
Net interest margin¹
3.73%
3.93%
3.97%
3.82%
4.45%
5.58%
5.59%
5.35%
Capital ratios
TCE / TA
6.6%
6.1%
6.8%
7.5%
7.8%
8.5%
9.4%
9.6%
Tier 1 common
9.2%
7.7%
7.8%
8.9%
10.9%
12.0%
12.9%
12.2%
Tier 1 capital
9.2%
7.7%
7.8%
8.9%
10.9%
12.0%
12.9%
12.2%
Asset quality
NPAs / loans & OREO
1.68%
2.59%
5.17%
10.33%
9.06%
9.88%
8.72%
3.82%
NCOs / avg loans²
0.76%
1.21%
2.16%
3.31%
4.67%
2.24%
1.92%
1.14%
Reserves / NPLs³
132%
96%
70%
44%
41%
33%
37%
87%
Financial Highlights
1
Net
interest
margin
does
not
reflect
fully
taxable
equivalent
basis
2
Excludes
net
write-downs
related
to
loans
transferred
to
loans
held-for-sale;
Excludes
covered
loans
3
Excludes
covered
loans |
 23
Financial Overview of Banco Popular North America
Year ending
Quarter ending
12/31/06
12/31/07
12/31/08
12/31/09
12/31/10
12/31/11
12/31/12
9/30/13
Balance sheet
Total assets
$12,244
$13,358
$12,426
$10,847
$8,974
$8,581
$8,652
$8,782
Gross loans
8,787
10,288
10,244
8,677
6,922
5,778
5,755
5,766
Total deposits
9,761
9,791
9,697
8,270
6,587
6,168
6,076
6,042
Total equity
1,352
1,485
1,291
1,173
1,581
1,631
1,657
1,664
Profitability
Net income
$94.3
($211.7)
($552.2)
($738.1)
($352.3)
$17.5
$33.4
$21.7
ROAA
0.77%
(1.62%)
(4.28%)
(6.31%)
(3.57%)
0.20%
0.39%
0.99%
ROAE
7.1%
(12.7%)
(38.1%)
(61.3%)
(27.3%)
1.1%
2.1%
5.2%
Net interest margin¹
3.26%
3.16%
2.99%
2.86%
3.33%
3.63%
3.60%
3.68%
Capital ratios
TCE / TA
7.8%
8.1%
7.2%
7.2%
13.6%
14.9%
15.1%
15.0%
Tier 1 common
10.1%
9.1%
8.9%
9.5%
17.6%
20.5%
22.8%
23.9%
Tier 1 capital
10.1%
9.1%
8.9%
9.5%
17.6%
20.5%
22.8%
23.9%
Asset quality
NPAs / loans & OREO
0.78%
1.86%
4.48%
9.52%
10.13%
7.09%
4.93%
3.66%
NCOs / avg loans²
0.40%
0.60%
2.42%
5.50%
6.01%
3.26%
1.98%
0.91%
Reserves / NPLs
148%
71%
80%
76%
73%
65%
76%
72%
Financial Highlights
1
Net
interest
margin
does
not
reflect
fully
taxable
equivalent
basis
2
Excludes
net
write-downs
related
to
loans
transferred
to
loans
held-for-sale |
 24
Agenda
Corporate Overview
Financial Performance and Developments
Macroeconomic Update
Consolidated and Regional Financials
Conclusion
Appendix |
 25
Conclusions
Popular
has
emerged
from
the
crisis
as
a
strongly-capitalized
institution
with
materially
improved
asset
quality
It
has
a
dominating
franchise
in
its
home
market,
which
provides
a
solid
base
of
PPNR
and
profitability
The
management
team
has
considerable
experience
with
a
deep
bench
of
talent
Its
capital
management
process
is
robust
and
closely
follows
CCAR
principles
With
$1.7
billion
in
excess
capital
and
$400
million
in
holding
company
cash,
as
well
as
a
de-
risked
loan
portfolio,
Popular
is
well
positioned
to
exit
TARP
while
maintaining
a
solid
capital
base
The Commonwealth’s financial problems are challenging, but manageable
Material, important steps have been taken to address market concerns: pension plan
reform, material deficit reduction, the privatization of key public
assets These measures will pressure the economy in the short-term, but
should be positive, longer- term
Popular
Puerto Rico |
 26
Popular, Inc. Credit Ratings
October
2013:
Moody’s
revised
outlook
to
negative
January
2013:
Fitch
raised
to
BB-
from
B+;
outlook
revised
to
stable
December
2012:
Moody’s
downgraded
BPOP
to
B1;
stable
outlook
assigned
April
2012:
Moody’s
placing
most
of
the
PR
banks
under
review
with
the
possibility
of
downgrades,
due
to
the
state
of
the
Puerto
Rico
economy
January
2012:
Fitch
raised
BPOP’s
outlook
to
positive
December
2011:
S&P
raised
its
ratings
on
BPPR
to
BB
from
BB-
and
changed
outlook
to
stable
given
revised
bank
criteria
to
regional
banks
July
2011:
S&P
raised
our
senior
unsecured
rating
by
one
notch
to
B+
As
the
Puerto
Rico
economy
stabilizes
and
our
credit
metrics
improve,
we
should
see
upward
pressure
on
the
ratings
Agency
Rating
Outlook
Date of last BHC action
Moody’s
B1
Negative
October 2013
Fitch
BB-
Stable
January 2013
S&P
B+
Stable
July 2011
Credit Ratings
Popular’s Senior Unsecured Ratings Have Gradually Improved Since 2010
|
 27
Agenda
Corporate Overview
Financial Performance and Developments
Macroeconomic Update
Consolidated and Regional Financials
Conclusion
Appendix |
  28
GAAP / Non-GAAP Reconciliation –
Popular, Inc.
($ in millions)
2008 Y
2009 Y
2010 Y
2011 Y
2012Y
Nine months
ended
9/30/13
Net (loss) income
($680)
($554)
$146
$150
$244
$436
Income tax expense (benefit)
462
(8)
101
115
(25)
(276)
Provision for loan losses (PLL)
991
1,406
1,012
576
409
546
Less: Realized gain (loss) on AFS securities
70
220
4
11
(2)
6
Less: Gain on sale of processing and technology business
–
–
641
–
–
–
Less: Gain on sale of equity method investment
–
–
–
21
–
–
Less: Unfavorable HFS loan valuation adjustment
–
–
–
–
(27)
–
Less: Proportionate share of EVERTEC's tax benefit
–
–
–
–
32
–
Less: Bulk sales of NPA's
–
–
–
–
–
(118)
Less: EVERTEC's IPO and SPO
–
–
–
–
–
337
Less: Mirror impact on PLL for covered loans on LSA
–
–
–
110
58
53
Less: Restructuring charges
23
11
–
–
–
–
Less: OREO expenses
23
26
47
22
24
20
Less: FDIC special assessment
–
18
–
–
–
–
Less: Early extinguishment
–
(78)
13
8
25
–
Less: Transaction costs (sale of processing and technology business)
–
–
25
–
–
–
Less: Uninsured portion of the settlement of certain class action lawsuits
–
–
8
–
–
–
Less: Settlements of representation and warranty arrangements
–
–
33
–
–
–
Less: Implementation of employee retirement window
–
–
–
16
–
–
Less: Amortization of intangibles
24
9
9
10
10
7
Pre-provision net revenue
$773
$608
$749
$755
$626
$455
Risk weighted assets
$30,270
$26,147
$25,721
$24,414
$23,392
$23,052
PPNR / risk-weighted assets (%)
2.55%
2.32%
2.91%
3.09%
2.68%
2.63%
Popular, Inc. |
  29
GAAP / Non-GAAP Reconciliation –
Banco Popular de Puerto Rico
($ in millions)
2008 Y
2009 Y
2010 Y
2011 Y
2012Y
Nine months
ended
9/30/13
Net income
$200
$125
$24
$181
$237
$84
Income tax (benefit) expense
0
(20)
2
100
(40)
(277)
Provision for loan losses (PLL)
519
624
610
487
356
546
Less: Realized gain on AFS securities
70
227
4
9
(0)
(0)
Less: Unfavorable HFS loan valuation adjustment
–
–
–
–
(27)
–
Less: Bulk sales of NPA's
–
–
–
–
–
(118)
Less: Mirror impact on PLL for covered loans on LSA
–
–
–
110
58
53
Less: OREO expenses
4
11
30
16
31
35
Less: Early extinguishment
–
–
2
–
25
–
Less: Implementation of employee retirement window
–
–
–
16
–
–
Less: Amortization of intangibles
6
5
5
6
7
5
Pre-provision net revenue
659
518
669
687
585
458
Risk weighted assets
$19,461
$17,793
$18,635
$18,148
$17,695
$17,441
PPNR / risk-weighted assets (%)
3.38%
2.91%
3.59%
3.79%
3.31%
3.49%
Banco Popular de Puerto Rico |
 30
Forward Looking Statements
The
information
contained
in
this
presentation
includes
forward-looking
statements
within
the
meaning
of
the
Private
Securities
Litigation
Reform
Act
of
1995.
These
forward-looking
statements
are
based
on
management’s
current
expectations
and
involve
risks
and
uncertainties
that
may
cause
the
Company's
actual
results
to
differ
materially
from
any
future
results
expressed
or
implied
by
such
forward-looking
statements.
Factors
that
may
cause
such
a
difference
include,
but
are
not
limited
to
(i)
the
rate
of
growth
in
the
economy
and
employment
levels,
as
well
as
general
business
and
economic
conditions;
(ii)
changes
in
interest
rates,
as
well
as
the
magnitude
of
such
changes;
(iii)
the
fiscal
and
monetary
policies
of
the
federal
government
and
its
agencies;
(iv)
changes
in
federal
bank
regulatory
and
supervisory
policies,
including
required
levels
of
capital;
(v)
the
relative
strength
or
weakness
of
the
consumer
and
commercial
credit
sectors
and
of
the
real
estate
markets
in
Puerto
Rico
and
the
other
markets
in
which
borrowers
are
located;
(vi)
the
performance
of
the
stock
and
bond
markets;
(vii)
competition
in
the
financial
services
industry;
(viii)
possible
legislative,
tax
or
regulatory
changes;
(ix)
the
impact
of
the
Dodd-Frank
Act
on
our
businesses,
business
practice
and
cost
of
operations;
and
(x)
additional
Federal
Deposit
Insurance
Corporation
assessments.
Other
than
to
the
extent
required
by
applicable
law,
the
Company
undertakes
no
obligation
to
publicly
update
or
revise
any
forward-looking
statement.
Please
refer
to
our
Annual
Report
on
Form
10-K
for
the
year
ended
December
31,
2012
and
other
SEC
reports
for
a
discussion
of
those
factors
that
could
impact
our
future
results.
The
financial
information
included
in
this
presentation
for
the
quarter
ended
September
30,
2013
is
based
on
preliminary
unaudited
data
and
is
subject
to
change. |