Attached files
| file | filename |
|---|---|
| 8-K - 8-K - FIRST NIAGARA FINANCIAL GROUP INC | a1018132013q3earningsrelea.htm |
Third Quarter 2013 Earnings Highlights October 18, 2013 Gary M. Crosby Interim President & Chief Executive Officer Gregory W. Norwood Chief Financial Officer
Safe Harbor Statement Any statements contained in this presentation regarding the outlook for FNFG’s business and markets, such as projections of future earnings performance, statements of FNFG’s plans and objectives, forecasts or market trends and other matters, are forward-looking statements based on FNFG’s assumptions and beliefs. Such statements may be identified by such words or phrases as “will likely result,” “are expected to,” “will continue,” “outlook,” “will benefit,” “is anticipated,” “estimate,” “project,” “management believes” or similar expressions. These forward-looking statements are subject to certain risks and uncertainties that could cause actual results to differ materially from those discussed in such statements and no assurance can be given that the results in any forward-looking statement will be achieved. For these statements, FNFG claims the protection of the safe harbor for forward-looking statements contained in the Private Securities Litigation Reform Act of 1995. Any forward-looking statement speaks only as of the date on which it is made, and we disclaim any obligation to subsequently revise any forward-looking statement to reflect events or circumstances after such date or to reflect the occurrence of anticipated or unanticipated events. Certain factors could cause FNFG’s future results to differ materially from those expressed or implied in any forward-looking statements contained in this presentation. These factors include the factors discussed in Part I, Item 1A of FNFG’s 2012 Annual Report on Form 10-K under the heading “Risk Factors” and any other cautionary statements, written or oral, which may be made or referred to in connection with any such forward-looking statements. Since it is not possible to foresee all such factors, these factors should not be considered as complete or exhaustive. 2
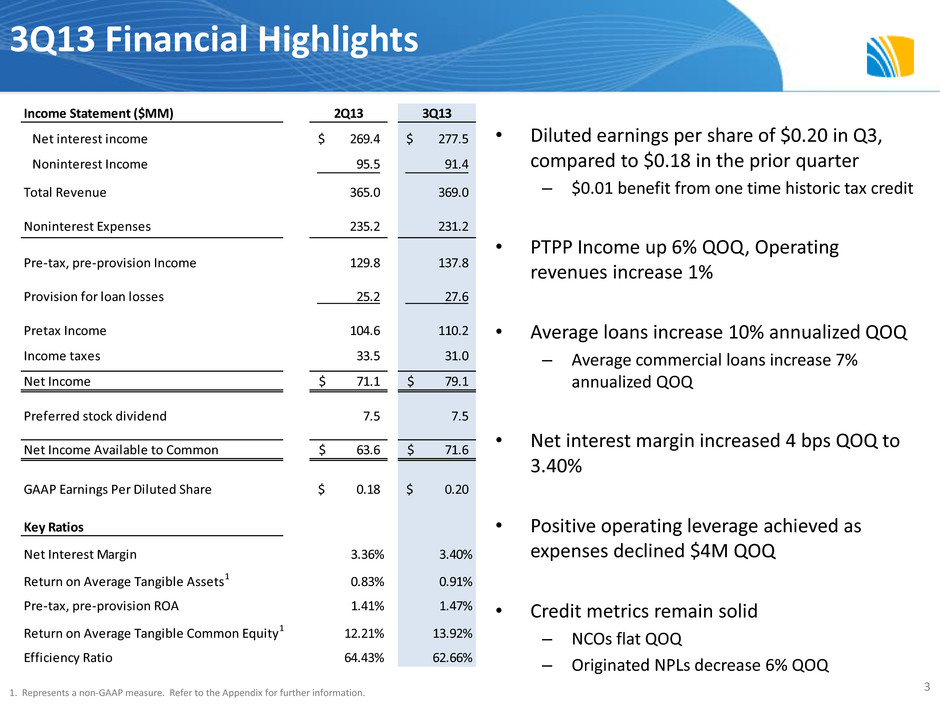
3Q13 Financial Highlights • Diluted earnings per share of $0.20 in Q3, compared to $0.18 in the prior quarter – $0.01 benefit from one time historic tax credit • PTPP Income up 6% QOQ, Operating revenues increase 1% • Average loans increase 10% annualized QOQ – Average commercial loans increase 7% annualized QOQ • Net interest margin increased 4 bps QOQ to 3.40% • Positive operating leverage achieved as expenses declined $4M QOQ • Credit metrics remain solid – NCOs flat QOQ – Originated NPLs decrease 6% QOQ 3 1. Represents a non-GAAP measure. Refer to the Appendix for further information. Income Statement ($MM) 2Q13 3Q13 Net interest income 269.4$ 277.5$ Noninterest Income 95.5 91.4 Total Revenue 365.0 369.0 Noninterest Expenses 235.2 231.2 Pre-tax, pre-provision Income 129.8 137.8 Provision for loan losses 25.2 27.6 Pretax Income 104.6 110.2 Income taxes 33.5 31.0 Net Income 71.1$ 79.1$ Preferred stock dividend 7.5 7.5 Net Income Available to Common 63.6$ 71.6$ GAAP Earnings Per Diluted Share 0.18$ 0.20$ Key Ratios Net Interest Margin 3.36% 3.40% Return on Average Tangible Assets1 0.83% 0.91% Pre-tax, pre-provision ROA 1.41% 1.47% Return on Average Tangible Common Equity1 12.21% 13.92% Efficiency Ratio 64.43% 62.66%
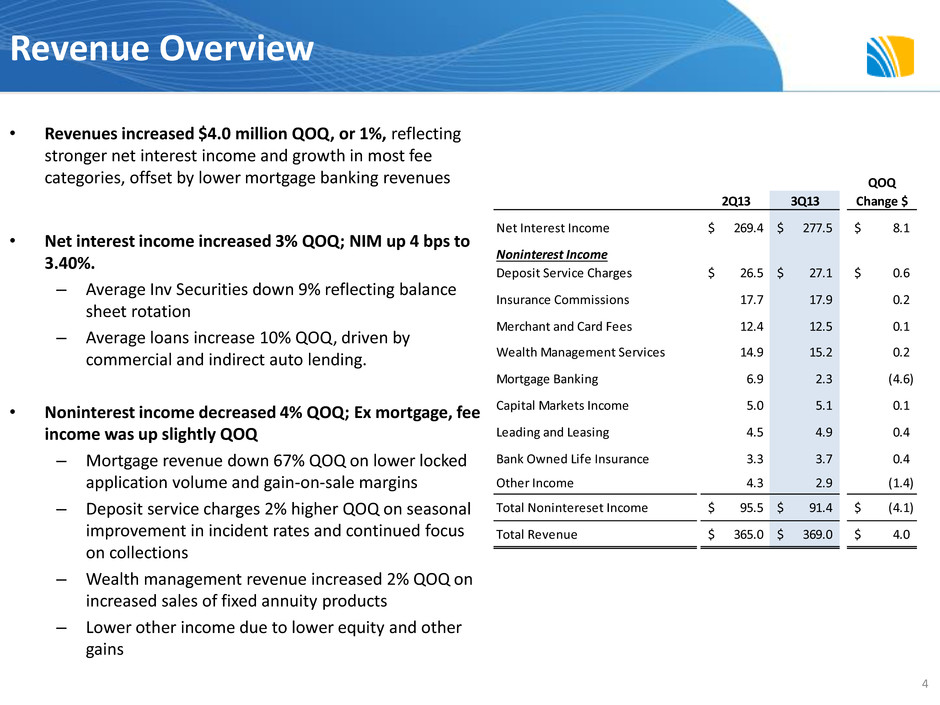
Revenue Overview • Revenues increased $4.0 million QOQ, or 1%, reflecting stronger net interest income and growth in most fee categories, offset by lower mortgage banking revenues • Net interest income increased 3% QOQ; NIM up 4 bps to 3.40%. – Average Inv Securities down 9% reflecting balance sheet rotation – Average loans increase 10% QOQ, driven by commercial and indirect auto lending. • Noninterest income decreased 4% QOQ; Ex mortgage, fee income was up slightly QOQ – Mortgage revenue down 67% QOQ on lower locked application volume and gain-on-sale margins – Deposit service charges 2% higher QOQ on seasonal improvement in incident rates and continued focus on collections – Wealth management revenue increased 2% QOQ on increased sales of fixed annuity products – Lower other income due to lower equity and other gains 4 2Q13 3Q13 Change $ Net Interest Income 269.4$ 277.5$ 8.1$ Noninterest Income Deposit Service Charges 26.5$ 27.1$ 0.6$ Insurance Commissions 17.7 17.9 0.2 Merchant and Card Fees 12.4 12.5 0.1 Wealth Management Services 14.9 15.2 0.2 Mortgage Banking 6.9 2.3 (4.6) Capital Markets Income 5.0 5.1 0.1 Leading and Leasing 4.5 4.9 0.4 Bank Owned Life Insurance 3.3 3.7 0.4 Other Income 4.3 2.9 (1.4) Total Nonintereset Income 95.5$ 91.4$ (4.1)$ Total Revenue 365.0$ 369.0$ 4.0$ QOQ

Net Interest Income and Margin Overview • 3Q13 reported NII and NIM reflect the beneficial impact of $5.9 million (7 bps) related to items not expected in the normal course of business • Normalized NIM of 3.33% in 3Q13 compressed 3 bps QOQ driven by: [-] Continued impact of prepayment of higher-yielding loans and new originations at lower yields (~4 bps) [-] Day count impact (~4 bps) [+] Lower RMBS premium amortization (~4 bps) driven by lower cash flows due to slower prepayments • Cost of interest-bearing deposits unchanged QOQ at 23 bps 5 $ in millions NII (FTE) NIM Notes 3Q13 As Reported $281.9 3.40% Less: CLO Pay-off Discount Recognition -$1.9 -0.02% Earlier than expected pay-offs of CLOs purchased at a discount Less: Other favorable loan adjustments -$2.2 -0.03% Early pay-off and returns to accrual status Less: CMO Retrospective Adjustment -$1.8 -0.02% Retrospective adjustment for changes in prepayment projections in CMO portfolio SUB-TOTAL $-5.9 -0.07% 3Q13 Normalized $276.0 3.33%
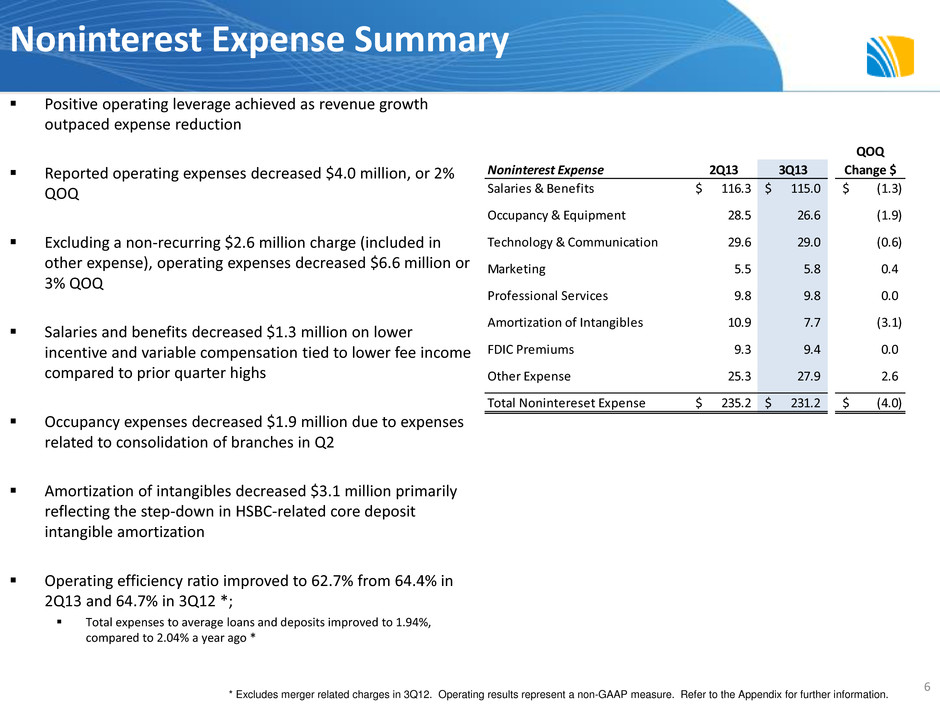
Noninterest Expense Summary 6 Positive operating leverage achieved as revenue growth outpaced expense reduction Reported operating expenses decreased $4.0 million, or 2% QOQ Excluding a non-recurring $2.6 million charge (included in other expense), operating expenses decreased $6.6 million or 3% QOQ Salaries and benefits decreased $1.3 million on lower incentive and variable compensation tied to lower fee income compared to prior quarter highs Occupancy expenses decreased $1.9 million due to expenses related to consolidation of branches in Q2 Amortization of intangibles decreased $3.1 million primarily reflecting the step-down in HSBC-related core deposit intangible amortization Operating efficiency ratio improved to 62.7% from 64.4% in 2Q13 and 64.7% in 3Q12 *; Total expenses to average loans and deposits improved to 1.94%, compared to 2.04% a year ago * * Excludes merger related charges in 3Q12. Operating results represent a non-GAAP measure. Refer to the Appendix for further information. Noninterest Expense 2Q13 3Q13 Change $ Salaries & Benefits 116.3$ 115.0$ (1.3)$ Occupancy & Equipment 28.5 26.6 (1.9) Technology & Communication 29.6 29.0 (0.6) Marketing 5.5 5.8 0.4 Professional Services 9.8 9.8 0.0 Amortization of Intangibles 10.9 7.7 (3.1) FDIC Premiums 9.3 9.4 0.0 Other Expense 25.3 27.9 2.6 Total Nonintereset Expense 235.2$ 231.2$ (4.0)$ QOQ
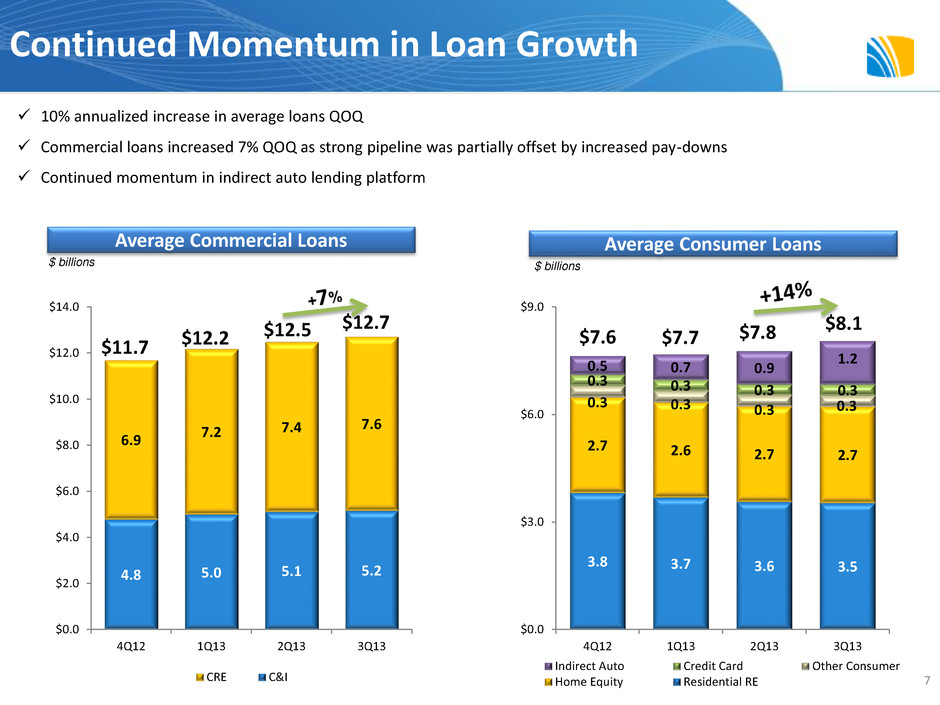
3.8 3.7 3.6 3.5 2.7 2.6 2.7 2.7 0.3 0.3 0.3 0.3 0.3 0.3 0.3 0.3 0.5 0.7 0.9 1.2 $0.0 $3.0 $6.0 $9.0 4Q12 1Q13 2Q13 3Q13 Indirect Auto Credit Card Other Consumer Home Equity Residential RE 4.8 5.0 5.1 5.2 6.9 7.2 7.4 7.6 $0.0 $2.0 $4.0 $6.0 $8.0 $10.0 $12.0 $14.0 4Q12 1Q13 2Q13 3Q13 CRE C&I Continued Momentum in Loan Growth Average Commercial Loans Average Consumer Loans $ billions $ billions 10% annualized increase in average loans QOQ Commercial loans increased 7% QOQ as strong pipeline was partially offset by increased pay-downs Continued momentum in indirect auto lending platform $12.7 $7.6 $11.7 $12.2 $7.7 7 $12.5 $7.8 $8.1
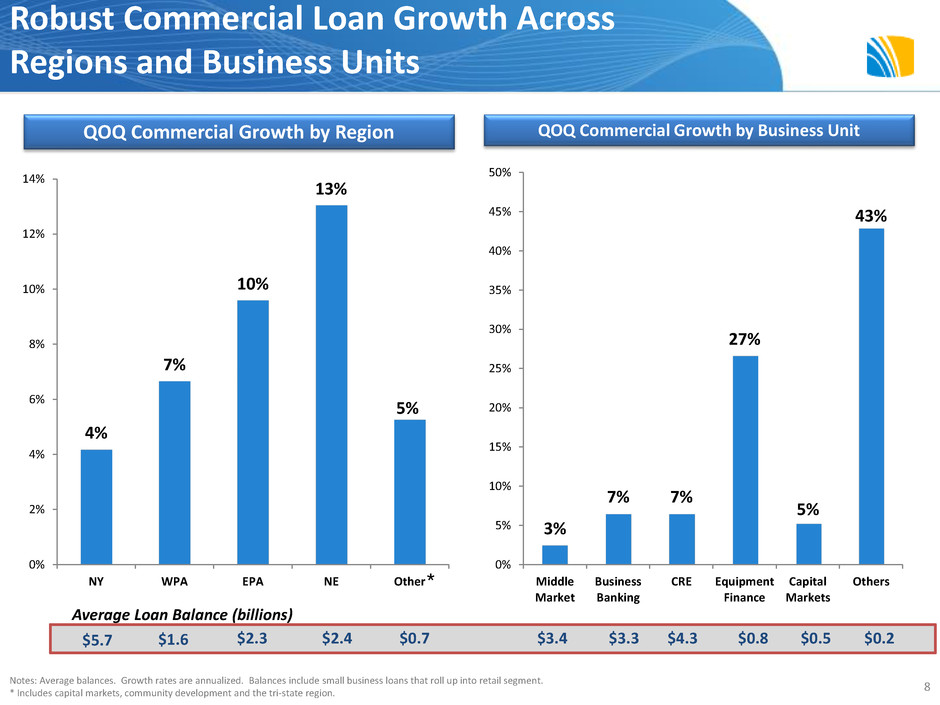
4% 7% 10% 13% 5% 0% 2% 4% 6% 8% 10% 12% 14% NY WPA EPA NE Other Robust Commercial Loan Growth Across Regions and Business Units Notes: Average balances. Growth rates are annualized. Balances include small business loans that roll up into retail segment. * Includes capital markets, community development and the tri-state region. QOQ Commercial Growth by Region QOQ Commercial Growth by Business Unit $5.7 $1.6 $2.3 $2.4 $3.4 $3.3 $4.3 $0.8 $0.5 $0.2 Average Loan Balance (billions) 8 $0.7 * 3% 7% 7% 27% 5% 43% 0% 5% 10% 15% 20% 25% 30% 35% 40% 45% 50% Middle Market Business Banking CRE Equipment Finance Capital Markets Others
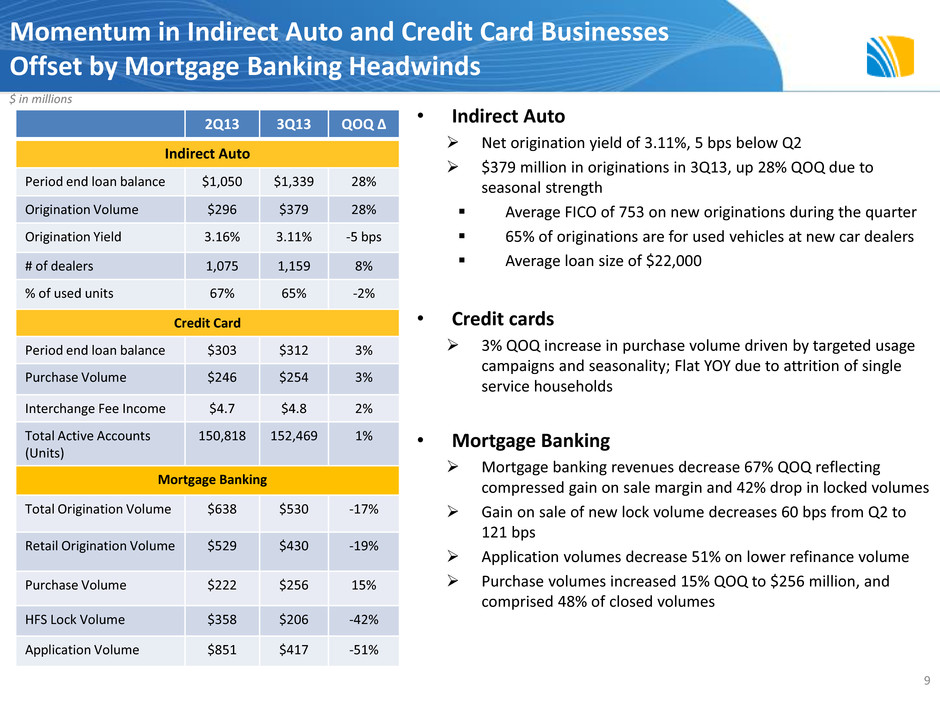
Momentum in Indirect Auto and Credit Card Businesses Offset by Mortgage Banking Headwinds 9 2Q13 3Q13 QOQ ∆ Indirect Auto Period end loan balance $1,050 $1,339 28% Origination Volume $296 $379 28% Origination Yield 3.16% 3.11% -5 bps # of dealers 1,075 1,159 8% % of used units 67% 65% -2% Credit Card Period end loan balance $303 $312 3% Purchase Volume $246 $254 3% Interchange Fee Income $4.7 $4.8 2% Total Active Accounts (Units) 150,818 152,469 1% Mortgage Banking Total Origination Volume $638 $530 -17% Retail Origination Volume $529 $430 -19% Purchase Volume $222 $256 15% HFS Lock Volume $358 $206 -42% Application Volume $851 $417 -51% • Indirect Auto Net origination yield of 3.11%, 5 bps below Q2 $379 million in originations in 3Q13, up 28% QOQ due to seasonal strength Average FICO of 753 on new originations during the quarter 65% of originations are for used vehicles at new car dealers Average loan size of $22,000 • Credit cards 3% QOQ increase in purchase volume driven by targeted usage campaigns and seasonality; Flat YOY due to attrition of single service households • Mortgage Banking Mortgage banking revenues decrease 67% QOQ reflecting compressed gain on sale margin and 42% drop in locked volumes Gain on sale of new lock volume decreases 60 bps from Q2 to 121 bps Application volumes decrease 51% on lower refinance volume Purchase volumes increased 15% QOQ to $256 million, and comprised 48% of closed volumes $ in millions
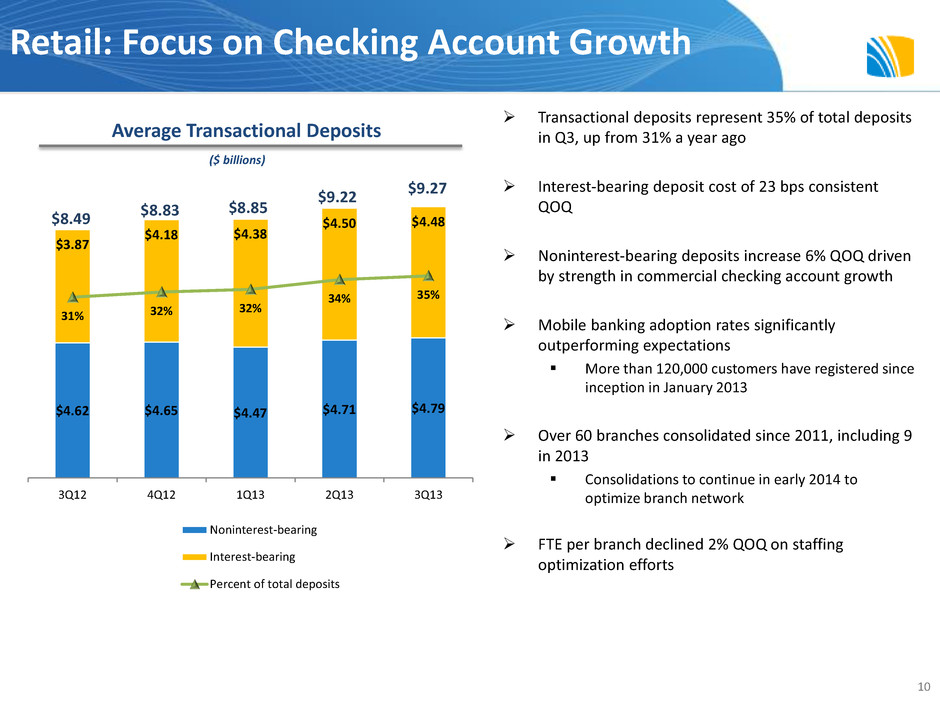
$4.62 $4.65 $4.47 $4.71 $4.79 $3.87 $4.18 $4.38 $4.50 $4.48 31% 32% 32% 34% 35% 3Q12 4Q12 1Q13 2Q13 3Q13 Noninterest-bearing Interest-bearing Percent of total deposits Transactional deposits represent 35% of total deposits in Q3, up from 31% a year ago Interest-bearing deposit cost of 23 bps consistent QOQ Noninterest-bearing deposits increase 6% QOQ driven by strength in commercial checking account growth Mobile banking adoption rates significantly outperforming expectations More than 120,000 customers have registered since inception in January 2013 Over 60 branches consolidated since 2011, including 9 in 2013 Consolidations to continue in early 2014 to optimize branch network FTE per branch declined 2% QOQ on staffing optimization efforts Retail: Focus on Checking Account Growth 10 Average Transactional Deposits $9.27 $9.22 $8.85 $8.83 $8.49 ($ billions)
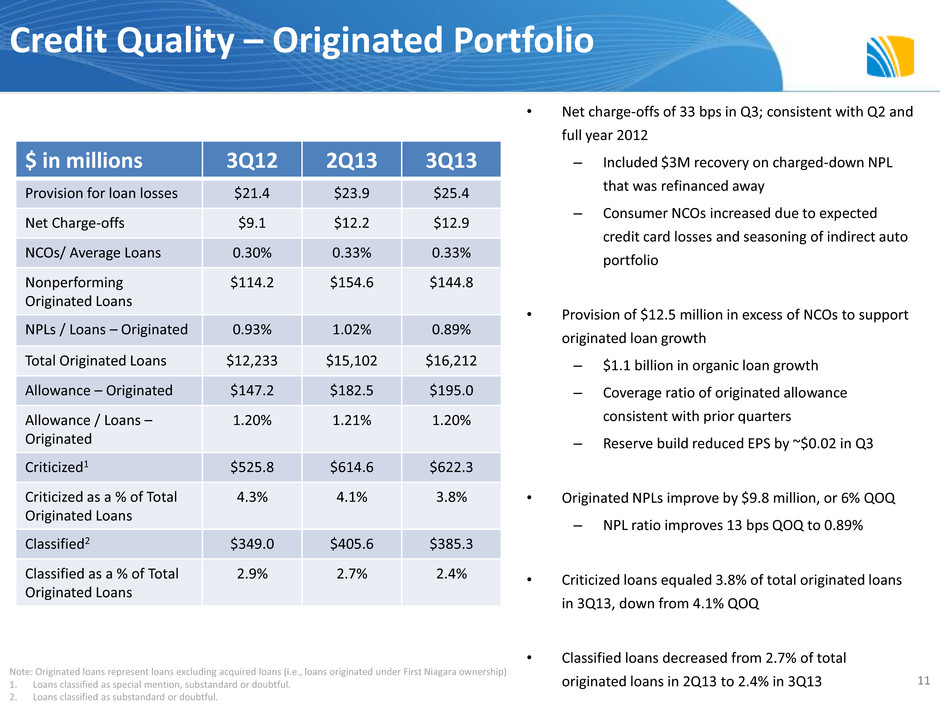
Credit Quality – Originated Portfolio • Net charge-offs of 33 bps in Q3; consistent with Q2 and full year 2012 – Included $3M recovery on charged-down NPL that was refinanced away – Consumer NCOs increased due to expected credit card losses and seasoning of indirect auto portfolio • Provision of $12.5 million in excess of NCOs to support originated loan growth – $1.1 billion in organic loan growth – Coverage ratio of originated allowance consistent with prior quarters – Reserve build reduced EPS by ~$0.02 in Q3 • Originated NPLs improve by $9.8 million, or 6% QOQ – NPL ratio improves 13 bps QOQ to 0.89% • Criticized loans equaled 3.8% of total originated loans in 3Q13, down from 4.1% QOQ • Classified loans decreased from 2.7% of total originated loans in 2Q13 to 2.4% in 3Q13 11 $ in millions 3Q12 2Q13 3Q13 Provision for loan losses $21.4 $23.9 $25.4 Net Charge-offs $9.1 $12.2 $12.9 NCOs/ Average Loans 0.30% 0.33% 0.33% Nonperforming Originated Loans $114.2 $154.6 $144.8 NPLs / Loans – Originated 0.93% 1.02% 0.89% Total Originated Loans $12,233 $15,102 $16,212 Allowance – Originated $147.2 $182.5 $195.0 Allowance / Loans – Originated 1.20% 1.21% 1.20% Criticized1 $525.8 $614.6 $622.3 Criticized as a % of Total Originated Loans 4.3% 4.1% 3.8% Classified2 $349.0 $405.6 $385.3 Classified as a % of Total Originated Loans 2.9% 2.7% 2.4% Note: Originated loans represent loans excluding acquired loans (i.e., loans originated under First Niagara ownership) 1. Loans classified as special mention, substandard or doubtful. 2. Loans classified as substandard or doubtful.
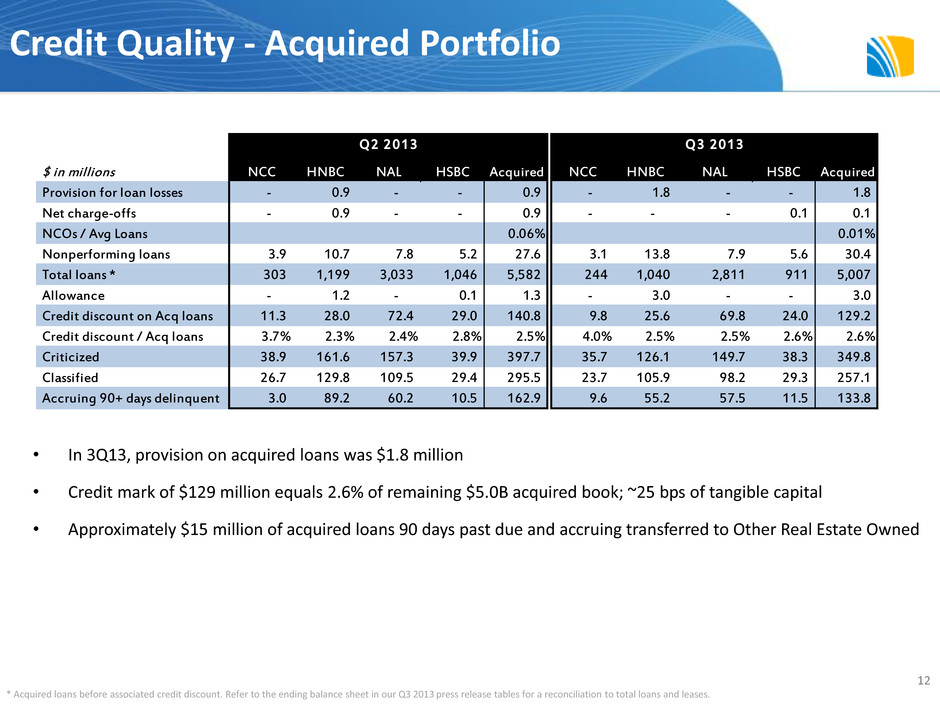
Credit Quality - Acquired Portfolio • In 3Q13, provision on acquired loans was $1.8 million • Credit mark of $129 million equals 2.6% of remaining $5.0B acquired book; ~25 bps of tangible capital • Approximately $15 million of acquired loans 90 days past due and accruing transferred to Other Real Estate Owned 12 * Acquired loans before associated credit discount. Refer to the ending balance sheet in our Q3 2013 press release tables for a reconciliation to total loans and leases. $ in millions NCC HNBC NAL HSBC Acquired NCC HNBC NAL HSBC Acquired Provision for loan losses - 0.9 - - 0.9 - 1.8 - - 1.8 Net charge-offs - 0.9 - - 0.9 - - - 0.1 0.1 NCOs / Avg Loans 0.06% 0.01% Nonperforming loans 3.9 10.7 7.8 5.2 27.6 3.1 13.8 7.9 5.6 30.4 Total loans * 303 1,199 3,033 1,046 5,582 244 1,040 2,811 911 5,007 Allowance - 1.2 - 0.1 1.3 - 3.0 - - 3.0 Credit discount on Acq loans 11.3 28.0 72.4 29.0 140.8 9.8 25.6 69.8 24.0 129.2 Credit discount / Acq loans 3.7% 2.3% 2.4% 2.8% 2.5% 4.0% 2.5% 2.5% 2.6% 2.6% Criticized 38.9 161.6 157.3 39.9 397.7 35.7 126.1 149.7 38.3 349.8 Classified 26.7 129.8 109.5 29.4 295.5 23.7 105.9 98.2 29.3 257.1 Accruing 90+ days delinquent 3.0 89.2 60.2 10.5 162.9 9.6 55.2 57.5 11.5 133.8 Q2 2013 Q3 2013
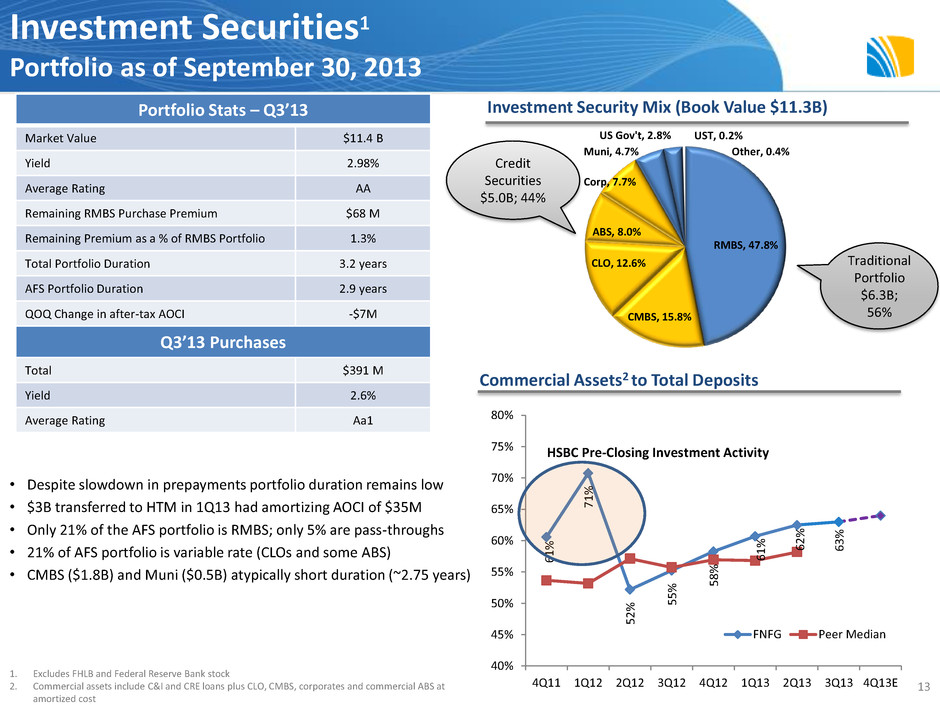
RMBS, 47.8% CMBS, 15.8% CLO, 12.6% ABS, 8.0% Muni, 4.7% Corp, 7.7% US Gov't, 2.8% Other, 0.4% UST, 0.2% 6 1 % 7 1 % 5 2 % 5 5 % 5 8 % 6 1 % 6 2 % 6 3 % 40% 45% 50% 55% 60% 65% 70% 75% 80% 4Q11 1Q12 2Q12 3Q12 4Q12 1Q13 2Q13 3Q13 4Q13E FNFG Peer Median • Despite slowdown in prepayments portfolio duration remains low • $3B transferred to HTM in 1Q13 had amortizing AOCI of $35M • Only 21% of the AFS portfolio is RMBS; only 5% are pass-throughs • 21% of AFS portfolio is variable rate (CLOs and some ABS) • CMBS ($1.8B) and Muni ($0.5B) atypically short duration (~2.75 years) Investment Securities1 Portfolio as of September 30, 2013 13 Portfolio Stats – Q3’13 Market Value $11.4 B Yield 2.98% Average Rating AA Remaining RMBS Purchase Premium $68 M Remaining Premium as a % of RMBS Portfolio 1.3% Total Portfolio Duration 3.2 years AFS Portfolio Duration 2.9 years QOQ Change in after-tax AOCI -$7M Q3’13 Purchases Total $391 M Yield 2.6% Average Rating Aa1 1. Excludes FHLB and Federal Reserve Bank stock 2. Commercial assets include C&I and CRE loans plus CLO, CMBS, corporates and commercial ABS at amortized cost HSBC Pre-Closing Investment Activity Investment Security Mix (Book Value $11.3B) Commercial Assets2 to Total Deposits Credit Securities $5.0B; 44% Traditional Portfolio $6.3B; 56%
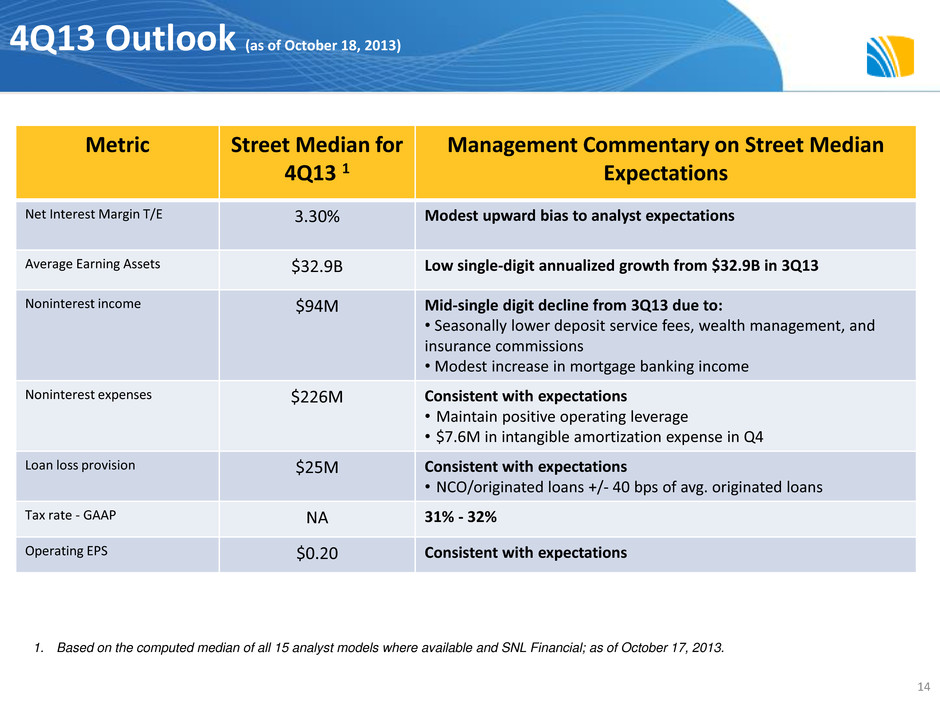
4Q13 Outlook (as of October 18, 2013) Metric Street Median for 4Q13 1 Management Commentary on Street Median Expectations Net Interest Margin T/E 3.30% Modest upward bias to analyst expectations Average Earning Assets $32.9B Low single-digit annualized growth from $32.9B in 3Q13 Noninterest income $94M Mid-single digit decline from 3Q13 due to: • Seasonally lower deposit service fees, wealth management, and insurance commissions • Modest increase in mortgage banking income Noninterest expenses $226M Consistent with expectations • Maintain positive operating leverage • $7.6M in intangible amortization expense in Q4 Loan loss provision $25M Consistent with expectations • NCO/originated loans +/- 40 bps of avg. originated loans Tax rate - GAAP NA 31% - 32% Operating EPS $0.20 Consistent with expectations 1. Based on the computed median of all 15 analyst models where available and SNL Financial; as of October 17, 2013. 14
Appendix Non-GAAP Measures – This presentation contains financial information determined by methods other than in accordance with accounting principles generally accepted in the United States of America (GAAP). The Company believes that these non-GAAP financial measures provide a meaningful comparison of the underlying operational performance of the Company, and facilitate investors’ assessments of business and performance trends in comparison to others in the financial services industry. In addition, the Company believes the exclusion of these non- operating items enables management to perform a more effective evaluation and comparison of the Company’s results and to assess performance in relation to the Company’s ongoing operations. These disclosures should not be viewed as a substitute for financial measures determined in accordance with GAAP, nor are they necessarily comparable to non-GAAP performance measures that may be presented by other companies. Where non-GAAP disclosures are used in this presentation, the comparable GAAP financial measure, as well as the reconciliation to the comparable GAAP financial member, can be found in this Appendix. 15
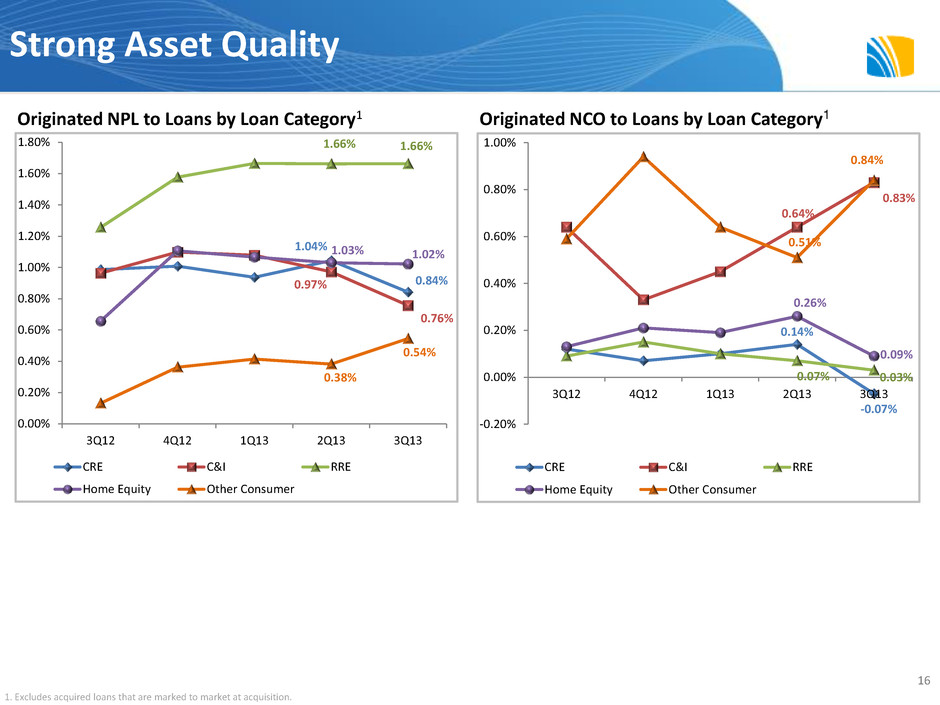
16 Originated NPL to Loans by Loan Category1 Originated NCO to Loans by Loan Category1 1. Excludes acquired loans that are marked to market at acquisition. Strong Asset Quality 0.14% -0.07% 0.64% 0.83% 0.07% 0.03% 0.26% 0.09% 0.51% 0.84% -0.20% 0.00% 0.20% 0.40% 0.60% 0.80% 1.00% 3Q12 4Q12 1Q13 2Q13 3Q13 CRE C&I RRE Home Equity Other Consumer 1.04% 0.84% 0.97% 0.76% 1.66% 1.66% 1.03% 1.02% 0.38% 0.54% 0.00% 0.20% 0.40% 0.60% 0.80% 1.00% 1.20% 1.40% 1.60% 1.80% 3Q12 4Q12 1Q13 2Q13 3Q13 CRE C&I RRE Home Equity Other Consumer

17 Commercial Loan Count1 Originated Criticized & Classified Loans to Loans2 1. Multiple loans to one borrower have not been aggregated for purposes of this chart 2. Excludes acquired loans that are marked to market at acquisition. Strong Asset Quality Moving Up Market with Discipline 4.30% 4.19% 4.38% 4.07% 3.84% 2.85% 2.81% 2.88% 2.69% 2.38% 0.00% 0.50% 1.00% 1.50% 2.00% 2.50% 3.00% 3.50% 4.00% 4.50% 5.00% 3Q12 4Q12 1Q13 2Q13 3Q13 Criticized Classified 1,195 185 50 8 1,623 252 101 17 1,841 315 150 25 1962 333 162 32 - 500 1,000 1,500 2,000 $1M to $5M $5M to $10M $10M to $20M >$20M 4Q10 4Q11 4Q12 3Q13
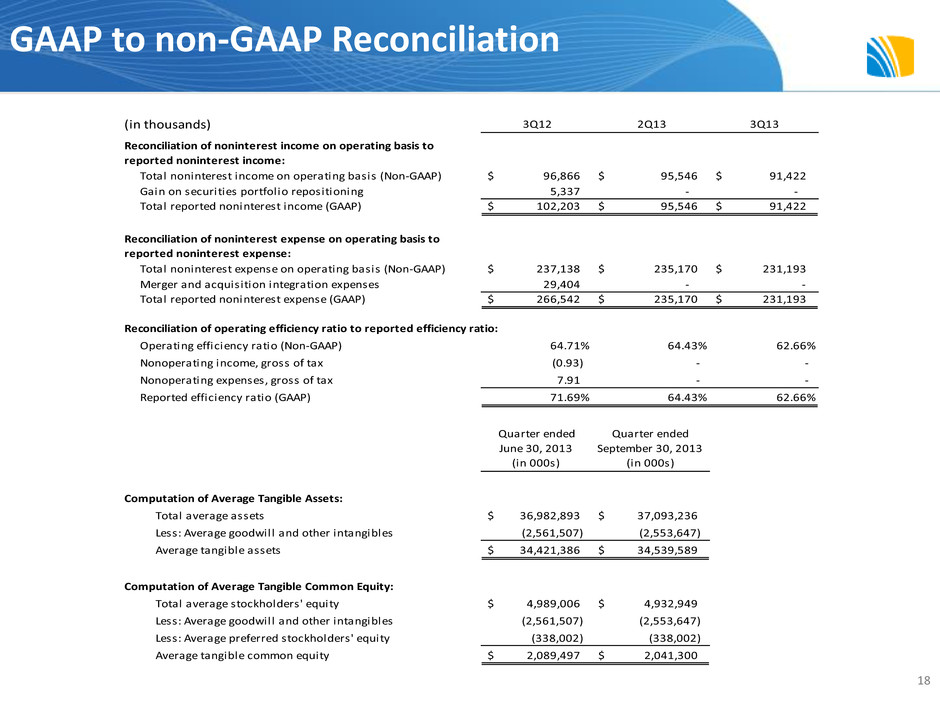
GAAP to non-GAAP Reconciliation 18 (in thousands) 3Q12 2Q13 3Q13 Total noninterest income on operating basis (Non-GAAP) 96,866$ 95,546$ 91,422$ Gain on securities portfolio repositioning 5,337 - - Total reported noninterest income (GAAP) 102,203$ 95,546$ 91,422$ Total noninterest expense on operating basis (Non-GAAP) 237,138$ 235,170$ 231,193$ Merger and acquisition integration expenses 29,404 - - Total reported noninterest expense (GAAP) 266,542$ 235,170$ 231,193$ Reconciliation of operating efficiency ratio to reported efficiency ratio: Operating efficiency ratio (Non-GAAP) 64.71% 64.43% 62.66% Nonoperating income, gross of tax (0.93) - - Nonoperating expenses, gross of tax 7.91 - - Reported efficiency ratio (GAAP) 71.69% 64.43% 62.66% Quarter ended Quarter ended June 30, 2013 (in 000s) September 30, 2013 (in 000s) Computation of Average Tangible Assets: Total average assets 36,982,893$ 37,093,236$ Less: Average goodwill and other intangibles (2,561,507) (2,553,647) Average tangible assets 34,421,386$ 34,539,589$ Computation of Average Tangible Common Equity: Total average stockholders' equity 4,989,006$ 4,932,949$ Less: Average goodwill and other intangibles (2,561,507) (2,553,647) Less: Average preferred stockholders' equity (338,002) (338,002) Average tangible common equity 2,089,497$ 2,041,300$ Reconciliation of noninterest income on operating basis to reported noninterest income: Reconciliation of noninterest expense on operating basis to reported noninterest expense:
