Attached files
| file | filename |
|---|---|
| 8-K - CHIMERA INVESTMENT CORPORATION 8-K - CHIMERA INVESTMENT CORP | a50730430.htm |
Exhibit 99.1
Chimera Investment Corporation Financial Update October 2013 WWW.CHIMERAREIT.COM
Information is unaudited, estimated and subject to change. Disclaimer This material is not intended to be exhaustive, is preliminary in nature and may be subject to change. In addition, much of the information contained herein is based on various assumptions (some of which are beyond the control of Chimera Investment Corporation, the “Company”) and may be identified by reference to a future period or periods or by the use of forward-looking terminology, such as “believe,” “expect,” “anticipate,” “estimate,” “plan,” “continue,” “intend,” “should,” “may,” “would,” “projected,” “will” or similar expressions, or variations on those terms or the negative of those terms. The Company’s forward-looking statements are subject to numerous risks, uncertainties and other factors, including the impact of the transition to a new independent registered public accounting firm and the Company’s ability to timely complete the process necessary to file its quarterly and annual reports for the quarters and year subsequent to March 31, 2012. Furthermore, none of the financial information contained in this material has been audited or approved by the Company’s independent registered public accounting firm.
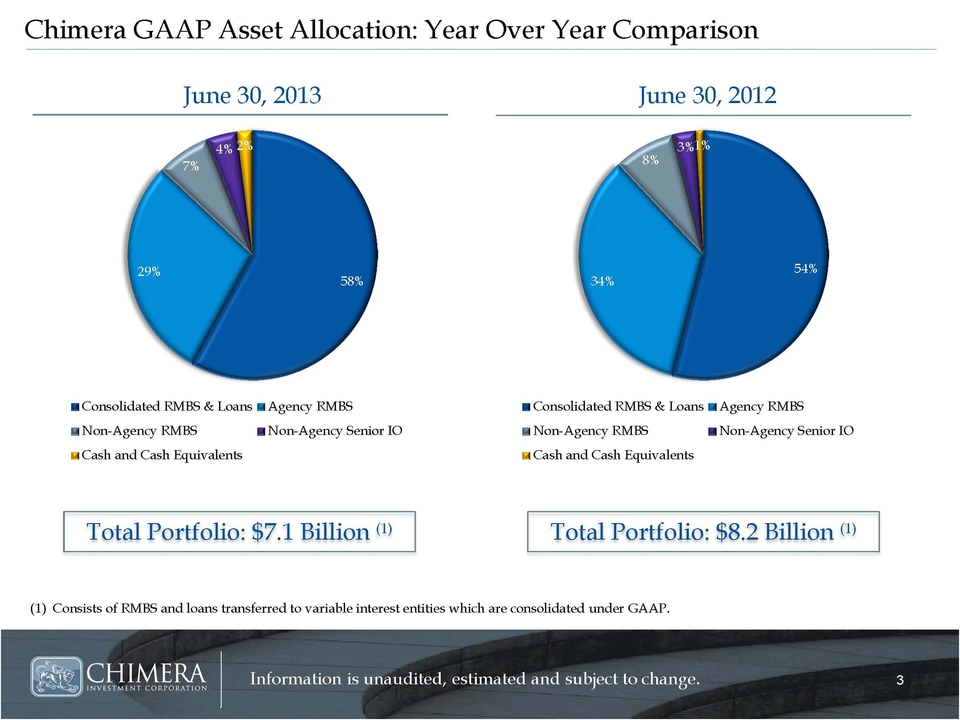
Information is unaudited, estimated and subject to change. Chimera GAAP Asset Allocation: Year Over Year Comparison (1) Consists of RMBS and loans transferred to variable interest entities which are consolidated under GAAP. June 30, 2013 June 30, 2012 Total Portfolio: $7.1 Billion (1) Total Portfolio: $8.2 Billion (1) 58% 29% 7% 4% 2% Consolidated RMBS & Loans Agency RMBS Non-Agency RMBS Non-Agency Senior IO Cash and Cash Equivalents 54% 34% 8% 3% 1% Consolidated RMBS & Loans Agency RMBS Non-Agency RMBS Non-Agency Senior IO Cash and Cash Equivalents
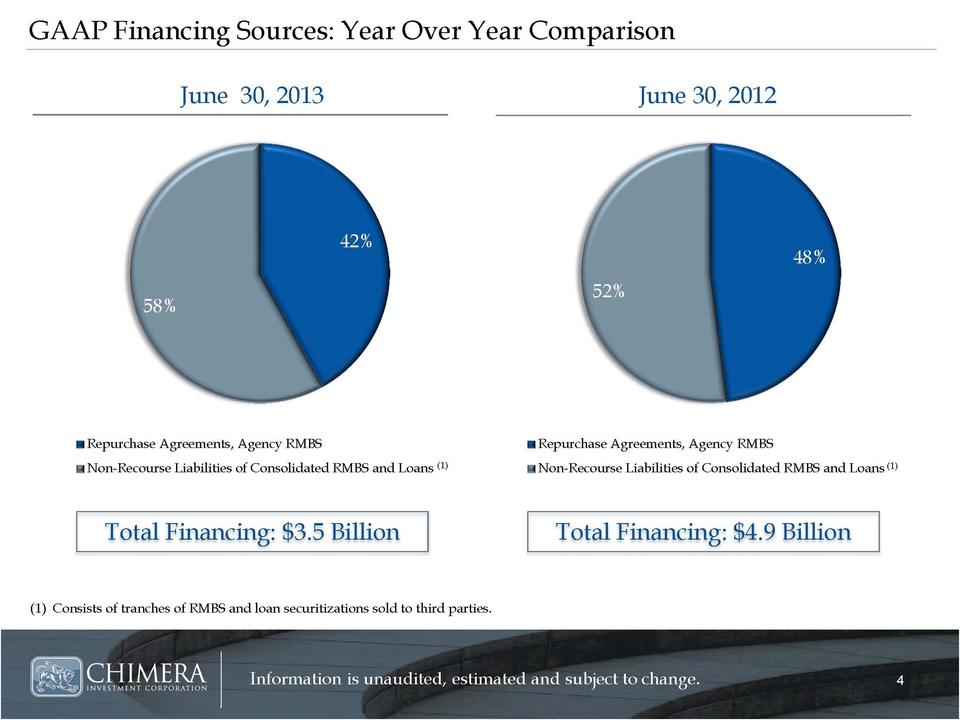
Information is unaudited, estimated and subject to change. GAAP Financing Sources: Year Over Year Comparison (1) Consists of tranches of RMBS and loan securitizations sold to third parties. June 30, 2013 June 30, 2012 Total Financing: $3.5 Billion Total Financing: $4.9 Billion 42% 58% Repurchase Agreements, Agency RMBS Non-Recourse Liabilities of Consolidated RMBS and Loans 48% 52% Repurchase Agreements, Agency RMBS Non-Recourse Liabilities of Consolidated RMBS and Loans (1) (1)
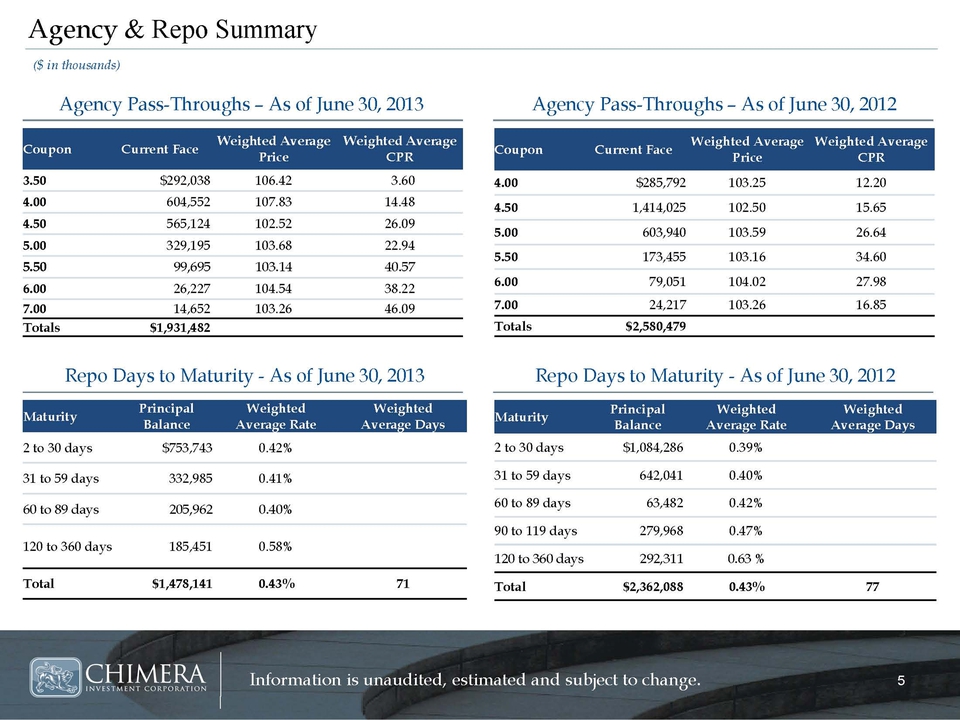
Information is unaudited, estimated and subject to change. Maturity Principal Balance Weighted Average Rate Weighted Average Days 2 to 30 days $753,743 0.42% 31 to 59 days 332,985 0.41% 60 to 89 days 205,962 0.40% 120 to 360 days 185,451 0.58% Total $1,478,141 0.43% 71 Coupon Current Face Weighted Average Price Weighted Average CPR 4.00 $285,792 103.25 12.20 4.50 1,414,025 102.50 15.65 5.00 603,940 103.59 26.64 5.50 173,455 103.16 34.60 6.00 79,051 104.02 27.98 7.00 24,217 103.26 16.85 Totals $2,580,479
Coupon Current Face Weighted Average Price Weighted Average
CPR 3.50 $292,038 106.42 3.60 4.00 604,552 107.83 14.48 4.50 565,124 102.52 26.09 5.00 329,195 103.68 22.94 5.50 99,695 103.14 40.57 6.00 26,227 104.54 38.22 7.00 14,652 103.26 46.09
Totals $1,931,482 Agency & Repo Summary Agency Pass-Throughs – As of June 30, 2013 Repo Days to Maturity - As of June 30, 2013 Agency Pass-Throughs – As of June 30, 2012 Repo Days to Maturity - As of June 30, 2012 Maturity Principal Balance Weighted Average Rate Weighted Average Days 2 to 30 days $1,084,286 0.39% 31 to 59 days 642,041 0.40% 60 to 89 days 63,482 0.42% 90 to 119 days 279,968 0.47% 120 to 360 days 292,311 0.63 % Total $2,362,088 0.43% 77 ($ in thousands)
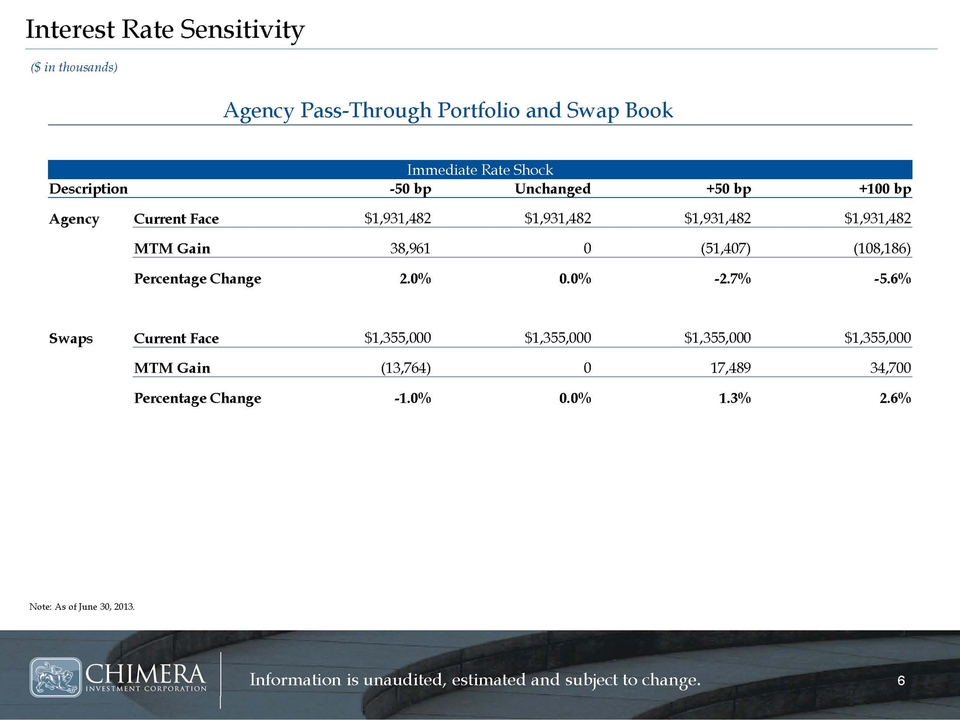
Information is unaudited, estimated and subject to change. Interest Rate Sensitivity Agency Pass-Through Portfolio and Swap Book Immediate Rate Shock Description -50 bp Unchanged +50 bp +100 bp Agency Current Face $1,931,482 $1,931,482 $1,931,482 $1,931,482 MTM Gain 38,961 0 (51,407) (108,186) Percentage Change 2.0% 0.0% -2.7% -5.6% Swaps Current Face $1,355,000 $1,355,000 $1,355,000 $1,355,000 MTM Gain (13,764) 0 17,489 34,700 Percentage Change -1.0% 0.0% 1.3% 2.6% Note: As of June 30, 2013. ($ in thousands)
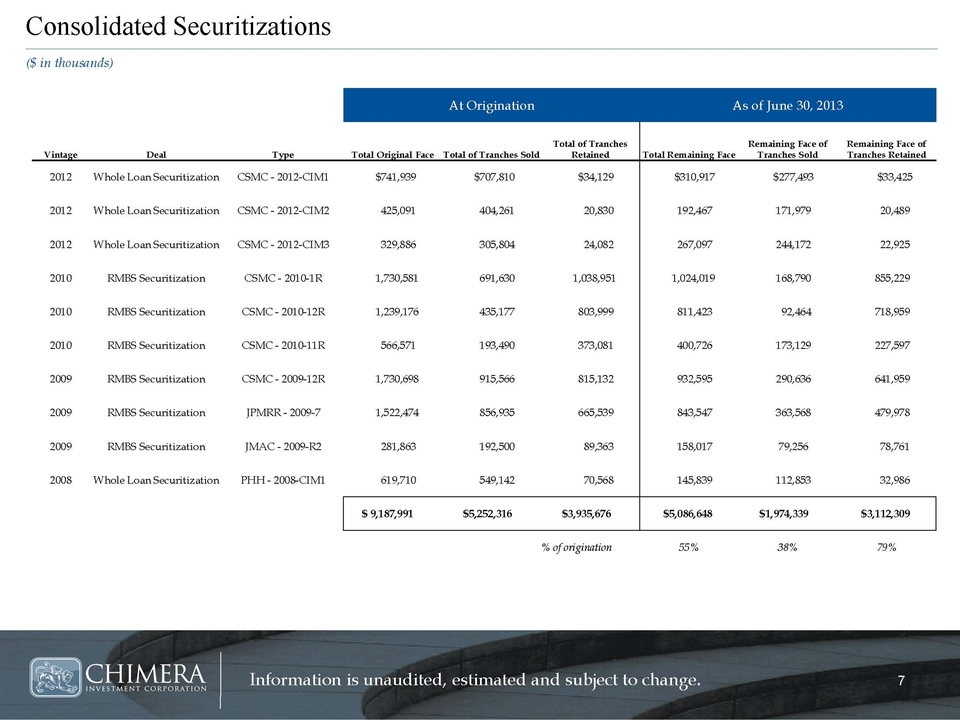
Information is unaudited, estimated and subject to change. Consolidated Securitizations ($ in thousands) At Origination As of June 30, 2013 Vintage Deal Type Total Original Face Total of Tranches Sold Total of Tranches Retained Total Remaining Face Remaining Face of Tranches Sold Remaining Face of Tranches Retained 2012 Whole Loan Securitization CSMC - 2012-CIM1 $741,939 $707,810 $34,129 $310,917 $277,493 $33,425 2012 Whole Loan Securitization CSMC - 2012-CIM2 425,091 404,261 20,830 192,467 171,979 20,489 2012 Whole Loan Securitization CSMC - 2012-CIM3 329,886 305,804 24,082 267,097 244,172 22,925 2010 RMBS Securitization CSMC - 2010-1R 1,730,581 691,630 1,038,951 1,024,019 168,790 855,229 2010 RMBS Securitization CSMC - 2010-12R 1,239,176 435,177 803,999 811,423 92,464 718,959 2010 RMBS Securitization CSMC - 2010-11R 566,571 193,490 373,081 400,726 173,129 227,597 2009 RMBS Securitization CSMC - 2009-12R 1,730,698 915,566 815,132 932,595 290,636 641,959 2009 RMBS Securitization JPMRR - 2009-7 1,522,474 856,935 665,539 843,547 363,568 479,978 2009 RMBS Securitization JMAC - 2009-R2 281,863 192,500 89,363 158,017 79,256 78,761 2008 Whole Loan Securitization PHH - 2008-CIM1 619,710 549,142 70,568 145,839 112,853 32,986 $ 9,187,991 $5,252,316 $3,935,676 $5,086,648 $1,974,339 $3,112,309 % of origination 55% 38% 79%
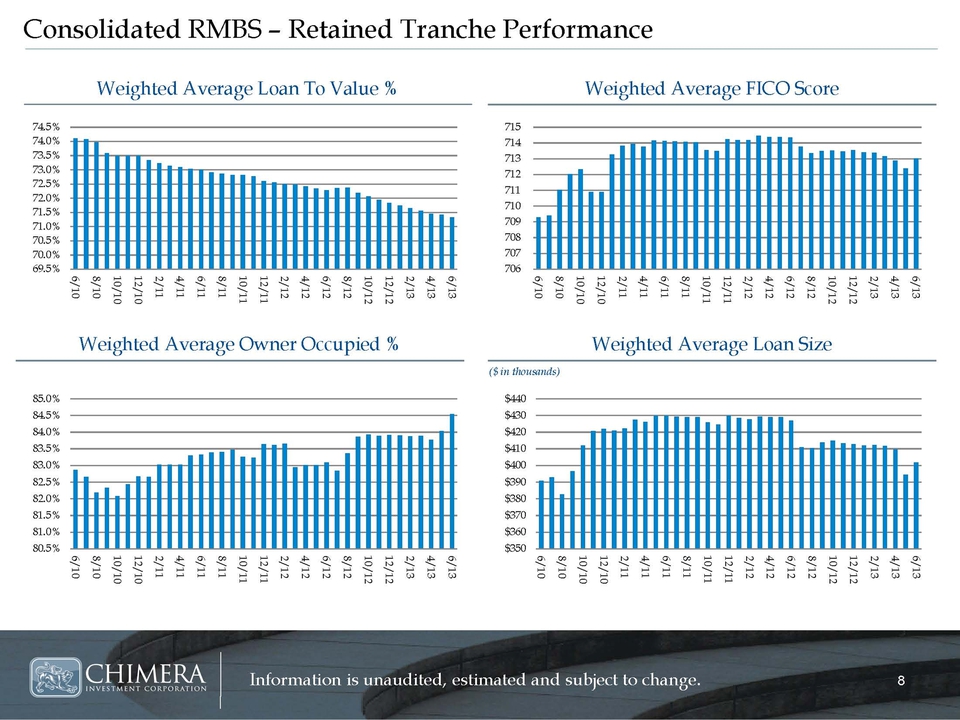
Information is unaudited, estimated and subject to change. Consolidated RMBS – Retained Tranche Performance 69.5% 70.0% 70.5% 71.0% 71.5% 72.0% 72.5% 73.0% 73.5% 74.0% 74.5% 6/10 8/10 10/10 12/10 2/11 4/11 6/11 8/11 10/11 12/11
2/12 4/12 6/12 8/12 10/12 12/12 2/13 4/13 6/13 706 707 708 709 710 711 712 713 714 715 6/10 8/10 10/10 12/10 2/11 4/11 6/11 8/11 10/11 12/11 2/12 4/12 6/12 8/12
10/12 12/12 2/13 4/13 6/13 80.5% 81.0% 81.5% 82.0% 82.5% 83.0% 83.5% 84.0% 84.5% 85.0% 6/10 8/10 10/10 12/10 2/11 4/11 6/11 8/11 10/11 12/11 2/12 4/12 6/12 8/12
10/12 12/12 2/13 4/13 6/13 $350 $360 $370 $380 $390 $400 $410 $420 $430 $440 6/10 8/10 10/10 12/10 2/11 4/11 6/11 8/11 10/11 12/11 2/12 4/12 6/12 8/12 10/12 12/12 2/13 4/13 6/13
Weighted Average Loan To Value % Weighted Average FICO Score Weighted Average Loan Size Weighted Average Owner Occupied % ($ in thousands)

Information is unaudited, estimated and subject to change. Consolidated RMBS – Retained Tranches Performance 0% 5% 10% 15% 20% 25% 30% 35% 40% 6/10 8/10 10/10 12/10 2/11 4/11 6/11 8/11 10/11 12/11 2/12 4/12 6/12 8/12 10/12 12/12 2/13 4/13 6/13 WA 60+ Delinq WA 90+ Delinq 0% 2% 4% 6% 8% 10% 12% 14% 16% 18% 6/10 8/10 10/10 12/10 2/11 4/11 6/11 8/11 10/11 12/11 2/12 4/12 6/12 8/12 10/12 12/12 2/13 4/13 6/13 WA 3M CPR WA 3M VPR Purchase VPR 0% 10% 20% 30% 40% 50% 60% 70% 80% 90% 6/10 8/10 10/10 12/10 2/11 4/11 6/11 8/11 10/11 12/11 2/12 4/12 6/12 8/12 10/12 12/12 2/13 4/13 6/13 WA 12M Sev Purchase Sev Weighted Average Delinquency Pipeline Weighted Average 12M Severity vs. Severity at Purchase Weighted Average Voluntary Prepayment Rate (VPR) vs. VPR at Purchase
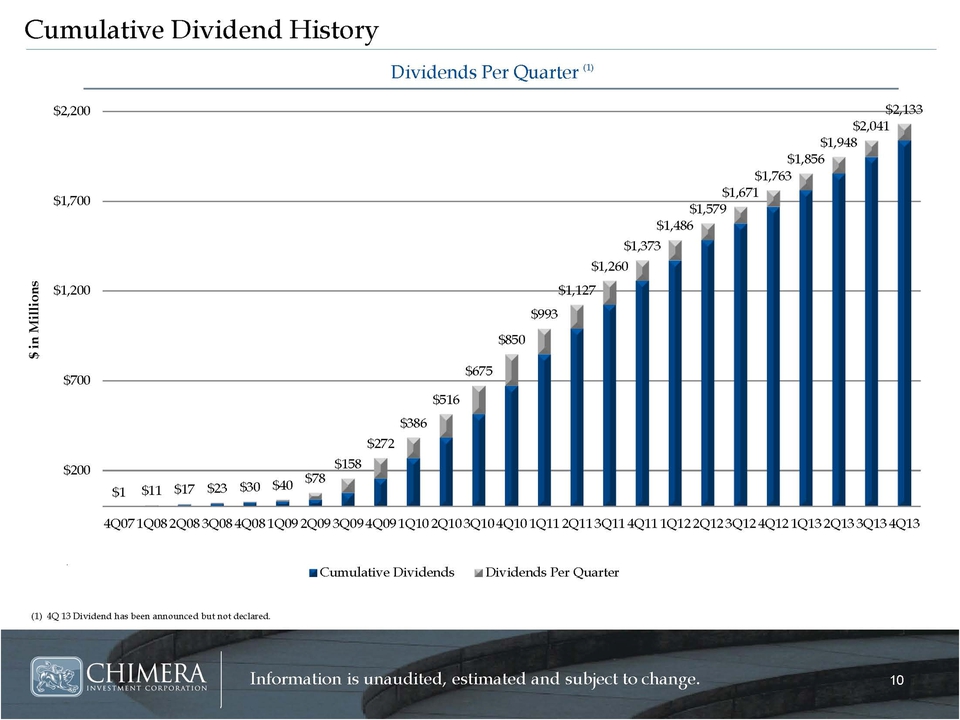
Information is unaudited, estimated and subject to change. Cumulative Dividend History (1) 4Q 13 Dividend has been announced but not declared. Dividends Per Quarter (1) $1 $11 $17 $23 $30 $40 $78 $158 $272 $386 $516 $675 $850 $993 $1,127 $1,260 $1,373 $1,486 $1,579 $1,671 $1,763 $1,856 $1,948 $2,041 $2,133 -$300 $200 $700 $1,200 $1,700 $2,200 4Q07 1Q08 2Q08 3Q08 4Q08 1Q09 2Q09 3Q09 4Q09 1Q10 2Q10 3Q10 4Q10 1Q11 2Q11 3Q11 4Q11 1Q12 2Q12 3Q12 4Q12 1Q13 2Q13 3Q13 4Q13 $ in Millions Cumulative Dividends Dividends Per Quarter