Attached files
| file | filename |
|---|---|
| EX-99.1 - EX-99.1 - Howmet Aerospace Inc. | d609058dex991.htm |
| 8-K - FORM 8-K - Howmet Aerospace Inc. | d609058d8k.htm |
 3rd Quarter Earnings Conference
1
October 8, 2013
[Alcoa logo]
[Alcoa logo]
Exhibit 99.2 |
 o[Alcoa logo]
Cautionary Statement
o[Alcoa
logo] Forward-Looking Statements
This
presentation
contains
statements
that
relate
to
future
events
and
expectations
and
as
such
constitute
forward-looking
statements.
Forward-looking
statements
include
those
containing
such
words
as
“anticipates,”
“estimates,”
“expects,”
“forecasts,”
“intends,”
“outlook,”
“plans,”
“projects,”
“should,”
“targets,”
“will,”
or
other
words
of
similar
meaning.
All
statements
that
reflect
Alcoa’s
expectations,
assumptions,
or
projections
about
the
future
other
than
statements
of
historical
fact
are
forward-looking
statements,
including,
without
limitation,
forecasts
concerning
global
demand
growth
for
aluminum,
end-market
conditions,
supply/demand
balances,
and
growth
opportunities
for
aluminum
in
automotive,
aerospace
and
other
applications,
trend
projections,
targeted
financial
results
or
operating
performance,
and
statements
about
Alcoa’s
strategies,
outlook,
and
business
and
financial
prospects.
Forward-looking
statements
are
subject
to
a
number
of
known
and
unknown
risks,
uncertainties,
and
other
factors
and
are
not
guarantees
of
future
performance.
Important
factors
that
could
cause
actual
results
to
differ
materially
from
those
in
the
forward-looking
statements
include:
(a)
material
adverse
changes
in
aluminum
industry
conditions,
including
global
supply
and
demand
conditions
and
fluctuations
in
London
Metal
Exchange-based
prices
and
premiums,
as
applicable
for
primary
aluminum,
alumina,
and
other
products,
and
fluctuations
in
indexed-based
and
spot
prices
for
alumina;
(b)
deterioration
in
global
economic
and
financial
market
conditions
generally;
(c)
unfavorable
changes
in
the
markets
served
by
Alcoa,
including
automotive
and
commercial
transportation,
aerospace,
building
and
construction,
distribution,
packaging,
defense,
and
industrial
gas
turbine;
(d)
the
impact
of
changes
in
foreign
currency
exchange
rates
on
costs
and
results,
particularly
the
Australian
dollar,
Brazilian
real,
Canadian
dollar,
euro,
and
Norwegian
kroner;
(e)
increases
in
energy
costs,
including
electricity,
natural
gas,
and
fuel
oil,
or
the
unavailability
or
interruption
of
energy
supplies;
(f)
increases
in
the
costs
of
other
raw
materials,
including
calcined
petroleum
coke,
caustic
soda,
and
liquid
pitch;
(g)
Alcoa’s
inability
to
achieve
the
level
of
revenue
growth,
cash
generation,
cost
savings,
improvement
in
profitability
and
margins,
fiscal
discipline,
or
strengthening
of
competitiveness
and
operations
(including
moving
its
alumina
refining
and
aluminum
smelting
businesses
down
on
the
industry
cost
curves
and
increasing
revenues
in
its
Global
Rolled
Products
and
Engineered
Products
and
Solutions
segments)
anticipated
from
its
restructuring
programs
and
productivity
improvement,
cash
sustainability,
and
other
initiatives;
(h)
Alcoa's
inability
to
realize
expected
benefits,
in
each
case
as
planned
and
by
targeted
completion
dates,
from
sales
of
non-core
assets,
or
from
newly
constructed,
expanded,
or
acquired
facilities,
including
facilities
supplying
aluminum-lithium
capacity,
or
from
international
joint
ventures,
including
the
joint
venture
in
Saudi
Arabia;
(i)
political,
economic,
and
regulatory
risks
in
the
countries
in
which
Alcoa
operates
or
sells
products,
including
unfavorable
changes
in
laws
and
governmental
policies,
civil
unrest,
or
other
events
beyond
Alcoa’s
control;
(j)
the
outcome
of
contingencies,
including
legal
proceedings,
government
investigations,
and
environmental
remediation;
(k)
the
business
or
financial
condition
of
key
customers,
suppliers,
and
business
partners;
(l)
adverse
changes
in
tax
rates
or
benefits;
(m)
adverse
changes
in
discount
rates
or
investment
returns
on
pension
assets;
(n)
the
impact
of
cyber
attacks
and
potential
information
technology
or
data
security
breaches;
and
(o)
the
other
risk
factors
summarized
in
Alcoa's
Form
10-K
for
the
year
ended
December
31,
2012
and
other
reports
filed
with
the
Securities
and
Exchange
Commission.
Alcoa
disclaims
any
obligation
to
update
publicly
any
forward-looking
statements,
whether
in
response
to
new
information,
future
events
or
otherwise,
except
as
required
by
applicable
law.
Non-GAAP Financial Measures
Some
of
the
information
included
in
this
presentation
is
derived
from
Alcoa’s
consolidated
financial
information
but
is
not
presented
in
Alcoa’s
financial
statements
prepared
in
accordance
with
U.S.
generally
accepted
accounting
principles
(GAAP).
Certain
of
these
data
are
considered
“non-GAAP
financial
measures”
under
SEC
rules.
These
non-GAAP
financial
measures
supplement
our
GAAP
disclosures
and
should
not
be
considered
an
alternative
to
the
GAAP
measure.
Reconciliations
to
the
most
directly
comparable
GAAP
financial
measures
and
management’s
rationale
for
the
use
of
the
non-GAAP
financial
measures
can
be
found
in
the
Appendix
to
this
presentation
and
on
our
website
at
www.alcoa.com
under
the
“Invest”
section.
Any
reference
during
the
discussion
today
to
EBITDA
means
adjusted
EBITDA,
for
which
we
have
provided
calculations
and
reconciliations
in
the
Appendix
and
on
our
website. |
 o[Alcoa logo]
Strong Operational
Performance
in
3Q 2013
Increased
earnings
sequentially
and
YoY
–
Downstream:
Strong
Profitability
-
ATOI
up
22%
YoY
–
Upstream:
Improved
performance
8
consecutive
quarters
–
Productivity:
$825
million
across
all
segments
YoY
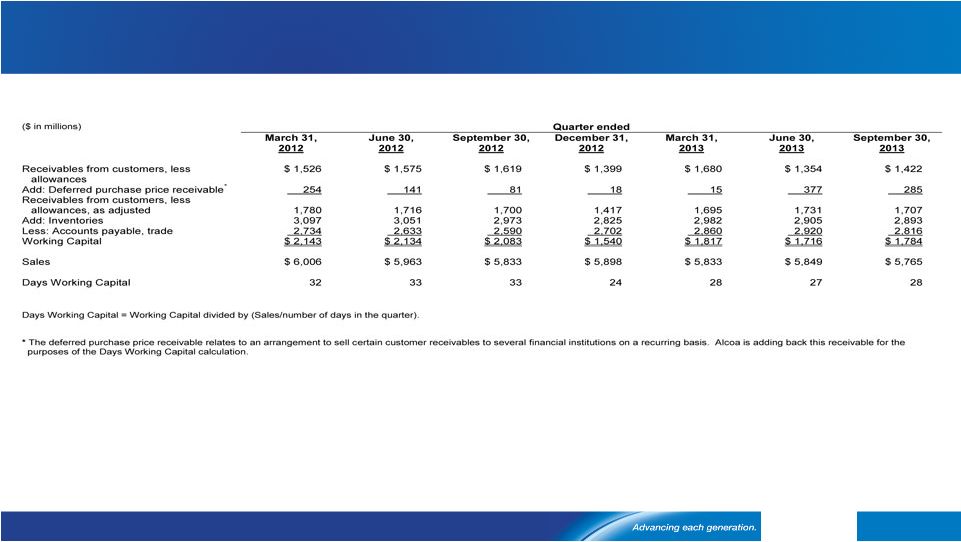
Days
Working
Capital:
Record
3Q
low;
5
days
lower
than
prior
year
[~$300
million
cash]
Cash
from
Operations:
$214
million;
Negative
free
cash
flow:
$36
million
Executed
curtailments
swiftly
and
safely
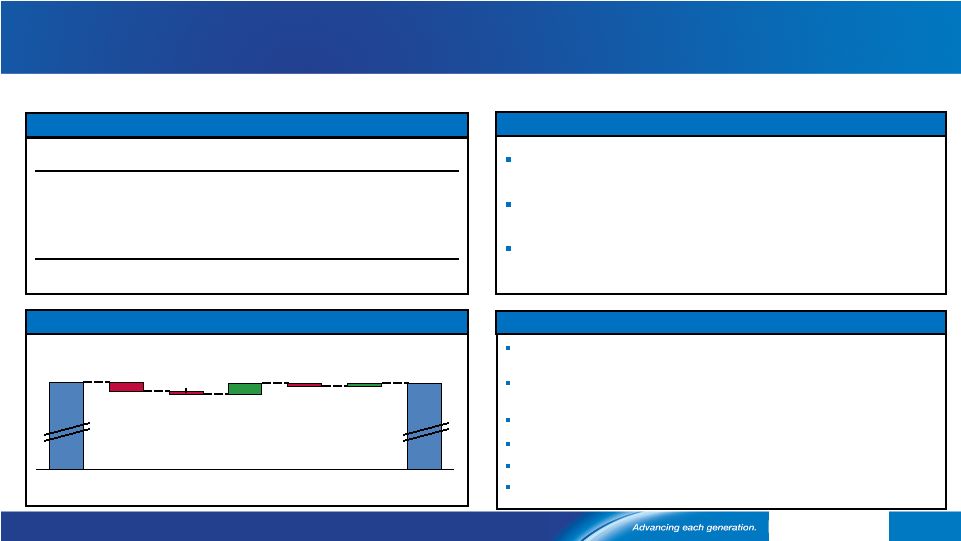
Strong third quarter driven by performance –
Repositioning working
3
3Q 2013 Overview |
 o[Alcoa logo]
[Alcoa logo]
William Oplinger
Executive Vice President and Chief Financial Officer
4
October 8, 2013
[Alcoa logo] |
 o[Alcoa logo]
Income Statement Summary
5
See appendix for Adjusted Income reconciliation
$ Millions, except aluminum prices and per-share amounts
3Q12
2Q13
3Q13
3
rd
Party
Realized Aluminum Price ($/MT)
$2,222
$2,237
$2,180
Revenue
$5,833
$5,849
$5,765
Cost of Goods Sold
$5,266
$4,933
$4,798
COGS % Revenue
90.3%
84.3%
83.2%
Selling,
General Administrative, Other
$234
$254
$248
SGA % Revenue
4.0%
4.3%
4.3%
Other (Income
) Expense, Net
($2)
$19
($7)
Restructuring and Other Charges
$2
$244
$151
Effective Tax Rate
15.9%
(16.5%)
41.3%
Net (Loss) Income
($143)
($119)
$24
Net (Loss) Income Per Diluted Share
($0.13)
($0.11)
$0.02
Income
per Diluted
Share excl
Special Items
$0.03
$0.07
$0.11
Prior Year
Change
Sequential
Change
($42)
($57)
($68)
($84)
($468)
($135)
(7.1 % pts.)
(1.1 % pts.)
$14
($6)
0.3 % pts.
0.0 % pts.
($5)
($26)
$149
($93)
25.4 % pts.
57.8 % pts.
$167
$143
$0.15
$0.13
$0.08
$0.04 |
 o[Alcoa logo]
Restructuring
and
Other
Special
Items
See
appendix
for
Adjusted
Income
reconciliation
6
$ Millions, except per-share amounts
2Q13
3Q13
Income Statement
Classification
Segment
Net (Loss) Income
($119)
$24
Net (Loss) Income Per Diluted Share
($0.11)
$0.02
Restructuring-Related
($113)
($109)
Restructuring
and COGS
Corporate /
Primary Metals
Government Investigation Reserve
($62)
-
Restructuring
Corporate
Discrete Tax Items
($11)
($7)
Income Taxes and
Noncontrolling
Interest
Corporate
Mark-to-Market Energy Contracts
($9)
$8
Other Expenses
(Income), Net
Corporate
Massena
Fire
-
$12
COGS
Primary Metals
/EPS /Corporate
Special Items
($195)
($96)
Net Income excl Special Items
$76
$120
Income
per Diluted
Share excl
Special Items
$0.07
$0.11 |
 o[Alcoa logo]
Strong
performance
drives
58%
sequential
earnings
improvement
7
See
appendix
for
Adjusted
Income
reconciliation
Net Income excluding Restructuring & Other Special Items ($ Millions)
Market
+$17
Performance
+$27
Cost Headwinds
$0
120
76
Currency
38
+58%
21
2Q 13
3Q 13
Cost
Decreases
/ Other
22
Raw
Materials
1
Energy
23
Productivity
41
Price
/ Mix
3
Volume
11
LME |
 o[Alcoa logo]
Earnings
rise
$88M
year-over-year
despite
LME
and
cost
headwinds
8
See
appendix
for
Adjusted
Income
reconciliation
Net Income excluding Restructuring & Other Special Items ($ Millions)
Market
+$0
Performance
+$206
Cost Headwinds
-$118
120
32
LME
62
3Q 12
+275%
108
Raw
Materials
9
Energy
19
Productivity
3Q 13
160
Price
/ Mix
11
Volume
35
Currency
62
Cost
Increases
/ Other |
 o[Alcoa logo]
9
Engineered
Products
&
Solutions
year-over-
year
ATOI
increase
of
22%
See
appendix
for
Adjusted
EBITDA
reconciliation.
*
Prior
period
amounts
have
been
revised
to
conform
to
the
current
period
presentation.
See
appendix
for
additional
information.
$ Millions
Revenue
up
5%
year-over-year
driven
by
strong
share
gains
across
all
markets
Quarterly
ATOI
up
22%
year-over-year
to
$192M
driven
by
productivity
and
volume
across
all
Businesses
Highest-ever Quarter
for adjusted
EBITDA
margin,
up
2.5
percentage
points
year
-over-year
Aerospace
remains strong, temporarily impacted by engine market
inventory realignment
and lower U.S. Defense spare parts demand
Gradual recovery in N.A. Non-Residential Construction continues;
European
market weakening
Softening Global
Industrial Gas Turbine market
Weaker N.A. Heavy Duty Truck build rates offset by Europe
Share
gains
through
innovation
continue
across
all
sectors
ATOI up ~25% year-over-year; down ~10% sequentially
$ Millions
3Q 12
2Q 13
3Q 13
3
rd
Party
Revenue
1,367
1,468
1,437
ATOI*
158
193
192
Adjusted
EBITDA
Margin*
20.0%
22.2%
22.5%
3
Quarter
Results
3
Quarter
Business
Highlights
4
Quarter
Outlook
3
Quarter
Performance
Bridge
2Q 13
$193
3Q 13
$192
Massena
$2
Cost Increase
-$2
Productivity
$7
Price / Mix
-$2
Volume
-$6
3Q13
Actual
and
4Q13
Outlook -
EPS
rd
rd
rd
th |
 o[Alcoa logo]
10
See
appendix
for
Adjusted
EBITDA
reconciliation.
*
Prior
period
amounts
have
been
revised
to
conform
to
the
current
period presentation. See appendix for additional information.
Volume and price headwinds impact Global Rolled Products
Auto demand
expected to remain strong
Aero plate shipments continue to be
impacted by high
OEM inventories
Seasonal Packaging
decline, price pressure continues
Price pressures in Europe and China
, along with
demand decline in Brazing
ATOI
expected to be down ~25%
excluding FX
and
assuming
no change in metal
price sequentially
Auto and Packaging
demand remained strong
Unfavorable volume/price impacts
from:
•
Aero plate seasonal declines/OEM inventories
•
Softening Industrial markets in N.A., Europe, Russia
•
Packaging price pressures (N.A., China)
Low metal prices
continued to negatively impact
results, albeit less than 2Q
Days working capital
improved 1 day year-over-year
3Q13 Actual and 4Q13 Outlook -
GRP
3
Quarter Business Highlights
4
Quarter Outlook
$ Millions
3Q 12
2Q 13
3Q 13
3
rd
Party Revenue
1,849
1,877
1,805
ATOI*
89
79
71
Adjusted EBITDA/MT*
365
322
312
$ Millions
3
Quarter Results
3
Quarter Performance Bridge
$2
$2
$12
$71
$79
Cost
Increase
2Q 13
Volume
Other
Metal
-$4
-$7
Currency
Prod-
uctivity
3Q 13
-$10
-$3
Price
/ Mix
rd
rd
rd
th |
 o[Alcoa logo]
Alumina delivers performance improvement
11
Production increase
due
to
additional
day
Higher
3
rd
party shipment volume
offsets
lower
Alumina
prices
Productivity improvements
continued
Cost
increases
driven
by
higher mining costs
in
Suriname and two crusher sites operating in Australia
Record 3Q days working capital of
20 days
;
11 day
improvement
year-over-year
53%
of 3
party shipments on
spot or alumina price
index with
30-day lag
for 2013
3
party shipment volume
to
return
to
normal
levels
Energy prices increase
in
Western
Australia
Productivity improvements
to
continue
$ Millions
3Q13
Actual
and
4Q13
Outlook
-
Alumina
Quarter Results
3
rd
Quarter Business Highlights
4
th
Quarter Outlook
Quarter Performance Bridge
3Q 12
2Q 13
3Q 13
Production (kmt)
4,077
4,161
4,214
3
rd
Party Shipments (kmt)
2,368
2,328
2,603
3
rd
Party Revenue ($ Millions)
764
822
846
ATOI ($ Millions)
(9)
64
67
$0
+$3
$13
$5
$5
$28
$67
$64
-$20
Cost
Increase
3Q 13
Prod-
uctivity
Price
/ Mix
Volume
Currency
LME
-$28
2Q 13
Market
Performance
3
rd
3
rd
rd
rd |
 o[Alcoa logo]
Primary Metals drives productivity gains to the bottom line
12
$ Millions
Market
Performance
-$8
+$42
3Q13
Actual
and
4Q13
Outlook
–
Primary
Metals
3
rd
Quarter Results
3
rd
Quarter Business Highlights
4
th
Quarter Outlook
Quarter Performance Bridge
3Q 13
$8
Anglesea/
US power
outages
$23
Cost
Decr/RM
$12
Energy
-$21
Prod-
uctivity
$24
Price
/Mix &
Vol.
$4
Currency
$8
LME
-$16
2Q 13
-$32
$6
Massena
Curtailments safely executed,
taking
274kmt
offline
Productivity improvements
continued;
result
of
aggressive
cost
cutting
initiatives
across
the
segment
Increased energy costs
due
to
peak consumer
demand
in
Europe
and
seasonal hydropower
increases
in
the
U.S.
Northwest
Record
3Q
days
working
capital of
20 days
;
2 day
improvement
year-over-year
Pricing
to
follow
15-day lag
to
LME
Curtailments
to
reduce
production
Productivity
improvements
to
continue
Massena
fire
insurance recovery
will
not
repeat
3Q 12
2Q 13
3Q 13
Production (kmt)
938
896
897
3
rd
Party Shipments (kmt)
768
693
686
3
rd
Party Revenue ($ Millions)
1,794
1,620
1,600
3
rd
Party Price ($/MT)
2,222
2,237
2,180
ATOI ($ Millions)
(14)
(32)
8
3
rd |
 o[Alcoa logo]
Record third quarter days working capital level
See appendix for days working capital reconciliation
13
5 days
lower
Days Working Capital since Fourth Quarter 2008
5 days
lower
5 days
lower
28
27
28
33
33
32
38
38
39
43
44
41
48
50
55
24
27
30
33
43
5 days
lower
20 days;
$1.3 Billion |
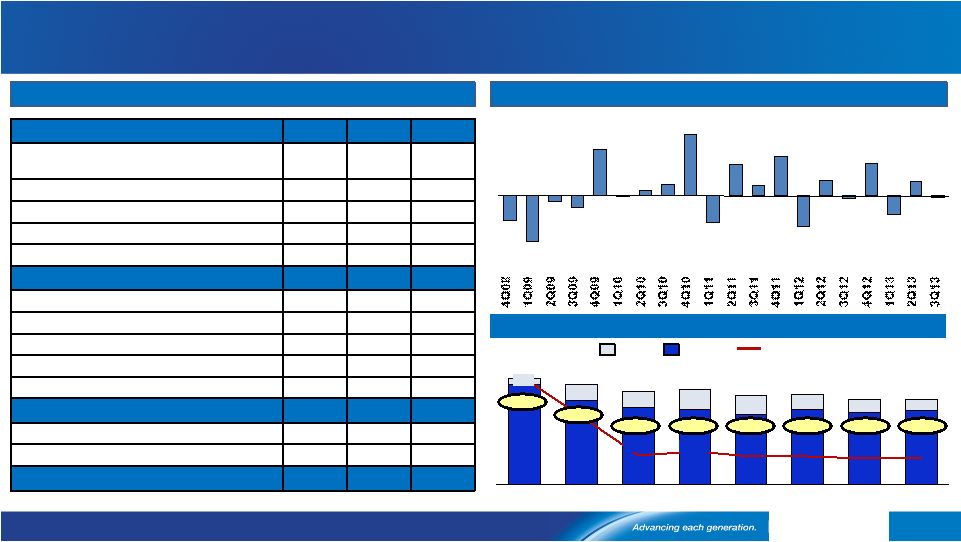 o[Alcoa logo]
3
Quarter Cash Flow overview
14
See appendix for Free Cash Flow and Net Debt reconciliations
($ Millions)
3Q12
2Q13
3Q13
Net (Loss) Income before Noncontrolling
Interests
($175)
($148)
$44
DD&A
$366
$363
$348
Change in Working Capital
$88
$72
($61)
Pension Contributions
($163)
($98)
($173)
Other Adjustments
$147
$325
$56
Cash from Operations
$263
$514
$214
Dividends to Shareholders
($32)
($33)
($33)
Change in Debt
($273)
($531)
($5)
Distributions to
Noncontrolling
Interests
($1)
($2)
($53)
Contributions from
Noncontrolling
Interests
$22
($3)
$0
Other Financing Activities
$2
$1
($2)
Cash from Financing Activities
($282)
($568)
($93)
Capital Expenditures
($302)
($286)
($250)
Other Investing Activities
$40
$10
($54)
Cash from Investing Activities
($262)
($276)
($304)
1,481
1,543
1,939
1,861
1,555
1,202
1,017
3Q13
8,344
7,327
2Q13
8,359
7,157
1Q13
8,925
7,370
2012
8,829
6,968
2011
9,371
7,432
2010
9,165
7,622
2009
9,819
8,338
2008
10,578
9,816
762
Debt to Cap
Net Debt
Cash
34.7%
42.5%
38.7%
34.9%
35.3%
34.8%
-to
-Cap stable
($ millions)
(36)
228
(305)
535
(39)
246
(506)
656
164
526
(440)
1,005
176
87
(22)
761
(186)
(90)
(742)
(409)
($ millions)
34.5%
34.5%
rd
Free
Cash
Flow
near
breakeven
target
in
3Q
Debt
3
rd
Quarter 2013 Cash Flow Overview |
 o[Alcoa logo]
On track to meet all of our targets
15
Key Actions to Execute 2013 Cash Sustainability Program and year-to-date
results Maintain 30%-35% Debt-to-Capital
Manage Growth Capital of
$550M
Generate Productivity Gains of
$750M
Target Saudi JV Investment of
$350M
Overarching 2013 Financial Target
Taking the right actions
Control Sustaining Capital of
$1.0B
Positive
Free Cash
Flow
$825M
YTD:
$289M
$482M
$146M
34.5% |
 o[Alcoa logo] Market
Fundamentals are stable; pricing pressure continues 16
Global
Aluminum
Demand
Growth
at
7%
Market Essentially
Balanced Inventory
is Stable
12%
-1%
4%
4%
7%
9%
8%
5%
6%
6%
2013E
23.1
6.5
6.2
4.0
2.0
1.9
1.9
1.0
1.0
49.5 mmt
(1)
Other includes Africa, E.Europe, Latin America ex Brazil and Oceania
2013 Primary Aluminum Consumption (mmt), Annualized Growth (%)
China
Europe
North America
North Asia
India
SE Asia
MENA
Russia
Brazil
Other ¹
1.9
2013 Demand +7%
Rest of World +4%
$0
$50
$100
$150
$200
$250
$300
$0
$50
$100
$150
$200
$250
$300
Regional Premiums over time
$ per metric
ton
Region
End of 3Q
13
Europe
$240/MT
Japan
$246/MT
Midwest
USA
$216/MT
Year on Year Change
Europe -17%
Japan -4%
Midwest USA -11%
Global Inventories vs. LME Price Over Time $
Supply/Demand Analysis
Lower Regional
Premiums |
 o[Alcoa logo]
o[Alcoa
logo] |
 o[Alcoa logo]
[Alcoa logo]
[Alcoa logo]
Klaus Kleinfeld
Chairman and Chief Executive Officer
18
October 8, 2013
[Alcoa logo] |
 o[Alcoa logo]
Source: Alcoa Analysis
Growth continues in global end markets
19
Alcoa end markets: Current assessment of 2013 vs. 2012
|
 o[Alcoa logo]
20
Contributions from Value-Add businesses continue to grow
Value-add 3 Party Revenue, Adjusted EBITDA and Adjusted
EBITDA margin – 2003, 2012 and 2013 Annualized
1) Pro forma 2003 amounts reflect current structure of EPS and GRP; 2) YTD
results annualized; does not represent a forecast of 4Q 2013 results;
3) ATOI for the respective periods: 2003 $358M, 2012 $956M and 2013
annualized $1,056M 13,324
13,156
8,785
1,955
1,799
855
14.7%
13.7%
9.7%
Revenue
($M)
Adjusted
EBITDA
(3)
($M)
Adjusted
EBITDA Margin
2003
(1)
2012
2013
Annualized
(2)
rd |
 o[Alcoa logo]
Aero, Auto and Commercial B&C account for $5.9B of value-add revenue
Breakdown of 2012 Alcoa value-add revenue by market ($B)
21
8%
End
Market
CAGR
(2012
-
2015)
~8
year
production
backlog
(’12
rates)
for
large
commercial
aircraft
segment
From 2012 -
2015:
30-35%
CAGR
for
N.
America
auto
sheet
3.6x
increase
in
auto
sheet
revenue
3.2%
CAGR
for
N.
America
(2012
-
2015)
55%
of
non-residential
starts,
by
value
in
the U.S., will be green by 2016
(1)
Aerospace
Commercial Building and Construction
Automotive
1) McGraw Hill Construction, Green Outlook 2013.
Other
0.8
Industrial
Products
2.0
Commercial
Transportation
1.3
Packaging
3.2
Automotive
0.7
Commercial Building
and Construction
1.4
Aerospace
3.8
Revenues: $13.2B |
 o[Alcoa logo]
New A330 strengthens Alcoa’s metallic aero opportunity
22
Airbus A330 Updates and Alcoa Solutions
Airbus tailors new A330 for Asian markets
Opportunities to apply Alcoa solutions
September 2013: New variant of all-metallic
A330-300 announced by Airbus
Target
short,
high-density
routes
in
growth
markets
Airbus goals:
Reduce weight
Increase passenger capacity
Optimize engine thrust and
lifespan
Advanced alloys
Aerospace hard alloys
Aluminum Lithium
-
Weight / -
Corrosion
Value-add products
Extruded wing stringers
Floor beams and seat tracks
Forged wheel & brake systems
+ Passenger Capacity
Engine technology
Advanced airfoils
Structural engine components
Specialized coatings
New thrust requirements
Images: Airbus. 2013 |
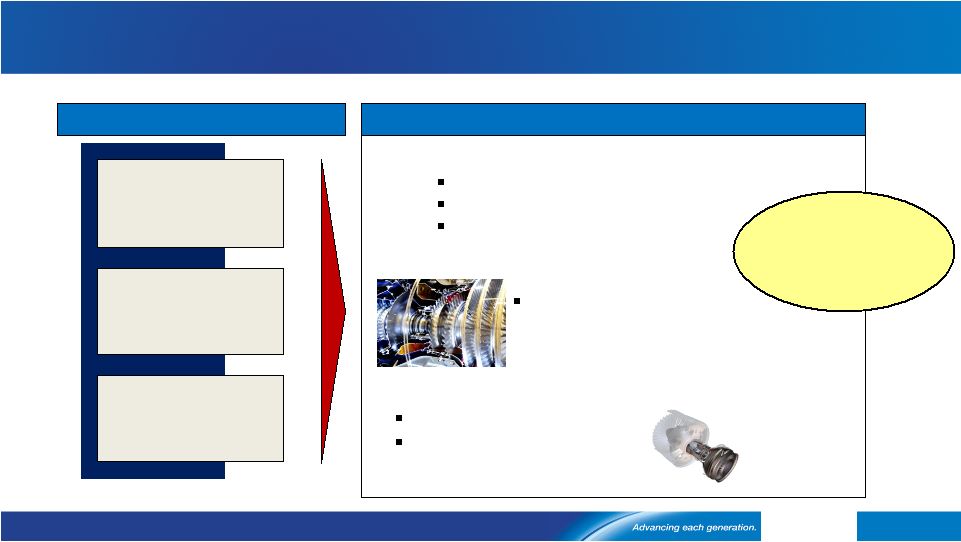 o[Alcoa logo]
Alcoa technology powers next generation jet engine performance
23
Increases coating life 3.0-3.5X
Enhances
airfoil hot
corrosion
protection
3D Multi-wall Airfoils
Provides
customized targeted
cooling
of
critical
areas
of
the engine blades
Nickel-based
superalloys
Increases
blade
melting
point
by
12%
Improves oxidation resistance
Advanced Single Crystal Technology
Reduced Emissions
Engine Fuel Burn
Reduction
Lower Maintenance &
Operating Cost
Customer needs and Alcoa solutions in the aerospace airfoils market
Specialized Airfoil Coatings
Alcoa technology
enables operation at
highest temperatures
>3,000°F
Customer needs
Alcoa provides high temperature airfoil solutions |
 o[Alcoa logo]
Aluminum Intensive Vehicles have the competitive edge
Comparison between baseline steel and aluminum intensive vehicles
1) Aluminum Association. 2) Oak Ridge National Laboratory. 2013
24
“Aluminum offers
the most promise
for cutting total automotive-related
carbon
emissions
and
energy
use”
(1)
Steel
Toyota
Venza:
3%
Al
content
Fuel Efficiency: +18%
(2)
Weight: -8%
(2)
CO2
Breakeven Point:
1,900 miles
Compared to baseline steel:
Over Lifecycle
(2
)
:
-
32% lower energy
-
29%
less CO2
Safe and Durable
Al
Intensive
Toyota
Venza:
37%
Al
content
Reduces CO
2
emissions
Improves fuel efficiency
Safer
–
can reduce stopping
distances
from 45 mph to zero by up
to 7 feet –
could mean the difference
between a serious collision and a
near-miss
More Durable
–
unlike steel,
aluminum auto body panels are
naturally corrosion resistant
Proven –
aluminum’s strength and
durability proven in harsh environments
e.g. military, space missions |
 o[Alcoa logo]
Aluminum intensity is accelerating auto sheet demand
Projected aluminum content per vehicle (lbs) and auto sheet demand (kMT)
Sources: Ducker Worldwide , IHS , Alcoa analysis
25
136
55
14
2025
2015
2012
North America Aluminum Body Sheet
Content Per Vehicle (in lbs)
North America Market Demand –
Auto Aluminum (kMT)
2025
4,550
3,425
1,125
2015
3,150
2,720
430
2012
2,400
2,300
100
Increasing Aluminum Intensity
Drives Auto Sheet Demand
4x
increase
in
auto
sheet
already
locked
into
designs
of
2015
models
Auto Sheet
Other Auto
Aluminum
Castings
Actual
Projected
~10x
~4x |
 o[Alcoa logo]
$275M investment
Enables flexible production
Much of volume secured
Broke ground in Aug. 2013
Complete by mid-2015
Alcoa’s auto triple play: 3 smart investments to capitalize on AIV growth
$300M investment
Supported by secured contracts
On time and on budget
First
coil
by
Dec.
2013
26
Davenport
Phase 1 Auto Expansion
Auto Treatment Line –
Davenport, IA
Saudi Arabia JV
Automotive growth projects
$380M total investment
*
Addition to can sheet mill
Cold mill, heat treat, finishing
Broke
ground
in
Dec.
2012
First auto coil
by Dec. 2014
Positioning
for
growth
in
MENA
Tennessee
Phase 2 Auto Expansion
Alcoa TN facility–
Alcoa, TN
Saudi Arabia JV –
KSA
AIV
=
Aluminum
Intensive
Vehicle;
MENA
=
Middle
East
and
North
Africa
*
Total
investment
relates
to
rolling
mill
capability
expansion
to
include
auto
sheet,
building
and
construction
sheet
and
foil
stock.
Alcoa’s
investment
portion
is
~$95M |
 o[Alcoa logo]
Alcoa delivers in a world demanding greener buildings
27
Alcoa solutions for U.S. commercial building and construction requirements
U.S. vs. EU Building Facts
(1,2)
Increasing energy requirements
Target of ‘Net Zero’
Buildings
in EU by 2020
(4)
/
U.S.A. by 2030
(5)
Green buildings provide
(1)
:
Hurricane Resistance
Thermal Performance
Withstands
object impact
of
over 50 mph
20% improvement in dynamic
wind resistance
15% thermal performance
improvement
1630SS IR Curtain Wall
+
40%
Thermal
Perform.
Air and water
resistant
(superior
resistance
to
rot,
warp, buckle
due
to
moisture
or weather
exposure)
OptiQ™
Ultra Thermal Window
Blast Resistance
Improves
structural
performance
and
glass
retention
by
60%
54%
improvement
in
thermal
performance
IR 501UT Framing
Triple
Insulating
Glass
1) LEED Gold Building vs. avg. U.S. commercial building, LEED Green Building
Fact Sheet 2013, McGraw Hill. 2) Buildings Performance Institute Europe (BPIE), 2011.
3) U.S. EIA, 2013. Alcoa Analysis. 4) ACEEE, 2012. 5) European Commission Energy
Efficiency Directive, 2013 15% pts reduction
in U.S. consumption
equals ~$58B in
annual savings
(3)
73%
58%
15%
US
EU
Annual Electricity Consumption by Buildings (%)
-
25%
Energy
consumption
-
35% Emissions
+
27%
Occupant
satisfaction |
 o[Alcoa logo]
Enhancing competitiveness in the upstream business
Largest
low-cost
global
bauxite
producer,
and
world
leader
in
refining
$171M
in
refinery
gross
productivity
gains
YTD,
Performance
contributed
$159M
YoY
to
ATOI
Alumina
Price
Index
deployment
has
reached
53%
11
day
reduction
in
working
capital
YoY
=
$160M
cash
$17M
reduction
in
total
capital
spend
YTD
651
kMT
or
16%
of
capacity
curtailed;
including
274
kMT
(60%)
of
the
460
kMT
under
review
in
2013
$228M
in
smelting
gross
productivity
gains
YTD,
Performance
contributed
$167M
YoY
to
ATOI
Casthouse
value-added
has
generated
$200M
in
2013
2
day
reduction
in
working
capital
YoY
=
$50M
cash
$114M
reduction
in
total
capital
spend
YTD
28
Actions taken by upstream
Alumina
Aluminum
Mining
Refining
Smelting
Energy
8
consecutive
quarters
of
performance
(1)
improvement
in
upstream
business
1) Performance includes the following factors in ATOI: price/mix, volume,
productivity, and cost impacts |
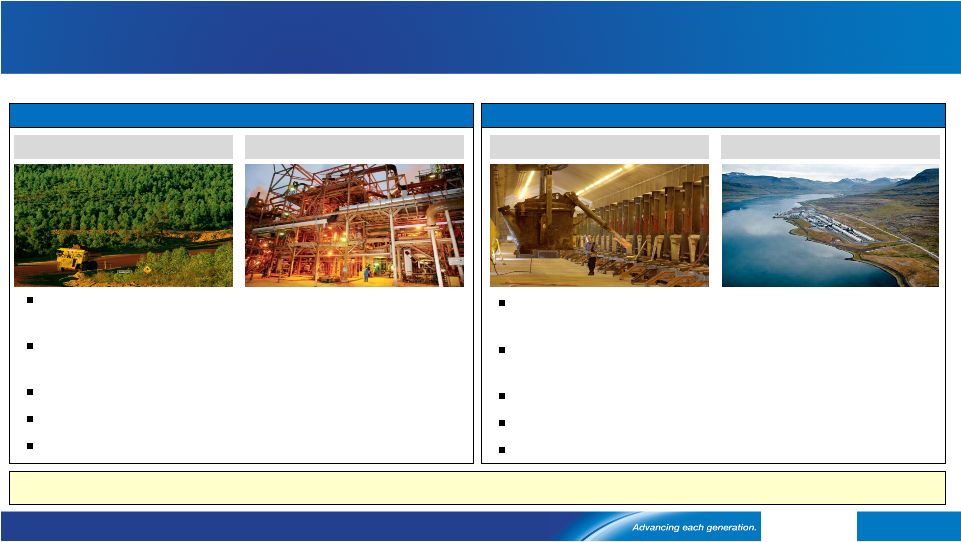
 o[Alcoa logo]
29
Smelter
Rolling Mill
Mine
Refinery
Phase 1
Phase 2
Construction progressing as planned; world’s lowest cost facility
99%
complete
67%
complete
38%
complete
250kMT
production in 2013
At full capacity in 2014
Lowest
cost
smelter
2%
point
reduction
on
the
smelting
cost
curve
First
hot
coil
in
4Q
2013
First auto
coil in 4Q 2014
First alumina 4Q 2014
Lowest
cost
refinery
2%
point
reduction
on
the
refining
cost
curve
On
track
to
provide
bauxite
in
2014
88%
complete
Saudi Arabia JV construction update |
 o[Alcoa logo]
Creating value by executing our strategy
30
Focusing
on
controllable
items
to
increase
upstream
profitability
Investing to capture growth and improve cost position
Leveraging
the
Alcoa
Advantage
to
deliver
Value-Add
products |
 o[Alcoa logo]
o[Alcoa
logo] |
 o[Alcoa logo]
Kelly
Pasterick
Director,
Investor
Relations
Alcoa
390
Park
Avenue
New
York,
NY
10022-4608
Telephone:
(212)
836-2674
www.alcoa.com
Additional
Information
32 |
 o[Alcoa logo]
Annual
Sensitivity
Summary
33
Currency Annual Net Income Sensitivity
+/-
$100/MT = +/-
$240 million
LME Aluminum Annual Net Income Sensitivity
Australian $
+/-
$11 million
per 0.01 change in USD / AUD
Brazilian
$
+/-
$ 3 million
per 0.01 change in BRL / USD
Euro €
+/-
$ 2 million
per 0.01 change in USD / EUR
Canadian $
+/-
$ 5 million
per 0.01 change in CAD / USD
Norwegian Kroner
+/-
$ 5 million
per 0.10 change in NOK / USD |
 o[Alcoa logo]
Revenue
Change
by
Market
34
(3%)
(6%)
3%
2%
(9%)
(9%)
(3%)
22%
3%
(1%)
5%
7%
9%
7%
(9%)
(5%)
(3%)
(1%)
11%
(11%)
17%
3%
7%
6%
7%
2%
14%
1%
15%
28%
Aerospace
Automotive
B&C
Comm. Transport
Industrial Products
IGT
Packaging
Distribution/Other
Alumina
Primary Metals
3Q’13 Third-Party Revenue
Sequential
Change
Year-Over-Year
Change |
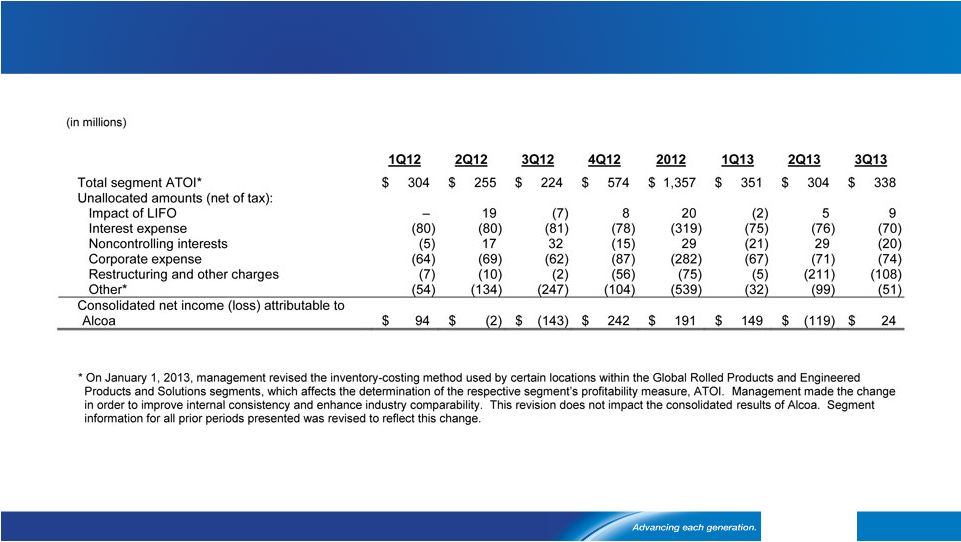 o[Alcoa logo]
Reconciliation
of
ATOI
to
Consolidated
Net
Income
(Loss)
Attributable
to
Alcoa
35 |
 o[Alcoa logo]
Reconciliation of Adjusted Income
36 |
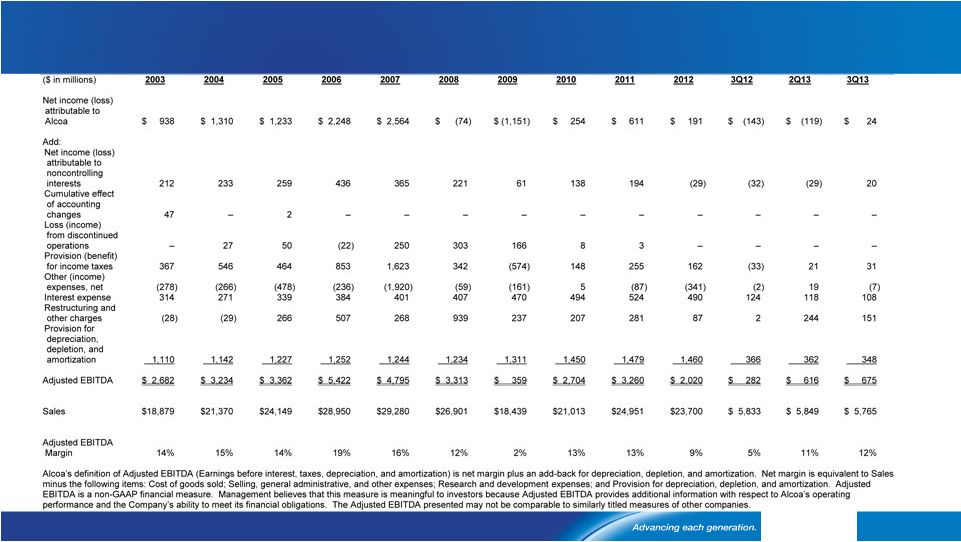 o[Alcoa logo]
Reconciliation
of
Alcoa
Adjusted
EBITDA
37 |
 o[Alcoa logo]
Reconciliation
of
Alumina
Adjusted
EBITDA
38 |
 o[Alcoa logo]
Reconciliation
of
Primary
Metals
Adjusted
EBITDA
39
($
in
millions , except
per
metric
ton
amounts
)
2003
2004
2005
2006
2007
2008
2009
2010
2011
2012
3Q12
2Q13
3Q13
After-tax operating
income (ATOI)
$ 657
$ 808
$ 822
$ 1,760
$ 1,445
$ 931
$ (612)
$ 488
$ 481
$ 309
$ (14)
$ (32)
$ 8
Add:
Depreciation,
depletion, and
amortization
310
326
368
395
410
503
560
571
556
532
130
132
131
Equity (income) loss
(55)
(58)
12
(82)
(57)
(2)
26
(1)
7
27
5
7
13
Income taxes
256
314
307
726
542
172
(365)
96
92
106
(19)
(25)
(16)
Other
12
20
(96)
(13)
(27)
(32)
(176)
(7)
2
(422)
2
(3)
2
Adjusted
EBITDA
$ 1,180
$ 1,410
$ 1,413
$ 2,786
$ 2,313
$ 1,572
$ (567)
$ 1,147
$ 1,138
$ 552
$ 104
$ 79
$ 138
Production
(thousand metric
tons) (kmt)
3,508
3,376
3,554
3,552
3,693
4,007
3,564
3,586
3,775
3,742
938
896
897
Adjusted
EBITDA
/
Production ($ per
metric ton)
$ 336
$ 418
$ 398
$ 784
$ 626
$ 392
$ (159)
$ 320
$ 301
$ 148
$ 111
$ 88
$
154
Alcoa’s
definition
of
Adjusted
EBITDA
(Earnings
before
interest,
taxes,
depreciation,
and
amortization)
is
net
margin
plus
an
add-back
for
depreciation,
depletion,
and
amortization.
Net
margin
is
equivalent
to
Sales
minus
the
following
items:
Cost
of
goods
sold;
Selling,
general
administrative,
and
other
expenses;
Research
and
development
expenses;
and
Provision
for
depreciation,
depletion,
and
amortization.
The
Other
line
in
the
table
above
includes
gains/losses
on
asset
sales
and
other
nonoperating
items.
Adjusted
EBITDA
is
a
non-GAAP
financial
measure.
Management
believes
that
this
measure
is
meaningful
to
investors
because
Adjusted
EBITDA
provides
additional
information
with
respect
to
Alcoa’s
operating
performance
and
the
Company’s
ability
to
meet
its
financial
obligations.
The
Adjusted
EBITDA
presented
may
not
be
comparable
to
similarly
titled
measures
of
other
companies. |
 o[Alcoa logo]
Reconciliation of Global Rolled Products Adjusted EBITDA
($ in millions, except
per metric ton
amounts)
2003
2004
2005
2006
2007
2008
2009
2010
2011
2012
3Q12
2Q13
3Q13
After-tax operating
income (ATOI)*
$ 232
$ 290
$ 300
$ 317
$ 151
$ (41)
$ (106)
$ 241
$ 260
$ 346
$ 89
$ 79
$ 71
Add:
Depreciation,
depletion, and
amortization
190
200
220
223
227
216
227
238
237
229
57
55
56
Equity loss
1
1
–
2
–
–
–
–
3
6
1
2
3
Income taxes*
77
97
135
113
77
14
12
103
98
159
39
32
32
Other
(5)
1
1
20
1
6
(2)
1
1
(2)
(3)
–
–
Adjusted EBITDA*
$ 495
$ 589
$ 656
$ 675
$ 456
$ 195
$ 131
$ 583
$ 599
$ 738
$ 183
$ 168
$ 162
Total shipments
(thousand metric
tons) (kmt)
1,893
2,136
2,250
2,376
2,482
2,361
1,888
1,755
1,866
1,943
501
521
519
Adjusted EBITDA
/ Total shipments
($ per metric ton)*
$ 261
$ 276
$ 292
$ 284
$ 184
$ 83
$ 69
$ 332
$ 321
$ 380
$ 365
$ 322
$ 312
Alcoa’s definition of Adjusted EBITDA (Earnings before interest, taxes, depreciation, and
amortization) is net margin plus an add-back for depreciation, depletion, and amortization. Net margin is equivalent to Sales
minus the following items: Cost of goods sold; Selling, general administrative, and other expenses;
Research and development expenses; and Provision for depreciation, depletion, and amortization. The Other line in
the table above includes gains/losses on asset sales and other nonoperating items. Adjusted
EBITDA is a non-GAAP financial measure. Management believes that this measure is meaningful to investors because
Adjusted EBITDA provides additional information with respect to Alcoa’s operating performance and
the Company’s ability to meet its financial obligations. The Adjusted EBITDA presented may not be comparable to
similarly titled measures of other companies.
* On January 1, 2013, management revised the inventory-costing method used by certain locations
within the Global Rolled Products segment, which affects the determination of the segment’s profitability measure,
ATOI. Management made the change in order to improve internal consistency and enhance industry
comparability. This revision does not impact the consolidated results of Alcoa. Segment information for all prior
periods presented was revised to reflect this change.
40 |
 o[Alcoa logo]
Reconciliation of Engineered Products and Solutions
Adjusted EBITDA
($ in millions)
2003
2004
2005
2006
2007
2008
2009
2010
2011
2012
3Q12
2Q13
3Q13
After-tax operating
income (ATOI)*
$ 126
$ 161
$ 276
$ 382
$ 423
$ 522
$ 311
$ 419
$ 537
$ 612
$ 158
$ 193
$ 192
Add:
Depreciation,
depletion, and
amortization
166
168
160
152
163
165
177
154
158
158
39
39
40
Equity loss
(income)
–
–
–
6
–
–
(2)
(2)
(1)
–
–
–
–
Income taxes*
57
70
120
164
184
215
138
198
258
296
77
94
91
Other*
11
106
(11)
(2)
(7)
2
1
–
(1)
(8)
–
–
–
Adjusted EBITDA*
$ 360
$ 505
$ 545
$ 702
$ 763
$ 904
$ 625
$ 769
$ 951
$ 1,058
$ 274
$ 326
$ 323
Third-party sales
$ 3,905
$ 4,283
$ 4,773
$ 5,428
$ 5,834
$ 6,199
$ 4,689
$ 4,584
$ 5,345
$ 5,525
$ 1,367
$ 1,468
$ 1,437
Adjusted EBITDA
Margin*
9%
12%
11%
13%
13%
15%
13%
17%
18%
19%
20%
22%
22%
Alcoa’s definition of Adjusted EBITDA (Earnings before interest, taxes, depreciation, and
amortization) is net margin plus an add-back for depreciation, depletion, and amortization. Net margin is equivalent to Sales minus
the following items: Cost of goods sold; Selling, general administrative, and other expenses; Research
and development expenses; and Provision for depreciation, depletion, and amortization. The Other line in the table
above includes gains/losses on asset sales and other nonoperating items. Adjusted EBITDA is a
non-GAAP financial measure. Management believes that this measure is meaningful to investors because Adjusted
EBITDA provides additional information with respect to Alcoa’s operating performance and the
Company’s ability to meet its financial obligations. The Adjusted EBITDA presented may not be comparable to similarly titled
measures of other companies.
* On January 1, 2013, management revised the inventory-costing method used by certain locations
within the Engineered Products and Solutions segment, which affects the determination of the segment’s profitability
measure, ATOI. Management made the change in order to improve internal consistency and enhance
industry comparability. This revision does not impact the consolidated results of Alcoa. Segment information for all
prior periods presented was revised to reflect this change.
41 |
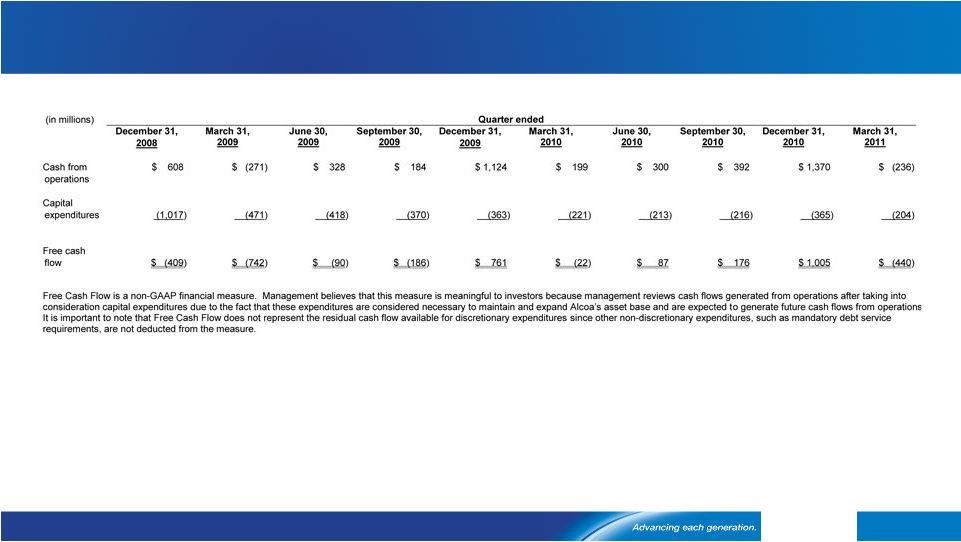
 o[Alcoa logo]
Reconciliation
of
Free
Cash
Flow
42 |
 o[Alcoa logo]
Reconciliation of Free Cash Flow, con’t
43 |
 o[Alcoa logo]
Days Working Capital
44 |
 o[Alcoa logo]
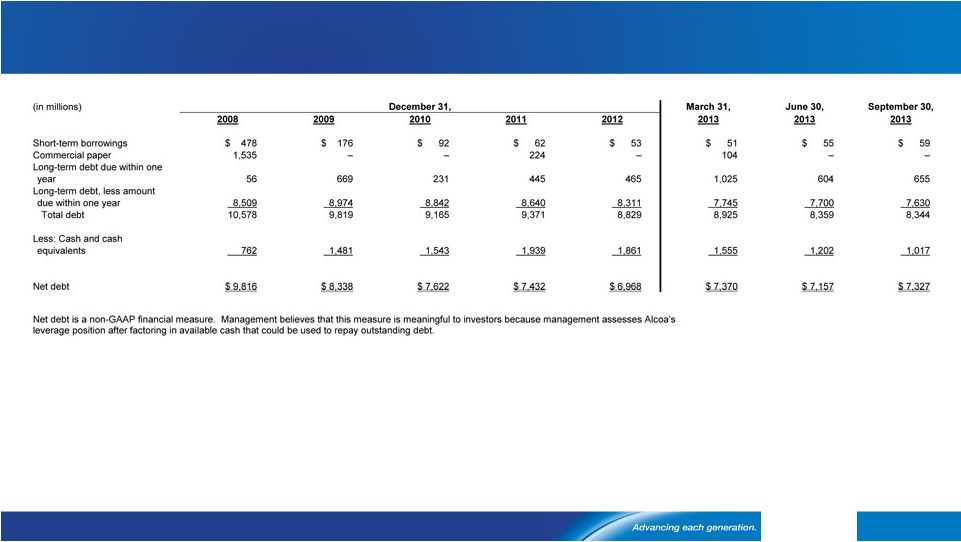
Reconciliation of Net Debt
45 |
 o[Alcoa logo]
Reconciliation of Net Debt-to-Capital
46 |
 o[Alcoa logo]
Composition of Upstream Production Costs
47
Fuel Oil
14%
Natural gas
10%
Caustic
11%
Bauxite
24%
Conversion
41%
Input Cost
Inventory flow
Pricing
convention
Annual ATOI
Sensitivity
Fuel oil
1 –
2 months
Prior month
$4m per $1/bbl
Natural gas
N/A
Spot
1
$16m per $1/GJ
1
Caustic soda
3 -
6 months
Spot & semi-
annual
$9m per
$10/DMT
Refining Cost Structure
Alumina
33%
Carbon
13%
Power
25%
Materials
6%
Conversion
23%
Smelting Cost Structure
Input Cost
Inventory flow
Pricing convention
Annual ATOI
Sensitivity
Coke
1 -
2 months
Spot, quarterly &
semi-annual
$9m per
$10/MT
Pitch
1 -
2 months
Spot, quarterly &
semi-annual
$2.5m per
$10/MT
1
Natural gas information corresponds to Point Comfort, as Australia is priced on a
rolling 16 quarter average |
 o[Alcoa logo]
48
Source: Alcoa estimates, Brook Hunt, CRU, Harbor
Global aluminum demand growth at 7%
7%
5%
12%
-1%
4%
9%
6%
4%
8%
6%
2013E
6.5
6.2
4.0
1.0
1.0
1.9
1.9
2.0
23.1
49.5 mmt
(1)
Other includes Africa, E.Europe, Latin America ex Brazil and Oceania
2013 Primary Aluminum Consumption (mmt), Annualized Growth (%)
China
Europe
North America
North Asia
India
SE Asia
MENA
Russia
Brazil
Other ¹
1.9
2013 Demand +7%
Rest of World +4% |
 o[Alcoa logo]
49
Source: Alcoa analysis, Brook Hunt, CRU, CNIA, NBS, Chinese Customs
Market essentially balanced
2013E Aluminum Supply/Demand Balance
‘000 mt
China
Rest of World
2013 Production (August annualized)
22,775
25,447
2013 Production to be added
360
704
2013 Capacity to be curtailed
(145)
(56)
Total supply
22,990
26,095
Demand
(23,125)
(26,360)
Net Balance
(135)
(265)
2013E Alumina Supply/Demand Balance
‘000 mt
China
Rest of World
2013 Production
(August annualized)
42,100
54,149
2013 Production to be added
-
700
2013 Capacity to be curtailed
(500)
-
Imports/(exports)
3,400
(3,400)
Total supply
45,000
51,449
Demand
(44,750)
(51,063)
Net Balance
250
386
2Q2013
Surplus
130
2Q2013
Deficit
(315)
Supply
Demand
Deficit
(400)
Supply
Demand
Surplus
636
Supply/Demand Analysis |
 o[Alcoa logo]
Inventory is Stable
50
$1,000
$1,500
$2,000
$2,500
$3,000
0
7
14
21
28
35
42
49
56
63
70
77
84
91
98
105
China Incl SRB
Producer
Japan Port
LME On Warrant
Cancelled Warrants
Off Exchange
LME 3 Mon
Days of
Consumption
108 days
LME Price
$2,214/MT
Days of
Consumption
83 days
LME Price
$2,686/MT
Global Inventories
Decline 34 days
from the ’09 peak
Days of
Consumption
Days of
Consumption
74.5 days
LME Price
$1,808/MT
$ per metric ton
Global Inventories vs. LME Price Over Time $ |
 o[Alcoa logo]
Lower
regional
premiums
51
Source:
Month
end
pricing
-
Platts
Metals
Week
and
Metal
Bulletin
$0
$50
$100
$150
$200
$250
$300
$0
$50
$100
$150
$200
$250
$300
Regional Premiums over time
$ per metric
ton
$ per metric
ton
Region
End of 3Q
13
Europe
$240/MT
Japan
$246/MT
Midwest
USA
$216/MT
Year on Year Change
Europe -17%
Japan -4%
Midwest USA -11% |
 o[Alcoa logo]
o[Alcoa
logo] |