Attached files
| file | filename |
|---|---|
| 8-K - FORM 8-K - HP INC | form8-k_10082013.htm |
EXHIBIT 99.1

© Copyright 2013 Hewlett-Packard Development Company, L.P. The information contained herein is subject to change without notice. Financial Overview and FY14 Outlook Cathie Lesjak Executive Vice President and Chief Financial Officer

© Copyright 2013 Hewlett-Packard Development Company, L.P. The information contained herein is subject to change without notice. * Billions 2 Met or exceeded our quarterly non-GAAP EPS guidance since our turnaround began Recent financial performance All non-GAAP financial measures have been adjusted to exclude certain items. A reconciliation of these non-GAAP financial measures to the related GAAP financial measures and an explanation of HP’s use of non-GAAP financial measures is included in the supplemental slides available at www.hp.com/investor/SAM2013 Free cash flow = operating cash flow – net capital expenditures Quarterly outlook reflects the midpoint of the outlook provided for that quarter Exceeded free cash flow expectations and approaching balance sheet rebuild goals

© Copyright 2013 Hewlett-Packard Development Company, L.P. The information contained herein is subject to change without notice. * FY13 YTD segment and cash flow performance4 Revenue Free Cash Flow1 Non-GAAP operating profit1 $6.9 billion $83.2 billion All non-GAAP financial measures have been adjusted to exclude certain items. A reconciliation of these non-GAAP financial measures to the related GAAP financial measures and an explanation of HP’s use of non-GAAP financial measures is included in the supplemental slides available at www.hp.com/investor/SAM2013 Revenue mix calculated based on total segment revenue, which does not include intercompany eliminations Operating profit mix calculated based on total segment operating profit, which does not include intercompany eliminations YTD refers to year-to-date through Q3 FY13 By segment3 By segment2 $7.0 billion Use of free cash flow HP Financial Services & Other 3% Software 3% HP Financial Services & Other 2% Software 7% M&A 1% Dividends 12%

© Copyright 2013 Hewlett-Packard Development Company, L.P. The information contained herein is subject to change without notice. * Dashboards to monitor performance vs. expectations Dashboard: Performance summary Example Metrics Personal Systems Printing Enterprise Group Enterprise Services Software Win Market share Pipeline Win rate Execute Financial performance Inventory Supply chain Productivity Delight Customer satisfaction Partner satisfaction Quality Innovate Milestone tracking New product revenues Develop Employee engagement Top talent attrition Source: HP internal analysis

© Copyright 2013 Hewlett-Packard Development Company, L.P. The information contained herein is subject to change without notice. * Savings will be used to fund reinvestment opportunities as well as continue to align our costs to our revenue FY12 restructuring plan continues As of Q3’13, an estimated 22,700 employees have left the company in connection with the program Total FY12 plan expected to be at higher end of expected range Positions eliminated under FY12 restructuring plan was communicated at 29,000 +/- 15% Given continued market and business pressures, we anticipate executing to the high end of the range Charges, savings and cash flow associated with the FY12 plan will increase Restructuring update

© Copyright 2013 Hewlett-Packard Development Company, L.P. The information contained herein is subject to change without notice. * Capital strategy Determine business plans and return targets Develop growth and earnings targets to maximize shareholder value over the long-term Establish desired credit rating and liquidity needs to guide the capital structure targets Fund capital uses necessary to achieve business objectives Maintenance operating expenses and capital expenditures Regular dividend Required pension funding Balance sheet adjustments to achieve credit rating target Allocate excess cash to highest economic profit opportunities Organic growth investments Capital distributions Share repurchases Incremental dividends Mergers and acquisitions Incremental pension funding Source and deploy the appropriate mix of capital to the most productive uses Maximize economic return and shareholder value by generating the highest risk-adjusted return on investment

© Copyright 2013 Hewlett-Packard Development Company, L.P. The information contained herein is subject to change without notice. * FY14 Capital allocation priorities Returns-based strategy targeting mid-single A credit rating over long-term Expect at least 50% of free cash flow in FY14 to be returned to shareholders through dividends and share repurchases Investment in key growth areas Bias towards share repurchases Remain committed to paying dividends 1 2 3

© Copyright 2013 Hewlett-Packard Development Company, L.P. The information contained herein is subject to change without notice. * Key assumptions FY14 Revenue Year-over-year decline moderates from FY13, with pockets of growth Currency impact Approx. 1% headwind to revenue Operating income $ Flat to up Y/Y Eliminations Approx. $0.03 per share unfavorable impact Restructuring charge $0.8B (excluded from non-GAAP results) Restructuring benefit Approx. $3.2B (+$1.1B incremental Y/Y) FY14 Outlook and assumptions Non-operational assumptions Non-operational assumptions OI&E Approx. $0.8B Tax rate Approx. 22% Share count Moderate decline Enterprise Services assumptions Enterprise Services assumptions Revenue growth -4% to -6% Y/Y Operating margin 3.5% to 4.5% Outlook FY14 Non-GAAP EPS1 $3.55 - $3.75 GAAP EPS $2.85 - $3.05 1. FY14 non-GAAP diluted EPS estimates exclude after-tax costs of approximately $0.70 per share related primarily to amortization of purchased intangible assets and restructuring charges

© Copyright 2013 Hewlett-Packard Development Company, L.P. The information contained herein is subject to change without notice. * FY14 Outlook – EPS bridge All non-GAAP financial measures have been adjusted to exclude certain items. A reconciliation of these non-GAAP financial measures to the related GAAP financial measures and an explanation of HP’s use of non-GAAP financial measures is included in the supplemental slides available at www.hp.com/investor/SAM2013 Represents FY13 non-GAAP EPS outlook provided on August 21, 2013 which has not been updated since that date Other includes HP Financial Services, corporate investments, eliminations, other income and expense, and impact from share repurchases Non-GAAP earnings per share ,2 3
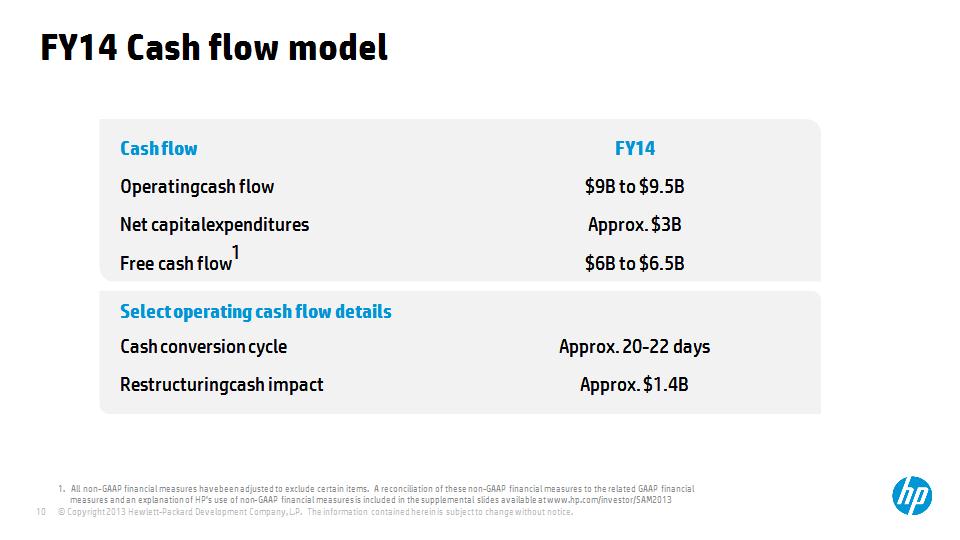
© Copyright 2013 Hewlett-Packard Development Company, L.P. The information contained herein is subject to change without notice. * Select operating cash flow details Select operating cash flow details Cash conversion cycle Approx. 20-22 days Restructuring cash impact Approx. $1.4B Cash flow FY14 Operating cash flow $9B to $9.5B Net capital expenditures Approx. $3B Free cash flow1 $6B to $6.5B FY14 Cash flow model 1. All non-GAAP financial measures have been adjusted to exclude certain items. A reconciliation of these non-GAAP financial measures to the related GAAP financial measures and an explanation of HP’s use of non-GAAP financial measures is included in the supplemental slides available at www.hp.com/investor/SAM2013

© Copyright 2013 Hewlett-Packard Development Company, L.P. The information contained herein is subject to change without notice. * Free cash flow versus non-GAAP earnings Strong 1-to-1 historical correlation exists between free cash flow and non-GAAP earnings In any particular year, the ratio can deviate from this historical correlation, due to various factors FY14 free cash flow is expected to decline, although the FY14 free cash flow/non-GAAP earnings is expected to be consistent with the three-year average historical trend All non-GAAP financial measures have been adjusted to exclude certain items. A reconciliation of these non-GAAP financial measures to the related GAAP financial measures and an explanation of HP’s use of non-GAAP financial measures is included in the supplemental slides available at www.hp.com/investor/SAM2013 FY13 ratios based on outlook provided on August 21, 2013; FY14 ratios based on outlook provided as part of this presentation 2

© Copyright 2013 Hewlett-Packard Development Company, L.P. The information contained herein is subject to change without notice. * Company characteristics Long-term financial model Technology leader delivering unrivaled integrated solutions Strong focus on innovation across segments EPS growing faster than revenue Returns-based capital allocation strategy Financial strength foundational to the broader business strategy Looking to the future $ Revenue growth Global GDP-like growth Operating margin rate 10% - 11% Cash flow Long-term trajectory tracks earnings Capital distribution Share repurchases: Returns-based Dividends: Distributions to share profits with investors

© Copyright 2013 Hewlett-Packard Development Company, L.P. The information contained herein is subject to change without notice. * The bottom line Doing what we said we would do Delivering innovation Positioning ourselves for success 1 2 3

© Copyright 2013 Hewlett-Packard Development Company, L.P. The information contained herein is subject to change without notice. Thank you