Attached files
| file | filename |
|---|---|
| 8-K - CURRENT REPORT - MILLER ENERGY RESOURCES, INC. | mill_8k.htm |
| EX-99.1 - PRESS RELEASE - MILLER ENERGY RESOURCES, INC. | mill_99z1.htm |
EXHIBIT 99.2
Investor
Presentation
NYSE: MILL

Forward Looking Statements
Certain statements in this presentation and elsewhere by Miller Energy Resources¸ Inc. are "forward-looking statements" within the meaning of the
Private Securities Litigation Reform Act of 1995. These forward-looking statements involve the implied assessment that the resources described can be
profitably produced in the future, based on certain estimates and assumptions. Forward-looking statements are based on current expectations, estimates
and projections that involve a number of risks, uncertainties and other factors that could cause actual results to differ materially from those anticipated by
Miller Energy Resources, Inc. and described in the forward-looking statements. These risks, uncertainties and other factors include, but are not limited to,
the potential for Miller Energy to experience additional operating losses; high debt costs under its existing senior credit facility; potential limitations
imposed by debt covenants under its senior credit facility on its growth and ability to meet business objectives; the need to enhance management,
systems, accounting, controls and reporting performance; uncertainties related to the filing of its Form 10-K for 2011; litigation risks; its ability to perform
under the terms of its oil and gas leases, and exploration licenses with the Alaska DNR, including meeting the funding or work commitments of those
agreements; its ability to successfully acquire, integrate and exploit new productive assets in the future; its ability to recover proved undeveloped reserves
and convert probable and possible reserves to proved reserves; risks associated with the hedging of commodity prices; its dependence on third party
transportation facilities; concentration risk in the market for the oil we produce in Alaska; the impact of natural disasters on its Cook Inlet Basin
operations; adverse effects of the national and global economic downturns on our profitability; the imprecise nature of its reserve estimates; drilling risks;
fluctuating oil and gas prices and the impact on results from operations; the need to discover or acquire new reserves in the future to avoid declines in
production; differences between the present value of cash flows from proved reserves and the market value of those reserves; the existence within the
industry of risks that may be uninsurable; constraints on production and costs of compliance that may arise from current and future environmental, FERC
and other statutes, rules and regulations at the state and federal level; the impact that future legislation could have on access to tax incentives currently
enjoyed by Miller; that no dividends may be paid on its common stock for some time; cashless exercise provisions of outstanding warrants; market
overhang related to restricted securities and outstanding options, and warrants; the impact of non-cash gains and losses from derivative accounting on
future financial results; and risks to non-affiliate shareholders arising from the substantial ownership positions of affiliates. Additional information on
these and other factors, which could affect Miller's operations or financial results, are included in Miller Energy Resources, Inc.'s reports on file with
United States Securities and Exchange Commission including its Annual Report on Form 10-K, as amended, for the fiscal year ended April 30, 2013. Miller
Energy Resources, Inc.'s actual results could differ materially from those anticipated in these forward- looking statements as a result of a variety of factors,
including those discussed in its periodic reports that are filed with the Securities and Exchange Commission and available on its Web site (www.sec.gov).
All forward-looking statements attributable to Miller Energy Resources or to persons acting on its behalf are expressly qualified in their entirety by these
factors. Investors should not place undue reliance on these forward-looking statements, which speak only as of the date of this presentation. We assume
no obligation to update forward-looking statements should circumstances or management's estimates or opinions change unless otherwise required
under securities law.
2

Transaction Summary
Issuer: Miller Energy Resources, Inc.
Security: 10.5% Series D Fixed Rate / Floating Rate Cumulative Redeemable Preferred Stock
Size: $25,000,000
Book Runners: MLV & Co. and Maxim Group LLC
Co-Managers: Aegis Capital Corp, Dominick & Dominick LLC, Ladenburg Thalmann, National Securities Corporation, and Northland
Capital Markets
Capital Markets
Stated Yield: 10.5% per annum, Fixed-to-Floating after 5 years, payable quarterly in cash based on liquidation preference of $25
per share
per share
Floating Rate: Three-month LIBOR + the difference of 10.5% and the 5-year Treasury yield on the date prior to the announcement
of the offering
of the offering
Price: $25.00
Initial Yield: 10.5%
Liquidation Preference: $25 per share, plus accrued but unpaid dividends
Call Provision: Callable after five years at $25
Redemption: No mandatory redemption, optional redemption by the Company upon a change of control
Conversion Rights: None; provided, however, that if the Company does not exercise its Redemption Right upon a change of control, the
holders shall have a limited right to convert their shares into common stock at a predetermined ratio.
holders shall have a limited right to convert their shares into common stock at a predetermined ratio.
Voting Rights: Generally will have no voting rights except for a listing default or failure to pay dividends
Use of Proceeds: General corporate purposes
3

Company Snapshot
|
Stock Ticker (NYSE)
|
MILL
|
|
Price (9/18/2013)
|
$6.63
|
|
Market Capitalization
(9/18/2013) |
$288.9 MM
|
|
Shares Outstanding
|
43.7 MM
|
|
Institutions
Insider Ownership
|
~34%
29.2%
|
|
Proved Oil Reserves (1P)
|
8.61 MMBOE
|
|
% of Proved Reserves / Oil
|
97.3%
|
|
Company Operated % of
Net Production |
100%
|
|
Lease & Exploratory Acres
Alaska 720,724
Tennessee 49,530
|
770,254
GROSS ACRES
|
|
Total Resources SEC Case
Strip |
PV-10 $1.4
BILLION |
Miller Energy Resources, Inc. is an oil and natural gas
exploration, production and drilling company operating in:
exploration, production and drilling company operating in:
•Cook Inlet, Alaska
•Appalachian Basin, Tennessee
When Scott M. Boruff started working with Miller Energy in
2008 the price per share was $0.05 and the market cap
was less than $1.0 million. Since then shares have
appreciated more than 13,000%.
2008 the price per share was $0.05 and the market cap
was less than $1.0 million. Since then shares have
appreciated more than 13,000%.
Miller Energy’s vertical integration and infrastructure
provides for complete control of the production process,
from drilling to producing to processing. Additional oil
production from WMRU and Redoubt Unit expect to add
$80/bbl to free cash flow.
provides for complete control of the production process,
from drilling to producing to processing. Additional oil
production from WMRU and Redoubt Unit expect to add
$80/bbl to free cash flow.
4

Shareholder Value With Milestones
Pink
Sheets
Sheets
Bulletin
Board
Board
Acquired
ETC
ETC
Acquired
Alaska
Assets
Alaska
Assets
Added 3 New
Independent Directors
Independent Directors
Hired
KPMG as
Auditor
KPMG as
Auditor
NYSE
Listing
Listing
Guggenheim
Financing
Financing
Apollo
Financing
Financing
RU-4
online
online
Apollo
Financing
Financing
amended
5

Investment Highlights
Ø Proven track record of Alaskan growth in last 3+ years
§ Production increased from 133 BOED in December 2009 to an average of ~3,200 BOED in August 2013
§ Successful development of 11 out of 12 reworked wells
Ø Low risk path to significant production growth
§ Performance of reworked Redoubt wells has substantiated management theory that poor well
performance under previous operators was related to well bore design and not reservoir issues
performance under previous operators was related to well bore design and not reservoir issues
§ Majority of targets in already productive fields
§ New wells de-risked due to adjacent PUD locations
Ø Growth visibility with expected FY14 exit rate of 6,000 BOED
§ Anticipating RU-5B & Sword results with potential production estimates of 1,150 BOED scheduled to
come online by end of October
come online by end of October
§ 6 to 7 additional wells anticipated to be drilled by the end of FY14
Ø Favorable Alaskan environment
§ State of Alaska continues to support drilling efforts (Cook Inlet Recovery Act):
§ Up to 40% drilling rebates and 25% on yearly losses
§ Local gas prices have ranged $6-22 per Mcf over the last 12 months
§ Low development costs due to existing midstream infrastructure
Ø Incremental production takes advantage of operating efficiencies
Ø Team has been with assets for over 20 years
6
PUD
6.8 MMBOE
PV-10 $334MM
Total Reserves
53.9 MMBOE
SEC Case: PV-10 $1.4 Billion
Proved Reserves
8.6 MMBOE
SEC CASE: PV-10 $366.8MM
Large Drilling Inventory
PDP
1.8 MMBOE
PV-10
$32.8MM
$32.8MM
PROBABLE (2P)
10.3 MMBOE
PV-10
$442.6MM
$442.6MM
POSSIBLE (3P)
35.0 MMBOE
PV-10
$605.1MM
$605.1MM
PROVED (1P)
8.6 MMBOE
PV-10
$367.2MM
$367.2MM
Based on the RED April 2013 SEC Reserves at INO.com
Reserves - Proved with Upside
7

Production Rate
PDP Potential
Near-Term Alaskan Asset Potential
+557 %
+88%
• Majority of growth from development of existing and proven oil fields
* Includes RU-1, RU-2, RU-5, Sword 1, and Olson 1
** Includes WMRU-8, WMRU-9, Sabre 1, RU-8, RU-9, Olson 2, and Otter 1
8
*
**

History of Alaska Acquisition
Approximately $200mm in midstream infrastructure and over $300mm in
proven reserves purchased at auction for $4.5 million in 2009
proven reserves purchased at auction for $4.5 million in 2009
9

§ Includes multiple behind pipe and previously producing wells
§ 11 for 12 success on completed projects to date
Previously
Producing
Redevelopment
Low Risk Development
Operating Expertise
§ At acquisition, 15 previously producing wells could be worked over for
low cost and with lower risk
low cost and with lower risk
§ Four WMRU wells, six redoubt unit wells, and one west foreland well
have been successfully worked over
have been successfully worked over
§ The Cook Inlet management team operated these assets for ~20 years
§ Plan for addressing previous operator mistakes
§ Added senior G & G team and drilling team
Tax Credits
§ 40% of drilling and exploration costs and 20% of other capital costs are
refunded by the state of Alaska plus 25% of net losses
refunded by the state of Alaska plus 25% of net losses
§ ~$8 MM paid by state to CIE, ~$24 MM pending
§ In place owned infrastructure to support multi year production program
§ Estimated $5 per barrel LOE for incremental oil production
Significant
Infrastructure
Infrastructure
Large Land Position
§ Located in one of the largest oil fields in the U.S.
§ ~ 600,000 lease & exploration acres
§ Acquired additional 150,000 lease and exploration acres
Alaska Acquisition Highlights
10

11

Alaska - Osprey Platform
§Modern state of the art facility
§Located 3.5 miles South East of
the Kustatan Production
Facility
the Kustatan Production
Facility
§Located in only 60’ of water
§Originally designed for 21 wells
producing 25,000 BOED
producing 25,000 BOED
§Has additional room for 13
wells targeting areas to the
north and south of the
developed structure
wells targeting areas to the
north and south of the
developed structure
§Transfers crude oil via sub-sea
8” or 6” pipeline to Kustatan
Production Facility
8” or 6” pipeline to Kustatan
Production Facility
§Includes living
accommodations, kitchen,
cafeteria, control room &
helicopter pad
accommodations, kitchen,
cafeteria, control room &
helicopter pad
12

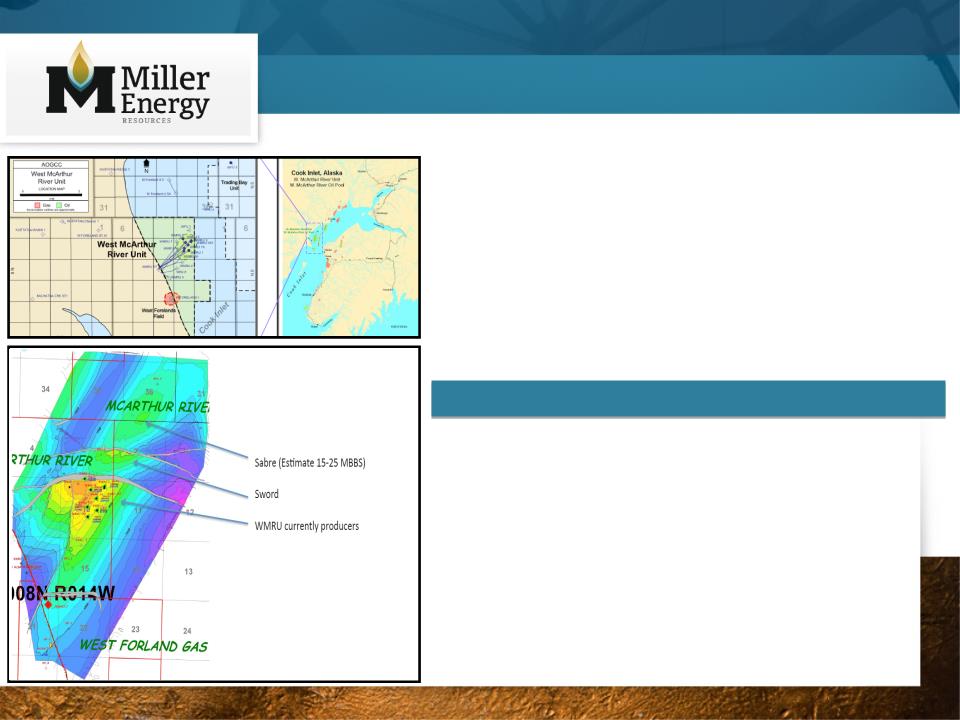
Alaska - West McArthur River Unit
§Two onsite wells producing over
600 BOED brought back into
production in 2010
600 BOED brought back into
production in 2010
§Originally developed for seven
well sites
well sites
§Has potential to target untapped
gas sands, which overlay much of
the surrounding structures
gas sands, which overlay much of
the surrounding structures
§Includes living accommodations,
kitchen & cafeteria
kitchen & cafeteria
§Has capacity to store 12,000
barrels of crude oil
barrels of crude oil
13

Alaska - Kustatan Production Facility
§Processes crude oil and natural
gas from Osprey Platform
gas from Osprey Platform
§Onsite natural gas well brought
online in 2010 to power the
facility
online in 2010 to power the
facility
§Produces sales quality oil per
Cook Inlet Pipeline specs
Cook Inlet Pipeline specs
§Provides electrical power for
Osprey Platform and WMRU
Osprey Platform and WMRU
§Seven buildings contain
equipment for pigging, crude
heating, separation, water
pumping, gas/oil handling, power
generation and the control room
equipment for pigging, crude
heating, separation, water
pumping, gas/oil handling, power
generation and the control room
§Tank farm contains 5 - 10,000
barrel tanks
barrel tanks
14

Miller Thesis - Original Completions Incorrect
• Completed optimization
on RU-7
on RU-7
• Flow rates increased
over 100%
over 100%
• Annual decline curve
decreased from 27% to
10%
decreased from 27% to
10%
• Bottom hole flowing
pressure doubled
pressure doubled
• PV-10 increased 3x
• Plan to optimize all RU
wells
wells
Highlights
15

Miller Thesis Validation - RU-2A Sidetrack
|
Rework Completed
|
June 20, 2013
|
|
Cash Cost
|
$13.3MM
|
|
Pre-Miller Production
|
91 BOED
|
|
Post-Miller Production
|
1,281 BOED
|
|
Production
|
Avg daily production - 1,268 BOED*
Almost 92,000 bbls produced post workover*
|
|
Remaining Recoverable Oil
|
1.035MM bbls (net reserves)**
|
|
PV-10
|
$67.9MM**
|
|
Quarterly Revenue &
Free Cash Flow
|
> $10MM; $8MM added to free cash flow
|
Estimated payback in approximately 90 days (including 40% tax credits from
State of Alaska, using average sales price of $101.53 for fiscal 2013)
State of Alaska, using average sales price of $101.53 for fiscal 2013)
*June 21 - August 31, 2013.
**Our IP figures, well log indications, increased bottom hole flowing pressure and favorable up dip location suggest these
estimates will dramatically increase.
estimates will dramatically increase.
16

Miller Thesis Validation - RU-7 Case
|
RU-7
|
Previous Operator
|
Miller Energy
|
|
Steady State
Production |
<100 BOED
|
230 BOED (2011)
190 BOED (2013)
|
|
PSI
|
1,200 lbs.
|
2,500 lbs.
|
|
PV 10 Reserves
|
$4MM
|
$20MM
|
|
Lifting Costs
|
$70/bbl
|
$29/bbl
|
|
Annual Decline
|
27%
|
10%
|
• Rework completed:
Q2 2012
Q2 2012
• Cash cost of rework:
$1.4MM
$1.4MM
• Produced over
137,000 bbls post
work over
137,000 bbls post
work over
• Current PV-10
reserved on RU-7 are
$15.0MM
reserved on RU-7 are
$15.0MM
• EUR increases by over
200,000 barrels
200,000 barrels
17

Average Daily Production
18
|
Well
|
8/13 Average Daily
Production (BOE) |
4/30/13 RED Gross
Reserves (MBOE) |
|
RU-1A
|
754.0*
|
531.5
|
|
RU-2A
|
1,237.0
|
1,348.2
|
|
RU-3 Gas
|
287.0
|
10.4
|
|
RU-4 Gas
|
103.2
|
18.3
|
|
RU-5B
|
0.0
|
1,124.7
|
|
RU-7
|
186.0
|
278.8
|
|
WMRU-1A
|
0.0
|
31.3
|
|
WMRU-2A
|
0.0
|
0.0
|
|
WMRU-5
|
326.0
|
574.4
|
|
WMRU-6
|
331.5
|
481.2
|
|
WF-2L
|
29.7
|
12.1
|
|
WF-2U
|
0.0
|
10.1
|
|
Alaska Total
|
3,254.4
|
4,421.0
|
|
Tennessee
|
224.9
|
165.7
|
|
MILL Total
|
3,479.3
|
4,586.7
|
* Average over the 14-day period after well completion in August

Tennessee Development Strategy
• Largest owner/operator of wells in Tennessee
ü over 49,000 acres
• Reworking existing stripper wells
ü Upgrade/replace lift systems, acid stimulation, etc
• Own & operate drill rigs and 100% of production
ü Over 45 years experience
ü Low operating costs
• Exploit our Mississippi lime oil
ü Similar formation and opportunity in Southern Kansas/Oklahoma
• First horizontal MS well drilled and completed 1/14/13
• 25+ horizontal drilling targets identified
ü 2,000-3,000 foot horizontal, 10-30 stage fracs
ü 3 weeks @ a cost of ~$1.1 million per well
ü 1st horizontal east of Mississippi
19

Long-Term Inventory Visibility
•44 MMBOE potential from 63 non-proved locations
Proved Reserves + Drillable Locations (4/30/13)
|
Target
|
Proved Locations
|
Non-Proved Locations
|
|||
|
Redoubt
|
4
|
3
|
3
|
7
|
|
|
West McArthur River/ Saber/ Sword
|
3
|
|
|
5
|
1
|
|
Shallow Gas Plays
|
5
|
|
|
|
50
|
20

Sources & Uses/Pro Forma Capitalization
|
Uses ($MM)
|
|
|
Cash to Balance Sheet
|
$23.25
|
|
Estimated Fees & Expenses
|
$1.75
|
|
Total
|
$25.0
|
|
Sources ($MM)
|
|
|
Series D Preferred Stock
|
$25.0
|
|
Total
|
$25.0
|
|
Capitalization
|
|||
|
(dollars in thousands)
|
As Of 7/31/2013
|
||
|
|
Actual
|
As Adjusted*
|
|
|
Cash And Equivalents
|
$3,125
|
|
$26,375
|
|
|
|
|
|
|
Debt (including current portion)**
|
$57,577
|
|
$57,577
|
|
Common Stock
|
4.0
|
|
4.0
|
|
Pref. Stock, Redeemable***
|
53,663
|
|
78,663
|
|
Additional Paid In Capital
|
89,913
|
|
89,913
|
|
Retained Earnings
|
191,276
|
|
189,526
|
|
Total Capitalization
|
$392,433
|
|
$415,683
|
21
Pro Forma only for this transaction
Includes our Series B Cumulative Redeemable Preferred Stock
Includes our 10.75% Series C Cumulative Redeemable Preferred Stock
*
**
***

Recent Developments
• 8/17/13 - Brought RU-1A oil well online with IP of over 700 BOED
• 8/5/13 - Apollo credit facility - Available credit increases by $20MM; interest
rate on new funds reduced from 18% to 9%
rate on new funds reduced from 18% to 9%
• 8/5/13 - Drilling update - RU-1A enters completion phase, Sword & Olson
Creek wells are over halfway to total depth
Creek wells are over halfway to total depth
• 7/29/13 - Marceau Schlumberger added to board
• 7/15/13 - Announced 21-day average production rate of 1,314 BOED from
RU-2A oil well
RU-2A oil well
• 6/24/13 - Successfully brought RU-2A sidetrack well online - initial daily
production rate (IP) of 1,281 barrels of oil per day
production rate (IP) of 1,281 barrels of oil per day
22

Investment Summary
|
Significant Asset Base
|
§ 8.611MMBOE of proved reserves
§ P1+P2+P3 PV-10 (SEC) of $1.414BN
§ $295MM in shareholders equity (~ book value = $6.80/share)
|
|
|
Advantages of State-Of-
the-Art Infrastructure |
§ Equipment and infrastructure in place to support significantly higher
production volumes § Able to maintain low operating costs + low incremental lifting costs
§ $230MM+ appraised value and $500MM+ replacement value
|
|
|
Value Driven Growth
Strategy |
§ Strong foundation in place built on low cost / high value acquisitions
§ Efficient low cost operators
§ Alignment between shareholders and management
|
|
|
Advantages of Being in
Alaska |
§ Favorable oil and natural gas prices
§ Significant tax incentives for exploration and development
|
|
|
Large Undeveloped Oil
Play |
§ Redoubt has significant potential not reflected in reserve report
§ Fixing past mistakes and not taking true exploration risk
§ Multiple oil plays around large, developed fields
§ Initial work over results very positive
|
23

Appendix
24

Management Bios
• Deloy Miller, Age 66 Mr. Miller, our founder, has been Chairman of the Board of Directors since December 1996, and
was Chief Executive Officer from 1967 to August 2008, and Chief Operating Officer from August 2008 to July 2013.
Since then, Mr. Miller has been Executive Chairman of the Board of Directors. He is a seasoned gas and oil professional
with more than 40 years of experience in the drilling and production business in the Appalachian basin. During his
years as a drilling contractor, he acquired extensive geological knowledge of Tennessee and Kentucky and received
training in the reading of well logs. Mr. Miller served two terms as president of the Tennessee Oil & Gas Association
and in 1978 the organization named him the Tennessee Oil Man of the Year. He continues to serve on the board of
that organization. Mr. Miller was appointed in 1978 by the Governor of Tennessee to be the petroleum industry's
representative on the Tennessee Oil & Gas Board, the state agency that regulates gas and oil operations in the state.
In 2011, Mr. Miller was appointed to the Federal Reserve Bank of Atlanta's Energy Advisory Council for a two-year
term. Mr. Miller is the father-in-law of Mr. Boruff.
• Scott M. Boruff, Age 50 Mr. Boruff has served as a director and our Chief Executive Officer since August 2008. Prior to
joining our company, Mr. Boruff was a licensed investment banker. He served as a director from 2006 to 2007 of
Cresta Capital Strategies, LLC, a New York investment banking firm that was responsible for closing transactions in the
$150 to $200 million category. Mr. Boruff specialized in investment banking consulting services that included
structuring of direct financings, recapitalizations, mergers and acquisitions, and strategic planning with an emphasis in
the gas and oil field. As a commercial real estate broker for over 20 years, Mr. Boruff developed condominium
projects, hotels, convention centers, golf courses, apartments and residential subdivisions. From April 2009 until July
2012, Mr. Boruff was also a director and 49% owner of Dimirak Securities Corporation, a broker-dealer and member of
FINRA. In July 2012, Mr. Boruff sold his interest in Dimirak and is no longer an owner of that company. See “Certain
Relationships and Related Parties” appearing later in this Annual Report. Mr. Boruff holds a Bachelor of Science in
Business Administration from East Tennessee State University. Mr. Boruff is the son-in-law of Mr. Miller.
25

Management Bios
• David J. Voyticky, Age 44 Mr. Voyticky has been a member of our Board of Directors since April 2010, our President
since June 2011, and our Acting Chief Financial Officer since September 2011. Mr. Voyticky has over 15 years of
domestic and international mergers and acquisitions, restructuring and financing experience. From August 2005 to
June 2011, Mr. Voyticky was an independent consultant to companies in the middle market on value maximization
strategies, providing strategic and capital markets advice to high growth businesses. He served as a vice president with
Goldman, Sachs & Co. from June 2000 to May 2002, a vice president of Houlihan Lokey Howard & Zukin Capital, Inc. in
Los Angeles from July 2002 to January 2005, and an associate with J.P. Morgan in London and New York from June
1996 to May 2000. During that period, he advised public and private domestic and multinational corporations and
financial sponsors on mergers, acquisitions, divestitures, joint ventures, cross-border transactions, anti-raid (defense)
preparation and capital-raising activities. Mr. Voyticky designed and was a founding partner of Red Mountain Capital
Partners. From December 2005 through June 2006, Mr. Voyticky was a partner in the $300 million re-launch of
Chapman Capital L.L.C., an activist hedge fund focused on publicly traded middle market companies. He served on the
Board of Directors of Best Energy Services, Inc. from January 2010 to February 2011. In July 2011, Mr. Voyticky was
named to the board of a biotechnology company, Genesis Biopharma, Inc., a position he resigned from in mid-August,
2013. In January 2012, Mr. Voyticky was named to the board of Mosquito Consolidated Gold Mines, Ltd. Mr. Voyticky
received a J.D. and a M.B.A degree from the University of Michigan and a Masters in International Policy and
Economics from the Ford School at the University of Michigan. He also received a Bachelor of Arts in Philosophy from
Pomona College.
• David M. Hall, Age 44 Mr. Hall has served as our Chief Operating Officer since July 2013. He has been the Chief
Executive Officer of our Cook Inlet Energy subsidiary and member of our Board of Directors since December 2009. Mr.
Hall was the former Vice President and General Manager of Alaska Operations, Pacific Energy Resources Ltd. from
January 2008 to December 2009. Before that time, from 2000 to 2008, he served as the Production Foreman and Lead
Operator in Alaska for Forest Oil Corp, rising to Production Manager for all of Alaska operation for Forest Oil.
26
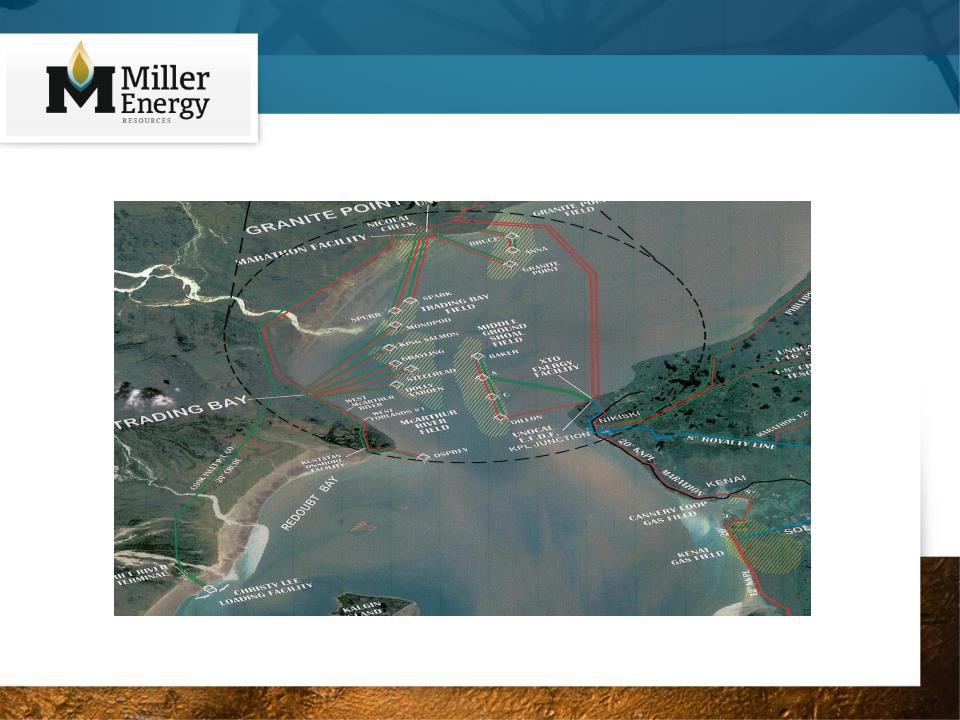
Alaska-Existing Platforms & Pipelines
27

Majors out, Independents In
• Apache, Armstrong, Buccaneer, Furie, Hilcorp, Linc, Nordaq
• Million+ acres acquired recently plus $500MM+ commitment to
exploration/production
exploration/production
• 2 Offshore Jack-Up Rigs Operating in Summer 2013
Premium Natural Gas Prices
• 100% to 400% premium to Lower 48
• Ability to negotiate directly with end users
Proven, Large and Under-explored basin
• Estimated 600 MMBO & 19 TCF gas still in place (USGS study)
• Last major gas discovery: 1979
• 1.4 billion+ barrels of oil and 9.4 trillion cubic feet of natural gas
produced cumulatively
produced cumulatively
• Field size distribution indicates basin still broadly underexplored
• 3D seismic still not applied broadly
• Multiple large untested structures with stacked pays
• 1.3BN BOE yet-to-find potential
Cash incentives (ACES)
• Capital Credits: 40% of qualified capital expenditures
• Loss Carry Forward (LCF): 25% of previous year’s direct lease
expenditures
expenditures
• Cook Inlet does not have any crude oil tax
Alaska Advantages
28

Redoubt Shoal:
• Proved developed producing
• On trend with largest
productive field in the Cook Inlet
productive field in the Cook Inlet
• Originally estimated 70-100
MMBOE, OOIP in two fault
blocks
MMBOE, OOIP in two fault
blocks
• OOIP estimate only includes 2
out of 6 fault blocks
out of 6 fault blocks
• Redoubt Field, largest
undeveloped field?
undeveloped field?
• Similar geological
characteristics as adjacent fields
characteristics as adjacent fields
Cook Inlet Field(s) Comparison
29

Existing Fields - Development Impact
30

• Proved, producing Field, existing infrastructure
• 100% working interest
• Ralph E Davis booked reserves
• 1P = 5.85 MMBOE
• 2P = 5.16 MMBOE
• 3P = 0.99 MMBOE
• Multiple pay sands and on trend with adjacent
McArthur River Field (produced over 643 MMBOE)
McArthur River Field (produced over 643 MMBOE)
• Many identified targets (5 WO, 13 new wells)
Alaska - Redoubt Unit Field (Osprey)
• OOIP: 70-100 MMBOE (partial)
• Cum Production : ~ 2.5 MMBOE
• Avg Porosity: 11-13 %
• Avg Initial Prod: ~1,000 BOED
• Avg Annual Decline: 10% (Miller)
• Avg EUR (estimate): ~ 1 MMBOE
• Avg New Well Capex: $10 MM (Net)
• Avg IRR (New Well): ~350 %
Highlights
31

• Positive DST tests in North & South Step
Outs in 1960s
Outs in 1960s
• RU-1 drilled in Central fault in 2001
• 1,089 IP & 10MM bbls PUD
• RU-2 drilled in South fault 2002
• 1,954 IP & 40MM bbls PUD
• Wells have initial production
characteristics of other fields in Cook
Inlet; but different completions
characteristics of other fields in Cook
Inlet; but different completions
• Operator experienced reduction in flow
rates & bottom hole flowing pressure
rates & bottom hole flowing pressure
• RU-1, 2, 3, 5 experience casing failures
and other performance issues
and other performance issues
• Reserves from Central & Southern fault
blocks reduced to 6MM bbls PUD
blocks reduced to 6MM bbls PUD
Highlights
Redoubt Shoal Hemlock Structure Map
32
• Orig Oil in Place: 50-75 MMBOE
• Cum Production: ~ 13.09 MMBOE
• Avg Porosity: 11-14 %
• Avg Initial Prod: >1,500 BOED
• Avg Annual Decline: 10% (Miller)
• Avg EUR: ~ 2 MMBOE
• Avg New Well Capex: $9 MM (Net)
• Avg IRR: (New Well) ~500 %
• Proved, producing Field, existing infrastructure
• 100% working interest
• Ralph E Davis booked reserves*
• 1P = 2.60 MMBOE
• 2P = 2.19 MMBOE
• Multiple pay sands and on trend with adjacent
Trading Bay Field (produced over 103 MMBOE)
• Many identified targets (3 WO, 3 new wells)
*Includes Sabre, Sword Reserves
Highlights
Alaska - West McArthur River Unit
33

Production Scenario Matrix
|
ANS
Oil Price
|
1,000 BOED
|
2,000 BOED
|
3,000 BOED
|
4,000 BOED
|
|
$90/bbl
|
$22.4
|
$44.8
|
$67.2
|
$89.6
|
|
$100/bbl
|
$25.2
|
$50.3
|
$75.5
|
$100.6
|
|
$110/bbl
|
$27.9
|
$55.8
|
$83.7
|
$111.7
|
Hypothetical Incremental 1 Year EBITDAX from Incremental Alaskan Oil Production
(based on 15% annual decline curve)
34

Reducing Our Cost of Capital
2013
2012
2011
2010
2009
• $20MM at 9% under Senior Credit Facility with Apollo Investment Corp.
• At-the-Market Agreement with MLV for sales of Series C Preferred Stock
• Series C 10.75% Perpetual Preferred (NYSE:MILL.C)
• $25/share face value
• $10/share conversion price callable at $15/share
• Series B Preferred Stock with accredited investors
• $100MM 5-Year Senior Secured Credit Facility by Apollo Investment Corp. at 18%
• Series A Preferred Stock with accredited investors (fully redeemed)
• $100MM Credit Facility with Guggenheim Corporate Funding, LLC, Citi, and Bristol Investment Fund
• $5MM line of credit with Plains Capital Bank personally guaranteed by Scott Boruff and Deloy Miller
• Private placement of common stock at $3.50/share to accredited investors
• Private placement of common stock at $1.00/share to accredited investors
• 6% convertible note program with accredited investors
• Miller Energy Income 2009-A, LP program with accredited investors
35

Contact
Miller Energy Resources, Inc.
9721 Cogdill Road, Suite 302
Knoxville, TN 37932-3425
Phone: 865-223-6575
9721 Cogdill Road, Suite 302
Knoxville, TN 37932-3425
Phone: 865-223-6575
info@millerenergyresources.com
www.millerenergyresources.com
www.millerenergyresources.com
Investor Relations
MZ Group - North America
Derek Gradwell
SVP, Natural Resources
Phone: 949-259-4995
dgradwell@mzgroup.us
www.mzgroup.us
Derek Gradwell
SVP, Natural Resources
Phone: 949-259-4995
dgradwell@mzgroup.us
www.mzgroup.us
36