Attached files
| file | filename |
|---|---|
| 8-K - FORM 8-K - DONEGAL GROUP INC | d598976d8k.htm |
Exhibit 99.1
|
|
Pursuing Effective Business Strategy in Regional Insurance Markets
Investor Presentation September 2013
|
|
Forward-Looking Statements
The Company bases all statements made in this presentation that are not historic facts on its current expectations. These statements are forward-looking in nature (as defined in the Private Securities Litigation Reform Act of 1995) and involve a number of risks and uncertainties. Actual results could vary materially. Factors that could cause actual results to vary materially include: the Company’s ability to maintain profitable operations, the adequacy of the loss and loss expense reserves of the
Company’s insurance subsidiaries, business and economic conditions in the areas in which the
Company operates, interest rates, competition from various insurance and other financial businesses, terrorism, the availability and cost of reinsurance, adverse and catastrophic weather events, legal and judicial developments, changes in regulatory requirements, the Company’s ability to integrate and manage successfully the companies it may acquire from time to time and other risks the Company describes from time to time in the periodic reports it files with the Securities and Exchange Commission. You should not place undue reliance on any such forward-looking statements. The Company disclaims any obligation to update such statements or to announce publicly the results of any revisions that it may make to any forward-looking statements to reflect the occurrence of anticipated or unanticipated events or circumstances after the date of such statements.
Reconciliations of non-GAAP data are available on the Company’s website at investors.donegalgroup.com in the Company’s news releases regarding quarterly financial results.
| 2 |
|
|
|
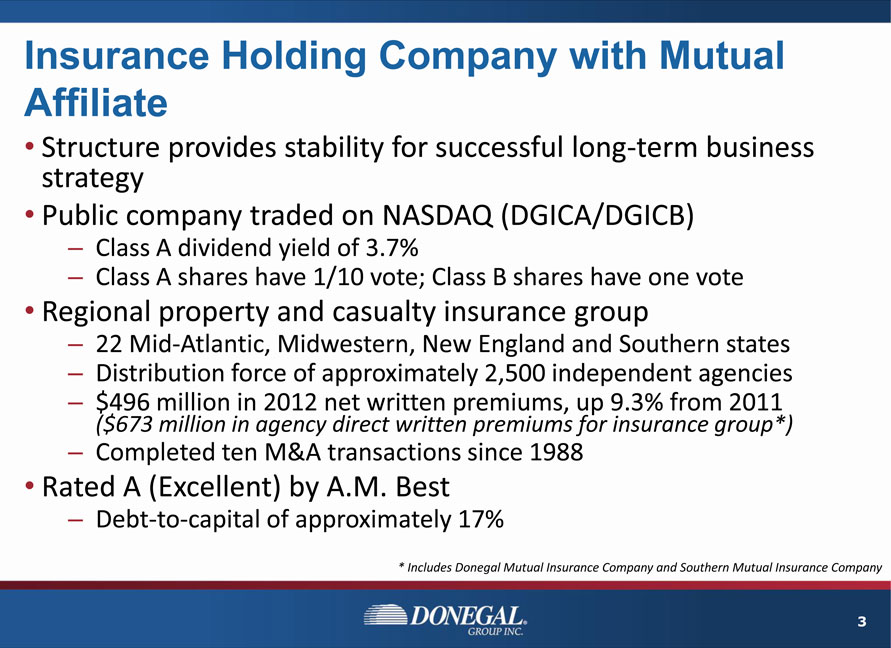
Insurance Holding Company with Mutual Affiliate
Structure provides stability for successful long-term business strategy
Public company traded on NASDAQ (DGICA/DGICB)
Class A dividend yield of 3.7%
Class A shares have 1/10 vote; Class B shares have one vote
Regional property and casualty insurance group
22 Mid-Atlantic, Midwestern, New England and Southern states
Distribution force of approximately 2,500 independent agencies
$496 million in 2012 net written premiums, up 9.3% from 2011 ($673 million in agency direct written premiums for insurance group*)
Completed ten M&A transactions since 1988
Rated A (Excellent) by A.M. Best
Debt-to-capital of approximately 17%
| * |
|
Includes Donegal Mutual Insurance Company and Southern Mutual Insurance Company |
| 3 |
|
|
|
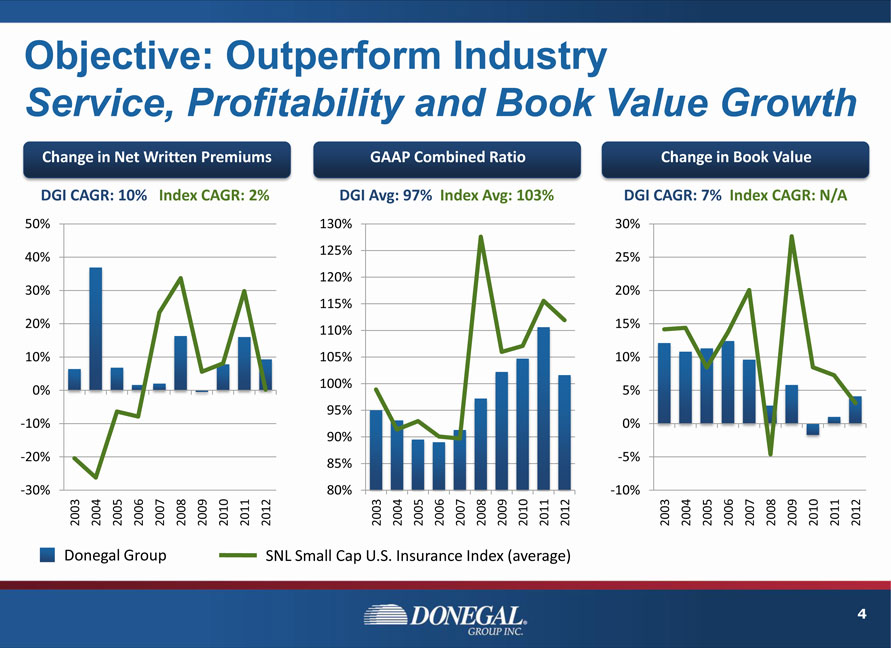
Objective: Outperform Industry
Service, Profitability and Book Value Growth
Change in Net Written Premiums
DGI CAGR: 10% Index CAGR: 2%
50% 40% 30% 20% 10% 0% -10% -20% -30%
2003 2004 2005 2006 2007 2008 2009 2010 2011 2012
GAAP Combined Ratio
DGI Avg: 97% Index Avg: 103%
130% 125% 120% 115% 110% 105% 100% 95% 90% 85% 80%
2003 2004 2005 2006 2007 2008 2009 2010 2011 2012
Change in Book Value
DGI CAGR: 7% Index CAGR: N/A
30% 25% 20% 15% 10% 5% 0% -5% -10%
2003 2004 2005 2006 2007 2008 2009 2010 2011 2012
Donegal Group SNL Small Cap U.S. Insurance Index (average)
| 4 |
|
|
|
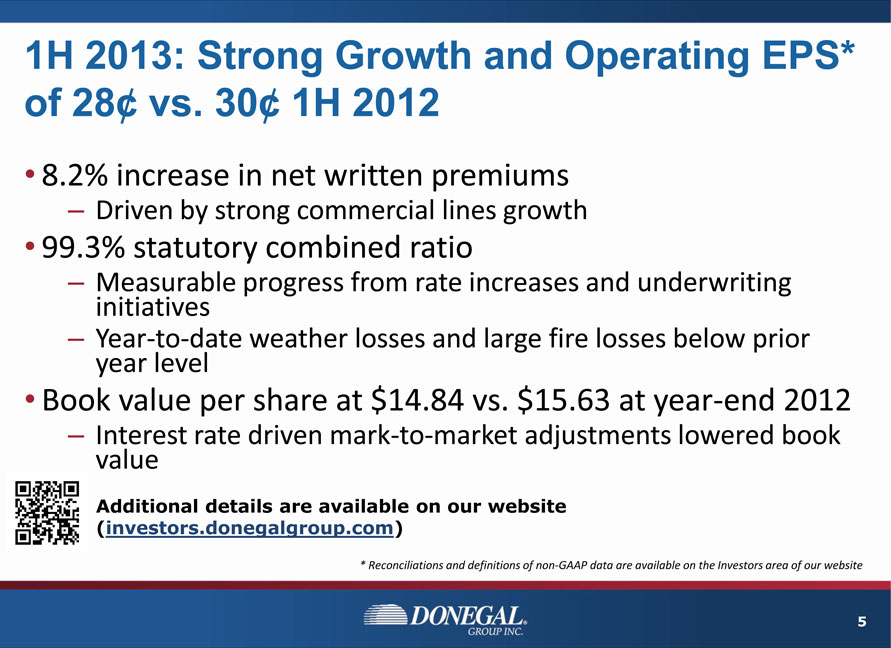
1H 2013: Strong Growth and Operating EPS* of 28¢ vs. 30¢ 1H 2012
8.2% increase in net written premiums
Driven by strong commercial lines growth
99.3% statutory combined ratio
Measurable progress from rate increases and underwriting initiatives
Year-to-date weather losses and large fire losses below prior year level
Book value per share at $14.84 vs. $15.63 at year-end 2012
Interest rate driven mark-to-market adjustments lowered book value
Additional details are available on our website (investors.donegalgroup.com)
| * |
|
Reconciliations and definitions of non-GAAP data are available on the Investors area of our website |
| 5 |
|
|
|
Achieve Book Value Growth By Implementing Plan
Drive revenues with opportunistic transactions and organic growth
Focus on margin enhancements and investment contributions
|
|
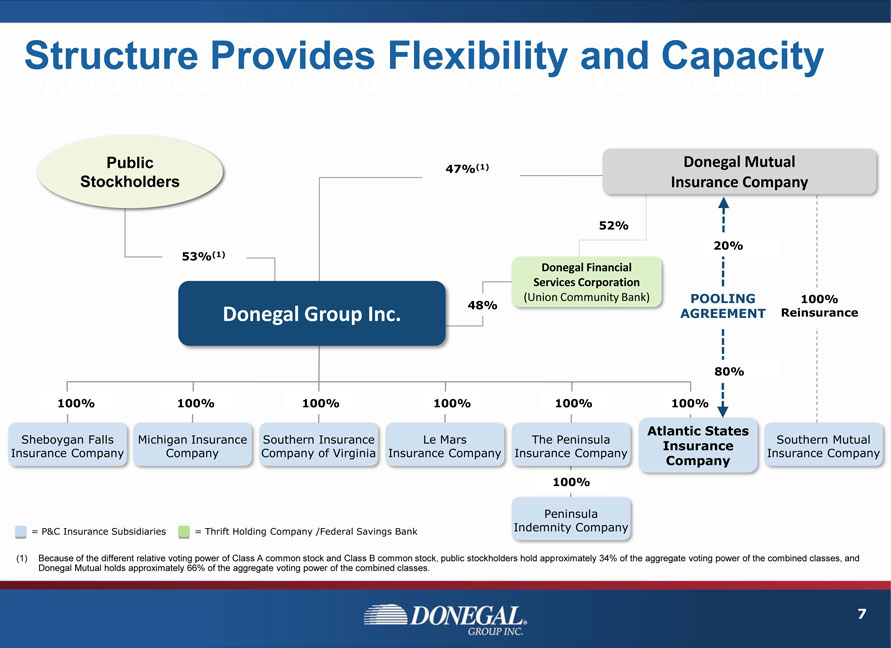
Structure Provides Flexibility and Capacity
Public Stockholders 47%(1)
Donegal Mutual Insurance Company
53%(1) 52% 20%
Donegal Financial Services Corporation
(Union Community Bank)
Donegal Group Inc.
48%
POOLING AGREEMENT
100% Reinsurance
80% 100% 100% 100% 100% 100% 100%
Sheboygan Falls Insurance Company
Michigan Insurance Company
Southern Insurance Company of Virginia
Le Mars Insurance Company
The Peninsula Insurance Company
Atlantic States Insurance Company
Southern Mutual Insurance Company 100%
Peninsula Indemnity Company
= P&C Insurance Subsidiaries
= Thrift Holding Company /Federal Savings Bank
(1) Because of the different relative voting power of Class A common stock and Class B common stock, public stockholders hold approximately 34% of the aggregate voting power of the combined classes, and Donegal Mutual holds approximately 66% of the aggregate voting power of the combined classes.
| 7 |
|
|
|
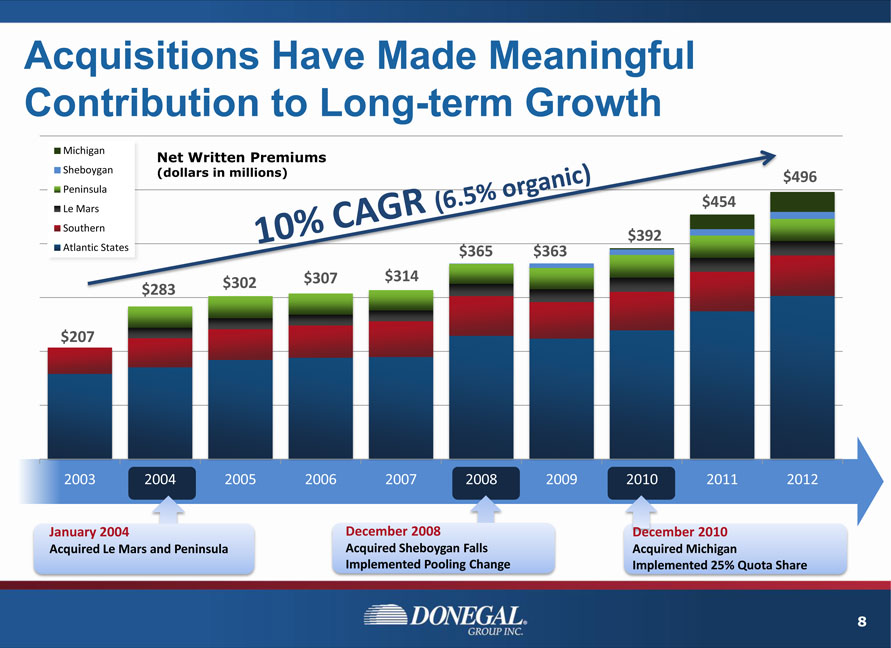
Acquisitions Have Made Meaningful Contribution to Long-term Growth
Michigan Sheboygan Peninsula Le Mars Southern Atlantic States
Net Written Premiums
(dollars in millions)
10% CAGR (6.5% organic)
$207
$283
$302
$307
$314
$365
$363
$392
$454
$496
2003 2004 2005 2006 2007 2008 2009 2010 2011 2012
January 2004
Acquired Le Mars and Peninsula
December 2008
Acquired Sheboygan Falls Implemented Pooling Change
December 2010
Acquired Michigan Implemented 25% Quota Share
| 8 |
|
|
|
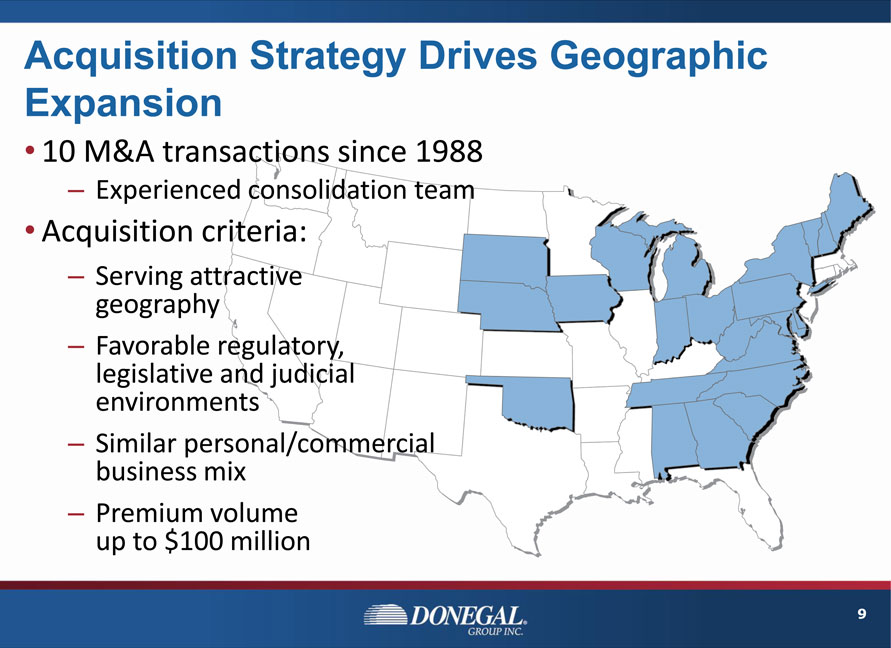
Acquisition Strategy Drives Geographic Expansion
10 M&A transactions since 1988
Experienced consolidation team
Acquisition criteria:
Serving attractive geography
Favorable regulatory, legislative and judicial environments
Similar personal/commercial business mix
Premium volume up to $100 million
9
|
|
Example: Southern Mutual Insurance Co.
Affiliation with Donegal Mutual in 2009
Donegal Mutual surplus note investment of $2.5 million
$16.8 million in 2012 direct written premiums
100% quota share reinsurance with Donegal Mutual
SMIC cedes underwriting results to Donegal Mutual
Donegal Mutual includes business in pooling agreement with Atlantic States (80% of SMIC business to Donegal Group)
Expanded market presence in Georgia and South Carolina
Serves as model for mutual-to-mutual affiliations
10
|
|
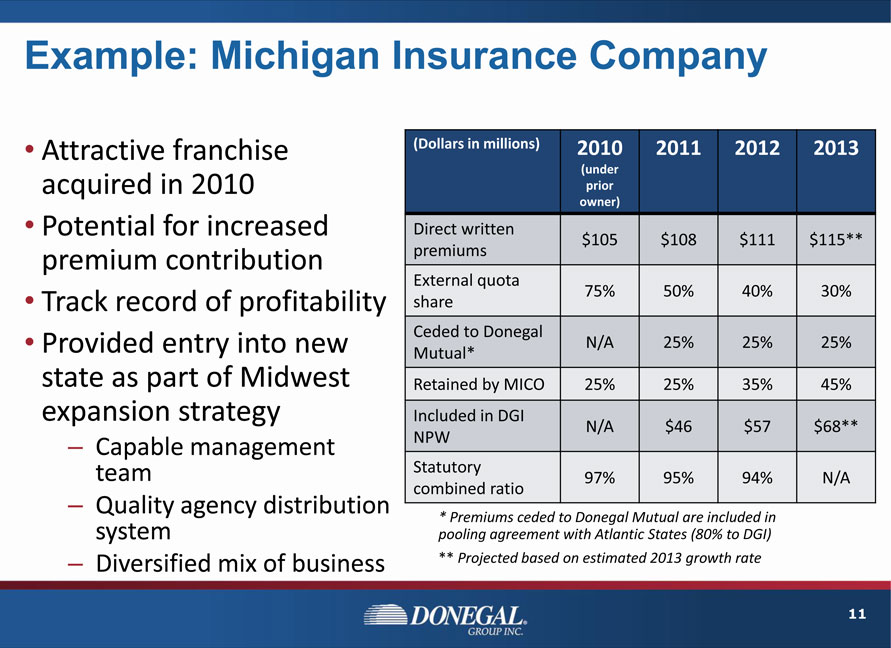
Example: Michigan Insurance Company
Attractive franchise acquired in 2010
Potential for increased premium contribution
Track record of profitability
Provided entry into new state as part of Midwest expansion strategy
Capable management team
Quality agency distribution system
Diversified mix of business
(Dollars in millions)
2010 (under prior owner)
2011
2012
2013
Direct written premiums $105 $108 $111 $115**
External quota share 75% 50% 40% 30%
Ceded to Donegal Mutual* N/A 25% 25% 25%
Retained by MICO 25% 25% 35% 45%
Included in DGI NPW N/A $46 $57 $68**
Statutory combined ratio 97% 95% 94% N/A
| * |
|
Premiums ceded to Donegal Mutual are included in pooling agreement with Atlantic States (80% to DGI) |
** Projected based on estimated 2013 growth rate
11
|
|
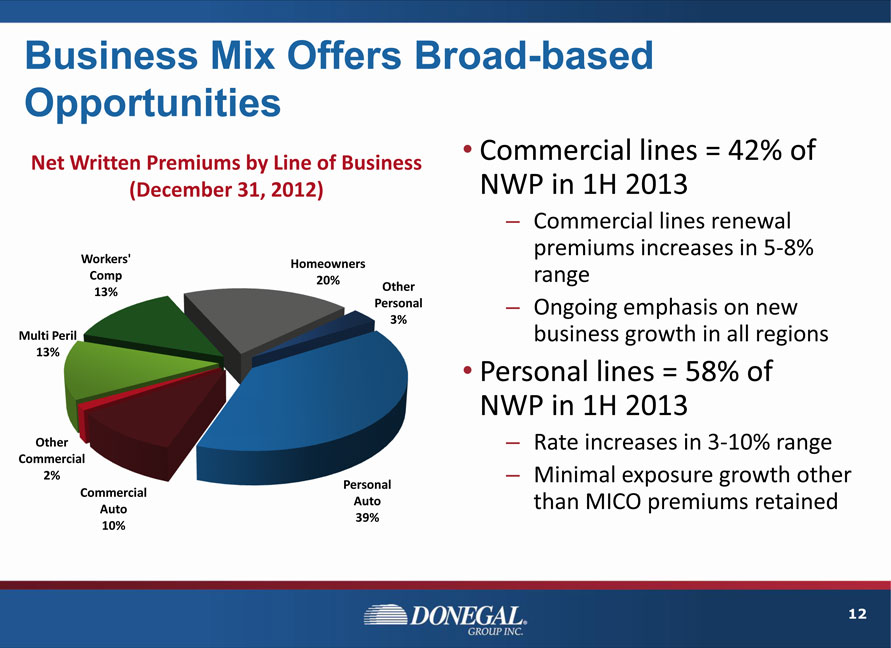
Business Mix Offers Broad-based Opportunities
Net Written Premiums by Line of Business (December 31, 2012)
Commercial lines = 42% of NWP in 1H 2013
Commercial lines renewal premiums increases in 5-8% range
Ongoing emphasis on new business growth in all regions
Personal lines = 58% of NWP in 1H 2013
Rate increases in 3-10% range
Minimal exposure growth other than MICO premiums retained
Workers’ Comp 13%
Multi Peril 13%
Other Commercial 2%
Commercial Auto 10%
Personal Auto 39%
Other Personal 3%
Homeowners 20%
12
|
|
Organic Growth Centered on Relationships with ~2,500 Independent Agencies
Ongoing objectives:
Achieve top three ranking within appointed agencies in lines of business we write
Leverage “regional” advantages and maintain personal relationships as agencies grow and consolidate
Continuing focus on commercial lines growth in 2013:
Emphasize expanded commercial lines products and capabilities in current agencies
Appoint commercial lines focused agencies to expand distribution in key geographies
Strengthen relationships with agencies appointed in recent years
13
|
|
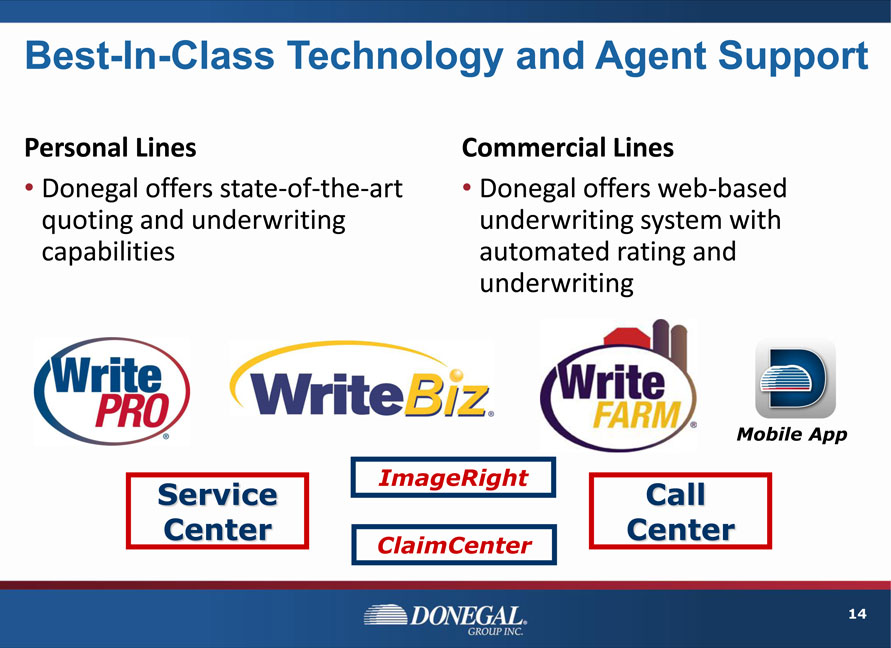
Best-In-Class Technology and Agent Support
Personal Lines
Donegal offers state-of-the-art quoting and underwriting capabilities
Commercial Lines
Donegal offers web-based underwriting system with automated rating and underwriting
14
|
|
Achieve Book Value Growth By Implementing Plan
Drive revenues with opportunistic transactions and organic growth
Focus on margin enhancements and investment contributions
|
|
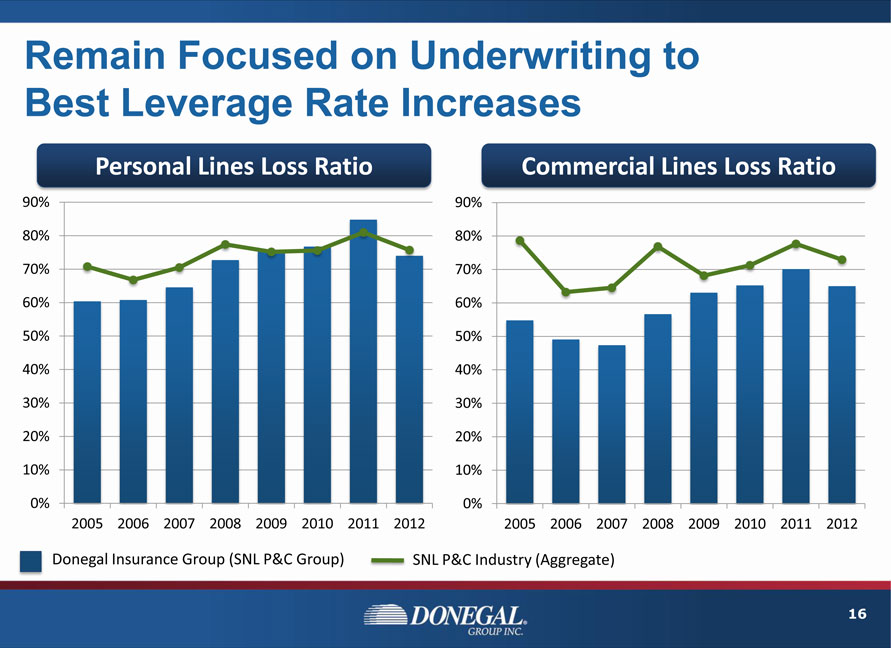
Remain Focused on Underwriting to Best Leverage Rate Increases
Personal Lines Loss Ratio
90% 80% 70% 60% 50% 40% 30% 20% 10% 0%
2005 2006 2007 2008 2009 2010 2011 2012
Commercial Lines Loss Ratio
90% 80% 70% 60% 50% 40% 30% 20% 10% 0%
2005 2006 2007 2008 2009 2010 2011 2012
Donegal Insurance Group (SNL P&C Group) SNL P&C Industry (Aggregate)
16
|
|
Focus on Underwriting Profitability
Sustain pricing discipline and conservative underwriting
Manage exposure to catastrophe/unusual weather events
Purchase reinsurance coverage in excess of a one-in-200 year event
Link employee compensation directly to underwriting performance
Focus on rate adequacy and pricing sophistication
Leverage centralized oversight of regional underwriting
Emphasize IT-based programs such as automated decision trees and predictive modeling
17
|
|
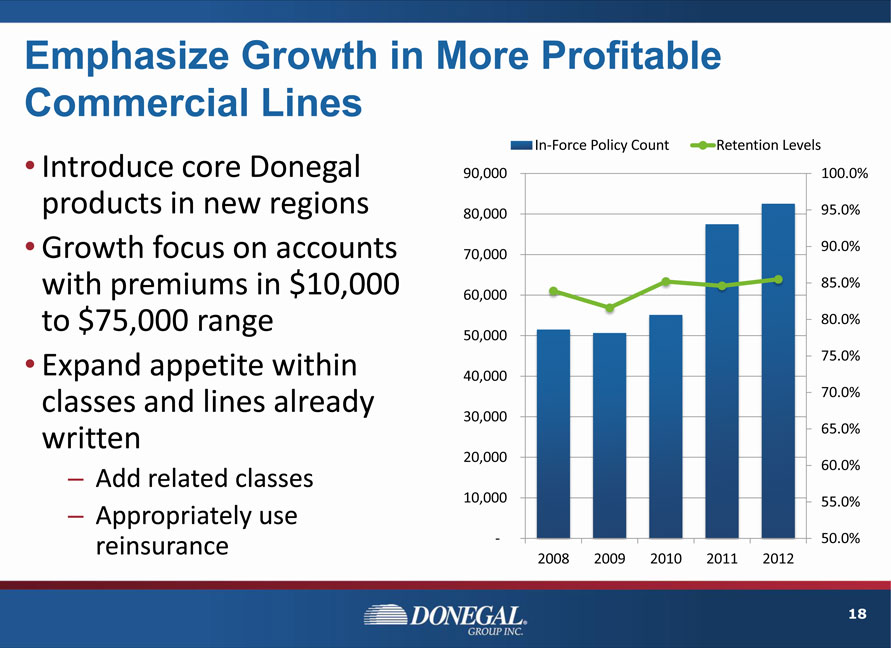
Emphasize Growth in More Profitable Commercial Lines
Introduce core Donegal products in new regions
Growth focus on accounts with premiums in $10,000 to $75,000 range
Expand appetite within classes and lines already written
Add related classes
Appropriately use reinsurance
In-Force Policy Count Retention Levels
90,000 80,000 70,000 60,000 50,000 40,000 30,000 20,000 10,000—
2008 2009 2010 2011 2012
100.0% 95.0% 90.0% 85.0% 80.0% 75.0% 70.0% 65.0% 60.0% 55.0% 50.0%
18
|
|
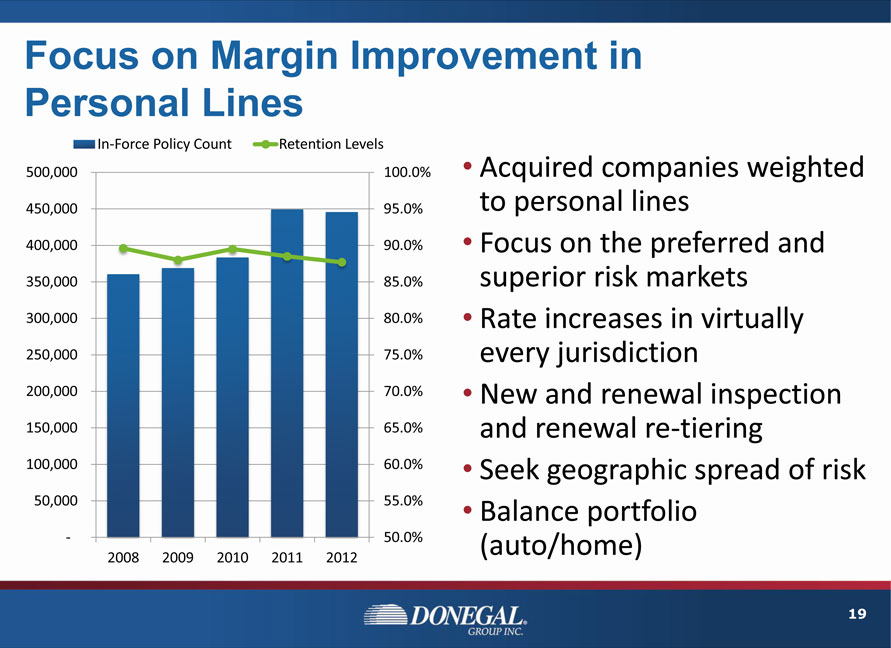
Focus on Margin Improvement in Personal Lines
Acquired companies weighted to personal lines
Focus on the preferred and superior risk markets
Rate increases in virtually every jurisdiction
New and renewal inspection and renewal re-tiering
Seek geographic spread of risk
Balance portfolio (auto/home)
In-Force Policy Count Retention Levels
500,000 450,000 400,000 350,000 300,000 250,000 200,000 150,000 100,000 50,000—
100.0% 95.0% 90.0% 85.0% 80.0% 75.0% 70.0% 65.0% 60.0% 55.0% 50.0%
2008 2009 2010 2011 2012
19
|
|
Employ Sophisticated Pricing and Actuarial Tools
Predictive modeling tools enhance our ability to appropriately price our products
Sophisticated predictive modeling algorithms for pricing/tiering risks
Territorial segmentation and analysis of environmental factors that affect loss experience
Exploring tools that allow consideration of vehicle-specific data in pricing
External information sources allow us to develop price optimization strategies
Formal schedule of regular rate adequacy reviews for all lines of business, including GLM analysis on claim costs and agency performance
Currently evaluating usage-based insurance tools
20
|
|
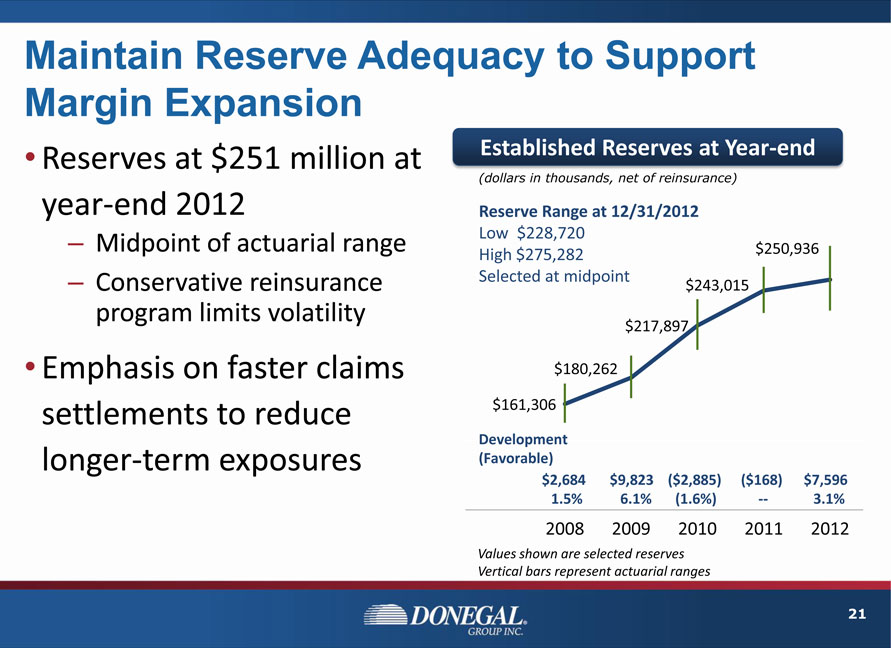
Maintain Reserve Adequacy to Support Margin Expansion
Reserves at $251 million at year-end 2012
Midpoint of actuarial range
Conservative reinsurance program limits volatility
Emphasis on faster claims settlements to reduce longer-term exposures
Established Reserves at Year-end (dollars in thousands, net of reinsurance)
Reserve Range at 12/31/2012
Low $228,720 High $275,282 Selected at midpoint
$161,306
$180,262
$217,897
$243,015
$250,936
Development (Favorable)
$2,684 $9,823 ($2,885) ($168) $7,596 1.5% 6.1% (1.6%) — 3.1%
2008 2009 2010 2011 2012
Values shown are selected reserves Vertical bars represent actuarial ranges
21
|
|
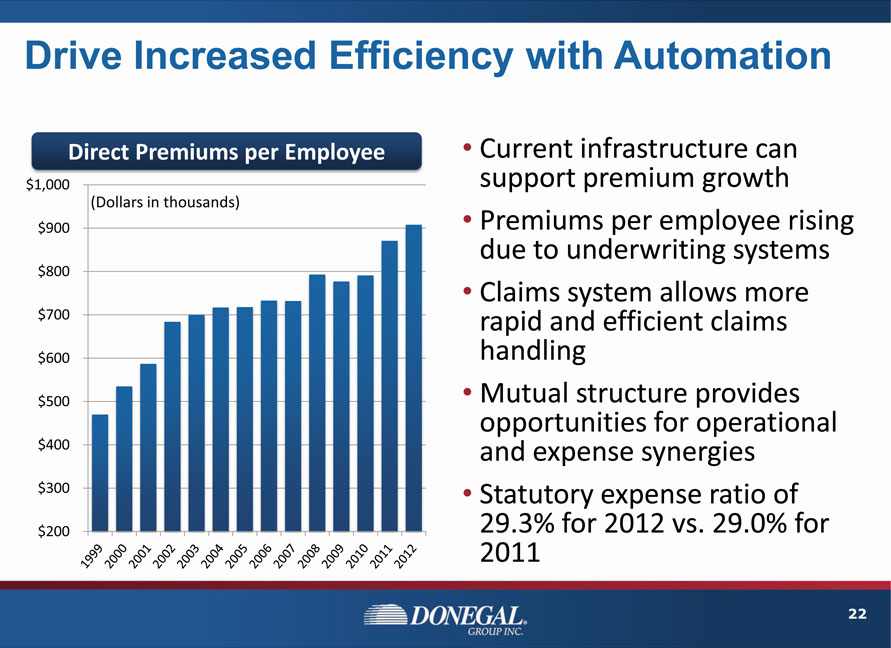
Drive Increased Efficiency with Automation
Direct Premiums per Employee
$1,000 $900 $800 $700 $600 $500 $400 $300 $200
(Dollars in thousands)
1999 2000 2001 2002 2003 2004 2005 2006 2007 2008 2009 2010 2011 2012
Current infrastructure can support premium growth
Premiums per employee rising due to underwriting systems
Claims system allows more rapid and efficient claims handling
Mutual structure provides opportunities for operational and expense synergies
Statutory expense ratio of 29.3% for 2012 vs. 29.0% for 2011
22
|
|
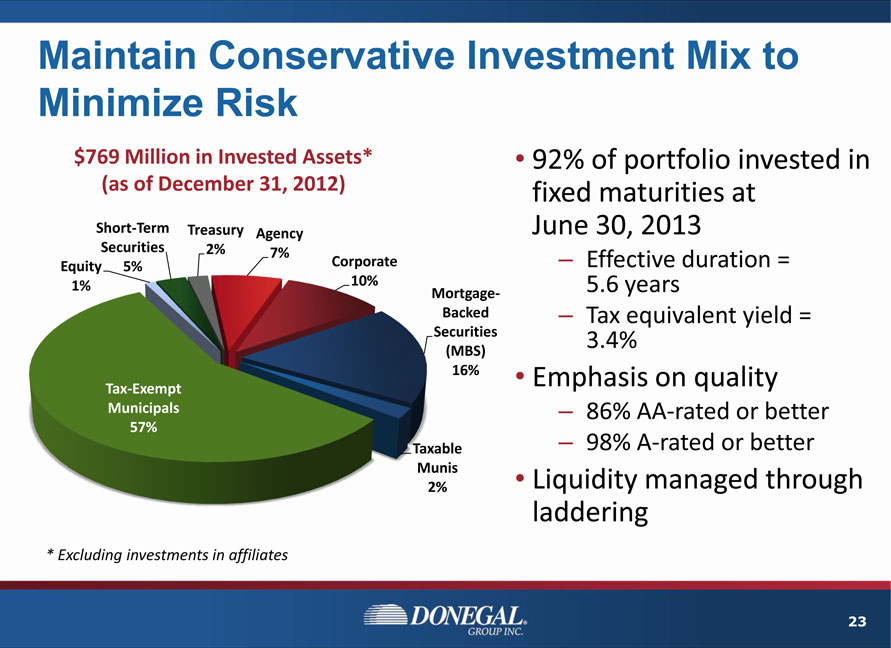
Maintain Conservative Investment Mix to Minimize Risk
$769 Million in Invested Assets* (as of December 31, 2012)
Equity 1%
Short-Term Securities 5%
Treasury 2%
Agency 7%
Corporate 10%
Mortgage-Backed Securities (MBS) 16%
Taxable Munis 2%
Tax-Exempt Municipals 57%
| * |
|
Excluding investments in affiliates |
92% of portfolio invested in fixed maturities at June 30, 2013
Effective duration = 5.6 years
Tax equivalent yield = 3.4%
Emphasis on quality
86% AA-rated or better
98% A-rated or better
Liquidity managed through laddering
23
|
|
Donegal Financial Services Corporation Bank Investment = 5% of Invested Assets
DFSC owns 100% of Union Community Bank
Serves Lancaster County (location of Donegal headquarters)
Expanded to 13 branches via acquisition in May 2011
Added scale to banking operation
Enhanced value of historic bank investment
Increased potential for bottom-line contribution
DGI owns approximately 48% of DFSC
52% owned by Donegal Mutual
Union Community Bank is financially strong and profitable
24
|
|
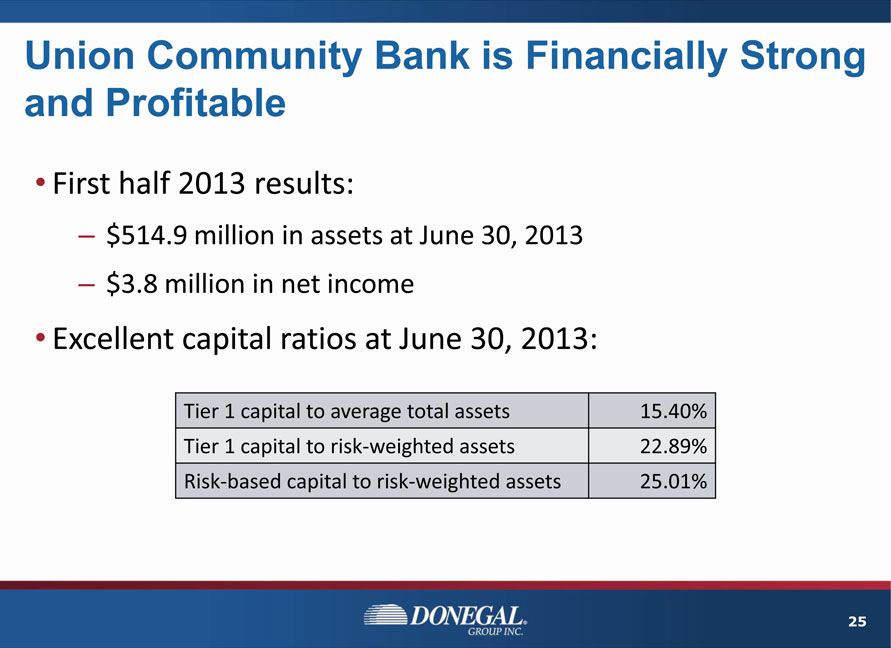
Union Community Bank is Financially Strong and Profitable
First half 2013 results:
$514.9 million in assets at June 30, 2013
$3.8 million in net income
Excellent capital ratios at June 30, 2013:
Tier 1 capital to average total assets 15.40%
Tier 1 capital to risk-weighted assets 22.89%
Risk-based capital to risk-weighted assets 25.01%
25
|
|
Achieve Book Value Growth By Implementing Plan
Drive revenues with opportunistic transactions and organic growth Focus on margin enhancements and investment contributions
|
|
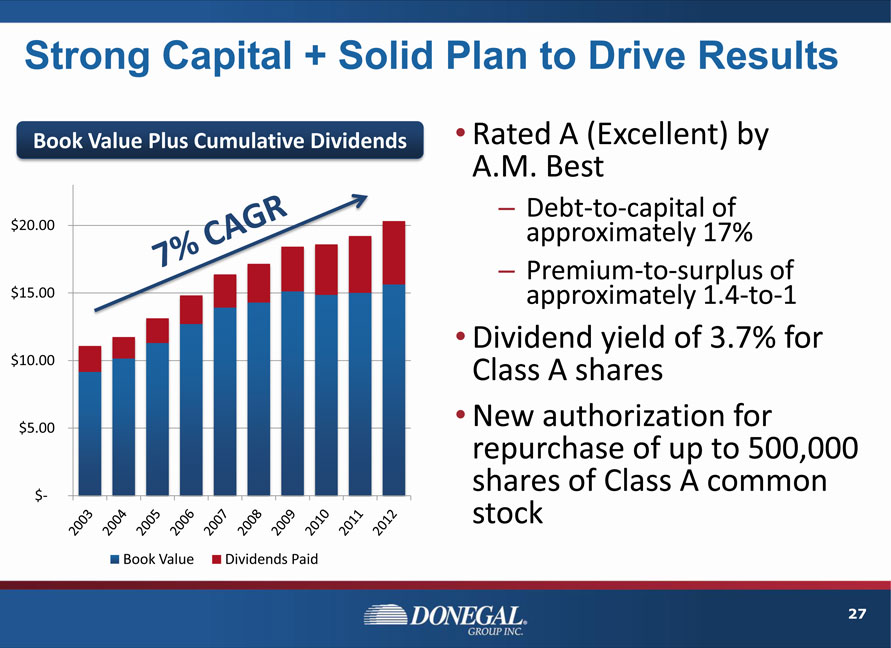
Strong Capital + Solid Plan to Drive Results
Book Value Plus Cumulative Dividends
$20.00 $15.00 $10.00 $5.00 $-
7% CAGR
2003 2004 2005 2006 2007 2008 2009 2010 2011 2012
Rated A (Excellent) by
A.M. Best
Debt-to-capital of approximately 17%
Premium-to-surplus of approximately 1.4-to-1
Dividend yield of 3.7% for Class A shares
New authorization for repurchase of up to 500,000 shares of Class A common stock
27
|
|
Structure Provides Stability to Pursue Successful Long-Term Business Strategy
Regional property casualty insurance company
Insurance holding company with mutual affiliate
Objective to outperform industry in service, profitability and book value growth
Drive revenues with opportunistic transactions and organic growth
10% CAGR in net written premiums since 2002
Focus on margin enhancements and investment contributions
28
|
|
Supplemental Information
|
|
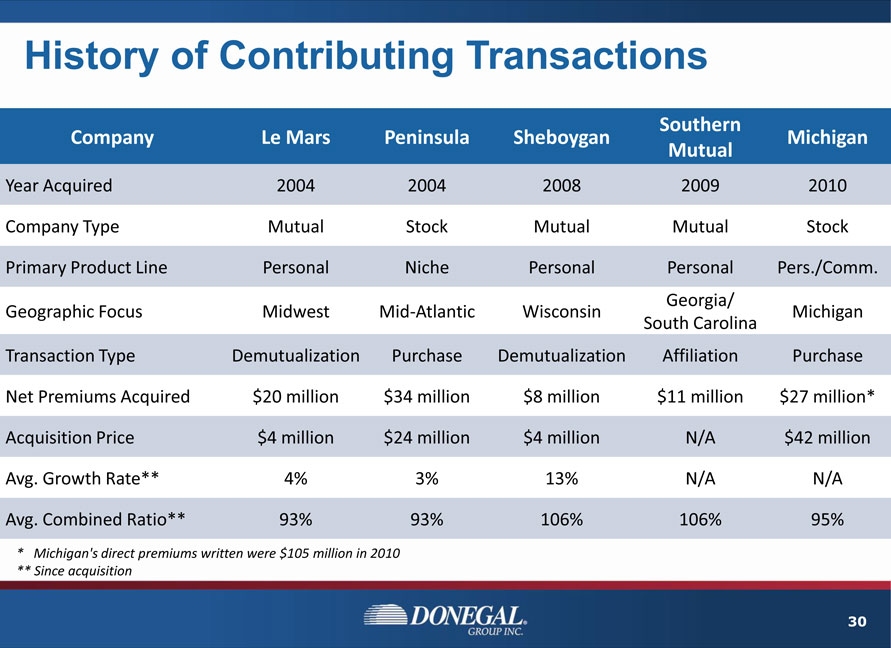
History of Contributing Transactions
Company Le Mars Peninsula Sheboygan Southern
Mutual Michigan
Year Acquired 2004 2004 2008 2009 2010
Company Type Mutual Stock Mutual Mutual Stock
Primary Product Line Personal Niche Personal Personal Pers./Comm.
Geographic Focus Midwest Mid-Atlantic Wisconsin Georgia/ South Carolina Michigan
Transaction Type Demutualization Purchase Demutualization Affiliation Purchase
Net Premiums Acquired $20 million $ 34 million $ 8 million $11 million $27 million*
Acquisition Price $4 million $ 24 million $ 4 million N/A $42 million
Avg. Growth Rate** 4% 3% 13% N/A N/A
Avg. Combined Ratio** 93% 93% 106% 106% 95%
| * |
|
Michigan’s direct premiums written were $105 million in 2010 |
** Since acquisition
30
|
|
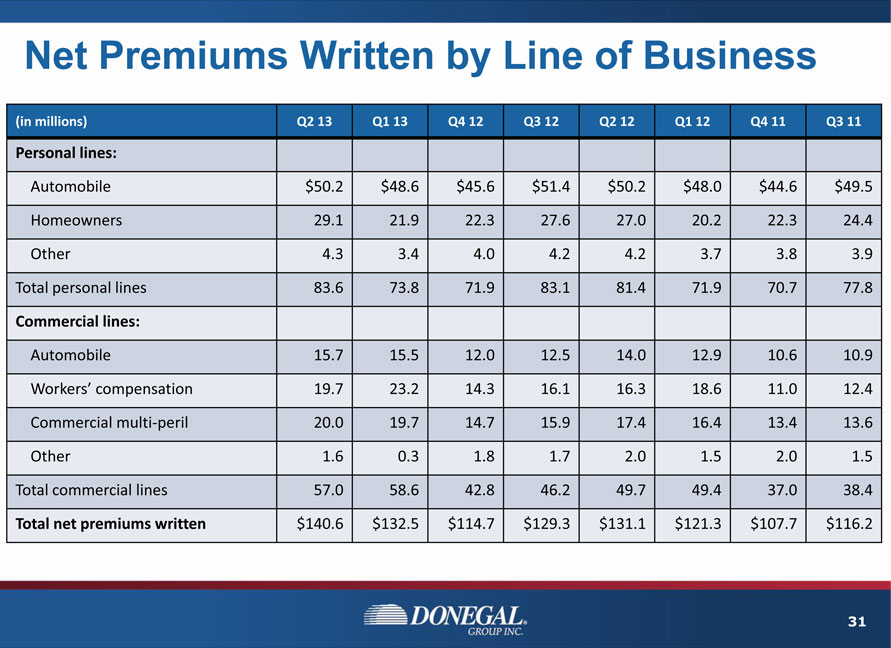
Net Premiums Written by Line of Business
(in millions) Q2 13 Q1 13 Q4 12 Q3 12 Q2 12 Q1 12 Q4 11 Q3 11
Personal lines:
Automobile $50.2 $48.6 $45.6 $51.4 $50.2 $48.0 $44.6 $49.5
Homeowners 29.1 21.9 22.3 27.6 27.0 20.2 22.3 24.4
Other 4.3 3.4 4.0 4.2 4.2 3.7 3.8 3.9
Total personal lines 83.6 73.8 71.9 83.1 81.4 71.9 70.7 77.8
Commercial lines:
Automobile 15.7 15.5 12.0 12.5 14.0 12.9 10.6 10.9
Workers’ compensation 19.7 23.2 14.3 16.1 16.3 18.6 11.0 12.4
Commercial multi-peril 20.0 19.7 14.7 15.9 17.4 16.4 13.4 13.6
Other 1.6 0.3 1.8 1.7 2.0 1.5 2.0 1.5
Total commercial lines 57.0 58.6 42.8 46.2 49.7 49.4 37.0 38.4
Total net premiums written $140.6 $132.5 $114.7 $129.3 $131.1 $121.3 $107.7 $116.2
31
|
|
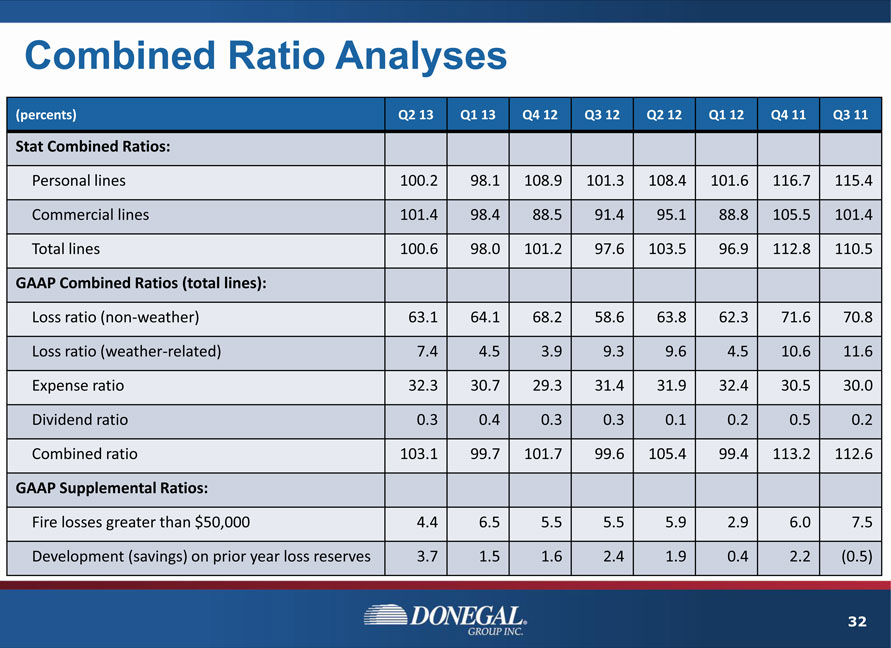
Combined Ratio Analyses
(percents) Q2 13 Q1 13 Q4 12 Q3 12 Q2 12 Q1 12 Q4 11 Q3 11
Stat Combined Ratios:
Personal lines 100.2 98.1 108.9 101.3 108.4 101.6 116.7 115.4
Commercial lines 101.4 98.4 88.5 91.4 95.1 88.8 105.5 101.4
Total lines 100.6 98.0 101.2 97.6 103.5 96.9 112.8 110.5
GAAP Combined Ratios (total lines):
Loss ratio (non-weather) 63.1 64.1 68.2 58.6 63.8 62.3 71.6 70.8
Loss ratio (weather-related) 7.4 4.5 3.9 9.3 9.6 4.5 10.6 11.6
Expense ratio 32.3 30.7 29.3 31.4 31.9 32.4 30.5 30.0
Dividend ratio 0.3 0.4 0.3 0.3 0.1 0.2 0.5 0.2
Combined ratio 103.1 99.7 101.7 99.6 105.4 99.4 113.2 112.6
GAAP Supplemental Ratios:
Fire losses greater than $50,000 4.4 6.5 5.5 5.5 5.9 2.9 6.0 7.5
Development (savings) on prior year loss reserves 3.7 1.5 1.6 2.4 1.9 0.4 2.2 (0.5)
32
|
|

Pursuing Effective Business Strategy in Regional Insurance Markets
For Further Information: Jeffrey D. Miller
Senior Vice President and Chief Financial Officer Phone: (717) 426-1931 E-mail: investors@donegalgroup.com Website: investors.donegalgroup.com