Attached files
| file | filename |
|---|---|
| 8-K - HINES REIT PROXY RESULTS AND SHAREHOLDER PRESENTATION 8-K - HINES REAL ESTATE INVESTMENT TRUST INC | hinesreit2013proxyresultsp.htm |

Hines REIT 2013 Shareholder Meeting 2013 Shareholder Meeting Hines Real Estate Investment Trust, Inc. Sherri Schugart President and CEO
Hines REIT 2013 Shareholder Meeting Commenced capital raising in 2004 and raised $2.5 billion of capital between then and the end of 2009 Raised and invested significant capital in 2006 and 2007, a period which represented a peak in the last economic cycle and real estate cycle In 2008 and 2009, amidst the global financial crisis, we experienced significant declines in capital raising and significant increases in redemption requests At the end of 2009, capital raising ceased and we suspended our redemption plan to prudently preserve liquidity and protect the company’s financial position 2
Hines REIT 2013 Shareholder Meeting Since 2009, the Company has been focused on the following: Leasing: Keeping our tenants in occupancy to preserve and maintain operating income and values Strategic asset sales: Identifying opportunities to sell certain stabilized assets to harvest liquidity and attractive profits • One Wilshire, Raytheon/DIRECTV Buildings, Williams Tower, Distribution Park Rio, 499 Park Avenue, 425 Lexington Avenue, 1200 19th Street Liquidity: Ensuring we have sufficient funds to meet liquidity needs for operating expenses, leasing capital, and debt refinancings, while still maintaining reasonable levels of distributions to our shareholders We continue to be patient and disciplined in managing our portfolio in order to benefit from the slow but steady economic U.S. office market recovery 3
Hines REIT 2013 Shareholder Meeting Portfolio Summary Total real estate assets of approximately $2.3B Interests in 43 properties totaling approximately 19.4 million square feet Weighted average occupancy of 84% Current leverage percentage of 50% with weighted average interest rate of 4.5% 4 1. Data as of June 30, 2013 and based on Hines REIT’s pro rata ownership. Excludes One Wilshire and Raytheon/DIRECTV Buildings which were sold in July 2013.
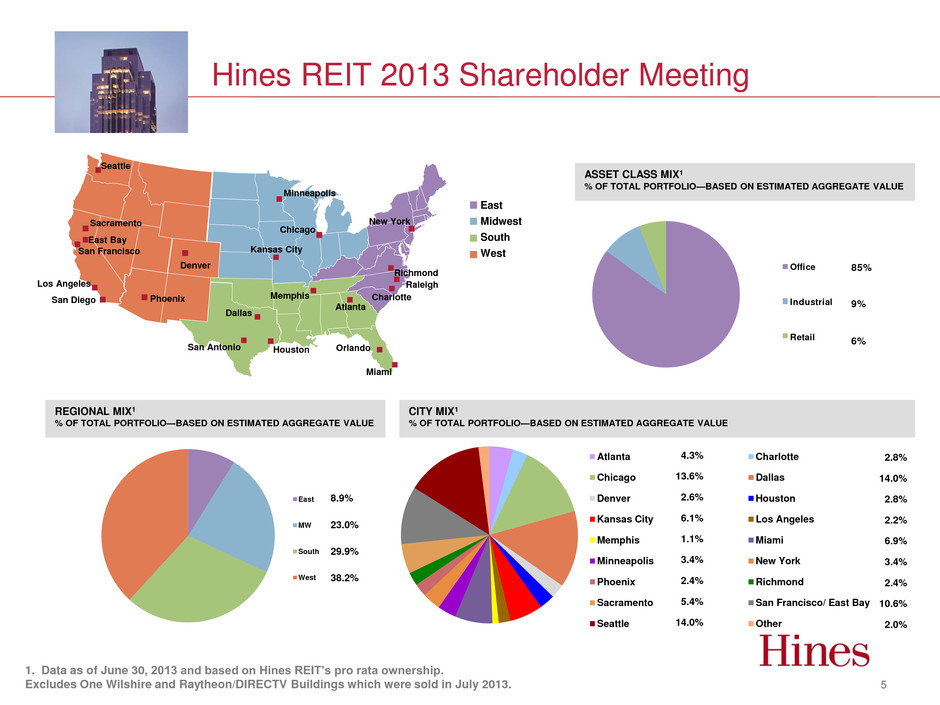
Hines REIT 2013 Shareholder Meeting REGIONAL MIX1 % OF TOTAL PORTFOLIO—BASED ON ESTIMATED AGGREGATE VALUE CITY MIX1 % OF TOTAL PORTFOLIO—BASED ON ESTIMATED AGGREGATE VALUE East Midwest South West San Francisco Houston Chicago Seattle Atlanta San Diego Los Angeles New York Dallas Sacramento Miami Richmond East Bay Charlotte Minneapolis Phoenix Kansas City San Antonio Orlando Memphis Denver ASSET CLASS MIX1 % OF TOTAL PORTFOLIO—BASED ON ESTIMATED AGGREGATE VALUE East MW South West 8.9% 23.0% 29.9% 38.2% Atlanta Charlotte Chicago Dallas Denver Houston Kansas City Los Angeles Memphis Miami Minneapolis New York Phoenix Richmond Sacramento San Francisco/ East Bay Seattle Other 4.3% 13.6% 2.6% 6.1% 1.1% 3.4% 2.4% 5.4% 14.0% 2.8% 14.0% 2.8% 2.2% 6.9% 3.4% 2.4% 10.6% 2.0% Office Industrial Retail 85% 9% 6% 5 1. Data as of June 30, 2013 and based on Hines REIT’s pro rata ownership. Excludes One Wilshire and Raytheon/DIRECTV Buildings which were sold in July 2013. Raleigh
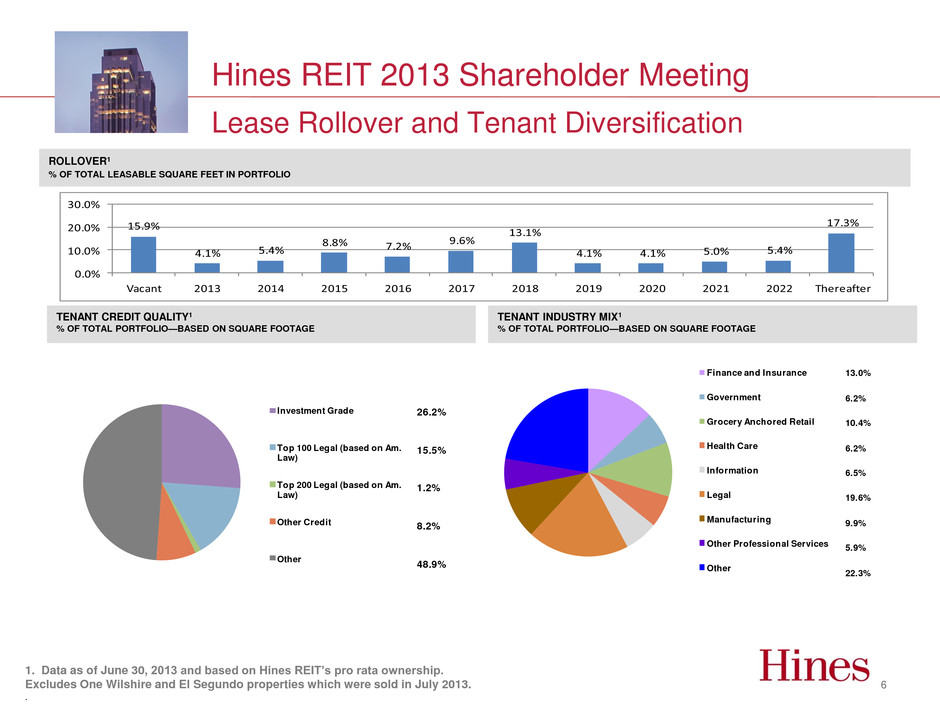
Hines REIT 2013 Shareholder Meeting Finance and Insurance Government Grocery Anchored Retail Health Care Information Legal Manufacturing Other Professional Services Other 13.0% 6.2% 10.4% 6.2% 6.5% 19.6% 9.9% 5.9% 22.3% Lease Rollover and Tenant Diversification 6 ROLLOVER1 % OF TOTAL LEASABLE SQUARE FEET IN PORTFOLIO TENANT CREDIT QUALITY1 % OF TOTAL PORTFOLIO—BASED ON SQUARE FOOTAGE TENANT INDUSTRY MIX1 % OF TOTAL PORTFOLIO—BASED ON SQUARE FOOTAGE 1. Data as of June 30, 2013 and based on Hines REIT’s pro rata ownership. Excludes One Wilshire and El Segundo properties which were sold in July 2013. . 15.9% 4.1% 5.4% 8.8 7.2% 9.6% 13.1% 4.1% 4.1% 5.0% 5.4% 17.3% 0.0% 10.0% 20.0% 30.0% Vacant 2013 2014 2015 2016 2017 2018 2019 2020 2021 2022 Thereafter Investment Grade Top 100 Legal (based on Am. Law) Top 200 Legal (based on Am. Law) Other Credit Other 26.2% 15.5% 1.2% 8.2% 48.9%
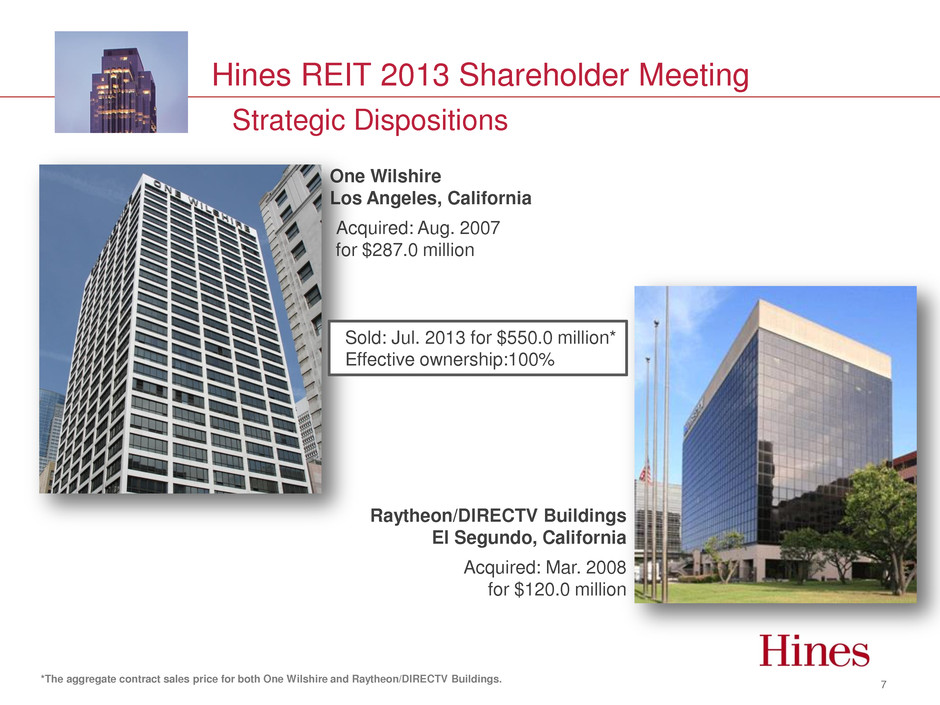
Hines REIT 2013 Shareholder Meeting Strategic Dispositions 7 Raytheon/DIRECTV Buildings El Segundo, California Acquired: Mar. 2008 for $120.0 million *The aggregate contract sales price for both One Wilshire and Raytheon/DIRECTV Buildings. One Wilshire Los Angeles, California Acquired: Aug. 2007 for $287.0 million Sold: Jul. 2013 for $550.0 million* Effective ownership:100%
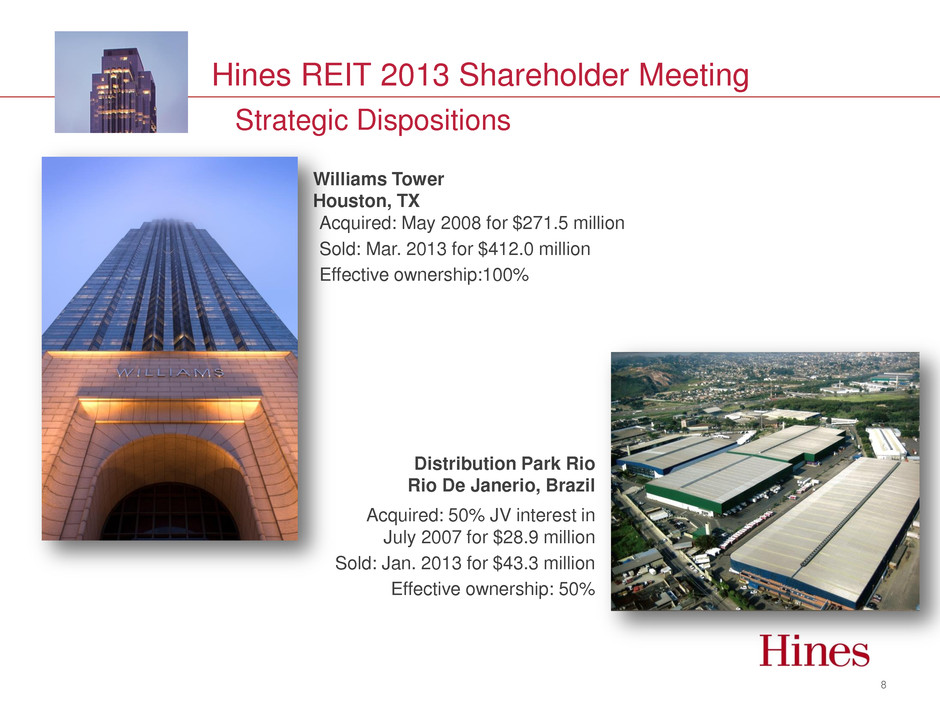
Hines REIT 2013 Shareholder Meeting 8 Strategic Dispositions Distribution Park Rio Rio De Janerio, Brazil Acquired: 50% JV interest in July 2007 for $28.9 million Sold: Jan. 2013 for $43.3 million Effective ownership: 50% Williams Tower Houston, TX Acquired: May 2008 for $271.5 million Sold: Mar. 2013 for $412.0 million Effective ownership:100%
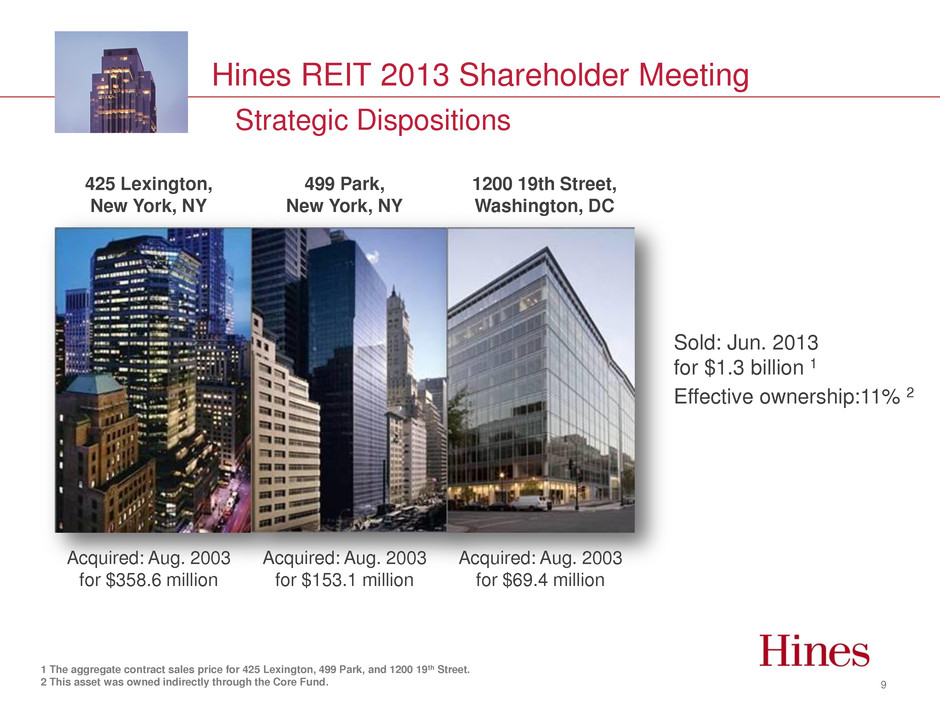
Hines REIT 2013 Shareholder Meeting 9 Strategic Dispositions Sold: Jun. 2013 for $1.3 billion 1 Effective ownership:11% 2 425 Lexington, New York, NY 499 Park, New York, NY 1200 19th Street, Washington, DC 1 The aggregate contract sales price for 425 Lexington, 499 Park, and 1200 19th Street. 2 This asset was owned indirectly through the Core Fund. Acquired: Aug. 2003 for $358.6 million Acquired: Aug. 2003 for $153.1 million Acquired: Aug. 2003 for $69.4 million
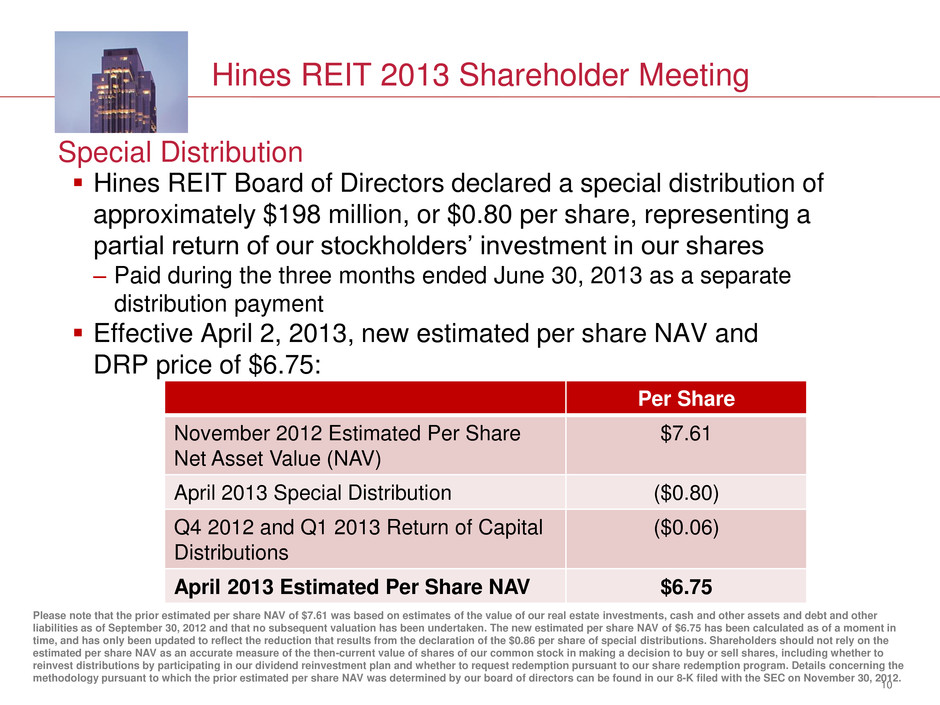
Hines REIT 2013 Shareholder Meeting Special Distribution Hines REIT Board of Directors declared a special distribution of approximately $198 million, or $0.80 per share, representing a partial return of our stockholders’ investment in our shares – Paid during the three months ended June 30, 2013 as a separate distribution payment Effective April 2, 2013, new estimated per share NAV and DRP price of $6.75: 10 Per Share November 2012 Estimated Per Share Net Asset Value (NAV) $7.61 April 2013 Special Distribution ($0.80) Q4 2012 and Q1 2013 Return of Capital Distributions ($0.06) April 2013 Estimated Per Share NAV $6.75 Please note that the prior estimated per share NAV of $7.61 was based on estimates of the value of our real estate investments, cash and other assets and debt and other liabilities as of September 30, 2012 and that no subsequent valuation has been undertaken. The new estimated per share NAV of $6.75 has been calculated as of a moment in time, and has only been updated to reflect the reduction that results from the declaration of the $0.86 per share of special distributions. Shareholders should not rely on the estimated per share NAV as an accurate measure of the then-current value of shares of our common stock in making a decision to buy or sell shares, including whether to reinvest distributions by participating in our dividend reinvestment plan and whether to request redemption pursuant to our share redemption program. Details concerning the methodology pursuant to which the prior estimated per share NAV was determined by our board of directors can be found in our 8-K filed with the SEC on November 30, 2012.
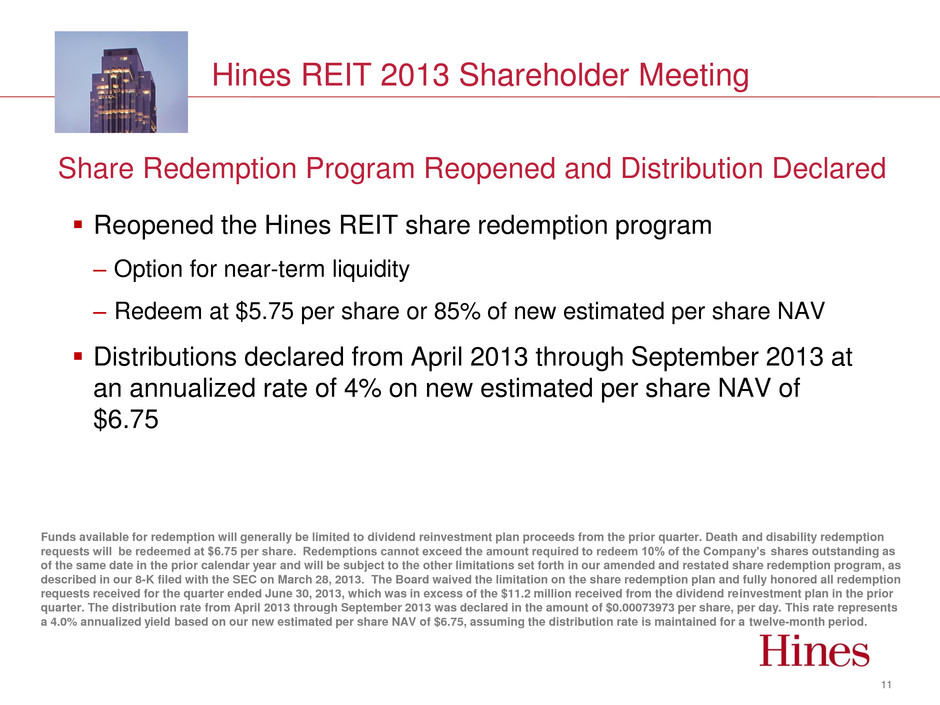
Hines REIT 2013 Shareholder Meeting Share Redemption Program Reopened and Distribution Declared Reopened the Hines REIT share redemption program – Option for near-term liquidity – Redeem at $5.75 per share or 85% of new estimated per share NAV Distributions declared from April 2013 through September 2013 at an annualized rate of 4% on new estimated per share NAV of $6.75 11 Funds available for redemption will generally be limited to dividend reinvestment plan proceeds from the prior quarter. Death and disability redemption requests will be redeemed at $6.75 per share. Redemptions cannot exceed the amount required to redeem 10% of the Company’s shares outstanding as of the same date in the prior calendar year and will be subject to the other limitations set forth in our amended and restated share redemption program, as described in our 8-K filed with the SEC on March 28, 2013. The Board waived the limitation on the share redemption plan and fully honored all redemption requests received for the quarter ended June 30, 2013, which was in excess of the $11.2 million received from the dividend reinvestment plan in the prior quarter. The distribution rate from April 2013 through September 2013 was declared in the amount of $0.00073973 per share, per day. This rate represents a 4.0% annualized yield based on our new estimated per share NAV of $6.75, assuming the distribution rate is maintained for a twelve-month period.
Hines REIT 2013 Shareholder Meeting Current & Long-term Priorities & Focus Alignment of interest • Hines has invested approximately $133.8 million in Hines REIT Our near-term priorities consist of: • Leasing of existing assets in our portfolio • Strategic asset sales and evaluating optional uses of net sales proceeds • Managing liquidity & maximizing distributions to shareholders Our long-term priorities consist of: • Evaluating potential exit strategies These priorities are designed to maximize shareholder returns over the long term 12
