Attached files
| file | filename |
|---|---|
| 8-K - 8-K - CAESARS HOLDINGS, INC. | d601172d8k.htm |
Exhibit 99.1
Executive Summary
| A. | Transaction Summary |
Caesars Entertainment Resort Properties, LLC (“CERP”) has engaged Citigroup Global Markets Inc., Merrill Lynch, Pierce, Fenner & Smith Incorporated, Credit Suisse Securities (USA) LLC, Deutsche Bank Securities Inc., J.P. Morgan Securities LLC, Goldman Sachs Bank USA, Macquarie Capital (USA) Inc., Morgan Stanley Senior Funding, Inc., and UBS Securities LLC to arrange and syndicate a $3,000 million Senior Secured 1st Lien Term Loan. The proceeds from this transaction, along with the proceeds from one or more proposed offerings of an aggregate $500 million 1st Lien Notes and $1,350 million 2nd Lien Notes, will be used to fully repay existing Caesars CMBS Financing and fully retire the Octavius/Linq Credit Facility (please see Transactions below for further details).
CERP owns, through various subsidiaries, six of the 52 casino properties that are owned, operated or managed by Caesars Entertainment (“Caesars” or “CEC”). In addition to its six leading casino entertainment properties, CERP’s properties also include the Octavius Tower at Caesars Palace and Project Linq, a new open-air dining, entertainment, and retail development on the Las Vegas Strip.
CERP Casino Properties
| Gaming Sq. Footage |
Hotel Rooms | Slots | Gaming Tables | Meeting Space Sq. Footage |
Restaurant & Bars |
|||||||||||||||||||
| Paris Las Vegas |
95,300 | 2,916 | 1,030 | 94 | 140,000 | 20 | ||||||||||||||||||
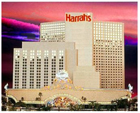
| Harrah’s Las Vegas |
90,600 | 2,526 | 1,304 | 94 | 25,000 | 7 | ||||||||||||||||||
| Flamingo Las Vegas |
72,300 | 3,460 | 1,217 | 109 | 80,000 | 9 | ||||||||||||||||||
| Rio Las Vegas |
117,300 | 2,522 | 1,075 | 80 | 160,000 | 18 | ||||||||||||||||||
| Harrah’s Laughlin |
56,000 | 1,505 | 928 | 28 | 7,000 | 10 | ||||||||||||||||||
| Harrah’s Atlantic City |
158,500 | 2,590 | 2,626 | 135 | 25,000 | 15 | ||||||||||||||||||
|
|
|
|
|
|
|
|
|
|
|
|
|
|||||||||||||
| Total: |
590,000 | 15,519 | 8,180 | 540 | 437,000 | 79 | ||||||||||||||||||
Project Linq
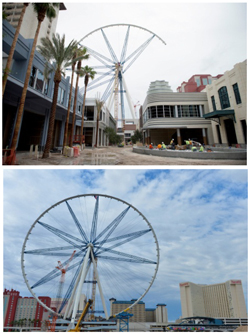
Project Linq is an open-air dining, entertainment and retail development on the east side of the Las Vegas Strip, the entrance of which will directly face Caesars Palace Las Vegas. Project Linq will feature over 25 new retail, dining and entertainment offerings and is scheduled to open in phases, beginning late 2013, and will also feature the world’s tallest observation wheel named the “High Roller”, which is expected to open in the second quarter of 2014.
Octavius Tower
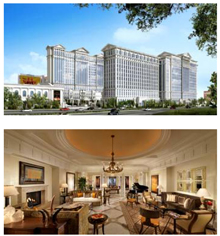
Octavius Tower is a 23-story premium hotel tower and is the newest of Caesars Palace’s 6 hotel towers. Located on the Flamingo Avenue side of Caesars Palace Las Vegas, Octavius Tower features 662 guest rooms, 60 suites and 6 luxury villas.
Transactions
Transfer of Octavius/Linq
Caesars Entertainment, through Caesars Entertainment Operating Company (“CEOC”) and its subsidiaries, indirectly owns Octavius/Linq Holding Co., LLC and its subsidiaries, which own the Octavius Tower and Project Linq. On or prior to the closing date, Octavius/Linq Holding Co., LLC will form an intermediate holding company, Octavius/Linq Intermediate Holding, LLC, for the purposes of owning its existing subsidiaries. On the closing date, Caesars Entertainment will contribute all of the membership interests of Octavius/Linq Intermediate Holding, LLC to Rio Properties, LLC (the “Octavius/Linq Transfer”). Following the Octavius/Linq Transfer, Rio Properties, LLC, an Issuer / Borrower, will own Octavius/Linq Intermediate Holdings, LLC and its subsidiaries, which own the Octavius Tower and Project Linq and will be Subsidiary Guarantors.
Refinancing Transactions
CERP and Paris Las Vegas Holding, LLC, Harrah’s Las Vegas, LLC, Flamingo Las Vegas Holding, LLC, Rio Properties, LLC, Harrah’s Laughlin, LLC, Harrah’s Atlantic City Holding, Inc., and Caesars Entertainment Resort Properties Finance, Inc. (each an “Issuer” and collectively the “Issuers”), will issue the 1st Lien Term Loan, the 1st Lien Notes and the 2nd Lien Notes.
On September 17, 2013, CERP launched an offer to repurchase for cash (the “CMBS Repurchase”) (i) 100% of the aggregate principal amount of mortgage loans under the CMBS Financing (as defined below) at a price of $0.99 per $1.00 of principal plus accrued and unpaid interest and (ii) 100% of the aggregate principal amount of mezzanine loans under the CMBS Financing at a price of $0.90 per $1.00 of principal plus accrued and unpaid interest. The consummation of the CMBS Repurchase is conditioned upon the acceptance by lenders holding at least 65% of the outstanding aggregate principal amount of the mortgage loans and 85% of the outstanding aggregate principal amount of the mezzanine loans. The lenders under the CMBS Financing have ten business days to respond to the offer to participate in the CMBS Repurchase. As of September 17, 2013, lenders holding approximately 63% of the outstanding aggregate principal amount of mortgage loans and approximately 84% of the outstanding aggregate principal amount of mezzanine loans have accepted the offer to participate in the CMBS Repurchase.
On the closing date, CERP intends to (i) retire 100% of the aggregate principal amount of loans outstanding under the mortgage and mezzanine loan agreements entered into by the Casino Resort Borrowers to finance the Acquisition (the “CMBS Financing”), (ii) repay in full all amounts then outstanding under the senior secured credit facility entered into by Octavius/Linq Holding Co., LLC (the “Octavius/Linq Credit Facility”), (iii) enter into (a) a $3,000 million Senior Secured 1st Lien Term Loan B, the net cash proceeds of which will be used to finance in part the repurchase of the loans under CMBS Financing and the repayment of the Octavius/Linq Credit Facility, and (b) a senior secured revolving credit facility providing a revolving line of credit of up to $269.5 million (together, the “Senior Secured Credit Facilities”) and (iv) issue $500.0 million of the 1st Lien Notes and $1,350.0 million of the 2nd Lien Notes, the net cash proceeds of which will be used to finance in part the repurchase of the loans under the CMBS Financing and the repayment of the Octavius/Linq Credit Facility ((i), (ii), (iii) and (iv) are collectively referred to as the “Refinancing Transactions”). The Refinancing Transactions and any other related transactions are subject to regulatory approval and market and other conditions, and may not occur as described or at all.
After June 30, 2013, CERP repurchased approximately $49.8 million principal amount of the mezzanine loans that were outstanding under the CMBS Financing. As used in this memorandum, the term “Transactions” refers collectively to the Octavius/Linq Transfer, the repurchase of approximately $49.8 million principal amount of the mezzanine loans that were outstanding under the CMBS Financing after June 30, 2013, the CMBS Repurchase and the Refinancing Transactions.
| B. | Transaction Sources and Uses |
| (1) | Assumes that 100% of the outstanding mortgage loans under the CMBS Financing will be repurchased at a price of $0.99 per $1.00 of principal plus accrued and unpaid interest. To the extent that less than 100% but more than the minimum condition of 65% of the outstanding mortgage loans are repurchased at a price of $0.99 per $1.00 of principal plus accrued and unpaid interest, CERP will seek to repurchase the remaining loans at prices which may be greater than $0.99 per $1.00 of principal plus accrued and unpaid interest. |
| (2) | Assumes that 100% of the outstanding mezzanine loans under the CMBS Financing will be repurchased at a price of $0.90 per $1.00 of principal plus accrued and unpaid interest. To the extent that less than 100% but more than the minimum condition of 85% of the outstanding mortgage loans are repurchased at a price of $0.90 per $1.00 of principal plus accrued and unpaid interest, CERP will seek used to repurchase the remaining loans at prices which may be greater than $0.90 per $1.00 of principal plus accrued and unpaid interest. |
| (3) | Includes a call premium of $9.0 million in connection with the repayment of all outstanding amounts under the Octavius/Linq Credit Facility. |
| (4) | Represents estimated fees and expenses of $111 million. Estimated fees and expenses include the initial purchasers’ discount, other fees and expenses, including legal, accounting and other professional fees, associated with the Transactions and other cash reserved for use in connection with the Transactions. |
| C. | Pro Forma Capitalization |
| As of June 30, 2013 | ||||||||||||
| As Adjusted for | ||||||||||||
| Pre-Transaction | ||||||||||||
| Repurchase | ||||||||||||
| of CMBS Financing loans | As adjusted for | |||||||||||
| ($ in mm) |
Actual | after June 30, 2013 | the Transactions | |||||||||
| Mortgage Debt |
$ | 3,670 | $ | 3,670 | — | |||||||
| Mezzanine Debt |
769 | 719 | — | |||||||||
| Octavius / Linq Debt |
450 | 450 | — | |||||||||
| New Revolving Credit Facility (1) |
— | — | — | |||||||||
| New 1st Lien Term Loan |
— | — | $ | 3,000 | ||||||||
| New 1st Lien Notes |
— | — | 500 | |||||||||
| New 2nd Lien Notes |
— | — | 1,350 | |||||||||
| Capital Lease Obligations |
7 | 7 | 7 | |||||||||
|
|
|
|
|
|
|
|||||||
| Total Debt |
$ | 4,896 | $ | 4,846 | $ | 4,857 | ||||||
|
|
|
|
|
|
|
|||||||
| EBITDA Summary |
||||||||||||
| LTM Adj. EBITDA—Pro Forma(2) |
$ | 599 | ||||||||||
| Projected Run-Rate LTM Adj. EBITDA—Pro Forma(2) |
643 - 683 | |||||||||||
| Leverage Metrics |
||||||||||||
| Net 1st Lien Debt(3) / Projected Run-Rate LTM Adj. EBITDA—Pro Forma |
5.0x - 5.3x | |||||||||||
| Net Total Debt(3) / Projected Run-Rate LTM Adj. EBITDA—Pro Forma |
7.0x - 7.5x | |||||||||||
| (1) | CERP expects that the senior secured revolving credit facility will be undrawn upon the consummation of the transaction. |
| (2) | See Historical Financial Information for Adjusted EBITDA reconciliations. |
| (3) | Net of pro forma cash estimated to be $60mm at closing. |
| D. | Organizational Structure |
Pre-Closing Restructuring Transaction
On or prior to the closing date of this offering, CERP intends to enter into a series of transactions that are intended to simplify its existing organizational structure (the “Pre-Closing Restructuring Transaction”). In connection with the Pre-Closing Restructuring Transaction, certain subsidiaries of Paris Las Vegas Holding, LLC, Harrah’s Las Vegas, LLC, Flamingo Las Vegas Holding, LLC, Rio Properties, LLC and Harrah’s Laughlin, LLC will be merged out of existence.
Post-Closing Restructuring Transaction
Upon CERP’s receipt of required regulatory approvals, CERP intends to reorganize its structure through a series of transactions that will result in all of the Issuers being direct subsidiaries of CERP (the “Post-Closing Restructuring Transaction”). In connection with the Post-Closing Restructuring Transaction, Harrah’s Atlantic City Holding, Inc., Paris Las Vegas Holding, LLC and Flamingo Las Vegas Holding, LLC will be merged out of existence. Some of the Issuers’ subsidiaries will also be merged out of existence in connection with the Post-Closing Restructuring Transaction. Prior to the Post-Closing Restructuring Transaction CERP will own no material assets of its own.
In addition, upon or following the closing of this offering, CERP intends to subdivide and transfer a portion of the real property next to Harrah’s Atlantic City to an indirect subsidiary of Caesars Entertainment (“Conference Newco”). The transfer of such real property and any corresponding release of security therein is contemplated by CERP’s existing debt agreements. The new conference center in which Caesars Entertainment plans to invest $125 million will be constructed on such real property. Harrah’s Atlantic City will provide services to the conference center pursuant to a new management agreement.
The diagram below is a summary of CERP’s organizational structure following the Post-Closing Restructuring Transaction
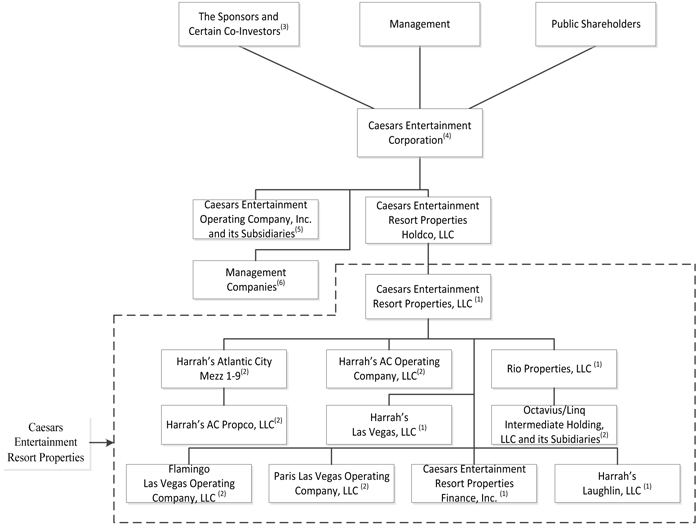
| (1) | After giving effect to the Transactions, CERP’s indebtedness will include $500.0 million of 1st Lien Notes, $1,350.0 million of 2nd Lien Notes and $3,000.0 million of indebtedness outstanding under Senior Secured Credit Facilities (with $269.5 million of unutilized capacity under the revolving credit facility portion of the Senior Secured Credit Facilities). |
| (2) | Each of the wholly owned domestic subsidiaries of CERP will guarantee CERP’s obligations under the 1st Lien Notes, the 2nd Lien Notes and the Senior Secured Credit Facilities and pledge its assets to secure the 1st Lien Notes, the 2nd Lien Notes and the Senior Secured Credit Facilities; provided, however, that the equity interests of CERP’s subsidiaries that have been pledged to secure CERP’s and the Subsidiary Guarantors’ obligations under the Senior Secured Credit Facilities will, upon CERP’s filing of a registration statement with the SEC under the terms of the registration rights agreement, be released from the collateral securing the 1st Lien Notes and the 2nd Lien Notes to the extent it would require separate financial statements under Regulation S-X of the Securities Act. |
| (3) | Shares held by funds affiliated with and controlled by the Sponsors and their co-investors, representing approximately 70% of Caesars Entertainment’s outstanding common stock as of June 30, 2013, are subject to the irrevocable proxy that gives Hamlet Holdings LLC, the members of which are comprised of individuals affiliated with the Sponsors, sole voting and sole dispositive power with respect to such shares. |
| (4) | Caesars Entertainment currently guarantees all of the debt securities of CEOC and CEOC’s senior secured credit facilities. Caesars Entertainment will not guarantee, or pledge its assets as security for, the 1st Lien Notes, the 2nd Lien Notes or the Senior Secured Credit Facilities. |
| (5) | CEOC and its subsidiaries will not guarantee, or pledge their assets as security for, the 1st Lien Notes, the 2nd Lien Notes, the Senior Secured Credit Facilities or any other indebtedness of CERP and are not liable for any obligations thereunder. |
| (6) | CERP’s casino properties are managed by management companies that are subsidiaries of Caesars Entertainment. The management companies will not guarantee, or pledge their assets as security for, the 1st Lien Notes, the 2nd Lien Notes, the Senior Secured Credit Facilities or any other indebtedness of CERP and are not liable for any obligations thereunder. |
| E. | Historical Financial Summary |
($ in millions)
| F. | CERP LTM Adjusted EBITDA – Pro Forma |
| Adjustment |
EBITDA Impact |
Details | ||||||||
| LTM Adjusted EBITDA(1) |
$ | 486.2 | • |
LTM Adjusted EBITDA for twelve months ended 6/30/2013 | ||||||
| Contractual EBITDA Adjustments |
||||||||||
| 1 |
Pro forma adjustments for Lease payments for Quad Strip-Front Lease | 15.0 | • |
Quad Strip-Front lease payments from CEOC subsidiary | ||||||
| 2 |
Pro forma adjustment for full annual lease payments under the Octavius Tower lease | 3.6 | • |
Additional lease payments that would have been paid to CERP assuming the full $35.0mm annual lease payment was in effect for the entire period | ||||||
| 3 |
Pro forma adjustment for Run-Rate Project Linq retail rent income | 14.3 | • |
Annual rental income from Project Linq retail space to be leased to third parties upon completion of Project Linq | ||||||
| • |
Does not include potential rent based on the performance of the tenants’ businesses, which is included in the lease terms, or Adjusted EBITDA that will be attributable to the five spaces that CERP will own and operate | |||||||||
| Additional Operating Adjustments |
||||||||||
| 4 |
Pro forma adjustment for estimated cost savings yet to be realized | 60.7 | • |
$42.9mm of annualized run-rate cost savings and estimated future cost savings to be realized from profitability improvement programs | ||||||
| • |
$13.5 million from a reduction in consolidated unallocated corporate expenses by their parent, Caesars Entertainment, which is expected to be completed by 2014 | |||||||||
| • |
Annualized savings and adjustments of $4.3mm related to purchase of previously leased slot machines and add-back of Margaritaville JV Adj. EBITDA contribution | |||||||||
| 5 |
Pro forma adjustment for annualized resort fees | 9.7 | • |
Annualized run-rate impact of resort fees introduced at CERP’s four LV properties on March 1st 2013 | ||||||
| 6 |
Pro forma adjustment for end of Project Linq and Quad disruption | 9.5 | • |
Projected recovery of lost Adjusted EBITDA due to visitation reduction to Harrah’s Las Vegas and to the Flamingo due to construction at the Quad | ||||||
| LTM Adjusted EBITDA—Pro Forma |
$ | 599.0 | ||||||||
| Projected EBITDA Adjustments |
||||||||||
| 7 |
High Roller observation wheel | 30 - 60 | • |
Estimated Adjusted EBITDA from the High Roller observation wheel scheduled to open by the end of the second quarter of 2014 | ||||||
| 8 |
Potential annual income from Project Linq | 9 - 14 | • |
Estimated potential annual rental income from Project Linq based on the performance of the tenants’ businesses, which is included in the lease terms, and estimated Adjusted EBITDA for the five spaces that CERP will own and operate | ||||||
| 9 |
Increase in gaming revenue expected from the completion of Project Linq | 5 - 10 | • |
Estimated additional gaming revenue at Flamingo and Harrah’s Las Vegas resulting from increased visitation from Project Linq | ||||||
| Range of Projected Run-Rate LTM Adjusted EBITDA—Pro Forma |
$ | 643.0 - $683.0 | ||||||||
| Note: | These projections reflect the annual run-rate Adjusted EBITDA estimated from each project once open or fully implemented and operated at a steady state, which may not occur until 12 to 24 months after the High Roller observation wheel commences operations |
| (1) | Adjusted EBITDA is a non-gaap metric, see Historical Financial Information for reconciliation |
Credit Highlights
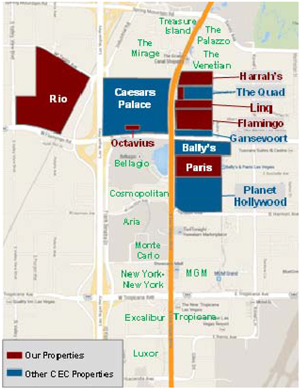
Las Vegas Concentration and Irreplaceable Center-Strip Location
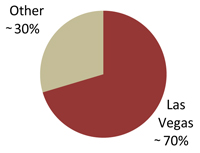
CERP’s Las Vegas properties are located on or near the Las Vegas Strip in the heart of the attractive Las Vegas market, and approximately 70% of its 2012 revenue was generated in the Las Vegas market. The Las Vegas market is one of most visited casino resort destinations in the world and attracted a record level of approximately 40 million people in 2012. Additionally, Las Vegas Strip year-to-date revenue growth, as of June 30, 2013, has outperformed several other U.S. major metro markets. CERP believes it is well positioned to continue to benefit from its significant exposure to the strong Las Vegas market.
Strong Non-Gaming Presence to Capitalize on Trends in Las Vegas
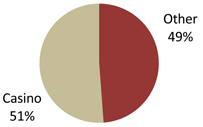
LVCVA reports have shown that Las Vegas visitors have become more interested in the non-gaming offerings in Las Vegas, with 47% indicating that their primary purpose for visiting was vacation or pleasure as opposed to solely for gambling, up from 39% in 2008. CERP currently has a strong presence in non-gaming offerings, with approximately 50% of its 2012 revenue generated from non-gaming sources. Additionally, the new Project Linq development will feature a mid-range distinctive mix of lifestyle dining, retail and entertainment offerings to appeal to the region’s growing Generation X and Generation Y clientele (ages 21 to 46) whose market share is estimated to grow in the future.
Caesars Significantly Investing in Diversified Offerings to Drive Visitation
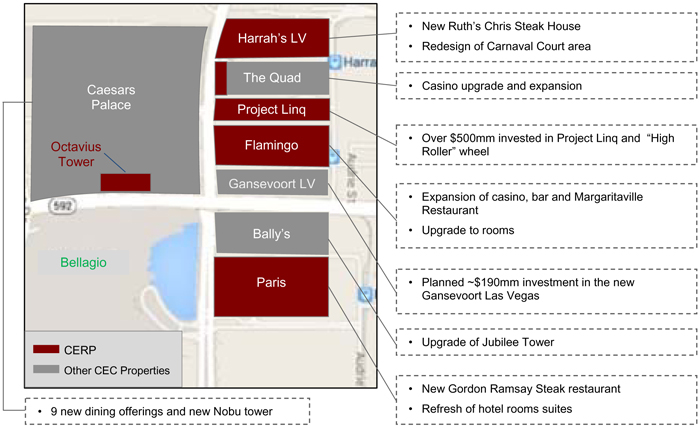
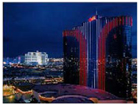
Close Proximity to New Large Developments in Las Vegas, Driving Increased Visitation to CERP’s Properties
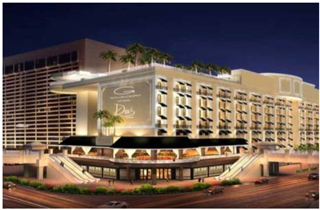
CERP’s Las Vegas properties are located near or adjacent to new large developments in Las Vegas: Project Linq, (which is owned by CERP) and the new Gansevoort Las Vegas hotel, both of which CERP believes will drive increased visitation to CERP’s gaming and non-gaming assets, due to increased foot traffic and the presence of additional visitors in the vicinity of its properties. CERP is investing over $500 million in Project Linq, which is scheduled to open in phases beginning in late 2013. Additionally, a newly redeveloped luxury boutique hotel, the Gansevoort Las Vegas, is currently undergoing refurbishment at the North-East corner of East Flamingo Road and Las Vegas Boulevard and is expected to open in 2014. Caesars Entertainment plans to invest approximately $190 million in the Gansevoort Las Vegas hotel, which will feature 188 luxury hotel rooms and 65,000 square foot indoor/outdoor beach club/nightclub.
CERP investing over $500mm in Project Linq development at the heart of the Las Vegas Strip

Caesars planned investment of ~$190mm in the Gansevoort Las Vegas, located adjacent to the Flamingo
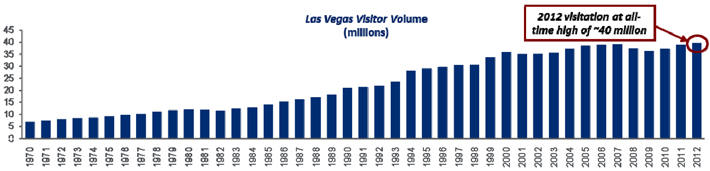
Well positioned for continued recovery in Las Vegas
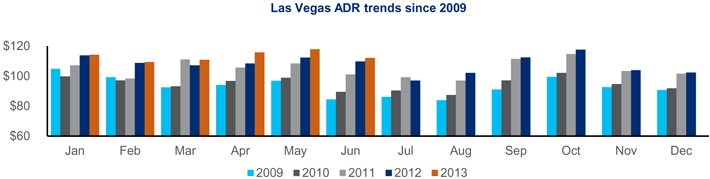
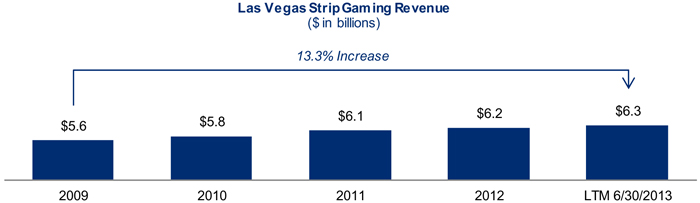
Between 1970 and 2007, Las Vegas overall visitation grew at a 5% compound annual growth rate. Despite declines in 2008 and 2009 due to a broad macroeconomic slowdown, overall visitation continued to increase from 2009 through 2012. By 2012, total visitation to Las Vegas returned to all-time highs of approximately 40 million people. Las Vegas hotel average daily rate (“ADR”) has also showed signs of improvement, but still remains significantly below the peak in 2007. Las Vegas Strip gaming revenues for the twelve months ended June 30, 2013 were 13.3% higher than in 2009, but still remains approximately $540 million below peak levels. CERP believes it is well positioned to benefit from a continued recovery in Las Vegas as approximately 70% of its 2012 revenue was generated in the Las Vegas market.
Las Vegas visitor volume at all-time high of ~40 million in 2012
ADR has increased steadily since 2009
Las Vegas Gaming Revenue Has Grown Steadily Since 2009…
Source: Las Vegas Conventions and Visitors Authority.
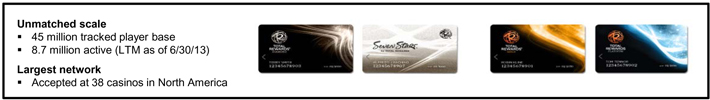
Access to leading casino brands, a global network of casinos, a leading innovator in the gaming industry and the Total Rewards loyalty program
Caesars Entertainment is the world’s most diversified casino-entertainment provider and the most geographically diverse U.S. casino entertainment company. Caesars Entertainment currently owns, operates or manages 52 casinos (including the Casino Resort Properties) that bear many of the most recognized brand names in the gaming industry. Pursuant to the Shared Services Agreement, CERP has access to and utilize Caesars Entertainment’s scale and market leading position, in combination with its proprietary marketing technology and customer loyalty programs, to foster revenue growth and encourage repeat business. The close proximity of CERP’s properties in Las Vegas and Atlantic City to other casino properties of, and operated by, Caesars Entertainment allows CERP to leverage the Caesars brands to attract customers to its casinos and resorts. Caesars Entertainment also has a proven record of innovation, including revolutionizing the industry’s approach to marketing with the introduction of the Total Rewards loyalty program in 1997. CERP has access to the Total Rewards loyalty program, which is considered to be one of the leading loyalty rewards programs in the casino entertainment industry. The Total Rewards loyalty program rewards customers for their brand loyalty and incentivizes them to seek out Caesars Entertainment’s brands. CERP also benefits from the Total Rewards loyalty program through its marketing and technological capabilities in combination with Caesars Entertainment’s nationwide casino network. CERP believes that the Total Rewards loyalty program, along with other marketing tools, provide CERP with a significant competitive advantage that enables it to efficiently market its products to a large and recurring customer base. Total Rewards has been successful in driving cross property play at CERP’s properties, with cross property play of 47% related to CERP’s properties in 2012. Total Rewards has also been successful in improving win per position, as CEC had a 15% and 21% fair share premium in its destination and regional markets, respectively vs. competitors for the last twelve months ending June 30, 2013.(1)
Access to Caesars’ Brands and IP
The key to Caesars’ success is the distribution of compelling brands to an expanding base of customers through their preferred channel, offering great experiences connected through rewards for loyalty

Note: Affiliated brands shown, Caesars Palace, World Series of Poker and online business are outside of CERP credit.
Total Rewards is the First, Largest and Best Loyalty in the Luxury Entertainment Industry
Total Rewards will be fully integrated with the new retail, dining, and entertainment options at Project Linq Increases customer value proposition for Total Rewards
| (1) | Win per position equals gaming revenue / 365 days / (slot units + gaming tables x 6). |
Well-known, large entertainment facilities generating significant revenue and free cash flow
CERP owns large scale casinos that bear some of the most highly recognized brand names in the gaming industry, including Harrah’s, Rio, Paris and Flamingo. These brands have a strong identity and enjoy widespread customer recognition. CERP also owns two large non-gaming properties, the Octavius Tower and Project Linq. CERP believes the location of its casino and non-gaming properties offer distinct advantages. CERP’s Las Vegas properties are located on or near the Las Vegas Strip and several sit among a contiguous strip of casinos owned by Caesars Entertainment. In addition, Harrah’s Atlantic City is located in Atlantic City’s marina district and Harrah’s Laughlin benefits from Caesars Entertainment’s charter flight program. CERP believes its properties’ prime locations, adjoining facilities and accessibility enables them to attract a significant customer base and continue to capture growth in market share. All of CERP’s casinos have been operating for over 10 years and have a successful track record of generating strong stable revenue and free cash flow.
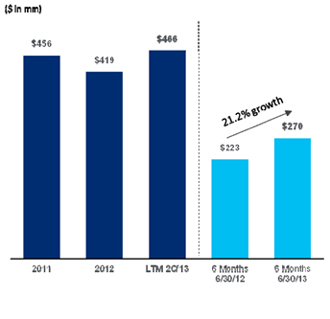
| (1) | Defined as Property EBITDA less capex, and excludes capex related to Project Linq construction of $60mm, $149mm and $226mm in 2011, 2012 and LTM June 30, 2013 respectively and $49mm and $126mm for six months ended 2012 and six months ended 2013 respectively. |
Experienced and highly motivated management team with proven track record
CERP benefits from the management team, led by Caesars Entertainment’s CEO, Gary W. Loveman, that has built Caesars Entertainment into an industry leader by geographically diversifying its operations and introducing technology-based tools to loyalty programs. A former associate professor at the Harvard University Graduate School of Business Administration, Mr. Loveman joined as Chief Operating Officer in 1998 and drew on his extensive background in retail marketing and service-management to enhance Total Rewards. Mr. Loveman has been named “Best CEO” in the gaming and lodging industry by Institutional Investor magazine four times. In addition, Caesars’ senior management operations team has an average of 27 years of industry experience. Other senior management team members possess significant experience in government and a variety of consumer industries.
Company Overview
Overview
CERP owns, through various subsidiaries, six of the 52 casino properties that are owned, operated or managed by subsidiaries of Caesars Entertainment. CERP’s casino properties operate under the well-known Harrah’s, Rio, Paris and Flamingo brands and include four leading casino resort properties located in the heart of the attractive Las Vegas market in Las Vegas, Nevada, a leading casino resort property in Laughlin, Nevada and another in Atlantic City, New Jersey (collectively, the “Casino Resort Properties”):
| • | Paris Las Vegas: a 2,916-room hotel, a casino featuring 1,030 slot machines and 94 table games, 11 restaurants and 9 bars and clubs, and 140,000 square feet of meeting space; |
| • | Harrah’s Las Vegas: a 2,526-room hotel, a casino featuring 1,304 slot machines and 94 table games, 7 restaurants and bars, and 25,000 square feet of meeting space; |
| • | Flamingo Las Vegas: a 3,460-room hotel, a casino featuring 1,217 slot machines and 109 table games, 9 restaurants and bars, and 80,000 square feet of meeting space; |
| • | Rio All-Suite Hotel and Casino: a 2,522-room all-suite hotel, a casino featuring 1,075 slot machines and 80 table games, 18 restaurants and bars, and 160,000 square feet of meeting space; |
| • | Harrah’s Laughlin: located on the banks of the Colorado river in Laughlin, Nevada, including a 1,505-room hotel, a casino featuring 928 slot machines and 28 table games, 10 restaurants and bars, and 7,000 square feet of meeting space; and |
| • | Harrah’s Atlantic City: located in Atlantic City, New Jersey, including a 2,500-room hotel, a casino featuring 2,626 slot machine and 135 table games, 15 restaurants and bars, and 25,000 square feet of meeting space |
CERP’s properties also include three other assets in Las Vegas that are being contributed to CERP in connection with the refinancing of the existing debt of the Casino Resort Borrowers:
| • | Project Linq: an open-air dining, entertainment and retail development on the east side of the Las Vegas Strip, the entrance of which will directly face Caesars Palace Las Vegas. Project Linq will feature over 25 new retail, dining and entertainment offerings and is scheduled to open in phases beginning in late 2013. The property will also feature the world’s tallest observation wheel named the “High Roller”, which will be 550 feet tall and is expected to open in the second quarter of 2014; |
| • | Octavius Tower at Caesars Palace Las Vegas: a 23 story premium hotel tower on the Flamingo Avenue side of Caesars Palace Las Vegas, featuring 662 guest rooms, 60 suites and six luxury villas (the “Octavius Tower”). The Octavius Tower is operated by Desert Palace, Inc. (“Caesars Palace”) under a long-term operating lease and CERP receives a fixed $35.0 million annual payment under the terms of the lease; and |
| • | Quad Strip-Front Lease: a long-term operating lease (“Quad Strip-Front Lease”) with a subsidiary of CEOC relating to prime Las Vegas Strip parcels which are owned by a subsidiary of CERP. |
As of June 30, 2013, CERP’s facilities had an aggregate of 590,000 square feet of gaming space, 15,519 hotel rooms, 8,180 slots, 540 gaming tables, 437,000 square feet of meeting space and 79 restaurants and bars.
Pursuant to CERP’s shared services agreement with CEOC (the “Shared Services Agreement”), CERP has access to Caesars Entertainment’s leading brand portfolio and management expertise and expects to benefit from its corporate scale, which CERP anticipates will provide a competitive advantage in the operation of its properties. CERP also benefits from management agreements that it has entered into with management company subsidiaries of Caesars Entertainment. Under these agreements, the management companies manage the Casino Resort Properties. Caesars Entertainment is the world’s most diversified casino-entertainment
provider and the most geographically diverse U.S. casino entertainment company. CERP also participates in Caesars Entertainment’s industry-leading customer loyalty program, Total Rewards, which has over 45 million members. CERP uses the Total Rewards system to market promotions and to generate customer play within its properties.
Caesars Entertainment revolutionized the approach the gaming industry takes with respect to marketing by introducing the Total Rewards loyalty program in 1997. Continual improvements have been made throughout the years enabling the system to remain the most effective in the industry and enabling Caesars Entertainment to grow and sustain revenues more efficiently than its largest competitors and generate cross-market play, which is defined as play by a guest in one of Caesars Entertainment’s properties outside its home market, which is where the guest signed up for Total Rewards. To support the Total Rewards loyalty program, Caesars Entertainment created the Winner’s Information Network, or WINet, the industry’s first sophisticated nationwide customer database. In combination, these systems supported the first technology-based customer relationship management strategy implemented in the gaming industry and have enabled Caesars Entertainment’s management teams to enhance overall operating results at its properties.
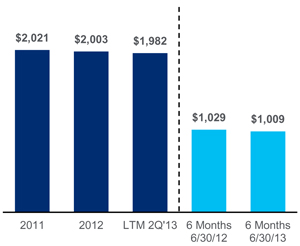
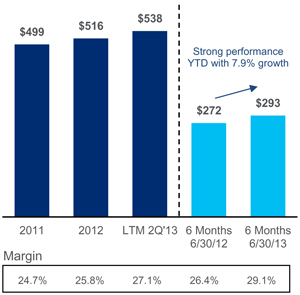
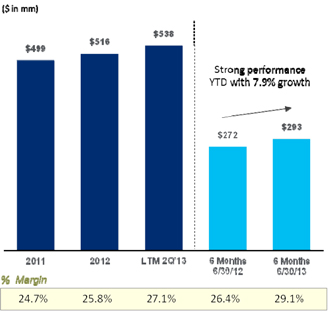
For the twelve months ended June 30, 2013, CERP derived approximately 50% of its gross revenues from gaming sources and approximately 50% from other sources, such as sales of lodging, food, beverages and entertainment. In future periods, CERP expects to derive additional revenue from non-gaming sources such as Project Linq and the High Roller observation wheel. For the twelve months ended June 30, 2013, CERP generated net revenues of $1,982.3 million, net income of $39.6 million and Property EBITDA of $537.8 million. For that same period, CERP generated LTM Adjusted EBITDA—Pro Forma of $599.0 million.
Property Overviews
Set forth below is certain information as of June 30, 2013 concerning CERP’s casino properties, each of which is more fully described following the table below.
| Gaming Sq. Footage |
Hotel Rooms | Slots | Gaming Tables | Meeting Space Sq. Footage |
Restaurant & Bars |
|||||||||||||||||||
| Paris Las Vegas |
95,300 | 2,916 | 1,030 | 94 | 140,000 | 20 | ||||||||||||||||||
| Harrah’s Las Vegas |
90,600 | 2,526 | 1,304 | 94 | 25,000 | 7 | ||||||||||||||||||
| Flamingo Las Vegas |
72,300 | 3,460 | 1,217 | 109 | 80,000 | 9 | ||||||||||||||||||
| Rio Las Vegas |
117,300 | 2,522 | 1,075 | 80 | 160,000 | 18 | ||||||||||||||||||
| Harrah’s Laughlin |
56,000 | 1,505 | 928 | 28 | 7,000 | 10 | ||||||||||||||||||
| Harrah’s Atlantic City |
158,500 | 2,590 | 2,626 | 135 | 25,000 | 15 | ||||||||||||||||||
|
|
|
|
|
|
|
|
|
|
|
|
|
|||||||||||||
| Total: |
590,000 | 15,519 | 8,180 | 540 | 437,000 | 79 | ||||||||||||||||||
Las Vegas Properties
The Las Vegas market has shown signs of recovery since the visitation and spend declines in 2008 and 2009. Las Vegas visitation reached an all-time high of approximately 40 million people in 2012, and Las Vegas Strip gaming revenues for the twelve months ended June 30, 2013 were 13.3% higher than in 2009. Additionally, recent trends have reflected a growth in customer demand for non-gaming offerings. According to the Las Vegas Convention and Visitors Authority (“LVCVA”), 47% of Las Vegas visitors in 2012 indicated that their primary reason to visit was for vacation or pleasure as opposed to solely for gambling as the main attraction, up from 39% of visitors in 2008.
CERP believes that its portfolio of assets is well positioned to capitalize on these trends. In 2012, approximately 70% of CERP’s revenue was derived from properties located in Las Vegas and approximately 50% of CERP’s revenue was generated from non-gaming offerings. These amounts do not include expected revenue from Project Linq, which is scheduled to open in phases beginning in late 2013, the High Roller observation wheel, which is expected to open in the second quarter of 2014, or the Quad Strip-Front Lease, which will begin generating lease payments in late 2013.
CERP Las Vegas properties are all strategically located in the heart of Las Vegas, with three properties (Paris, Flamingo and Harrah’s Las Vegas) located at the center of the Las Vegas Strip near or adjacent to the Project Linq development. In addition, Caesars Entertainment plans to invest approximately $190 million in the Gansevoort Las Vegas hotel, which is expected to open in the first quarter of 2014. The Gansevoort Las Vegas hotel will have 188 luxury hotel rooms and a new 65,000 square foot nightclub/poolclub located on the roof of the property. CERP’s nearby Las Vegas Strip properties should benefit from the investments in, and the visitation to, these new developments. Further, all of CERP’s Las Vegas properties benefit from their prime location in the attractive Las Vegas market, and from their close proximity to other casino properties owned by Caesars Entertainment, with which they share certain services and costs.

|
Paris Las Vegas |

|
Paris Las Vegas is a French-themed resort, casino and entertainment facility that opened in September 1999. Strategically located in the center of the strip on Las Vegas Boulevard, the property features approximately 20 bars and restaurants, spa services, 140,000 square feet of conference and meeting space, and distinctive entertainment offerings, currently including Jersey Boys and American Idol winner Taylor Hicks. Paris Las Vegas is home to the popular Gordon Ramsay Steak restaurant, which opened in the second quarter of 2012. Paris Las Vegas also offers shopping at Le Boulevard and shares the Paris-Bally’s Promenade with Bally’s Las Vegas. | |

|
Paris Las Vegas is CERP’s most premium product offering with strong VIP play and group business. Recent initiatives continue to focus on growing high-end Asian customer visitation. To date these initiatives have been successful as Paris Las Vegas has experienced significant year-over-year growth in its VVIP segment of 34% in the second quarter of 2013 as compared to the second quarter of 2012 (“VVIP” is defined as guests with a theoretical daily loss between $10,000 and $74,999). | |
Paris had strong growth in Property EBITDA YTD 2013 as of June 30, 2013 driven by growth in VIP segment, implementation of resort fees, and ongoing cost saving initiatives.

|
Flamingo Las Vegas | |
|
Flamingo Las Vegas opened in December 1946, is located in the heart of the Las Vegas Strip, and is the longest operating resort on the Strip. Its architectural theme is reminiscent of the Art Deco and Streamline Modern style of Miami and South Beach and features a garden courtyard that houses a wildlife habitat with live flamingos. The resort is home to the popular Margaritaville restaurant, bar and casino and the Center Cut Steakhouse. The Flamingo also features several entertainment offerings, currently including Donny & Marie and Legends in Concert, which recently celebrated its 30th anniversary, and 73,000 square feet of meeting space. The Flamingo also has a variety of activities for guests, including a large beach club and pool area that appeals to summer travelers, retail shopping and spa services. The property underwent a recent renovation of approximately 2,200 hotel rooms in 2011. | |

|
The Flamingo is one of CERP’s mid-level product offerings with a long brand history in Las Vegas that CERP believes has mass appeal due to its prime location and amenities. The large garden courtyard and pool area attract hotel customers and drive visitation to the property. The Flamingo is ideally situated to benefit from increased visitation driven by Project Linq, located directly to its north, and the Gansevoort Las Vegas hotel, which will be located directly to its south. In addition, the Flamingo, including the planned expansion of the main casino and the Margaritaville restaurant and casino, will have direct access to Project Linq. | |
Flamingo had Strong growth in Property EBITDA YTD 2013 as of June 30, 2013 driven by implementation of resort fees and ongoing cost saving initiatives, partially offset by Quad construction disruption.
|
Harrah’s Las Vegas | |
|
Harrah’s Las Vegas opened in 1973 and is located on the Las Vegas Strip, in close proximity to the Project Linq development and the Gansevoort Las Vegas hotel that is expected to open in 2014. The property features a Mardi Gras / Carnival theme with 9 restaurants and bars, a range of specialty retail shopping, spa services and 25,000 square feet of meeting space. The property is also home to the Carnaval Court, an open-air venue on the strip that features live music and events. Popular restaurants include the recently opened Ruth’s Chris Steak House and Toby Keith’s I Love This Bar & Grill. Entertainment offerings currently include Million Dollar Quartet, which opened in February 2013. | |

|
Harrah’s Las Vegas is one of CERP’s mid-level product offerings and benefits from strong customer loyalty cultivated since its opening. This dedicated customer base drives a high mix of casino gaming customers at the property. Harrah’s Las Vegas is located close to Project Linq and is well positioned to benefit from increased visitation to the area. The property will be accessible to Project Linq via a guest walk path from the Carnaval Court outdoor plaza, which will help guide incremental customers to the property’s entertainment and casino gaming offerings. | |

|
Rio Las Vegas | |
|
Rio Las Vegas opened in January 1990 and is located just off of the Las Vegas Strip. It was the first all-suite resort in the Las Vegas area and features a Brazilian theme inspired by the city of Rio de Janeiro. The resort offers 18 restaurants and bars, including the popular Village Seafood Buffet. The Rio is home to the World Series of Poker, an annual poker event that attracted over 75,000 entrants in 2013 over the seven weeks of the event. Rio Las Vegas also offers spa and salon services, the VooDoo Rooftop Nightclub, a large pool area, and 160,000 square feet of meeting space. The property also includes Masquerade village, which includes over 60,000 square feet of food and beverage and retail space. Rio Las Vegas features an array of shows currently including Penn & Teller and Chippendales. | |
The Rio is one of CERP’s mid-level product offerings with strong appeal to locals as compared to other casino resorts in the area and also a strong group / conference business given its substantial meeting facilities, with 160,000 square feet of meeting space. The property has recently opened several new restaurant offerings to appeal to the local Asian customer base, including KJ Dim Sum & Seafood and Pho Da Nang Vietnamese Kitchen.
Project Linq

|
Project is an open-air dining, entertainment and retail development located at the heart of the Las Vegas Strip and is scheduled to open in phases beginning in late 2013, with the High Roller observation wheel scheduled to open in the second quarter of 2014. Project Linq has been designed to be a destination attraction with more than 255,000 square feet of gross leasable retail and dining space and the High Roller observation wheel, which will be the world’s tallest observation wheel at 550 feet. The property is meant to be the first central “Party District” in Las Vegas, and is currently expected to include 4 bars, 12 food and beverage offerings, 7 retail outlets and an entertainment venue, with 7 additional spaces currently in negotiations. CERP intends to own and operate 5 spaces (which is approximately 15% of the leasable space), and 76% of the remaining space is currently subject to executed leases, with the rest of the remaining space currently in negotiations. CERP estimates annual base rent will produce approximately $17.1 million in gross rent revenues and $14.3 million in Adjusted EBITDA. These projections do not include potential rent based on the performance of CERP’s tenants’ businesses, which is included in the lease terms, or Adjusted EBITDA that will be attributable to the 5 spaces CERP will own and operate, including Guy’s American Kitchen and Bar and Starbucks. Other popular offerings will include: Brooklyn Bowl, Yard House, Tilted Kilt, Foto Bar, Ghirardelli, and Sprinkles Cupcakes. The location will take advantage of the significant foot traffic and visitation to the Las Vegas Strip and should provide increased visitation to CERP’s nearby Strip properties by attracting visitors to the area. Project Linq is planned to appeal to the region’s growing Generation X and Generation Y clientele (ages 21 to 46) whose market share is estimated to grow in the future. | |

|
The property will be anchored on the east side by the High Roller observation wheel, which will offer breathtaking views of the famous Las Vegas Strip. Expected to open in the second quarter of 2014, the High Roller will be the tallest observation wheel in the world with 28 capsules that will feature dynamic audio and video entertainment and accommodate up to 40 passengers each. | |


Octavius Tower
|
Octavius Tower, which opened in January 2012, is the newest of Caesars Palace Las Vegas’s six hotel towers, and is located on the Flamingo Avenue side of Caesars Palace Las Vegas. The 23-story high-end luxury hotel complex features 662 guest rooms, 60 suites and six luxury villas. The property offers patrons a unique luxurious resort experience with large rooms with custom furniture and technological upgrades, direct access to the Garden of the Gods pool oasis and gardens, which consists of eight pools, and a private entrance and separate hotel lobby for VIPs. The high-end luxury tower is positioned to cater to VIP customers and to target ultra high-end Asian guests. The Octavius Tower benefits from a long-term lease agreement with Caesars Palace, which has the right to operate the tower for a 15-year term. CERP will receive a fixed $35 million annual payment, paid monthly, under the terms of the lease. |
Quad Strip-Front Lease
Quad Strip-Front Lease is a long-term operating lease with a subsidiary of CEOC relating to a prime Las Vegas Strip space. CERP will receive a fixed $15 million annual payment under the terms of the lease, beginning in late 2013.

|
Harrah’s Laughlin |

|
Harrah’s Laughlin, which opened in August 1988, is a Mexican-themed integrated hotel and casino located along the banks of the Colorado River in Laughlin, Nevada. Harrah’s Laughlin features a festive Southwestern atmosphere and Nevada-style casino gambling 24 hours a day. It has 10 restaurants and bars, with several other entertainment offerings, including the Fiesta Showroom and a 3,000-seat Amphitheater. Harrah’s Laughlin owns a hotel guest beach, two pools, salon and day spa, boutique and gift shop. It has 7,000 square feet of conference and meeting space and is the second largest hotel and casino located in Laughlin, Nevada. The hotel and casino is located near four golf courses and features personal watercraft and water taxi access. Harrah’s Laughlin focuses on underserved gaming markets and is accessible by planes chartered by CEOC that transport passengers to and from regional cities. Harrah’s Laughlin is a leading property in its market with a 26% market share and better gaming metrics as compared to its competition. Harrah’s Laughlin’s win per unit per day (including slots and table games) was $293 versus $111 for competitors for the twelve months ended June 30, 2013, which represents a $182 premium. |
|
Harrah’s Atlantic City |
|
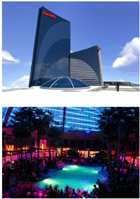
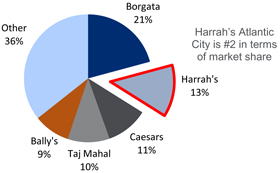
Harrah’s Atlantic City, which opened in November 1980, is an integrated hotel and resort located in the marina district of Atlantic City, New Jersey. Caesars Entertainment has invested significantly in Harrah’s Atlantic City, with over $500 million invested for a new hotel tower and new food and beverage offerings. The hotel tower was completed in 2008, adding 960 rooms. CERP believes the property has the number two market share based on gross gaming revenue for the twelve months ended June 30, 2013. Harrah’s Atlantic City features 15 restaurants and bars, with several new offerings including Sammy D’s, Bill’s Bar and Burger, Atlantic City Grill, Luke Palladino and Dos Caminos. The property also has a dedicated concert venue and several other amenities including the Elizabeth Arden Red Door Spa. In addition, Harrah’s Atlantic City includes an indoor domed pool area with a 33,000 square foot pool and a 14,000 square foot sundeck, both available for use year round. Harrah’s Atlantic City also has 20,000 square feet of conference and meeting space. CERP anticipates that this property will benefit from increased visitation as a result of Caesars Entertainment’s planned $125 million investment in a new 125,000 square foot conference center directly adjacent to the property, which has recently begun construction. |
| (1) | LTM as of June 30, 2013. |
Business Strategy
Continue to invest in new non-gaming offerings in Las Vegas to drive visitation and profitability. Trends in Las Vegas have shown that non-gaming offerings are becoming increasingly important to visitors and that Las Vegas is attracting a younger demographic. CERP expects this trend to continue and has been investing in new food and beverage offerings as well as other non-gaming amenities to drive increased visitation and profitability. New restaurants include Gordon Ramsay Steak at Paris, Ruth’s Chris Steak House at Harrah’s Las Vegas and expansion of the Margaritaville restaurant at Flamingo. New entertainment offerings include the Project Linq open-air dining, entertainment and retail development and the new show Million Dollar Quartet at Harrah’s Las Vegas. CERP derived approximately 50% of its gross revenues from gaming sources and approximately 50% from other sources, such as sales of lodging, food, beverages and entertainment, for the twelve months ended June 30, 2013.
Capitalize on the revitalization of the east side of the Las Vegas Strip. CERP is focused on strategically investing in its casino properties located on the east side of the Las Vegas Strip. These investments are focused on improving both gaming and non-gaming offerings, including upgrading CERP’s hotel rooms, casinos, public areas and general amenities. CERP is investing over $500 million in Project Linq, a new open-air dining, entertainment and retail development, and Caesars Entertainment plans to invest approximately $190 million in the Gansevoort Las Vegas hotel, which, when it opens in 2014, will be a luxury boutique hotel with new entertainment and dining options. All of these investments should drive increased foot traffic and significant visitation to CERP’s properties.
Maximize CERP’s core business profitability by capitalizing on recovery in Las Vegas. While Las Vegas has shown signs of recovery, ADR is currently 33%, or $42, below the peak in 2007, and gross gaming revenue is 29%, or $227 million, below the peak in 2007, at CERP’s Las Vegas Strip properties (Paris, Flamingo and Harrah’s Las Vegas). This is in part due to decreased gaming interest and in part due to increased capacity from new casinos. CERP’s businesses have inherently low variable costs such that positive change in revenues should drive relatively large improvements in Property EBITDA. An increase in ADR would drive nearly a dollar for dollar improvement in Property EBITDA. For example, based on its cash room nights in 2012 of 2.3 million, CERP anticipates that a $20 increase in ADR on an annual basis would equate to an improvement to annual Property EBITDA of approximately $46 million. Additionally, resort fees were introduced in March 2013 at CERP’s four Las Vegas properties and are already driving incremental Property EBITDA. Resort fees range from $18 to $20 per night and provide hotel customers with access to select property amenities including fitness centers and internet access. Since the inception of the program, CERP believes that it has generated approximately $5 million incremental Property EBITDA with little impact to occupancy at its Las Vegas properties. CERP believes this favorable impact will increase as the program ramps to full effect and more hotel guests fall into the guidelines of the program.
Capitalize on relationship with Caesars Entertainment. CERP’s access to the industry-leading Total Rewards loyalty program, which included over 45 million members as of June 30, 2013, improves the ability of CERP’s businesses to cross market and cross promote with Caesars Entertainment’s database and many of its casinos. This relationship allows CERP to utilize Caesars Entertainment’s sophisticated customer database and technology systems to efficiently and effectively manage its existing customer relationships. CERP leverages Caesars Entertainment’s superior marketing and technology innovation and capabilities to generate gaming revenue growth, attract additional customers and generate loyalty. In addition, CERP believes that through the Total Rewards loyalty program it is uniquely able to market to customers who wish to patronize a casino in their local market wherein they can accumulate rewards points redeemable in other destination markets, such as Las Vegas and Atlantic City.
Leverage Caesars Entertainment’s unique scale and proprietary loyalty programs to drive outperformance versus its competitors. CERP plans to continue to aggressively leverage Caesars Entertainment’s distribution platform and superior marketing and technological capabilities to generate same store gaming revenue growth and cross-market play. The Total Rewards system includes over 45 million program members. Through this system, Caesars Entertainment promotes cross-market play and targets
CERP’s efforts and marketing expenditures on areas and customer segments that generate the highest return. This system, coupled with Caesars Entertainment’s vast footprint in the U.S., enables CERP to profitably stimulate substantial cross-market play. As part of Caesars Entertainment, CERP offers a unique value proposition to loyal players whereby they get the best service and product in their local market, and as a reward for their loyalty, they receive especially attentive and customized services when they visit CERP’s properties in Las Vegas and Atlantic City. This distribution strategy is unique to Caesars Entertainment and an important source of CERP’s competitive advantage. Caesars Entertainment’s extensive historical knowledge and refined decision modeling procedures enables CERP to distribute best practices to ensure its marketing expenditures are being used to their utmost efficiency. Given Caesars Entertainment’s historical investments in information technology and broad geographic footprint, CERP believes it has a competitive advantage in stimulating customer demand.
Continue to enhance the efficiency of CERP’s operations. CERP believes that Caesars Entertainment will continue to dedicate significant efforts towards optimizing its business and cost structure. Over the last several years, the Caesars Entertainment management team has instituted operational concepts, such as LEAN operations, Kaizen and dynamic volume-based scheduling, with the intention to ensure Caesars Entertainment operates at consistently high efficiency rates. Additionally, Caesars Entertainment has consolidated activities, advanced its targeted marketing efforts and achieved procurement efficiencies. Moreover, Caesars Entertainment has achieved these cost savings while showing improved customer satisfaction levels since 2009. CERP initiated a cost-saving program in late 2010 that was designed to take advantage of the Caesars Entertainment’s nationwide scale. This initiative has now been fully implemented and CERP continues to realize cost savings. CERP estimates that Caesars Entertainment’s cost-savings programs realized approximately $70.3 million in incremental cost savings at its properties for the twelve months ended June 30, 2013 as compared to the twelve months ended June 30, 2012, with approximately $43 million of annualized savings yet to be realized from its properties as of June 30, 2013. Recently, Caesars Entertainment embarked on an initiative to reduce corporate expenses by an additional $45 million and has identified savings that will meet or exceed that target. CERP’s contractual share of these potential expense reductions is approximately $13.5 million.
Continued focus on differentiated customer service as a competitive advantage. Caesars Entertainment concentrates intensely on measuring and continuously improving customer service. Customer service surveys are collected weekly from guests, allowing CERP to pinpoint customer feedback on over 35 attributes/functional areas. Each customer service department is required to develop and implement plans to improve its individual service scores. Management bonuses, as well as individual performance evaluations, are partially dependent on achieving measured improvement on year over year customer service scores.
Leverage Caesars Entertainment’s scale to optimize CERP’s cost structure. Caesars Entertainment’s global scale provides CERP with significant purchasing power and provides a larger fixed cost base with which to optimize CERP’s cost structure. Caesars Entertainment’s approximate $2.1 billion of enterprise-wide supplier spend provides CERP with unsurpassed scale and the associated negotiating power with its suppliers, allowing it to achieve optimal terms and providing significant cost savings. Integration with Caesars Entertainment’s corporate services enables CERP to eliminate unnecessary expenses and improve efficiencies. Caesars Entertainment provides CERP with functional expertise in areas such as labor efficiency, food and beverage procurement and retailing to ensure that best practices are utilized throughout its business. CERP also benefits from shared work groups in the areas of procurement, internal audit, planning and analysis, advertising and collections. Local competitors without Caesars Entertainment’s scale would require property specific teams for these types of necessary functions. CERP also benefits from Caesars Entertainment’s national marketing initiatives under the Harrah’s brand name, which is the brand deployed on three of CERP’s properties. Rather than develop its own brand identity, CERP benefits from the nationally-recognized Harrah’s brand, and CERP effectively shares the costs of branding and marketing Harrah’s with all other properties. CERP believes that without the benefit of affiliation with the Caesars Entertainment’s brands, its marketing and branding costs would be substantially higher.
Historical Financial Information
The following table presents the historical combined financial statements of Caesars Entertainment Resort Properties for the years ended December 31, 2011 and 2012, for the six month periods ended June 30, 2012 and 2013 and for the twelve months ended June 30, 2013. Unless otherwise specified, the combined financial data presented herein for Caesars Entertainment Resort Properties has been derived from the combined financial statements of Caesars Entertainment Resort Properties for the relevant periods included elsewhere in this document.
| Year ended December 31, 2011(1) |
Year ended December 31, 2012(1) |
Six months ended June 30, 2012(1) |
Six months ended June 30, 2013(1) |
Twelve months ended June 30, 2013(1) |
||||||||||||||||
| (dollars in millions) | ||||||||||||||||||||
| Income Statement Data |
||||||||||||||||||||
| Revenues |
||||||||||||||||||||
| Casino |
$ | 1,229.0 | $ | 1,192.7 | $ | 612.9 | $ | 581.5 | $ | 1,161.3 | ||||||||||
| Food and beverage |
501.2 | 505.5 | 259.2 | 253.7 | 500.0 | |||||||||||||||
| Rooms |
453.4 | 446.0 | 230.8 | 228.0 | 443.2 | |||||||||||||||
| Other |
200.2 | 210.2 | 104.0 | 111.7 | 217.9 | |||||||||||||||
| Less: casino promotional allowances |
(363.0 | ) | (351.5 | ) | (177.6 | ) | (166.2 | ) | (340.1 | ) | ||||||||||
|
|
|
|
|
|
|
|
|
|
|
|||||||||||
| Net revenues |
2,020.8 | 2,002.9 | 1,029.3 | 1,008.7 | 1,982.3 | |||||||||||||||
|
|
|
|
|
|
|
|
|
|
|
|||||||||||
| Operating Expenses |
||||||||||||||||||||
| Direct |
||||||||||||||||||||
| Casino |
638.0 | 623.0 | 317.7 | 283.8 | 589.1 | |||||||||||||||
| Food and beverage |
243.6 | 248.2 | 126.3 | 121.0 | 242.9 | |||||||||||||||
| Rooms |
115.8 | 121.1 | 63.1 | 62.9 | 120.9 | |||||||||||||||
| Property, general, administrative and other |
524.4 | 494.3 | 250.5 | 247.8 | 491.6 | |||||||||||||||
| Depreciation and amortization |
162.7 | 192.8 | 97.9 | 81.7 | 176.6 | |||||||||||||||
| Write-downs, reserves, and project opening costs, net of recoveries |
7.2 | 21.5 | 5.9 | 18.7 | 34.3 | |||||||||||||||
| Intangible and tangible asset impairment charges |
— | 3.0 | — | 24.4 | 27.4 | |||||||||||||||
| Loss/(income) on interests in non-consolidated affiliates |
1.0 | (1.4 | ) | (0.5 | ) | (2.7 | ) | (3.6 | ) | |||||||||||
| Corporate expense |
85.0 | 80.3 | 40.4 | 25.2 | 65.1 | |||||||||||||||
| Acquisition and integration costs |
0.2 | — | — | — | — | |||||||||||||||
| Amortization of intangible assets |
59.6 | 59.0 | 29.5 | 29.5 | 59.0 | |||||||||||||||
|
|
|
|
|
|
|
|
|
|
|
|||||||||||
| Total operating expenses |
1,837.5 | 1,841.8 | 930.8 | 892.3 | 1,803.3 | |||||||||||||||
|
|
|
|
|
|
|
|
|
|
|
|||||||||||
| Income from operations |
183.3 | 161.1 | 98.5 | 116.4 | 179.0 | |||||||||||||||
| Interest expense, net of interest capitalized |
(218.6 | ) | (231.8 | ) | (119.8 | ) | (108.4 | ) | (220.4 | ) | ||||||||||
| Gain on early extinguishments of debt |
47.5 | 135.0 | 78.5 | 39.0 | 95.5 | |||||||||||||||
| Other income, including interest income |
1.3 | 1.0 | 0.6 | 0.1 | 0.5 | |||||||||||||||
|
|
|
|
|
|
|
|
|
|
|
|||||||||||
| Income before income taxes |
13.5 | 65.3 | 57.8 | 47.1 | 54.6 | |||||||||||||||
| Provision for income taxes |
(4.3 | ) | (21.9 | ) | (20.0 | ) | (13.1 | ) | (15.0 | ) | ||||||||||
|
|
|
|
|
|
|
|
|
|
|
|||||||||||
| Net income |
$ | 9.2 | $ | 43.4 | $ | 37.8 | $ | 34.0 | $ | 39.6 | ||||||||||
|
|
|
|
|
|
|
|
|
|
|
|||||||||||
| Other Financial Data |
||||||||||||||||||||
| Capital expenditures, net of changes in construction payables |
$ | 103.3 | $ | 246.7 | $ | 97.5 | $ | 148.8 | $ | 298.0 | ||||||||||
| Property EBITDA(2) |
499.0 | 516.3 | 271.7 | 293.2 | 537.8 | |||||||||||||||
| Ratio of earnings to fixed charges |
— | 1.2 | 1.5 | 1.4 | 1.2 | |||||||||||||||
| Twelve months ended June 30, 2013 |
||||
| (in millions) | ||||
| LTM Adjusted EBITDA—Pro Forma(3) |
$ | 599.0 | ||
|
|
|
|||
| (1) | Caesars Entertainment Resort Properties includes Caesars Entertainment Resort Properties, LLC and Caesars Entertainment Resort Properties Finance, Inc., which are newly formed entities without historical financial information. Accordingly, Caesars Entertainment Resort Properties, LLC and Caesars Entertainment Resort Properties Finance, Inc. are not included in the summary historical financial information of Caesars Entertainment Resort Properties. |
| (2) | The Issuers present Property EBITDA as a supplemental measure of its performance. The Issuers define Property EBITDA as revenues less property operating expenses. Set forth below is a reconciliation of net income, its most comparable measure in accordance with GAAP, to Property EBITDA. Property EBITDA is comprised of net income before (i) interest expense, net of interest capitalized and interest income, (ii) provision for income taxes, (iii) depreciation and amortization, (iv) corporate expenses and (v) certain items that the Issuers do not consider indicative of their ongoing operating performance at an operating property level. In evaluating Property EBITDA, you should be aware that in the future the Issuers may incur expenses that are the same or similar to some of the adjustments in this presentation. The Issuers’ presentation of Property EBITDA should not be construed as an inference that its future results will be unaffected by unusual or unexpected items. |
Property EBITDA is a non-GAAP financial measure commonly used in the Issuers’ industry and should not be construed as an alternative to net income as an indicator of operating performance or as an alternative to cash flow provided by operating activities as a measure of liquidity (as determined in accordance with GAAP). Property EBITDA, as calculated in this offering memorandum, may not be comparable to similarly titled measures reported by other companies within the Issuers’ industry. The Issuers have included Property EBITDA because their management uses Property EBITDA to measure performance and allocate resources, and the Issuers believe that Property EBITDA provides investors with additional information consistent with that used by its management.
| Year ended December 31, 2011 |
Year ended December 31, 2012 |
Six months ended June 30, 2012 |
Six months ended June 30, 2013 |
Twelve months ended June 30, 2013 |
||||||||||||||||
| Net income |
$ | 9.2 | $ | 43.4 | $ | 37.8 | $ | 34.0 | $ | 39.6 | ||||||||||
| Provision for income taxes |
4.3 | 21.9 | 20.0 | 13.1 | 15.0 | |||||||||||||||
|
|
|
|
|
|
|
|
|
|
|
|||||||||||
| Income before income taxes |
12.7 | 65.3 | 57.8 | 47.1 | 54.6 | |||||||||||||||
| Other Income, including interest income |
(1.3 | ) | (1.0 | ) | (0.6 | ) | (0.1 | ) | (0.5 | ) | ||||||||||
| Gain on early extinguishments of debt |
(47.5 | ) | (135.0 | ) | (78.5 | ) | (39.0 | ) | (95.5 | ) | ||||||||||
| Interest expense, net of interest capitalized |
218.6 | 231.8 | 119.8 | 108.4 | 220.4 | |||||||||||||||
|
|
|
|
|
|
|
|
|
|
|
|||||||||||
| Income from operations |
183.3 | 161.1 | 98.5 | 116.4 | 179.0 | |||||||||||||||
| Depreciation and amortization |
162.7 | 192.8 | 97.9 | 81.7 | 176.6 | |||||||||||||||
| Amortization of intangible assets |
59.6 | 59.0 | 29.5 | 29.5 | 59.0 | |||||||||||||||
| Intangible and tangible asset impairment charges |
— | 3.0 | — | 24.4 | 27.4 | |||||||||||||||
| Write-downs, reserves, and project opening costs, net of recoveries |
7.2 | 21.5 | 5.9 | 18.7 | 34.3 | |||||||||||||||
| Acquisition and integration costs |
0.2 | — | — | — | — | |||||||||||||||
| Loss/(income) on interests in non-consolidated affiliates |
1.0 | (1.4 | ) | (0.5 | ) | (2.7 | ) | (3.6 | ) | |||||||||||
| Corporate expense |
85.0 | 80.3 | 40.4 | 25.2 | 65.1 | |||||||||||||||
|
|
|
|
|
|
|
|
|
|
|
|||||||||||
| Property EBITDA |
$ | 499.0 | $ | 516.3 | $ | 271.7 | $ | 293.2 | $ | 537.8 | ||||||||||
|
|
|
|
|
|
|
|
|
|
|
|||||||||||
| Total Capital Expenditures |
(103.3 | ) | (246.7 | ) | (97.5 | ) | (148.8 | ) | (298.0 | ) | ||||||||||
| Project Linq Capital Expenditures |
60.0 | 149.2 | 48.8 | 125.8 | 226.2 | |||||||||||||||
|
|
|
|
|
|
|
|
|
|
|
|||||||||||
| Free Cash Flow |
$ | 455.7 | $ | 418.8 | $ | 223.0 | $ | 270.2 | $ | 466.0 | ||||||||||
|
|
|
|
|
|
|
|
|
|
|
|||||||||||
| (3) | LTM Adjusted EBITDA—Pro Forma is net income adjusted for (i) certain non-cash and other items that are included in net income, (ii) the pro forma impact of estimated lease and rental income from the Quad Strip-Front Lease and Project Linq, (iii) the pro forma impact of yet-to-be realized savings from the Issuers’ cost savings initiatives, (iv) the pro forma impact of certain operating initiatives such as the implementation of resort fees, (v) the projected recovery of lost Adjusted EBITDA from construction and development projects and (vi) certain other items summarized in the table and footnotes below. The Issuers present LTM Adjusted EBITDA—Pro Forma as a supplemental measure of their performance and believe that LTM Adjusted EBITDA—Pro Forma provides investors with additional information and allows a better understanding of the current and estimated results of operational activities separate from the financial impact of decisions made for the long-term benefit of the Issuers. Estimated results of operational activities are based on the related projects being open or fully implemented and operated at a steady state, which may not occur until 12 to 24 months after the High Roller observation wheel commences operations. |
LTM Adjusted EBITDA—Pro Forma is a non-GAAP financial measure and should not be construed as an alternative to net income as an indicator of operating performance. LTM Adjusted EBITDA—Pro Forma is not comparable to similarly titled measures reported by other companies. The Issuers have included LTM Adjusted EBITDA—Pro Forma because the Issuers believe it provides investors with additional information to measure its current and estimated performance and liquidity, consistent with the information used by their management and certain of their lenders to measure their performance and liquidity. The Issuers also believe that LTM Adjusted EBITDA—Pro Forma provides investors with information related to their estimated increase in Adjusted EBITDA once they have completed Project Linq.
The Issuers also believe that LTM Adjusted EBITDA—Pro Forma provides investors with information related to their estimated increase in Adjusted EBITDA once they have completed Project Linq.
LTM Adjusted EBITDA—Pro Forma has important limitations as an analytical tool, and you should not consider it in isolation, or as a substitute for analysis of the Issuers’ results as reported under GAAP. For example, LTM Adjusted EBITDA—Pro Forma:
| • | does not reflect the significant interest expenses, or the cash requirements necessary to service interest or principal payments, on the Issuers’ debt; |
| • | does not reflect any cash requirements for the assets being depreciated and amortized that may have to be replaced in the future; |
| • | excludes tax payments that represent a reduction in cash available to the Issuers; |
| • | does not reflect changes in, or cash requirements for, the Issuers’ working capital needs; |
| • | does not reflect the Issuers’ capital expenditures, future requirements for capital expenditures or contractual commitments; and |
| • | does not reflect management fees that may be paid to the Sponsors. |
LTM Adjusted EBITDA—Pro Forma includes further adjustments for pro forma adjustments for estimated lease and rental income from the Quad Strip-Front Lease and Project Linq, yet-to-be realized cost savings, the introduction of resort fees and the projected recovery of lost Adjusted EBITDA from construction and development projects. No assurance can be given that such lease and rental income will be received, such cost savings will occur or that lost Adjusted EBITDA will be recovered.
Adjustments similar to some of the ones reflected in the calculation of LTM Adjusted EBITDA—Pro Forma have been recorded in earlier periods, and similar types of adjustments for items such as resort fees can reasonably be expected to be recorded in future periods. Other adjustments reflected in the calculation of LTM Adjusted EBITDA—Pro Forma such as estimated costs savings, estimated rental income from Project Linq and the projected recovery of lost Adjusted EBITDA due to the construction of Project Linq are projections and no assurance can be given that similar types of adjustments will be recorded in future periods, The Issuers’ presentation of LTM Adjusted EBITDA—Pro Forma should not be construed as an inference that their future results will be unaffected by unusual or non-recurring items.
Using only the non-GAAP earnings measure would have material limitations because its calculation is based on the subjective determination of management, in some cases for events occurring in the future, regarding the nature and classification of events and circumstances that investors may find material. Management compensates for these limitations by using both GAAP and non-GAAP earnings measures reflected above to understand and analyze the results of the business. The Issuers believe investors find the non-GAAP information helpful in understanding the ongoing and estimated performance of operations separate from items that may have a disproportionate positive or negative impact on the Issuers’ financial results in any particular period.
Set forth below is a reconciliation of net income, the Issuers’ most comparable measure in accordance with GAAP, to LTM Adjusted EBITDA—Pro Forma for the twelve months ended June 30, 2013:
| (In millions) |
(1) Six months ended June 30, 2013 |
(2) Six months ended June 30, 2012 |
(3) Year ended December 31, 2012 |
(1)-(2)+(3) Twelve months ended June 30, 2013 |
||||||||||||
| Net Income |
$ | 34.0 | $ | 37.8 | $ | 43.4 | $ | 39.6 | ||||||||
| Interest expense, net of capitalized interest and interest income |
108.3 | 119.2 | 230.8 | 219.9 | ||||||||||||
| Provision for income taxes |
13.1 | 20.0 | 21.9 | 15.0 | ||||||||||||
| Depreciation and amortization |
111.2 | 127.4 | 251.8 | 235.6 | ||||||||||||
|
|
|
|
|
|
|
|
|
|||||||||
| EBITDA |
266.6 | 304.4 | 547.9 | 510.1 | ||||||||||||
| Project opening costs, abandoned projects and development costs(a) |
1.8 | 1.9 | 6.3 | 6.2 | ||||||||||||
| Gains on early extinguishment of debt |
(39.0 | ) | (78.5 | ) | (135.0 | ) | (95.5 | ) | ||||||||
| Impairment of intangible and tangible assets(b) |
24.4 | — | 3.0 | 27.4 | ||||||||||||
| Non-cash expense for stock compensation benefits(c) |
0.3 | 0.5 | 1.1 | 0.9 | ||||||||||||
| Other items(d) |
20.5 | 9.6 | 26.2 | 37.1 | ||||||||||||
|
|
|
|
|
|
|
|
|
|||||||||
| Adjusted EBITDA |
$ | 274.6 | $ | 237.9 | $ | 449.5 | 486.2 | |||||||||
|
|
|
|
|
|
|
|||||||||||
| Contractual EBITDA Adjustments: |
||||||||||||||||
| Pro forma adjustment for lease payments for Quad Strip-Front Lease(e) |
15.0 | |||||||||||||||
| Pro Forma adjustment for full annual lease payments under the Octavius Tower lease(f) |
3.6 | |||||||||||||||
| Pro forma adjustment for run-rate Project Linq retail rent income(g) |
14.3 | |||||||||||||||
| Additional Operational Adjustments: |
||||||||||||||||
| Pro forma adjustment for estimated cost savings yet to be realized(h) |
60.7 | |||||||||||||||
| Pro forma adjustment for annualized resort fees(i) |
9.7 | |||||||||||||||
| Pro forma adjustment for end of Project Linq and Quad disruption(j) |
9.5 | |||||||||||||||
|
|
|
|||||||||||||||
| LTM Adjusted EBITDA—Pro Forma(k) |
$ | 599.0 | ||||||||||||||
|
|
|
|||||||||||||||
Projected Run-Rate LTM Adjusted EBITDA—Pro Forma
Set forth below is an estimated range of Projected Run-Rate LTM Adjusted EBITDA—Pro Forma based on the estimated impact of the completion of Project Linq.
| (In millions) |
||||
| LTM Adjusted EBITDA—Pro Forma for Twelve Months Ended June 30, 2013 |
$ | 599.0 | ||
| Estimated Range of Projected Run-Rate LTM Adjusted EBITDA—Pro Forma attributable to High Roller observation wheel(k) |
30-60 | |||
| Estimated Range of Projected Run-Rate LTM Adjusted EBITDA—Pro Forma attributable to potential annual rental income from Project Linq(k) |
9-14 | |||
| Estimated Range of Projected Run-Rate LTM Adjusted EBITDA—Pro Forma attributable to increase in gaming revenue expected from the completion of Project Linq(k) |
5-10 | |||
|
|
|
|||
| Estimated Range of Projected Run-Rate LTM Adjusted EBITDA—Pro Forma(k) |
$ | 643.0 – 683.0 | ||
|
|
|
|||
| (a) | Amounts represent pre-opening costs incurred in connection with new property openings and expansion projects at existing properties, as well as non-cash write-offs of abandoned development projects. |
| (b) | Amounts represent non-cash charges to impair intangible and tangible assets primarily resulting from changes in the business outlook in light of economic condition. |
| (c) | Amount represent non-cash stock-based compensation expense related to stock options granted to the property employees. |
| (d) | Amounts represent add-backs and deductions from EBITDA, included in arriving at LTM Adjusted EBITDA—Pro Forma but not separately identified. Such add-backs and deductions include severance and relocation, permit remediation costs, costs incurred in connection with implementing efficiency and cost saving programs, and non-cash equity in earnings of non-consolidated affiliates (net of distributions). |
| (e) | Represents annualized lease payments that will be paid by a subsidiary of CEOC to CERP in respect of the Quad-Strip Front Lease and which are expected to begin in late 2013. |
| (f) | Represents full annual lease payments that would have been paid by a subsidiary of CEOC to CERP in respect of the Octavius Tower lease for the twelve months ended June 30, 2013 assuming the full $35.0 million annual lease payment was in effect for the entire period. |
| (g) | Represents estimated run-rate annual rental income from Project Linq retail space to be leased to third parties upon completion of Project Linq, based on the actual base rent for the space subject to executed leases and assumed base rent for the space currently under negotiations. As of the date of this offering memorandum, the Issuers intend to own and operate five spaces at Project Linq (which is approximately 15% of the leasable space of Project Linq retail space), and 76% of the remaining space is currently subject to executed leases, with the rest of the remaining space currently in negotiations. The Issuers estimate annual base rent will produce approximately $17.1 million in run-rate gross rent revenues and $14.3 million in run-rate Adjusted EBITDA. These projections do not include potential rent based on the performance of the tenants’ businesses, which is included in the lease terms, or Adjusted EBITDA that will be attributable to the five spaces the Issuers will own and operate. |
| (h) | Amounts represent adjustments to reflect (i) $42.9 million of annualized run-rate cost savings and estimated future cost savings to be realized from profitability improvement programs, (ii) the Issuers’ contractual share of 30%, or $13.5 million, of a reduction in consolidated unallocated corporate expenses by their parent, Caesars Entertainment, which is expected to be completed by 2014, and (iii) other annualized savings and adjustments of $4.3 million related to the purchase of previously leased slot machines in 2012 and the add-back of Margaritaville joint venture Adjusted EBITDA contribution, which under GAAP reporting is recognized as income from investments. |
| (h) | Represents incremental Adjusted EBITDA attributable to the $9.7 million annualized run rate impact on Adjusted EBITDA of resort fees introduced at the Issuers’ four Las Vegas casino properties on March 1, 2013, based on actual resort fees received from March 1, 2013 through June 30, 2013. |
| (i) | Represents the Issuers’ estimated incremental Adjusted EBITDA attributable to the projected recovery of lost Adjusted EBITDA due to visitation reduction to Harrah’s Las Vegas and to the Flamingo due to construction at the Quad, which is expected to be completed in the fourth quarter of 2013, Project Linq, which is scheduled to open in phases beginning in late 2013 and fully opened by the second quarter of 2014, and the redevelopment of the east side of the Las Vegas strip (including the construction of the Gansevoort Las Vegas Hotel, which is expected to open in the first quarter of 2014), which have negatively impacted visitation since 2012, resulting in an estimated 3% to 7% reduction in visitation and gaming volume, representing an estimated $8 million to $11 million reduction to Adjusted EBITDA during the twelve months ended June 30, 2013. The $9.5 million set forth above represents the midpoint of CERP’s estimated range of the reduction. |
| (j) | LTM Adjusted EBITDA—Pro Forma does not include the projected annual run-rate Adjusted EBITDA of $20 million to $60 million attributable to the High Roller observation wheel scheduled to be completed by the end of the second quarter of 2014, the projected annual run-rate Adjusted EBITDA of $4 million to $8 million attributable to estimated potential annual rental income from Project Linq based on the performance of the tenants’ businesses, which is included in the lease terms, or the projected annual run-rate Adjusted EBITDA increase of $5 million to $10 million from additional gaming revenue at Flamingo and Harrah’s Las Vegas expected to result from the completion of Project Linq, which the Issuers’ estimate will increase visitation to Flamingo and Harrah’s Las Vegas, which together total between $29 million and $78 million in projected increases. These projections reflect the annual run-rate Adjusted EBITDA estimated from each project once open or fully implemented and operated at a steady state, which may not occur until 12 to 24 months after the High Roller observation wheel commences operations. For more information regarding these projected increases and Project Linq. These projections are based on the current estimates of the Issuers, but they involve risks, uncertainties, assumptions and other factors that may cause actual results, performance or achievements of the Issuers to be materially different from any future results, performance or achievements expressed or implied by projections |
Estimated Impact of Completion of Project Linq
CERP expects that the completion of Project Linq will have a significant positive impact on its results of operations. The following discusses the estimated impact of the completion of Project Linq, and the estimates assume the related project is open or fully implemented and operated at a steady state, which may not occur until 12 to 24 months after the High Roller observation wheel commences operations.
End of Construction Disruption
Based upon CERP’s review of the trends and results of operations at other properties owned by Caesars Entertainment, CERP believes Project Linq construction has negatively impacted performance at the Casino Resort Properties since construction began in 2011, specifically at Harrah’s Las Vegas and Flamingo. CERP estimates the Adjusted EBITDA impact of this disruption for the twelve months ended June 30, 2013 was between $8 million and $11 million.
Operation of High Roller Observation Wheel
Based on the performance of other comparable attractions and visitation to Las Vegas, CERP estimates that ridership on the High Roller observation wheel will range between 3 million and 4 million passengers annually. CERP plans to dynamically yield pricing for tickets to ride the observation wheel and estimates that spend per passenger will likely range between $16.50 and $21.50 on average. CERP’s
estimates for the ridership on the High Roller observation wheel and the range of spend per customer are based on a third-party consultant report regarding the performance of similar attractions from 2010, prior to when CERP initiated construction. Since then CERP has updated the results of that report based upon estimates by members of management and the Project Linq design team. The High Roller observation wheel’s operations will consist mainly of fixed costs. CERP projects margins of approximately 60% to 70%, which would yield Adjusted EBITDA from the High Roller observation wheel ranging between $30 million to $60 million annually.
Estimated Additional Income from Project Linq
CERP estimates annual base rent from Project Linq will result in approximately $14.3 million of Adjusted EBITDA. This estimate does not include potential rent based on the performance of Project Linq’s tenants’ businesses, which is included in the lease terms. CERP’s estimates of the performance of the tenants’ businesses are based on third-party consultant reports relating to the average sales per square foot of retail space from 2010, prior to when CERP initiated construction. Since then CERP has updated the results of the reports based upon estimates by members of management. In addition, CERP projects to generate incremental Adjusted EBITDA from the five spaces that it will own and operate. CERP projects that the estimated potential annual rental income from Project Linq based on the performance of the tenants’ businesses and Adjusted EBITDA from the five spaces CERP will own and operate would collectively result in approximately $9 million to $14 million of Adjusted EBITDA annually.
Increase in Gaming Revenue
Prior to the commencement of the Project Linq construction in 2011, a pedestrian circulation analysis was performed that indicated this corridor saw north of 20 million pedestrians annually walk by its primary entranceway. CERP estimates that its properties should capture approximately 4% to 5% of this pedestrian traffic as incremental gaming trips, at an average spend per patron of $10 - $15. Incremental gaming revenue at CERP’s Las Vegas properties is projected to have a 65% flowthrough to Adjusted EBITDA, implying a $5 million to $10 million uplift in annual Adjusted EBITDA to CERP’s Casino Resort Properties from Project Linq. Additionally, CERP expect improved occupancy and spend at both its hotel and restaurant and bar offerings as a result of increased traffic to the area.