Attached files
| file | filename |
|---|---|
| 8-K - 8-K - AGILENT TECHNOLOGIES, INC. | body.htm |
| EX-99.1 - PRESS RELEASE - AGILENT TECHNOLOGIES, INC. | ex1.htm |

Agilent Technologies
Separating Into Two Industry-Leading
Public Companies
to Increase Strategic Flexibility
and Enhance Shareholder Value
Public Companies
to Increase Strategic Flexibility
and Enhance Shareholder Value
September 19, 2013
Page *
Exhibit 99.2

Safe Harbor
This presentation contains forward-looking statements (including, without limitation, information and future
guidance on the company’s goals, priorities, the planned separation of our Electronic Management Group,
revenues, demand, growth opportunities, customer service and innovation plans, new product introductions,
financial condition, earnings, the company’s ability to pay dividends, ability to access capital markets, the
continued strengths and expected growth of the markets the company sells into, operations, operating earnings,
and tax rates) that involve risks and uncertainties that could cause results of Agilent to differ materially from
management’s current expectations. The words “anticipate,” “plan,” “estimate,” “expect,” “intend,” “will,” “should”
“forecast” “project” and similar expressions, as they relate to the company, are intended to identify forward-
looking statements.
In addition, other risks that the company faces in running its operations include the ability to execute successfully
through business cycles; the ability to successfully adapt its cost structures to continuing changes in business
conditions; ongoing competitive, pricing and gross margin pressures; the risk that our cost-cutting initiatives will
impair our ability to develop products and remain competitive and to operate effectively; the impact of
geopolitical uncertainties on our markets and our ability to conduct business; the ability to improve asset
performance to adapt to changes in demand; the ability to successfully introduce new products at the right time,
price and mix, and other risks detailed in the company's filings with the Securities and Exchange Commission,
including our quarterly report on Form 10-Q for the quarter ended July 31, 2013.
The company assumes no obligation to update the information in these presentations. These presentations and
the Q&A that follows include non-GAAP measures. Non-GAAP measures exclude primarily the impacts of
acquisition and integration costs, future restructuring costs, asset impairment charges, and non-cash intangibles
amortization. Also excluded are tax benefits that are not directly related to ongoing operations and which are
either isolated or cannot be expected to occur again with any regularity or predictability. Most of these excluded
amounts pertain to events that have not yet occurred and are not currently possible to estimate with a
reasonable degree of accuracy. Accordingly, no reconciliation to GAAP amounts has been provided.
Page 2

The World’s Premier Measurement Company
Agilent Labs
Order Fulfillment
Life
Sciences
Group
FY13 Revenue $1.6B
Operating Margin 16%
Operating Margin 16%
Chemical
Analysis
Group
FY13 Revenue $1.6B
Operating Margin 22%
Operating Margin 22%
Electronic
Measurement
Group
FY13 Revenue $2.9B
Operating Margin 19%
Operating Margin 19%
Diagnostics &
Genomics
Genomics
Group
FY13 Revenue $0.7B
Operating Margin 15%
Operating Margin 15%
Finance, HR, Legal, IT, Workplace Services
FY13 Revenue $6.8B, Core Growth(2) -3%, Operating Margin 18.5%,
ROIC 16%, Free Cash Flow $900M, Debt/EBITDA 1.9x
ROIC 16%, Free Cash Flow $900M, Debt/EBITDA 1.9x
EM Markets
LDA Markets FY13(1) Revenue $3.9B, Operating Margin 18%
(1) FY13 numbers are estimates based on the midpoint of Company guidance provided on August 14, 2013.
(2) Core growth is reported growth adjusted for the effects of M&A and FX.
Page 3

Agilent to Split into Two Companies
Strategic Rationale for Separation
• Capitalizing on EMG, Agilent has grown LDA to be a sizeable and
highly competitive business
highly competitive business
• Spin-off to create two companies with greater strategic and
management focus, each well positioned for growth in its sector
management focus, each well positioned for growth in its sector
• Distinct industries and drivers
• Greater strategic focus
• Both businesses have the scope to stand on their own
• Two unique and compelling investment profiles
• Positioned to attract a more focused shareholder base
• Better aligned with research analyst coverage universe and peer
comparisons
comparisons
Move Designed to Increase Strategic Flexibility
and Enhance Shareholder Value
and Enhance Shareholder Value
Page 4

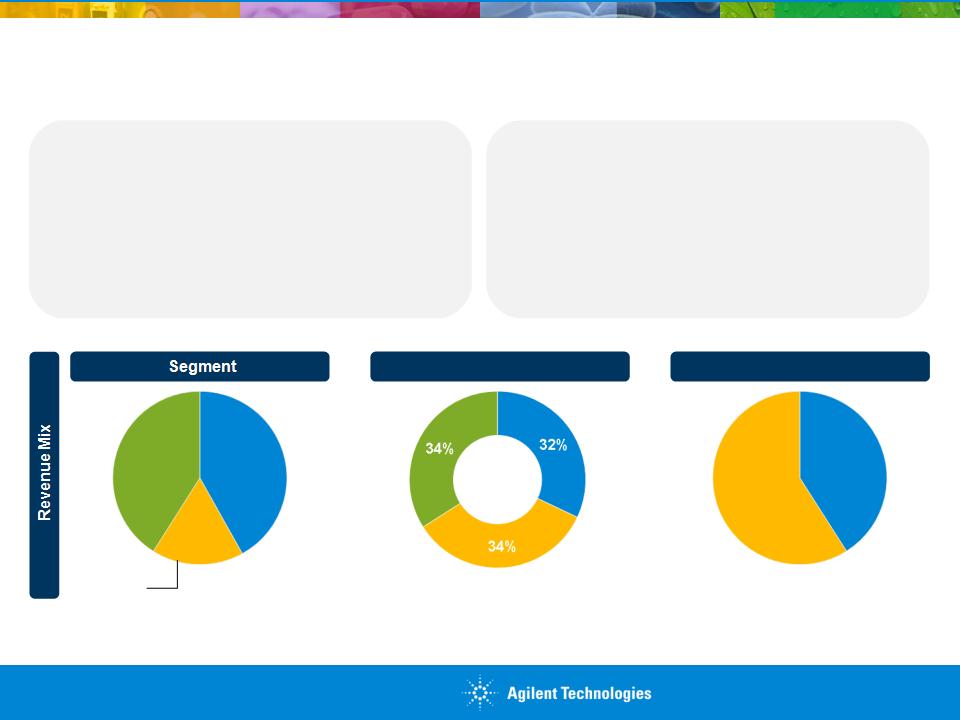
Two Independent Publicly Traded Companies
LDA-Focused Company
(New Agilent)
(New Agilent)
EM-Focused Company
(To Be Named)
Revenue Mix
Financial
Metrics(1)
Metrics(1)
Key
Platforms
Platforms
|
§ Revenue: $3.9B
§ Operating Margin: 18%
§ ROIC: 11%
|
§ Revenue: $2.9B
§ Operating Margin: 19%
§ ROIC: 31%
|
|
§ Liquid & Gas Chromatography
§ Mass Spectrometry
§ Spectroscopy
§ Nuclear Magnetic Resonance
§ Genomics & Diagnostics (Dako)
§ Consumables, Services, Software
|
§ Source & Signal Analyzers
§ Network Analyzers
§ One-box Testers
§ Oscilloscopes
§ Modular & Handheld
§ Services & Software
|
(1) FY13 numbers are estimates based on the midpoint of Company guidance provided on August 14, 2013.
Page 5

Management Teams
New Agilent
EM Company
Bill Sullivan, President
and CEO
and CEO
Ron Nersesian, President
and CEO designate
and CEO designate
Didier Hirsch, Chief
Financial Officer
Financial Officer
Neil Dougherty, Chief
Financial Officer designate
Financial Officer designate
(formerly VP and Treasurer
of Agilent Technologies)
of Agilent Technologies)
Page 6

New Agilent: Life Sciences,
Diagnostics, and Applied
Markets
Diagnostics, and Applied
Markets
Page *
New Agilent Overview
• Global leader in Life Sciences, Diagnostics, and
Applied markets
Applied markets
• Attractive recurring revenue base
• Balanced geographic revenue profile
• Growth opportunities in emerging markets, molecular
diagnostics and clinical
diagnostics and clinical
• Significant margin expansion opportunities
• Revenues: $3.9B, +9% y/y (+5% core(2))
• Operating Margin: 18% of revenue
• ROIC: 11%
FY13(1) Financial Metrics
(1) FY13 numbers are estimates based on the midpoint of Company guidance provided on August 14, 2013.
(2) Core growth is reported growth adjusted for the effects of M&A and FX.
Geography
Type
Genomics &
Diagnostics
17%
Diagnostics
17%
Life
Sciences
42%
Sciences
42%
Chemical
Analysis
41%
Analysis
41%
Non-
Recurring
59%
Recurring
59%
Recurring
41%
41%
Americas
Europe
Asia Pacific
Page 8

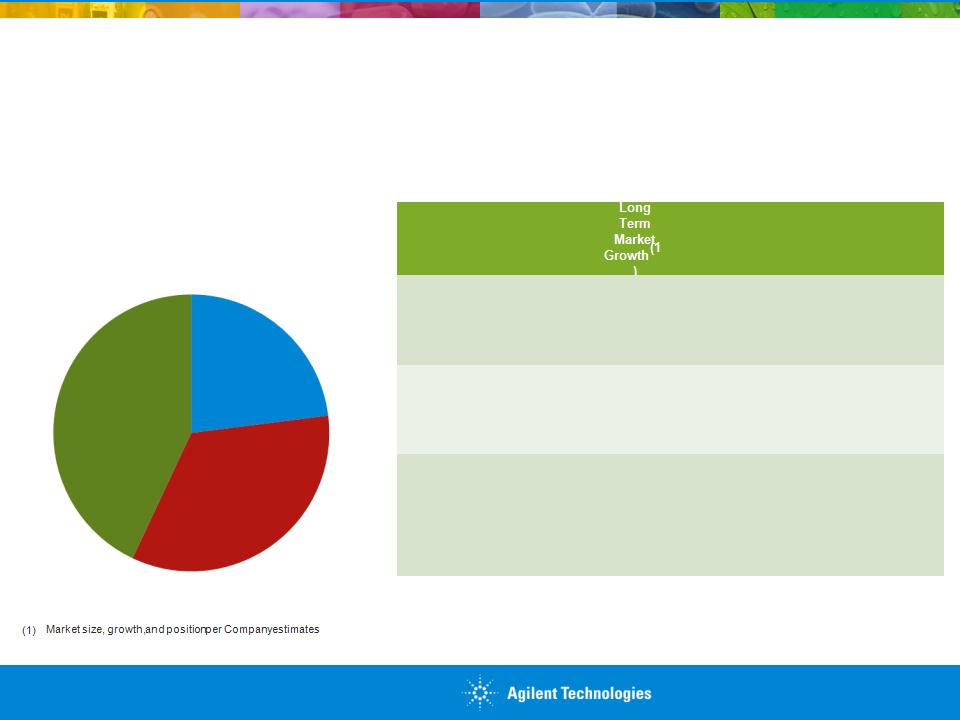
New Agilent: Market Profile
|
End Markets
|
Market
Size(1) |
Long Term
Market Growth(1) |
Market
Position(1) |
Growth Drivers
|
|
$11B
|
4-6%
|
#3
|
• Shift to new biological
entities • Emerging markets
|
|
|
$10B
|
3-5%
|
#4
|
• Global investments in
Life Science research |
|
|
$7B
|
8-10%
|
#2 &
emerging |
• Increasing patient
population • Companion
diagnostics |
|
|
$4B
|
5-7%
|
#1
|
• Global food supply
• Government
regulations |
|
|
$5B
|
2-4%
|
#1 & #2
|
• New environmental
contaminants • Designer drugs
|
|
|
$4B
|
4-6%
|
#1
|
• Rising energy
demands • Alternative energy
|
Market Size(1): $41B
Long Term Market Growth(1): 4-
6%
6%
Revenue Mix(2)
by End Market
(1) Market size, growth, and position per Company estimates
(2) Percentage of LDA revenue based on Q4’12-Q3’13
Page 9

Growth through technology leadership,
customer intimacy, workflow solutions
customer intimacy, workflow solutions
Higher recurring revenue mix (from 29% to
41%(1))
41%(1))
Continued strategic push from lab to the
clinic. Ensuring the success of Dako
clinic. Ensuring the success of Dako
Focused on similar markets with higher
growth rates and lower cyclicality
growth rates and lower cyclicality
Leadership in Life Sciences, Diagnostics,
and Applied markets
and Applied markets
Pure play Life Sciences, Diagnostics, and
Analytical Company
Analytical Company
Same
Different
Margin improvement through reduced
manufacturing, logistics costs, and sales
channel leverage
manufacturing, logistics costs, and sales
channel leverage
Allows management to focus exclusively
on running LDA business
on running LDA business
Business model better aligned with
shareholder base and peer group
shareholder base and peer group
What’s Different for New Agilent?
Scale and financial strength to stand on its
own
own
Attracting and retaining top talent in the
industry
industry
Continuing to build on strong foundation in
emerging markets
emerging markets
(1) Percentage of recurring revenue based on Q4’12-Q3’13
Page 10

New Agilent: Strategy to Win
Creating Shareholder Value
§ Increase organic growth rate
ü Leverage large and growing installed base to expand recurring revenues and
core instrument sales
core instrument sales
ü Take advantage of greenfield opportunities in developed markets (clinical
instrumentation, integrated biology, sample preparation)
instrumentation, integrated biology, sample preparation)
ü Leverage presence in emerging markets
ü Ensure success of Dako and Varian acquisitions
§ Grow earnings faster than revenues
ü Continued improvement in gross margins
ü Drive operating margin expansion and increase ROIC
§ Deliver complete workflow solutions for our customers
ü Core data system platform to easily enable application development in the lab
and correlate data from research to the clinic, allowing for deeper insight
and correlate data from research to the clinic, allowing for deeper insight
ü Bolt-on acquisitions that help complete the workflow. Focused on sequencing
and related technologies, molecular diagnostics, and consumables
and related technologies, molecular diagnostics, and consumables
Page 11

Electronic Measurement
Focused Company
Focused Company
Page *

• Leading position in major markets
• Global electronic measurement technology
and market leader
and market leader
• Growth opportunity in emerging markets
• Strong cash flow generation and ROIC
• Industry leading gross and operating
margins
margins
• $450M of recurring services & support
revenue. $300M of software sales
revenue. $300M of software sales
(1) FY13 numbers are estimates based on the midpoint of Company guidance provided on August 14, 2013.
(2) Core growth is reported growth adjusted for the effects of M&A and FX.
Q3’13 Revenue Mix
by Geography
Asia Pacific
Americas
Europe
FY13(1) Financial Metrics
Communications
#1
Industrial,
Computers,
Semiconductors
Computers,
Semiconductors
#1
Aerospace
Defense
#1
EM Company Overview
The World’s Premier Electronic Measurement Company
The World’s Premier Electronic Measurement Company
Page 13
EM Company: Market Profile
(2) Percentage of EM revenue based on Q4’12-Q3’13
(3) Excludes network assurance
|
End Markets
|
Market
Size(1) |
Long
Term Market Growth(1 ) |
Growth Drivers
|
Market
Position |
|
Communications(3
) |
$4B
|
4-6%
|
• Mobile data traffic growth
• Complex components and
chipsets • Subscriber growth in
China, India, Brazil |
#1
|
|
Aerospace &
Defense |
$3B
|
Flat
|
• Satellites and radar
modernization outside U.S. • Intelligence, surveillance,
reconnaissance (ISR) |
#1
|
|
Industrial,
Computer & Semiconductor |
$6B
|
3-5%
|
• Electronic content
proliferation • Mobile computing
• High performance cloud
infrastructure • Education and research in
emerging markets |
#1
|
Communications
34%
34%
Industrial,
Computer &
Semiconductor
43%
Computer &
Semiconductor
43%
Aerospace &
Defense
23%
Defense
23%
Market Size(1): $13B
Long Term Market Growth(1): 3-
4%
4%
Revenue Mix(2)
by End Market
Page 14

Electronic measurement top opportunities
are company’s top opportunities
are company’s top opportunities
Same customers and global footprint
New name
Top talent
Strong position in emerging markets
Organic growth, tuck-in acquisitions
Whole company 100% focused on EM and
customer success
customer success
Focus: profit and cash generation
#1 in key markets
Business model completely aligned with
shareholders and analysts
shareholders and analysts
Same
Different
Corporate headquarters in Santa Rosa
What’s Different for EM Company?
Technology leadership
Alignment between incentive compensation
and EM value creation
and EM value creation
Page 15

EM Company Strategy to Win
§ World’s premier electronic test and measurement provider in Communications,
Aerospace/Defense, and Industrial markets
Aerospace/Defense, and Industrial markets
§ First to market with leading edge customer-valued technology solutions
ü Take share in core platforms
ü Top opportunities in electronic measurement industry are now
the company’s top opportunities
the company’s top opportunities
ü Transform the measurement experience
§ World’s best customer satisfaction with lowest cost of ownership
§ Manage market volatility by continuing to generate strong cash flow, ROIC, and
solid earnings throughout the cycle
solid earnings throughout the cycle
§ Management team with deep EM experience and track record of delivering on
tough financial commitments
tough financial commitments
Page 16

|
Goal
|
Actions taken since 2009 downturn
|
EM Company Strong Profitability Throughout the
Cycle
Cycle
Restructured Operations to Maintain Strong Profitability
During Periods of Market Volatility
During Periods of Market Volatility
Lower Costs
Shift Fixed Costs
to Variable
Focus on Core
|
n Reduced headcount by 2700 people
n Focused on continuous GM improvement - value engineering
|
|
n Increased use of Contract Manufacturing
n Increased indirect channel for variable selling cost
n Increased use of external resources
|
|
n Maintained R&D investment for technology leadership and application solutions
n Leveraged technology investment throughout product portfolio
n Owns critical enabling technology in ASICS, microcircuits, and gallium arsenide
|
Page 17

Transaction Details
Transaction
Structure
Structure
Timing
Financial
Details
Details
|
n Agilent shareholders will receive a pro rata distribution of shares in EM Company via a tax
-free spin-off |
|
n Expected to be completed by end of calendar year 2014, subject to the satisfaction of
customary closing conditions, including: — Final approval by the Agilent Board of Directors
— Receipt of favorable rulings from the IRS
— Effectiveness of a Form 10 filing with the SEC
— Receipt of regulatory approvals in all major jurisdictions
|
|
n Both companies to be well capitalized, have strong balance sheets and expected
investment grade profiles with target debt to EBITDA ratios below 2.0x n LDA-focused company is expected to continue to pay a dividend at least equal to the
current yield n Not anticipated to impact Agilent’s guidance for fiscal year 2013. Plan to provide fiscal
year 2014 guidance at next earnings announcement in mid November n Expected to incur one-time charges related to the transaction during the periods
preceding the separation, to be quantified at a later date n Expect to retire a portion of current Agilent long-term debt outstanding, utilizing EM
Company capital n During the transition Agilent expects to continue its dividend and repurchase shares to at
least maintain current share count |
Page 18

§ Leverage prior experience
ü Agilent has completed four major spin-offs/divestitures since 2005
§ Dis-synergies of ~ $100M cumulative over three year period
ü Little real estate overlap outside of sales offices
ü Clean ERP separation
ü Most dis-synergies in shared infrastructure organization
• Replicate current Colorado Springs Data Center to provide IT infrastructure
for both companies
for both companies
• New Agilent to provide infrastructure services, such as payroll, IT, financial
services until EM Company can operate independently (~1 year after spin)
services until EM Company can operate independently (~1 year after spin)
ü Both companies to develop specific action plans to minimize dis-synergies over time
Spin-off Execution Plan
Page 19

Appendix
Page *

New Agilent Historical Consolidated Income
Statement(1)
Statement(1)
Page 21
|
$M
|
FY 2010
|
FY 2011
|
FY 2012
|
|
Revenue
|
2,679
|
3,310
|
3,543
|
|
% YoY
|
30%
|
24%
|
7%
|
|
COGS
|
1,245
|
1,603
|
1,685
|
|
Gross Margin %
|
54%
|
52%
|
52%
|
|
Operating Expenses
|
936
|
1,157
|
1,225
|
|
% Revenue
|
35%
|
35%
|
35%
|
|
Operating Profit
|
498
|
550
|
633
|
|
% Revenue
|
19%
|
17%
|
18%
|
(1) Presented on a non-GAAP basis; reconciliations to closest GAAP equivalent provided

EM Company Historical Consolidated Income
Statement(1)
Statement(1)
Page 22
|
$M
|
FY 2010
|
FY 2011
|
FY 2012
|
|
Revenue
|
2,784
|
3,316
|
3,315
|
|
% YoY
|
15%
|
19%
|
0%
|
|
COGS
|
1,158
|
1,378
|
1,428
|
|
Gross Margin %
|
58%
|
58%
|
57%
|
|
Operating Expenses
|
1,188
|
1,178
|
1,136
|
|
% Revenue
|
43%
|
36%
|
34%
|
|
Operating Profit
|
438
|
760
|
751
|
|
% Revenue
|
16%
|
23%
|
23%
|
(1) Presented on a non-GAAP basis; reconciliations to closest GAAP equivalent provided

Broadest range of solutions across ecosystem, including
•Components and chipsets - Simulation tools, network analyzers
Market Reach, Customer Trust
•Global footprint with R&D in US, Europe and Asia
•Recognized leader in electronic test and measurement
•Leadership in standards bodies
• Handsets - One-box testers for R&D and manufacturing
• Base Stations - Signal analyzers, sources
• Wireline / Optical - Optical modulation analyzers
Key Drivers
How We Win
Key New Products
•Combination of bench-top and modular to deliver best solutions
•Highly differentiated platforms for mobile device R&D and manufacturing to launch in
H1’14
H1’14
• Mobile data traffic grows at double-digit rates each year
• Components and chipsets increase in complexity
• Subscriber growth in China, India, Brazil
EM Company in Communications
Market Size(1): $4B
Long Term Market
Growth(1): 4-6%
Growth(1): 4-6%
Market Position(1):
#1
#1
Page 23
(1) Market size, growth, and position per Company estimates

EM Company in Aerospace & Defense
Market Size(1): $3B
Long Term Market
Growth(1): Flat
Growth(1): Flat
Market Position(1): #1
Key Drivers
How We Win
• Growth comes from outside US (Russia, China, India, Middle East) driven by new
satellites and radar technologies
satellites and radar technologies
• Growth of intelligence, surveillance, and reconnaissance
Leading Technology, Application Solutions, including
•Direct wideband radar - 90000 X-Series oscilloscopes
•Wideband radar simulation -- Arbitrary waveform generator
•Lowest phase noise for radar - Performance signal generators
•Best amplifier characterization for satellite communications - PNA-X
•Mission-critical network surveillance - unique contribution
Market Reach, Customer Trust
•Largest installed base
•World-class, long-term service and support
•Network of system integrators and in-house capabilities
Key New Products
•Leading high-performance oscilloscopes with proprietary technology
•RF and microwave modular products with lab-quality measurements
•Industry’s highest performing handhelds
Page 24
(1) Market size, growth, and position per Company estimates

EM Company in Industrial, Computer &
Semiconductors
Semiconductors
Market Size(1): $6B
Long Term Market
Growth(1): 3-5%
Growth(1): 3-5%
Market Position(1): #1
Key Drivers
How We Win
• Electronic content in industrial segment continues to proliferate
• Mobile computing driven by smartphones, tablets, and notebook PCs
• Cloud computing requires high-performance infrastructure
• Semiconductor R&D-driven innovation
• Strategic investments in education and research in emerging countries
Leading Technology, Application Solutions, including
•Industry-leading PCI-Express Gen3 - Oscilloscopes, bit error rate testers (BERTs),
protocol analyzers
protocol analyzers
•Premier battery drain characterization - Source measure units (SMUs)
•First THz materials research solution - Performance network analyzers
Market Reach, Customer Trust
•Award-winning products plus expanded indirect channel
•Leadership in high-speed digital standards: PCI Express, USB, HDMI
Key New Products
•Differentiated oscilloscope offering with ongoing ease-of-use innovation and value
integration
integration
Page 25
(1) Market size, growth, and position per Company estimates

|
Applications
|
Market
Position (1) |
Markets
|
Competitors
|
|
|
Designs, simulates, & optimizes
electronic circuit performance prior to building the prototype |
#1
|
Communications,
Aerospace/Defense, Industrial/Computer/S emi (ICS) |
•Cadence
•National Instruments
|
|
|
For wireless
devices—measures performance at chip, module or device level prior to deploying in network |
#3
|
Communications
|
•Anritsu
•Rohde & Schwarz
•Teradyne (LitePoint)
|
|
|
Characterizes responses of
devices & components in an electrical network |
#1
|
Communications,
Aerospace/Defense, ICS |
•Anritsu
•Rohde & Schwarz
|
|
|
Measures changing electrical
signals at different points in a circuit or system |
#2
|
Communications,
Aerospace/Defense, ICS |
•Danaher (Tektronix)
•LeCroy (Teledyne)
|
|
|
Measures magnitude or power
of signal versus frequency |
#1
|
Communications,
Aerospace/Defense |
•Anritsu
•Rohde & Schwarz
|
|
|
Applies signals to circuits under
development in order to predict device behavior |
#1
|
Communications,
Aerospace/Defense |
•Rohde & Schwarz
•Aeroflex
|
|
|
|
|
|
|
|
HP/Agilent
Introduced
Introduced
1983
1967
1956
1964
1939
1985
EM Company: Key Product Platforms
Key platforms account for >50% of revenue
Page 26
(1) Source: Prime Data

New Agilent: Life Sciences Overview
Pharma & Biotech
Academia &
Government Research
Markets & Market Position
#3
#4
Market Size(1): $21B
#1 in Liquid Chromatography (LC)
#3 in Mass Spectrometry (MS)
#2 in Nuclear Magnetic Resonance (NMR)
Q3’13 Revenue Mix
by Geography
Asia Pacific
Americas
Europe
LSG also sells into the applied markets
• Revenues: $1.6B, +3% y/y (+4% core(3))
• Operating Margin: 16% of revenue
FY13(2) Financial Metrics
(1) Market size, growth, and position per Company estimates
(2) FY13 numbers are estimates based on the midpoint of Company guidance provided on August 14, 2013
(3) Core growth is reported growth adjusted for the effects of M&A and FX
• Pharma shift from new chemical entities (NCEs) to new
biological entities (NBEs) and biosimilars
biological entities (NBEs) and biosimilars
• Significant potential for our platforms in emerging markets
• Relocation, decentralization of pharma infrastructure
• Investments in world-class academic base
Global Trends
Page 27

New Agilent: Diagnostics and Genomics Overview
Anatomic Pathology
Molecular Diagnostics
Market Size(1): $7B
Markets & Market Position
#2
Emerging
Q3’13 Revenue Mix
by Geography
Asia Pacific
Americas
Europe
DGG also sells into the pharmaceutical
and research markets
and research markets
• Revenues: $0.7B, +65% y/y (+9% core(3))
• Operating Margin: 14.5% of revenue
• Increasing patient population (aging, lifestyle impacts)
• Increasing understanding of cancer markers and pathways
• Greater access to healthcare in emerging markets
• Companion diagnostics bring diagnostic and treatment
solutions together to enable personalized medicine
solutions together to enable personalized medicine
• Improved molecular diagnostic approaches
Global Trends
FY13(2) Financial Metrics
Page 28
(1) Market size, growth, and position per Company estimates
(2) FY13 numbers are estimates based on the midpoint of Company guidance provided on August 14, 2013
(3) Core growth is reported growth adjusted for the effects of M&A and FX

New Agilent: Chemical Analysis Group Overview
Market Size(1): $13B
Q3’13 Revenue Mix
by Geography
Asia Pacific
Americas
Europe
Food
#1
Environmental
and Forensics
and Forensics
#1 and #2
Chemical
and Energy
#1
Markets and Market Position
New Global Trends
•Global food supply
•New environmental contaminants
•Designer drugs
•Rising energy demands
• Revenues: $1.6B, +2% y/y (+4% core(3))
• Operating Margin: 22% of revenue
FY13(2) Financial Metrics
Page 29
(1) Market size, growth, and position per Company estimates
(2) FY13 numbers are estimates based on the midpoint of Company guidance provided on August 14, 2013
(3) Core growth is reported growth adjusted for the effects of M&A and FX
New Agilent: Key Product Platforms
Key platforms account for >50% of revenue
Key platforms account for >50% of revenue
|
Platform
|
Applications
|
Markets
|
Market
Position(1) |
Competitors
|
|
LC
|
Pharma R&D and QC
Molecular biology, cancer research
Education & Research / Routine testing
|
Pharma & Biotech
Academia & Government
|
#1
|
Waters, Shimadzu,
Thermo |
|
LC-MS
|
Discovery and Development
Differential Expression and Pathway Analysis
Protein ID, Protein Quantitation
|
Pharma & Biotech
Applied Markets
|
#3
|
Waters, Danaher
Thermo, Bruker,
Shimadzu |
|
GC
|
Separate a liquid or gas sample into its individual
components |
Chemical & Energy
Forensics
|
#1
|
Shimadzu,
PerkinElmer, Thermo, Bruker |
|
GC-MS
|
Identify known and unknown components or
contaminants |
Environmental/Forensics
Food Safety
Chemical & Energy
|
#1
|
Thermo, Shimadzu,
Bruker, Perkin Elmer
|
|
Spectroscopy
|
ATOMIC: Identify and measure the concentrations
of elements in a solid or liquid sample MOLECULAR: Measure the amount, presence or
distribution of molecular material in a sample |
Environmental
Chemical & Energy
Pharma & Biotech
|
#3
|
Thermo,
PerkinElmer, Thermo, Bruker, Shimadzu
|
|
Genomics
|
Sample prep for next-gen sequencing
Microarrays for research and cytogenetic testing
FISH for research and clinical applications
|
Academia & Government
Pharma & Biotech
Diagnostics & Clinical
|
#2 in Target
Enrichment and Microarray |
Thermo (Life),
Illumina, Affymetrix |
|
NMR
|
Structure elucidation, molecular dynamics and in
vivo imaging for broad range of small molecules, nucleic acids, proteins |
Academia & Government
Pharma & Biotech
|
#2
|
Bruker, JEOL
|
|
Dako
|
Cancer diagnostics within anatomic pathology
|
Diagnostics & Clinical
|
#2
|
Roche (Ventana)
Danaher (Leica)
|
Page 30
(1) Market position per Company estimates