Attached files
| file | filename |
|---|---|
| 8-K - FORM 8-K - Global Eagle Entertainment Inc. | v355338_8k.htm |

1 Investor Presentation September 2013

2 Safe Harbor Statement We make forward - looking statements in this prospectus and the documents incorporated by reference herein within the meaning of the Securities Litigation Reform Act of 1995 . These forward - looking statements relate to expectations or forecasts for future events, including without limitation our earnings, revenues, expenses or other future financial or business performance or strategies, or the impact of legal or regulatory matters on our business, results of operations or financial condition . These statements may be preceded by, followed by or include the words “may,” “might,” “will,” “will likely result,” “should,” “estimate,” “plan,” “project,” “forecast,” “intend,” “expect,” “anticipate,” “believe,” “seek,” “continue,” “target” or similar expressions . These forward - looking statements are based on information available to us as of the date they were made, and involve a number of risks and uncertainties which may cause them to turn out to be wrong . Accordingly, forward - looking statements should not be relied upon as representing our views as of any subsequent date, and we do not undertake any obligation to update forward - looking statements to reflect events or circumstances after the date they were made, whether as a result of new information, future events or otherwise, except as may be required under applicable securities laws . As a result of a number of known and unknown risks and uncertainties, our actual results or performance may be materially different from those expressed or implied by these forward - looking statements . This presentation also contains Adjusted EBITDA, which is a non - GAAP financial measure . The presentation of Adjusted EBITDA is not intended to be considered in isolation or as a substitute for, or superior to, the financial information prepared and presented in accordance with GAAP . For more information on this non - GAAP financial measure, please see the tables captioned "Reconciliation of Adjusted EBITDA to Net Loss" included at the end of this presentation . Adjusted EBITDA is the primary measure used by the Company's management and board of directors to understand and evaluate its financial performance and operating trends, including period to period comparisons, to prepare and approve its annual budget and to develop short and long term operational plans . We define Adjusted EBITDA as net income (loss) before income tax expense, other income (expense), interest expense (income), depreciation and amortization, stock - based compensation, acquisition and realignment costs, F/X gain (loss) on intercompany loans and any gains or losses on certain asset sales or dispositions . Acquisition and realignment costs include such items, when applicable, as ( 1 ) legal, accounting and other professional fees directly attributable to acquisition activity, ( 2 ) employee severance payments attributable to acquisition or corporate realignment activities, and ( 3 ) expenditures related to the business combination in January 2013 . Management does not consider these expenses to be indicative of the Company's ongoing operating results or future outlook .

3 Contents ▪ Investment thesis ▪ Business overview ▪ Content solutions ▪ Connectivity products and services ▪ Financial overview ▪ Appendix

4 Investment Thesis ▪ Leading supplier to rapidly growing In - flight Entertainment and Connectivity (“IFE&C”) media market ▪ Segments served by Global Eagle expected to grow by nearly 20% 1 annually through 2018 ▪ Global Eagle growing organically and through acquisitions with first deal closed in Q3 2013 ▪ Global customer base serving 150+ airlines worldwide best positions company to capture share in fastest - growing international markets ▪ Best - in - class technology and product offering ▪ Strong Management Team and Board of Directors with deep airline, media, and technology backgrounds 1 Source: Frost and Sullivan, July 2013
Business Overview

6 Global Eagle Provides Content and Connectivity Solutions to IFE&C Market Connectivity Content ▪ Movies, TV, audio programming – Hollywood and worldwide ▪ Original and licensed games and applications ▪ Technical and content integration services ▪ Software development (GUI, web - based applications, others) ▪ Platform agnostic – connected or embedded systems ▪ Satellite - based Internet connectivity ▪ Live TV programming ▪ Video on - demand programming ▪ Online portal services – shopping, destination deals, texting ▪ Streaming WiFi VoD delivery system

7 Global Eagle is the Market Leader Connectivity Content IFE Embedded Hardware 4 - year projected industry CAGR : 24% 7% 8% 2017 estimated market size: ($ billions) $1.5 $0.4 $2.1 Global Eagle x Connectivity system operating on 500+ aircraft today x Largest installed base of satellite - based systems x Ku - band satellite system operates over land and water x Market leader with well over 50% of total market x Platform agnostic ̶ content to all leading embedded IFE systems ̶ content available to multiple connectivity platforms x Airlines, cruise ships, away from home x 150+ customers across the globe x Most diverse range of service offerings x Global Eagle not a direct supplier to market dominated by Panasonic and Thales x Global Eagle content widely used in Panasonic and Thales systems around the world Source: Frost & Sullivan, July 2013; IMDC IFE Outlook 2012

8 Global Eagle Operates under Multiple Brands around the World Connectivity Content Wireless In - Flight Services & Entertainment WISE™

9 Strong Secular Tail Winds Support Industry Growth Global Aircraft Fleet Forecast (000s of main line aircraft) Global Passengers ( bn ) 15.2 12.0 12.0 18.9 3.2 6.9 2012 Retirement Deliveries 2017E Source : Seabury Group, IATA, Piper Jaffray 3.1 3.3 3.5 3.7 3.8 2013E 2014E 2015E 2016E 2017E

10 In - flight Entertainment Market Expected to Grow Rapidly Source: Frost & Sullivan, July 2013 Global Eagle Is a Leader in Content and Connectivity Segment $ 1.4 $ 1.5 $ 1.6 $ 1.8 $ 1.9 $ 2.1 $0.3 $0.3 $0.4 $0.4 $0.4 $0.4 $0.4 $0.6 $0.8 $ 1.0 $ 1.3 $ 1.7 $ 2.1 $ 2.4 $ 2.8 $ 3.2 $ 3.6 $ 4.0 2012 2013E 2014E 2015E 2016E 2017E Hardware Content Connectivity Worldwide IFE market ($ billions) Global Eagle addressable market >$2.0B
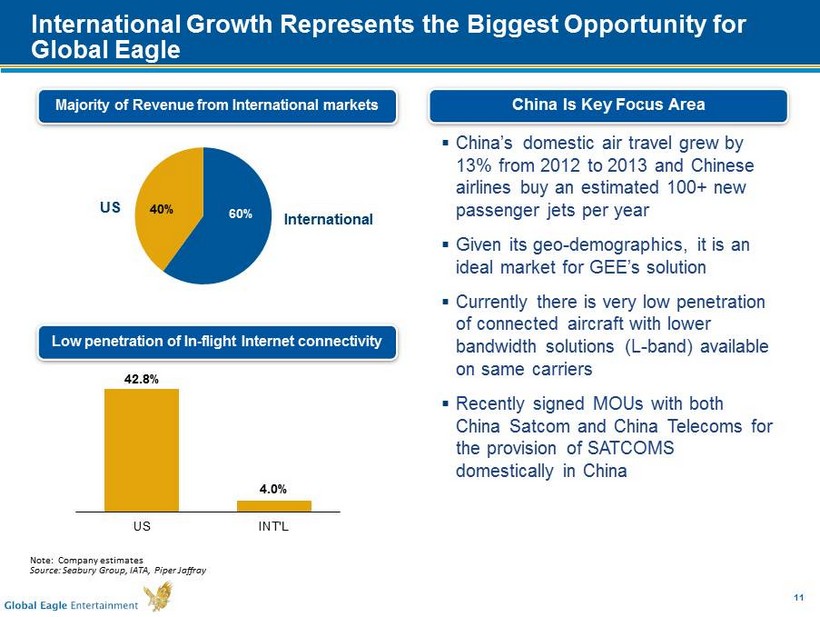
11 International Growth Represents the Biggest Opportunity for Global Eagle China Is Key Focus Area Note: Company estimates Source: Seabury Group, IATA, Piper Jaffray Majority of Revenue from International markets Low penetration of In - flight Internet connectivity 42.8% 4.0% US INT'L 60% 40% International US ▪ China’s domestic air travel grew by 13% from 2012 to 2013 and Chinese airlines buy an estimated 100+ new passenger jets per year ▪ Given its geo - demographics, it is an ideal market for GEE’s solution ▪ Currently there is very low penetration of connected aircraft with lower bandwidth solutions (L - band) available on same carriers ▪ Recently signed MOUs with both China Satcom and China Telecoms for the provision of SATCOMS domestically in China

12 LIVE TV ▪ DISH sponsors LIVE TV offering on Southwest Airlines DESTINATION DEALS ▪ Working with partners to provide exclusive in - air offers (experiences, restaurant bookings & more) SPONSORED SHOPPING ▪ Working with a global brand about sponsoring a unique shopping experience MUSIC ▪ In talks with a leading digital music service provider to sponsor onboard music Changing the Business Model Through Sponsorships Business model includes delivering content to passengers by working with sponsors to fund Live TV and online portal offerings Sponsor Discussions Underway Sponsor Discussions Underway Sponsor Identified

13 ▪ Par Capital Strong Management Team and Board of Directors ▪ Former CFO of US Airways and Northwest Airlines ▪ Former Senior Managing Director of Perseus LLC Dave Davis Chief Financial Officer ▪ Former CEO of Row 44 ▪ Successful technology and entrepreneurial history: TelASIC , Kotura , Stamps.com John LaValle Chief Executive Officer ▪ Former SVP, Legal Affairs of Fox Entertainment Group ▪ Former Head of M&A for Vivendi Universal Jay Itzkowitz General Counsel ▪ Co - founder of Row 44 ▪ Co - founder of ComCore Semiconductor ▪ Marconi Space and Defense Systems, Litton John Guidon CTO & co - founder ▪ Adidas Group ▪ Telegate AG Wolfgang Brand CEO – AIA ▪ Founder of IMDC ▪ Interim turnaround executive at Royal Brunei Airways, Thermal Engineering ▪ VP Strategy, Spafax and Aspen Group Wale Adepoju COO – AIA Ed Shapiro Chairman of the Board Management Board of Directors ▪ Founder of SBS Broadcasting ▪ Former Chairman and CEO of MGM Studios Harry Sloan Director ▪ Former Co - President of Sony Pictures Entertainment ▪ Former CEO of Paxson Comms Jeff Sagansky Director ▪ Founder of DTI Software ▪ Former CEO of AIA Louis Belanger - Martin Vice Chairman ▪ Operating Partner at Bessemer Venture Partners ▪ Former CFO of Oracle Corporation Jeff Epstein Director ▪ CEO of Hughes Telematics ▪ Former CEO of Sky Terra Communications Jeff Leddy Director ▪ Former EVP of Operations of American Airlines ▪ Former CEO of Reno Air Bob Reding Director

Content Solutions

15 ▪ Post - production services making content usable for airlines ▪ Services include subtitles, editing, encoding, duplicating, integrating, reformatting, voice - over, customizing ▪ Video and audio content from worldwide sources delivered in 47 languages on 12 different IFE platforms ▪ Exclusive representative for 60 airlines ▪ Exclusive airline distributor of Lionsgate / Summit and other independent movie products for 100 airlines ▪ Distributor of Asian, Bollywood, European and Middle Eastern content to airlines ▪ Licensing of over 24 Chinese movies and 50 Hollywood titles a year ▪ Largest market share in in - flight gaming content (180 game titles) ▪ Original content creator ▪ Wise software platform offers streaming WiFi VoD / AoD on multiple platforms ▪ Leader in paperless cabin ( eMeal menu, eDuty Free, eReader , eSurvey , World Traveler) Global Eagle Offers the Most Diverse Content Offering Original Apps & Games Licensing Content Services

16 Extensive Global Customer Base of Leading Airlines Studios International Studios (Asia, Bollywood , Europe, Middle East, French, Latino) Independents Customers We Sell To (~70 ) Others (~120 ) Customers We Represent (~60 ) Games / Apps Represent Airlines in Procuring Content Distributes Content to Airlines

17 Market Share Estimate 1 ~65% ~15% ~5% ~5% Shareholders ▪ Publicly traded (NASDAQ: ENT ) ▪ Greenhill Capital Partners ▪ WPP Group ▪ Management Considerations ▪ Only IFE one stop shop to airlines ▪ Only industry player supporting all major hardware environments (more than 40) ▪ Strong recurring revenue base ▪ World - class technical capabilities ▪ Content provider to cruise ships ▪ Best vehicle for industry consolidation ▪ Present in developing markets such as Africa, S. America and focus on secondary airlines in Europe ▪ In - house advertising division – Spafax has strong custom - publishing department ▪ Large global footprint ▪ Second to GEE in apps and technical services (e.g. labs) ▪ Asia focused business with presence in Malaysia, Indonesia and Australia Competitors and Potential Partners Competitors Global Eagle Entertainment 1 Source: IMDC , September 2013
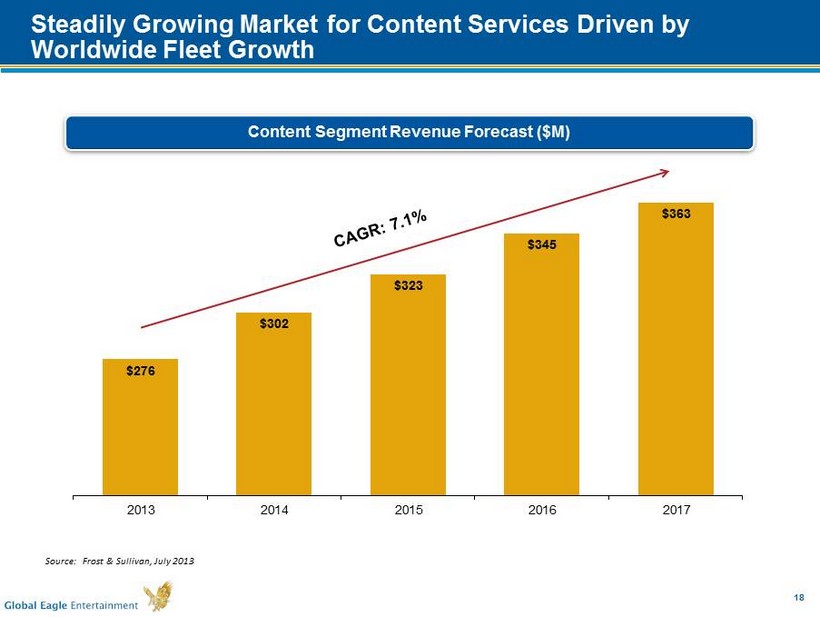
18 $276 $302 $323 $345 $363 $200 $220 $240 $260 $280 $300 $320 $340 $360 $380 2013 2014 2015 2016 2017 Steadily Growing Market for Content Services Driven by Worldwide Fleet Growth Source: Frost & Sullivan, July 2013 Content Segment Revenue Forecast ($M)

Connectivity Products and Services

20 Superior Product and Technology P latform Ku band is the best connectivity solution for the foreseeable future Airborne Network: Ubiquitous, Scalable, Global Platform ▪ Leading provider of in - flight Internet connectivity that can cover both land and sea ▪ Ku - band technology provides high speed broadband internet via a flexible and scalable satellite platform ▪ Exclusive relationship with Hughes in North America In - flight Connectivity

21 Ku band is the Best C onnectivity S olution for the Foreseeable F uture Type of Technology Ku L - band Ka Air - to - Ground Coverage Bandwidth Broadcast - - - Expansion ability Ku band is the best connectivity solution for the foreseeable future

22 Largest Deployed Fleet of Satellite - Based Connectivity Systems ▪ 431 Installations / 626 total orders ▪ 1 installed, 17 total orders ▪ 60 Installations / 84 total orders (potential additional 220 orders) ▪ 2 installations, 9 orders (potential additional 15 orders) ▪ 22 orders Current Fleet of Customer Aircraft (500 Installations) ▪ 6 installations

23 Leader in Connected Content Delivery Connectivity Portal Live TV and VoD Internet Connectivity Shopping Advertising Destination Deals Texting Games and Music ▪ Global Eagle network provides live IPTV streamed to passenger devices ▪ Currently 14 channels with Additional 3 coming in Q4 2013 ▪ Global brands we have licensed content from include ▪ New portal set to launch with improved advertising features, increased destination info, and updated look & feel ▪ High value advertising avails (video, display, and more) uniquely allow us to promote brands to a captive audience ▪ Working on a US/global deal to bring a unique shopping platform to the sky ▪ Working with key partners to offer exclusive deals ▪ New product offering with high expected adoption and low bandwidth usage ▪ Global music brand expected to be announced as onboard sponsor
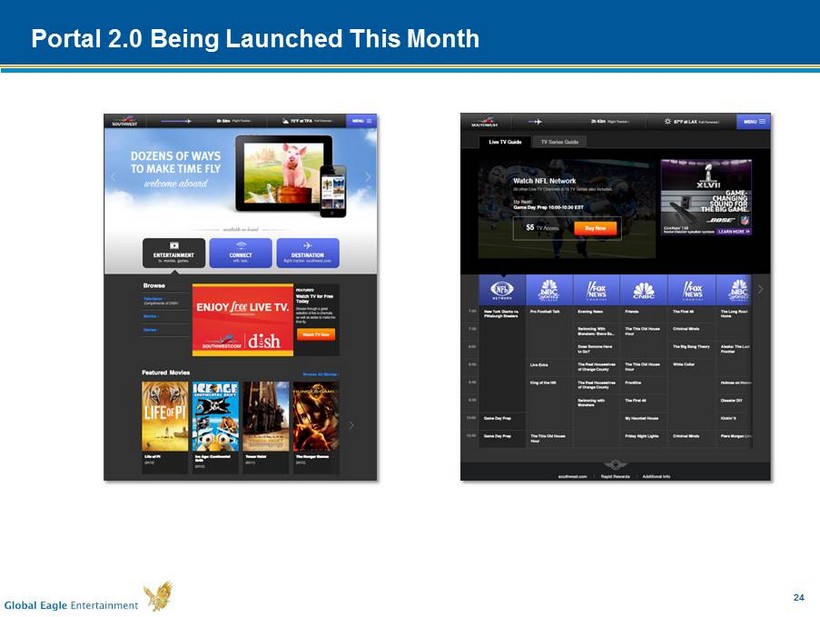
24 Portal 2.0 Being Launched This Month

25 WISE Application ▪ An end - to - end wireless IFE content and software solution ▪ Easy - to - use portal is activated via the aircraft’s Wi - Fi system where passengers can watch movies, listen to music, play video games, read digital publications and much more on their PEDs ▪ Sold to airline clients through third party hardware partners and is hardware agnostic ▪ The following partners have chosen WISE: • OnAir , Airbus/KID System, Honeywell and three other manufacturers ▪ Multiple airlines have chosen WISE and deliveries will begin in Q1 ‘14 WISE is approved by all major Hollywood studios for secured AVOD streaming of movies and TV programs Wireless In - Flight Services & Entertainment WISE™

26 Major Industry Players Platform Ku - band Ku - band Air - to - Ground Ka - band L - band Installations Satellite ~500 105 Ku - band 161 L - band N/A - 271 Land based N/A N/A 1,707 N/A Shareholders ▪ Publicly traded (NASDAQ: ENT ) ▪ Par Capital ▪ Publicly traded ▪ Publicly traded ▪ Ripplewood Investments LLC ▪ Oakleigh Thorne ▪ JetBlue ▪ SITA Competitors GEE

27 $630 $838 $1,046 $1,269 $1,495 $0 $200 $400 $600 $800 $1,000 $1,200 $1,400 $1,600 2013 2014 2015 2016 2017 Demand for Connectivity Expected to Grow Rapidly Source: Frost & Sullivan, July 2013 Connectivity Segment Revenue Forecast ($M)

Financial Overview

29 Source of Revenue Content and Connectivity Business Segments Connectivity Content Note: Q2 revenue figures exclude PMG results as acquisition closed in July, 2013 Two Business Segments Q2 Revenue: $44.1 million Q2 Contribution profit: $11.2 million Licensing ▪ Sale or license of media content, video and music programming, applications, and video games ▪ Q2’13 Revenue: $38.4 million ▪ WISE application ▪ Q2 ‘13 Revenue: N/A Services ▪ Technical services such as encoding and editing of media content ▪ Q2’13 Revenue: $5.7 million ▪ Wi - Fi, TV, VoD, shopping and travel - related revenue ▪ Q2’13 Revenue: $12.4 million Services ▪ N/A ▪ Sale of satellite - based connectivity equipment ▪ Q2’13 Revenue: $6.4 million Q2 Revenue: $18.8 million Q2 Contribution profit: $1.8 million

30 Attractive and Scalable Business Model Original Apps & Games Content Services Licensing Service features ▪ IFE Games, IFE Applications, closed - system portal - WISE ▪ Movie, TV, Audio, Creative, Supply chain management for Airlines ▪ Content rights management and distribution Top customers ▪ Singapore Air, Qatar Airways, Etihad Airways, Panasonic, Thales ▪ Qatar Airways, AA, KLM/AF ▪ Spafax ▪ IFE Services Summary of business model ▪ Games: Per game/plane/month is standard revenue model ▪ A few airlines have flat fee / fleet ▪ Some low - cost airlines are moving to a pay - per - play or PPA model ▪ Acquire license for developed games (EA, PopCap …) ▪ Games s ell direct to airlines ▪ Panasonic and Thales sell DTI applications ▪ Service fee for content management, supply chain management, consulting and creative services ▪ TV – Flat fee to airline, per title/per month ▪ Movies – fee per title/flight. Usually pass through ▪ IFP has a flat deal with Fox and Warner ▪ Technical fees for post - production. ▪ Sale to CSPs or airlines directly at $/title/flight ▪ EIM & EVE pay a min guarantee per title ▪ Fairdeal pays fees to Bollywood studio. Sells to CSP/airline at a flat monthly fee ▪ Technical fees for post - production. Content

31 Attractive and Scalable Business Model Internet Equipment Portal Live TV VoD / AoD Service features ▪ In - flight Internet access for passengers on commercial airlines ▪ Equipment for installation on aircrafts to connect to satellites ▪ Entry to select websites and shopping portals ▪ Games ▪ Texting ▪ Live stream television service for passengers on commercial airlines ▪ On - demand movies, music and other video content for passengers on commercial airlines Revenue model ▪ Fixed fee per boarded passenger ▪ Fixed fee per connections ▪ Per plane / per month ▪ Cost plus margin ▪ Advertising ▪ Sponsorships ▪ Revenue share (% of purchases on allowed sites) ▪ Texting – fee for usage ▪ Fee per boarded passenger ▪ Revenue share ▪ Sponsorships ▪ Sponsorships ▪ Fee per boarded passenger ▪ Revenue share (for activation) Cost structure ▪ Satellite bandwidth ▪ Cost for equipment ▪ Content costs ▪ Satellite bandwidth ▪ TV content costs ▪ Satellite bandwidth ▪ Video or music content costs ▪ Satellite bandwidth Customer base ▪ Southwest, Norwegian Air, Shuttle (NAS), IcelandAir , Transaero , UT Air ▪ Southwest, NAS, IcelandAir , Transaero , UTAir , Mango, L3 ▪ Southwest, NAS ▪ Southwest ▪ Southwest, NAS Connectivity

32 ▪ Sequential quarterly growth in Adjusted EBITDA ▪ Connectivity contribution margins up, driven by increasing revenue and reduced bandwidth costs ▪ Delivering connectivity to ~500 planes worldwide ▪ $110 million in cash and minimal debt at end of Q2 ‘13 ▪ Wi - Fi takes rates consistent Key Metrics Product Rollout PMG Acquisition ▪ Live TV product on Southwest sponsored by Dish ▪ Added 3 new channels Q2 and on track to offer full array of additional channels in Fall ▪ WISE AVOD software platform selected by major hardware integrators with first deliveries expected in Q1 ‘14 ▪ Partnership with both China Telecom and China Satellite Communications Company ▪ Portal 2.0 being launched this month ▪ E xpands scope of content offerings and adds new airline customers ▪ Provides entry into adjacent markets including cruise ships ▪ Highly accretive - stand - alone EBITDA ~$4.5 in full year 2013 ▪ Expect greater than $2.0 million in annual run rate synergies Solid Execution of Strategic Priorities

33 Q2 Revenue Adjusted EBITDA Strong Business and Financial Momentum Q2’13 Revenue by business Q2’13 Contribution by business Connectivity Content Connectivity Content Note: Contribution is defined as total revenue less cost of revenue Equipment Service ($mil) Q2’13 Connectivity $18.7 Content $44.1 ($mil) Q2’13 Connectivity $1.8 Content $11.2 14% 86% 30% 70% $0.0 $1.4 Q1 '13 Q2 '13 $6.3 $5.7 $12.4 $38.4 Connectivity Content $18.7 $44.1 Licensing Service

34 Investment Thesis ▪ Leading supplier to rapidly growing In - flight Entertainment and Connectivity (“IFE&C”) media market ▪ Segments served by Global Eagle expected to grow by nearly 20% 1 annually through 2018 ▪ Global Eagle growing organically and through acquisitions with first deal closed in Q3 2013 ▪ Global customer base serving 150+ airlines worldwide best positions company to capture share in fastest - growing international markets ▪ Best - in - class technology and product offering ▪ Strong Management Team and Board of Directors with deep airline, media, and technology backgrounds 1 Source: Frost and Sullivan, July 2013

Appendix

36 Reconciliation of Adjusted EBITDA Reconciliations of Non-GAAP Measures to Unaudited Consolidated Statements of Operations Adjusted EBITDA: Three months ended March 31, 2013 Three months ended June 30, 2013 Six months ended June 30, 2013 Net loss $ (27,021) $ (13,029) $ (40,050) Income tax expense/(benefit) 34 559 593 Other income (expense) (1) 4,835 4,994 9,829 Depreciation and amortization 4,702 6,977 11,679 Stock-based compensation (2) 1,647 880 2,528 Acquisition and realignment costs (3) 12,752 1,594 14,346 F/X gain (loss) on intercompany loan (4) 1,378 (533) 845 Adjusted EBITDA $ (1,673) $ 1,443 $ (230) Pro-forma Adjustments January 2013 GEAC Pre-tax loss (22,100) (22,116) January 2013 AIA Pre-tax income 1,306 1,306 Add back: - January 2013 GEAC Other income (expense) 11,697 11,697 January 2013 GEAC Business Combination Fees and Expenses (5) 10,243 10,243 January 2013 AIA & GEAC Interest expense (income) 66 66 January 2013 AIA & GEAC Depreciation and amortization 471 471 Pro-forma Adjusted EBITDA $ (6) $ 1,443 $ 1,437

37 Non - GAAP Financial Measures About Non - GAAP Financial Measures To supplement our consolidated financial statements, which are prepared and presented in accordance with accounting principle s generally accepted in the United States of America (“ GAAP ”), we use Adjusted EBITDA, which is a non - GAAP financial measure. The presentation of Adjusted EBITDA is not intended to be considered in isolation or as a substitute for, or superior to, the fin anc ial information prepared and presented in accordance with GAAP . For more information on this non - GAAP financial measure, please see the tables captioned “Reconciliation of Adjusted EBITDA to Net Loss” included at the end of this release. Adjusted EBITDA is the primary measure used by the Company's management and board of directors to understand and evaluate its financial performance and operating trends, including period to period comparisons, to prepare and approve its annual budget and to develop short and long term operational plans. Additionally, Adjusted EBITDA is the primary measure used by the compensation committee of the Company's board of directors to establish the funding targets for and fund its annual bonus pool for the Com pan y's employees and executives. We believe our presentation of Adjusted EBITDA is useful to investors both because (1) it allows fo r g reater transparency with respect to key metrics used by management in its financial and operational decision - making and (2) management frequently uses it in its discussions with investors, commercial bankers, securities analysts and other users of its financia l s tatements. We define Adjusted EBITDA as net income (loss) before income tax expense, other income (expense), interest expense (income), depreciation and amortization, stock - based compensation, acquisition and realignment costs, F/X gain (loss) on intercompany loan s and any gains or losses on certain asset sales or dispositions. Acquisition and realignment costs include such items, when applic abl e, as (1) legal, accounting and other professional fees directly attributable to acquisition activity, (2) employee severance payments att ributable to acquisition or corporate realignment activities, and (3) expenditures related to the business combination in January 2013. M ana gement does not consider these expenses to be indicative of the Company's ongoing operating results or future outlook. With respect to projected PMG Adjusted EBITDA for 2013, a quantitative reconciliation is not available without unreasonable e ffo rts, and we are unable to address the probable significance of the unavailable information. .